the Creative Commons Attribution 4.0 License.
the Creative Commons Attribution 4.0 License.
 | 16 Mar 2026
Constraining the wavefield of volcano-seismic events on Mt. Etna, Italy through a rotational sensor and seismic array observations
Nele Inken Käte Vesely
Eva Patricia Silke Eibl
Gilda Currenti
Mariangela Sciotto
Giuseppe Di Grazia
Matthias Ohrnberger
Philippe Jousset
Long-period (LP) events and tremor are characteristic seismic signals of active volcanoes, offering insight into underlying fluid-driven processes. However, their emergent wavefield is complex and challenging to characterise. Here we decipher the LP event and tremor wavefield composition using a seismic array combined with a rotational sensor co-located with a seismometer (6C station). This study analyses and compares directional and phase velocity estimates by processing a 25 d long dataset from a rotational sensor and an array of seven broadband stations deployed at Mt. Etna, Italy, in August–September 2019. We derive the back azimuths (BAz) of LP events and tremor from both the seismometer array and the 6C station, and we compare these estimates with a reference BAz obtained from the network locations from the Istituto Nazionale di Geofisica e Vulcanologia-Osservatorio Etneo (INGV-OE) on Mt. Etna.
Volcanic tremor occurs in distinct phases with varying seismic and surface activity. Depending on the phase, either the array or the 6C method provides reliable tremor BAz estimates, agreeing well with the INGV-OE reference. We find that BAz estimates of both methods are shifted southward relative to the reference location for the LP events. We attribute the larger southward deviation observed in the 6C results to local heterogeneities which exert a stronger influence on the 6C station than on the array.
Based on the array derived slownesses we infer that the tremor and LP events mainly consist of surface waves. Further, the rotational sensor recordings suggest a wavefield dominated by SH-type waves. In combination with the observed temporal evolution of the 6C phase velocity in narrow frequency bands, we infer Love-wave dominance. This study highlights the value of a rotational sensor to constrain the wavefield in a deterministic way in a complex volcanic environment.
- Article
(13131 KB) - Full-text XML
-
Supplement
(10077 KB) - BibTeX
- EndNote


Volcanic tremor often marks the build-up to, and accompanies eruptive activity (McNutt, 2002; Zuccarello et al., 2022). At many volcanos, tremor is closely correlated with explosive phenomena such as paroxysms, and lava fountaining (Zobin, 2017). Tremor is characterized as an emergent, continuous signal lasting minutes to days, typically with peak power in the 1 to 5 Hz range, though this varies between volcanic systems (McNutt, 2002). Another class of typically observed volcano-seismic signal are long-period (LP) events which exhibit dominant frequencies from 0.5 to 5 Hz (Chouet and Matoza, 2013). Variations in LP event frequency have been attributed to property changes in the resonating conduit (Jousset et al., 2003). Unlike tremor, LP events can sometimes show a clear onset of the P-wave arrival (Chouet, 2009). However, transitions in which LP events merge into tremor have been observed for Soufrière Hills volcano in Montserrat (Neuberg et al., 2000). Different network-based location approaches to handle LP events and volcanic tremor exist (e.g. Battaglia et al., 2003; Di Grazia et al., 2006; De Barros et al., 2009; Cannata et al., 2010; Soubestre et al., 2019). The wavefield of those event types is complex and the detailed composition of wave types often remains unclear due to a lack of observations at appropriately sized arrays or 6C recordings.
Conventional seismometer networks record unrest on volcanoes. However, to detect weak volcano-seismic signals, smaller, denser aperture networks as arrays are more suitable (Chouet, 1996b; Wassermann, 1997; Saccorotti et al., 2001). Arrays, originally set up in the 1960s to detect nuclear tests (Douglas, 2002), have since become a key tool for studying the Earth's structure and exploring volcanic activity (Rost and Thomas, 2002). These seismic arrays consist of multiple seismometers placed at small station spacings, ranging from a few tens to hundreds meters. An incoming wave is recorded coherently on all seismometers within a frequency range that depends on the station spacing and the seismic ground velocities (McNutt, 2002). In such a set-up the ground motion along three orthogonal axes is measured. Weak or emergent signals can then be detected more easily by stacking data. Information about the wavefield can be gathered, migrating sources tracked and source directions or incidence angles determined (McNutt, 2002; Rost and Thomas, 2002). Seismic arrays are advantageous for exploring volcanic tremor (Chouet, 1988, 1996a; Ferrazzini et al., 1991).
Arrays have been used to locate (Métaxian et al., 2002; Chouet, 2003) and distinguish tremor wave-types (Saccorotti et al., 2004), track migrating tremor sources (Eibl et al., 2017b, 2020; Zuccarello et al., 2022; Eibl et al., 2023) and differentiate between different simultaneously recorded tremor signals (Eibl et al., 2017a) or between tremor and long-period event sources (Almendros et al., 2014). Long-period seismicity can likewise be analysed by arrays (Almendros et al., 2001; Chouet, 2003). Even though arrays enable a better understanding of the wavefield and volcanic structures, their installation and maintenance is challenging and costly in volcanic settings which are mostly difficult to access or do not permit specific array geometries. The performance depends on the operation of all seismometer stations. In case of station failure, the array geometry, aperture and thus sensitivity to a certain frequency range changes (Wassermann et al., 2016).
If space is limited or the site is difficult to access, rotational sensors might offer an alternative to seismic arrays (Cochard et al., 2006). In recent years, portable rotational sensors have become available allowing the recording of the full rotational wavefield with high resolution around three orthogonal directions. These fibre optic gyroscopes can be co-located with a seismometer to measure six degrees of freedom: three translations and three rotations (6C station). Such a six component (6C) station requires less installation effort and maintenance compared to a multiple station array, while being able to separate the wavefield and calculate directions of arriving signals. Processing techniques with 6C measurements (Hadziioannou et al., 2012; Wassermann et al., 2020) aim at providing the same information as normally obtained by a multi-station array (Cochard et al., 2006; Brotzer et al., 2025). Various laboratory (Bernauer et al., 2018) and passive and active field experiments (Izgi et al., 2021, 2025) with rotational sensors have confirmed low self-noise, a broad frequency range and realistic event direction estimation. Experiments on volcanoes have been carried out on Kilauea (Wassermann et al., 2020), Stromboli (Wassermann et al., 2022) and Etna (Eibl et al., 2022a) which have shown great advances in wavefield analysis using 6C stations. Wassermann et al. (2022) were able to identify gas jetting events not detected by other instruments, leading to the build-up of a new vent on Stromboli volcano. Using a rotational sensor, Eibl et al. (2022a) have shown, that LP events at Mt. Etna mainly have a strongly polarized wavefield in the horizontal plane and are therefore composed of SH-type waves. The tremor wavefield is composed of SH-type waves in August and early September and features a mixed wavefield from 9 September until 13 September 2019 (Eibl et al., 2022a).
Keil et al. (2022) compared rotational sensor and array recordings of anthropogenic noise. Resulting P- and S-wave velocity profiles from arrays and the rotational sensor and co-located seismometer station were in agreement, thus confirming the suitability of using the 6C station approach. The self-noise of the rotational sensor was a major constraint for frequencies below 5 Hz. Bernauer et al. (2021) identified a lower frequency limitation of 4 Hz in the rotational sensor's response during their comparative study of various sensors used for measuring rotational motion. Recordings of rotation and rotation rate are furthermore stronger affected by local heterogeneities than displacement, velocity and acceleration recordings (Singh et al., 2019). Brotzer et al. (2025) compared a rotational sensor and seismic array with respect to signal-to-noise ratio (SNR) and back azimuth calculation of a local and a regional earthquake. Stations with downtime had an effect on the array derived rotation (ADR) in their study. In contrast, measurements obtained from a single rotational sensor are independent of inter-station geometry or availability, as they directly record ground rotations at a single point.
We investigate the performance of a 6C station in comparison to an array deployed at Etna volcano (Italy). We calculate back azimuths and phase velocities of LP event and tremor signals. The aim of this study is to test, whether the 6C approach provides reliable estimates of back azimuths and velocities compared with those obtained from a conventional seismic array, and whether these results are consistent with reference locations from the Istituto Nazionale di Geofisica e Vulcanologia–Osservatorio Etneo (INGV-OE) network. We briefly introduce the area of our study at Etna volcano, summarize the INGV-OE's network processing for localizing the long-period events and volcanic tremor and explain the rotational sensor and the array processing in Sect. 3. Results of the tremor and LP event back azimuth comparisons to the INGV-OE locations are presented in Sect. 4. An interpretation and discussion is given in Sect. 5 along with an explanation of limitations in this study. We conclude that a rotational sensor in combination with a seismic array can be used to decipher the wave types in a complex wavefield (Sect. 6).
Mount Etna is one of Europe's most active and visited volcanoes (Scarfì et al., 2023). This stratovolcano is located on the Italian island of Sicily (Fig. 1a) and is characterized by Strombolian activity, lava flows and fountains, as well as earthquakes. The volcanic and tectonic activity put the city of Catania, the villages and the touristic summit areas at risk (Currenti and Bonaccorso, 2019). Thus, understanding volcanic activity is undoubtedly important for mitigating hazard. Although fissure eruptions occur, the most frequent eruptive activity is concentrated in the main summit area within Bocca Nuova (BN), North East crater (NEC), Voragine (VOR), South East crater (SEC) and the New South East crater (NSEC), as illustrated in Fig. 1e.
From August to September 2019, a dense broadband array and a rotational sensor were installed in Piano delle Concazze on Mt. Etna (Currenti et al., 2021; Eibl et al., 2022a). Six 3C Trillium Compact 120 s seismometers (Nanometrics™) with DiGOS DATA-CUBE3 digitisers are used as a small aperture array where one of them is co-located with the rotational sensor (Fig. 1d). The inter-station distance is 60–90 m and the seven seismometers are buried at 40 cm depth in pyroclastic deposit (Currenti et al., 2021). Their maximum elevation difference is 10 m. One 3C blueSeis-3A rotational sensor RS1 (formerly: iXblue, now: exail) was co-located with the 3C Trillium Compact 120s seismometer named Bb17 as a 6C station (Fig. 1c) on the same quadratic, granitic plate and recording with a 200 Hz sample rate (Eibl et al., 2022a). In the recording time period, an eruption started on 4 September 2019 with weak ash emission at the NEC and VOR crater. Around two days later it was accompanied by Strombolian activity at the NEC and finally led to lava effusion from 18 September until around 21 September 2019 at VOR crater (Eibl et al., 2022a).
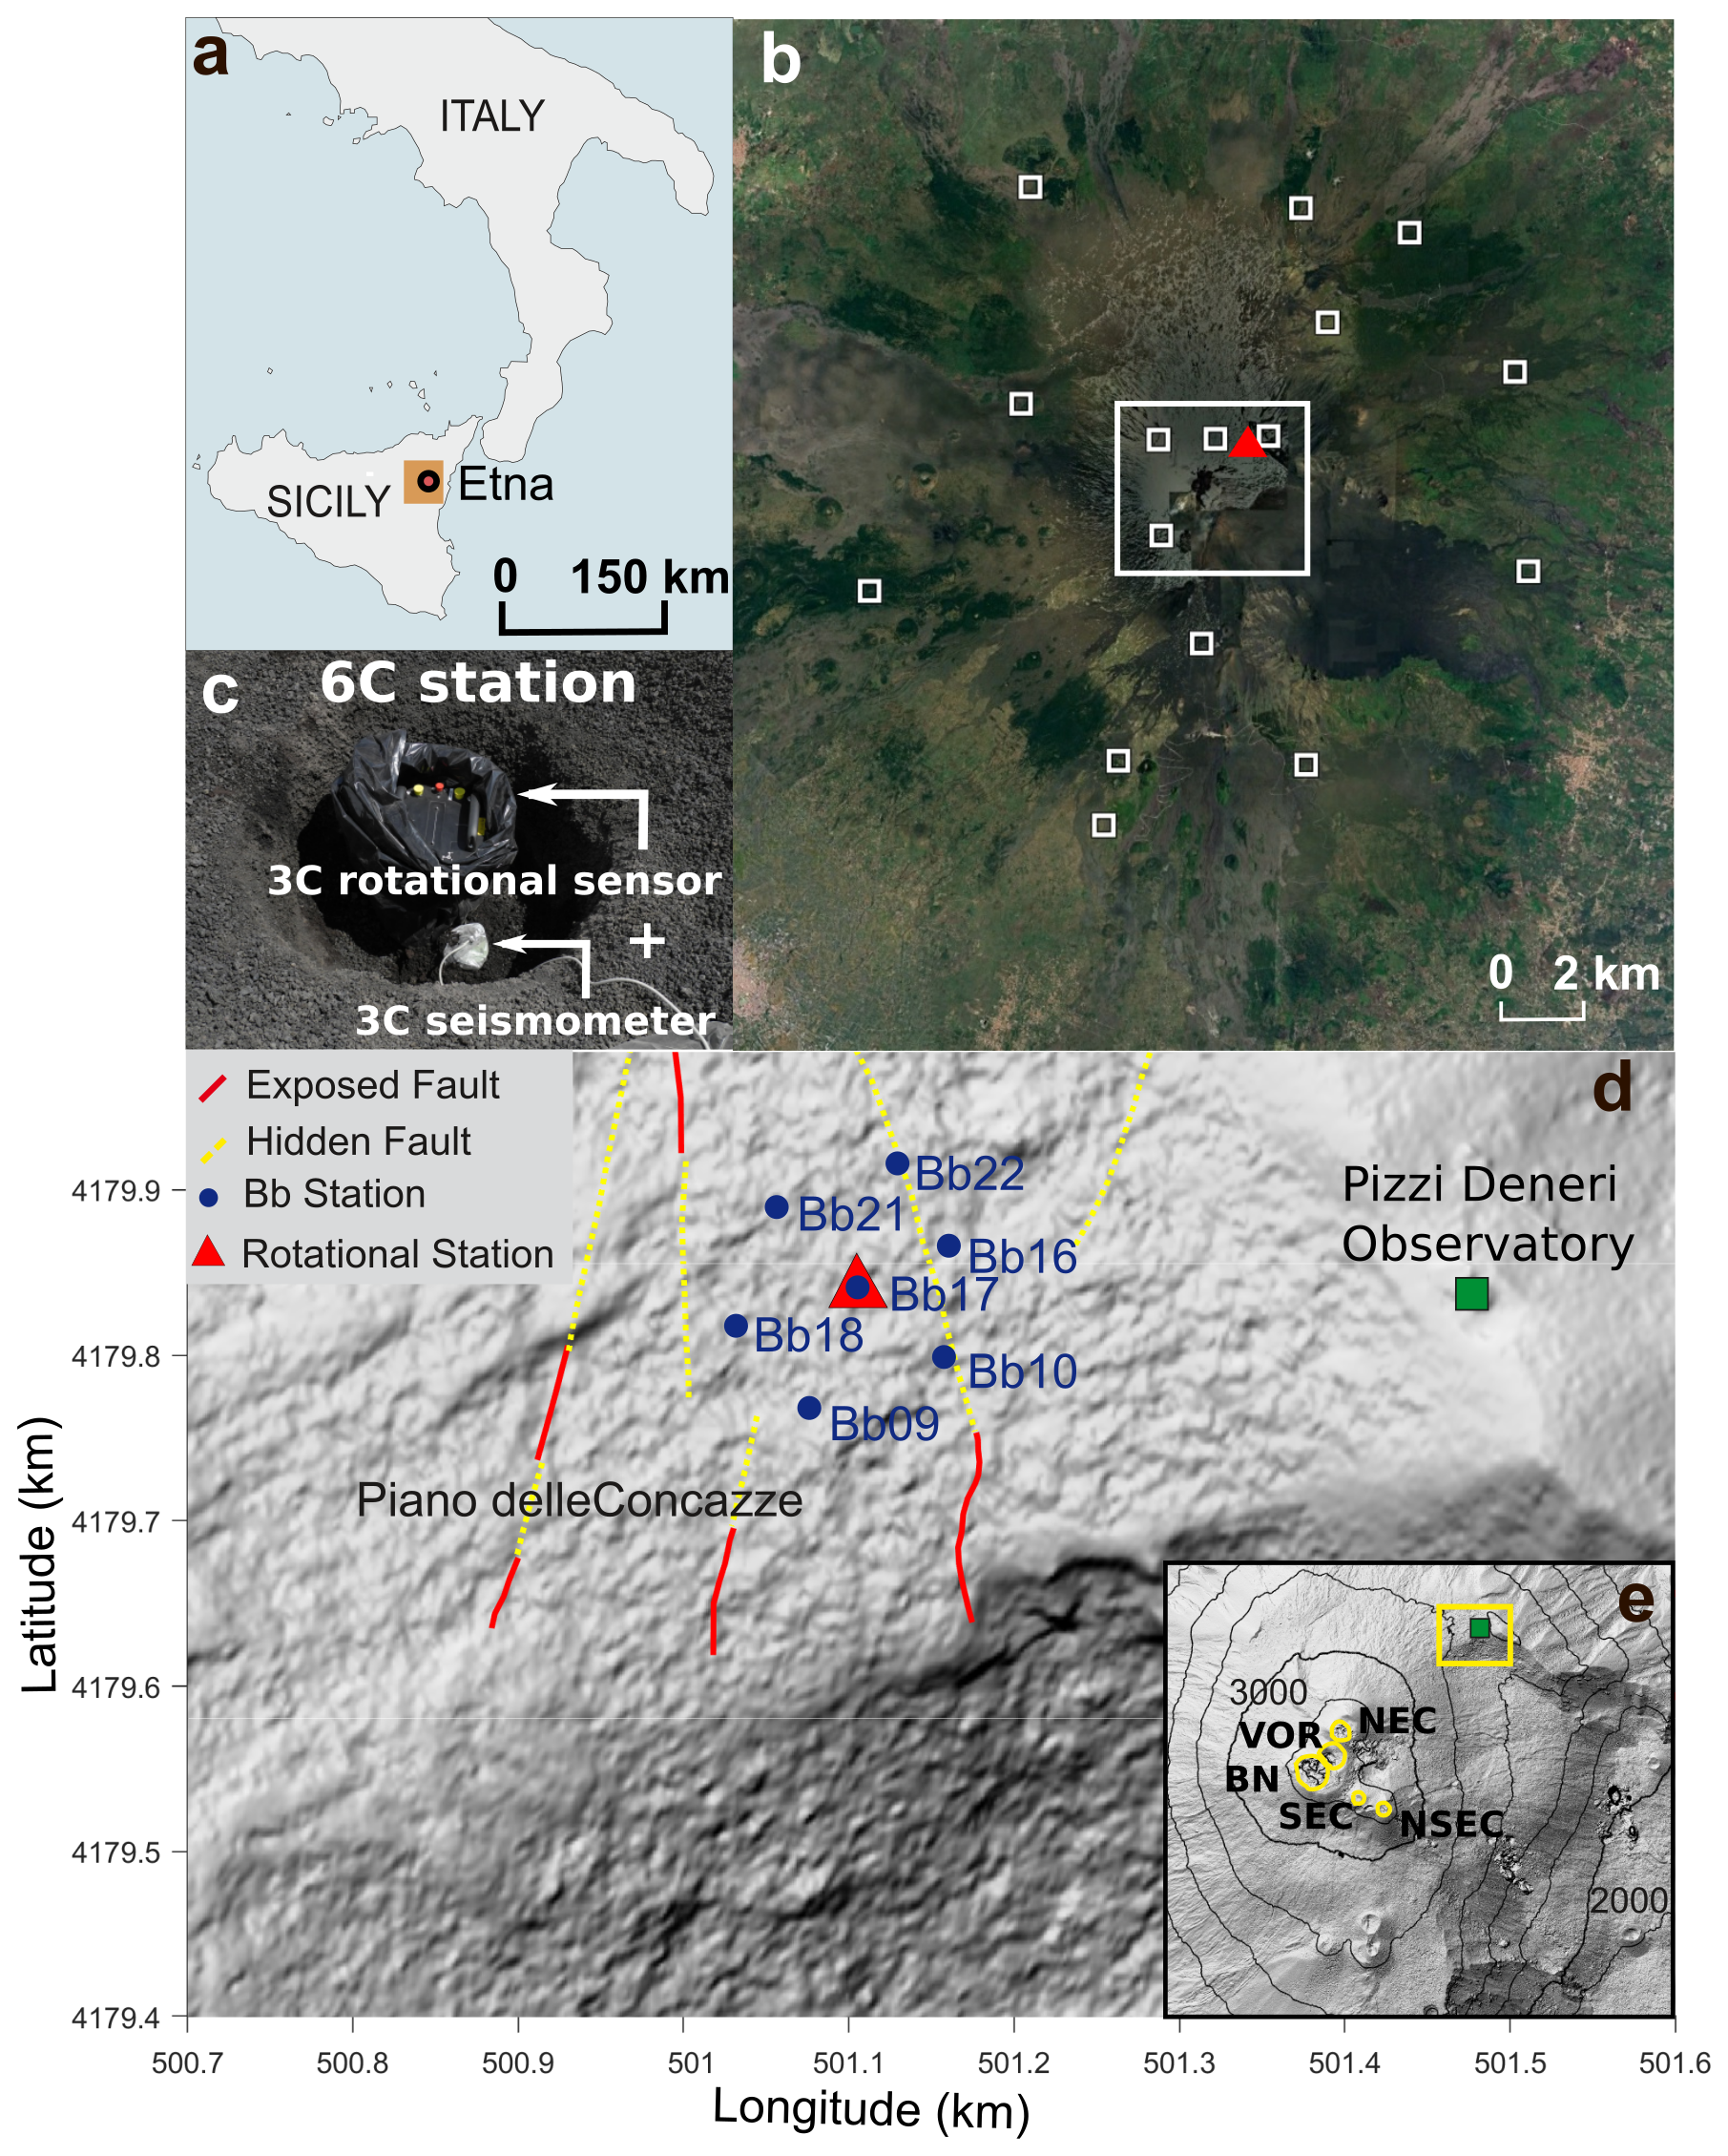
Figure 1Overview of the network set-up. (a) Etna volcano on Sicily, Italy. (b) Locations of 16 stations of the INGV-OE network around the main craters used for tremor processing (little white squares). Stations within the white frame box are used for the LP event detection. The red triangle indicates the rotational sensor station. Satellite imagery © 2019 Landsat/Copernicus, Map data © Google Earth Pro 2019. (c) Set-up of the 6C station. (d) Location of the array stations (blue dots), rotational sensor (red triangle) and faults (red and dotted yellow lines). (e) Summit crater locations (NEC: North East crater, VOR: Voragine, BN: Bocca Nuova, SEC: South East crater, NSEC: New South East crater).
3.1 Root mean square calculation and signal-to-noise ratio
The preprocessing steps include tapering and instrument correction for the seismometers. Then, a two-pole zero-phase Butterworth bandpass filter from 0.6 to 10 Hz is set for the array and from 0.6 to 1.4 Hz for the rotational sensor. For the tremor data the same steps are applied, but the data is filtered from 0.5 to 10 Hz for the seismometer and from 0.5 to 2.5 Hz for the rotational sensor. The tremor data is furthermore resampled from 200 to 50 Hz.
The root mean square (RMS) is a statistical measure to quantify the average signal (S) amplitude. The RMS value reflects the signal energy over a specific time period. It is calculated by squaring each signal value i, averaging these squares over all samples I, and then taking the square root:
The RMS of the long duration tremor is calculated with sliding windows of 30 min and 20 % overlap. For each LP event, we calculate the RMS within a 5 s time window containing the signal as well as the RMS within a visually confirmed 5-second noise window that starts prior to the signal window. Finally, we use these to calculate the signal-to-noise ratio (SNR) by:
The SNR indicates how well a signal is visible in comparison with the noise level. For all LP events the SNR is calculated for vertical component data. The LP event data are preprocessed using the ObsPy toolbox (Beyreuther et al., 2010).
3.2 INGV-OE network processing
We next describe the amplitude-based tremor localization method and the approach using the semblance for LP event localization. Both are implemented using INGV-OE seismic network data from August and September 2019.
The volcanic tremor source is routinely located using a subset of 16 permanent seismic network stations equipped with Trillium seismometers (Nanometrics™) operated by INGV-OE and installed at altitudes from 1200 to 3000 m within 10,km from the summit craters (Fig. 1b). The location procedure is based on the seismic amplitude decay method and implemented as a 3D grid search (Battaglia et al., 2005; Di Grazia et al., 2006; Cannata et al., 2013). The spatial grid is centred at the summit crater Voragine and extends horizontally 6×6 km and 3 km vertically with a node spacing of 250 m. Amplitudes are measured from the vertical component data of 30 min seismic signal windows. The data are Butterworth filtered (0.5–2.5 Hz) and used to fit the RMS amplitude to source-station distance. This step is performed for each working station and each node of the grid, that is iteratively assumed to be the source of the volcanic tremor. The goodness of the linear regression fit is represented by the value of R2, and the source is identified as the centroid of the grid nodes whose R2 values do not differ more than 1 % from the maximum R2 value (Di Grazia et al., 2006; Cannata et al., 2013). To obtain reliable solutions, thresholds of R2 goodness ≥0.9 and a minimum station number of 13 are set. An uncertainty of 500 m, based on Jackknife estimation (Efron, 1982), is assumed for each tremor location. The event location uncertainty can reach up to approximately 1 km in depth (Di Grazia et al., 2006; Cannata et al., 2018; Cannavo' et al., 2019).
For the location of the LP events, we consider a catalogue of amplitude transients with peak frequency in the spectral band 0.2–1.1 Hz detected and extracted from the continuous signal by means of the Short Time Average/Long Time Average (STA/LTA) energy algorithm (e.g.: Trnkoczy, 2012). The event source location method is based on the similarity among waveforms at the different stations on the particle motion of very long-period (VLP) events (Cannata et al., 2009). It is a grid search method (with the same grid used for volcanic tremor location) and implements, using the three components of the filtered signal, the radial semblance function (Cannata et al., 2013). The source is placed in the node of the grid characterized by the maximum semblance value. For this procedure, only summit stations are used, which in the time interval of the field campaign were only four (see the white frame box around the summit in Fig. 1b). To obtain robust locations, solutions with a radial semblance larger than 0.6 are considered reliable and locations outside the summit crater area are excluded. 371 LP events were detected and located during the field experiment. An uncertainty of 500 m for the LP event locations from INGV-OE is included in the analysis. We furthermore associate the lateral resolution to the radius of the first Fresnel volume calculated with an assumed velocity v of 1000 m−1 (Eibl et al., 2022a), 1 Hz frequency (f) and 500 m source depth (z) resulting in 500 m uncertainty r as the point distance (Yilmaz and Doherty, 2001):
Further parameter combinations for this calculation can be found in Supplement Table S1. All frequency, velocity and source depth combinations result in a mean uncertainty of 480 m; accordingly, we assume an uncertainty of approximately 500 m.
The back azimuth (BAz) of the incoming wavefront is defined as the angle between North and the direction to the epicentre from the station (Rost and Thomas, 2002). We calculate the INGV-OE back azimuth for LP events and tremor as the direction measured clockwise from North to the INGV-OE locations from the array centre point of view. This enables direction comparison with the array and 6C BAz estimates, as the back azimuth to the array and the rotational sensor respectively only differ by 0.02 to 0.05° around the main crater region.
3.3 Rotational sensor processing
SH-type waves are recorded on the vertical component of the rotational sensor and on the horizontal components of the seismometer. We therefore correlate the vertical rotation rate with the transverse acceleration for a given angle (Cochard et al., 2006; Hadziioannou et al., 2012; Izgi et al., 2021; Keil et al., 2022) and save the correlation coefficient. This procedure is repeated for all angles from 0 to 360°. Finally, the angle that yields the highest correlation between transverse acceleration and vertical rotation rate is assumed as the source back azimuth (Hadziioannou et al., 2012).
Dividing the transverse acceleration by the vertical rotation rate , assuming a transversely polarized plane wave with amplitude A, wavenumber k and phase velocity c propagating in x-direction, we obtain Eqs. (4) and (5). The ratio of and is constant and equal to −2c (Eq. 6).
The phase velocity is calculated from the RMS amplitude ratio of rotation rate and transverse acceleration motions for the angle that yields the highest correlation of the waveforms (Hadziioannou et al., 2012). We refer to this method as the 6C approach. First, we demean and detrend the data linearly and apply a cosine taper. We then use a bandpass zero phase filter with two corners. We calculate the BAz in steps of 1° and with a correlation coefficient threshold of 0.15. Uncertainties in back azimuth and phase velocity are quantified by reprocessing the data using shorter time windows. For each presented value we calculate the standard deviation from short-window results occurring within half the long-window before and after the timestamp.
Rotational sensor back azimuths for the tremor are derived in a frequency range of 0.5 to 2.5 Hz with sliding time windows of 30 min. For the uncertainty estimate we calculate the standard deviation of 0.5 min sliding time windows 15 min before and 15 min after each timestamp. We tested different LP event frequency ranges for the 6C processing and found the strongest BAz agreement with the reference in the 0.6–1.4 Hz range. We also compared our results to an INGV-OE catalogue in the same frequency range, which did not lead to high agreement between the back azimuth results, thus adhere to the initial 0.2–1.1 Hz INGV-OE catalogue. Sliding window length in this case relates to the minimum frequency of interest. We choose a window length of three times the corresponding signal period at 0.6 Hz, thus 5 s with 90 % overlap. For every LP event we obtain one back azimuth value and one phase velocity value by selecting the time of highest correlation between the vertical component of the rotational sensor and the rotated horizontal (transverse) components of the co-located seismometer Bb17 within the manually selected event time by the Pyrocko seismogram workbench (Heimann et al., 2017). For those results we calculate the standard deviation from shorter time windows (99 % overlap).
3.4 Array analysis
Plane wave parameters are estimated from array data by a standard band-limited slowness power spectrum analysis in the frequency domain. For this purpose we maximize the beam power BP, computed as:
for slowness vectors in a slowness grid in the horizontal plane of wave propagation. In Eq. (7), Xn(mΔf) represents the Fourier coefficient for the observed signal at station n at position rn and discrete frequency mΔf. The shifted signals are summed over the total number of array stations N. The squared sum of the stacked signals is then further summed over the frequency band from the lowest (m1) and highest frequencies (m2) of interest. represents the frequency resolution of the Fourier transformed signal of length T.
The slowness vector corresponding to the maximum power in the map points to the propagation direction of the best fitting plane wave and its absolute value indicates the inverse of its apparent velocity (Wassermann, 1997). The horizontal slowness and back azimuth from azimuth Ψ can be obtained from the components of the slowness vector (Chouet et al., 1997; Beyreuther et al., 2010) as:
and
For details we refer to Buttkus (2000), Rost and Thomas (2002) and Schweitzer et al. (2012).
We perform array processing from 24 August to 14 September 2019 on tremor signal with the vertical component seismometer data. Unlike the horizontal components, the vertical components are not expected to be strongly influenced by topography, tilt (Wassermann, 1997) or misalignment with geographical north. The slowness grid boundaries are defined to ±3 s km−1 with a step size of 0.01 s km−1. A frequency range from 0.5 to 10 Hz was selected, as the tremor signal is strongest from 1 to 5 Hz (Supplement Fig. S1), but the array response shows best directional sensitivity with low power side lobes from 0.6 to 10 Hz (Fig. S2). We furthermore want to distinguish between noise and signal and chose a broader frequency range. We downsample the tremor data from 200 to 50 Hz after applying a lowpass filter of 20 Hz to avoid aliasing and process 30 min sliding windows that have no overlap to compare with the INGV-OE results as in Eibl et al. (2022a). Uncertainties for the 30 min back azimuth and slowness results within the array processing are obtained from the standard deviation of 0.5 min sliding time window results (Fig. S3c–f).
For analysing 371 LP events the same slowness grid was used. A sliding time window of 5 s and 90 % overlap, as suggested in Eibl et al. (2022a), is applied. Results are displayed in the centre of the sliding window of 5 s which shifts by 0.5 s during each iteration. Although the highest LP event amplitude is expected from 0.6 to 1.4 Hz by the spectrogram and power spectral density (PSD) analysis (Figs. S4, S5, S6), we apply a maximum frequency of 10 Hz for the array processing according to the aperture of the array (Fig. S2) and a minimum frequency of 0.6 Hz due to poor resolution at lower frequencies similar to Zuccarello et al. (2016). The event signal's frequency content is expected to dominate the recording, while noise before and after spans a broader frequency range. Therefore, we can compare with the 6C results. For comparison with the rotational sensor and the routine monitoring locations by INGV-OE, we take the back azimuths during the LP event based on the manually selected event time picks in the Pyrocko seismogram workbench (Heimann et al., 2017). For every LP event, the BAz and slowness value is taken from the time of maximum relative power (semblance) within the time window of the event. As a result, we obtain one back azimuth and slowness value for each event. The associated uncertainties are derived from the standard deviation calculated over results from sliding time windows with higher overlap of 0.99, analogous to the 6C-method. LP event result uncertainties were additionally quantified through Monte Carlo simulations combining fixed parameters such as station geometry and frequency range, together with variable parameters including noise level and inter-station time errors. Repeating these simulations produces a distribution of estimated slowness vectors, from which uncertainties can be assessed and one-sigma confidence ellipses calculated (Fig. S7).
4.1 Volcanic tremor analysis
4.1.1 Volcanic activity, tremor amplitude and location
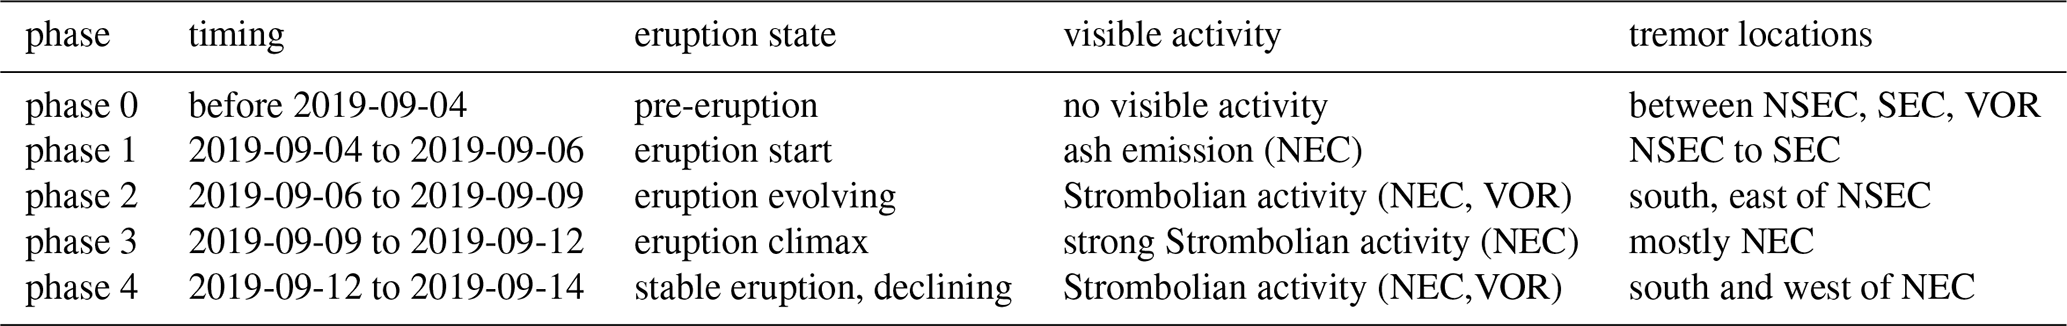
We use the observed volcanic activity described by Eibl et al. (2022a) to define eruption phases (Table 1). We then attribute the INGV-OE tremor locations (Fig. 2) to these phases. Prior to the first observed activity, during phase 0 tremor was located around NSEC, SEC and reaching towards VOR crater (white circles in Fig. 2). From 4 September 2019, weak ash emission was noted. Until 6 September 2019 locations during this phase 1 activity cluster around SEC and mostly NSEC. During phase 2 (yellow circles in Fig. 2), the INGV-OE detected Strombolian activity and tremor east of NSEC, with some locations further north. Strong Strombolian activity was observed from 9 until 12 September (red circles in Fig. 2). Locations during these days spread between an area from NEC to north of NSEC and in between, but mostly accumulate below the NEC. This phase was followed by Strombolian activity until 13 September at the NEC, then at VOR crater. Tremor locations for this last phase comprise a broad area between the NEC, VOR and SEC with some locations west of NEC and are displayed as orange circles in Fig. 2.
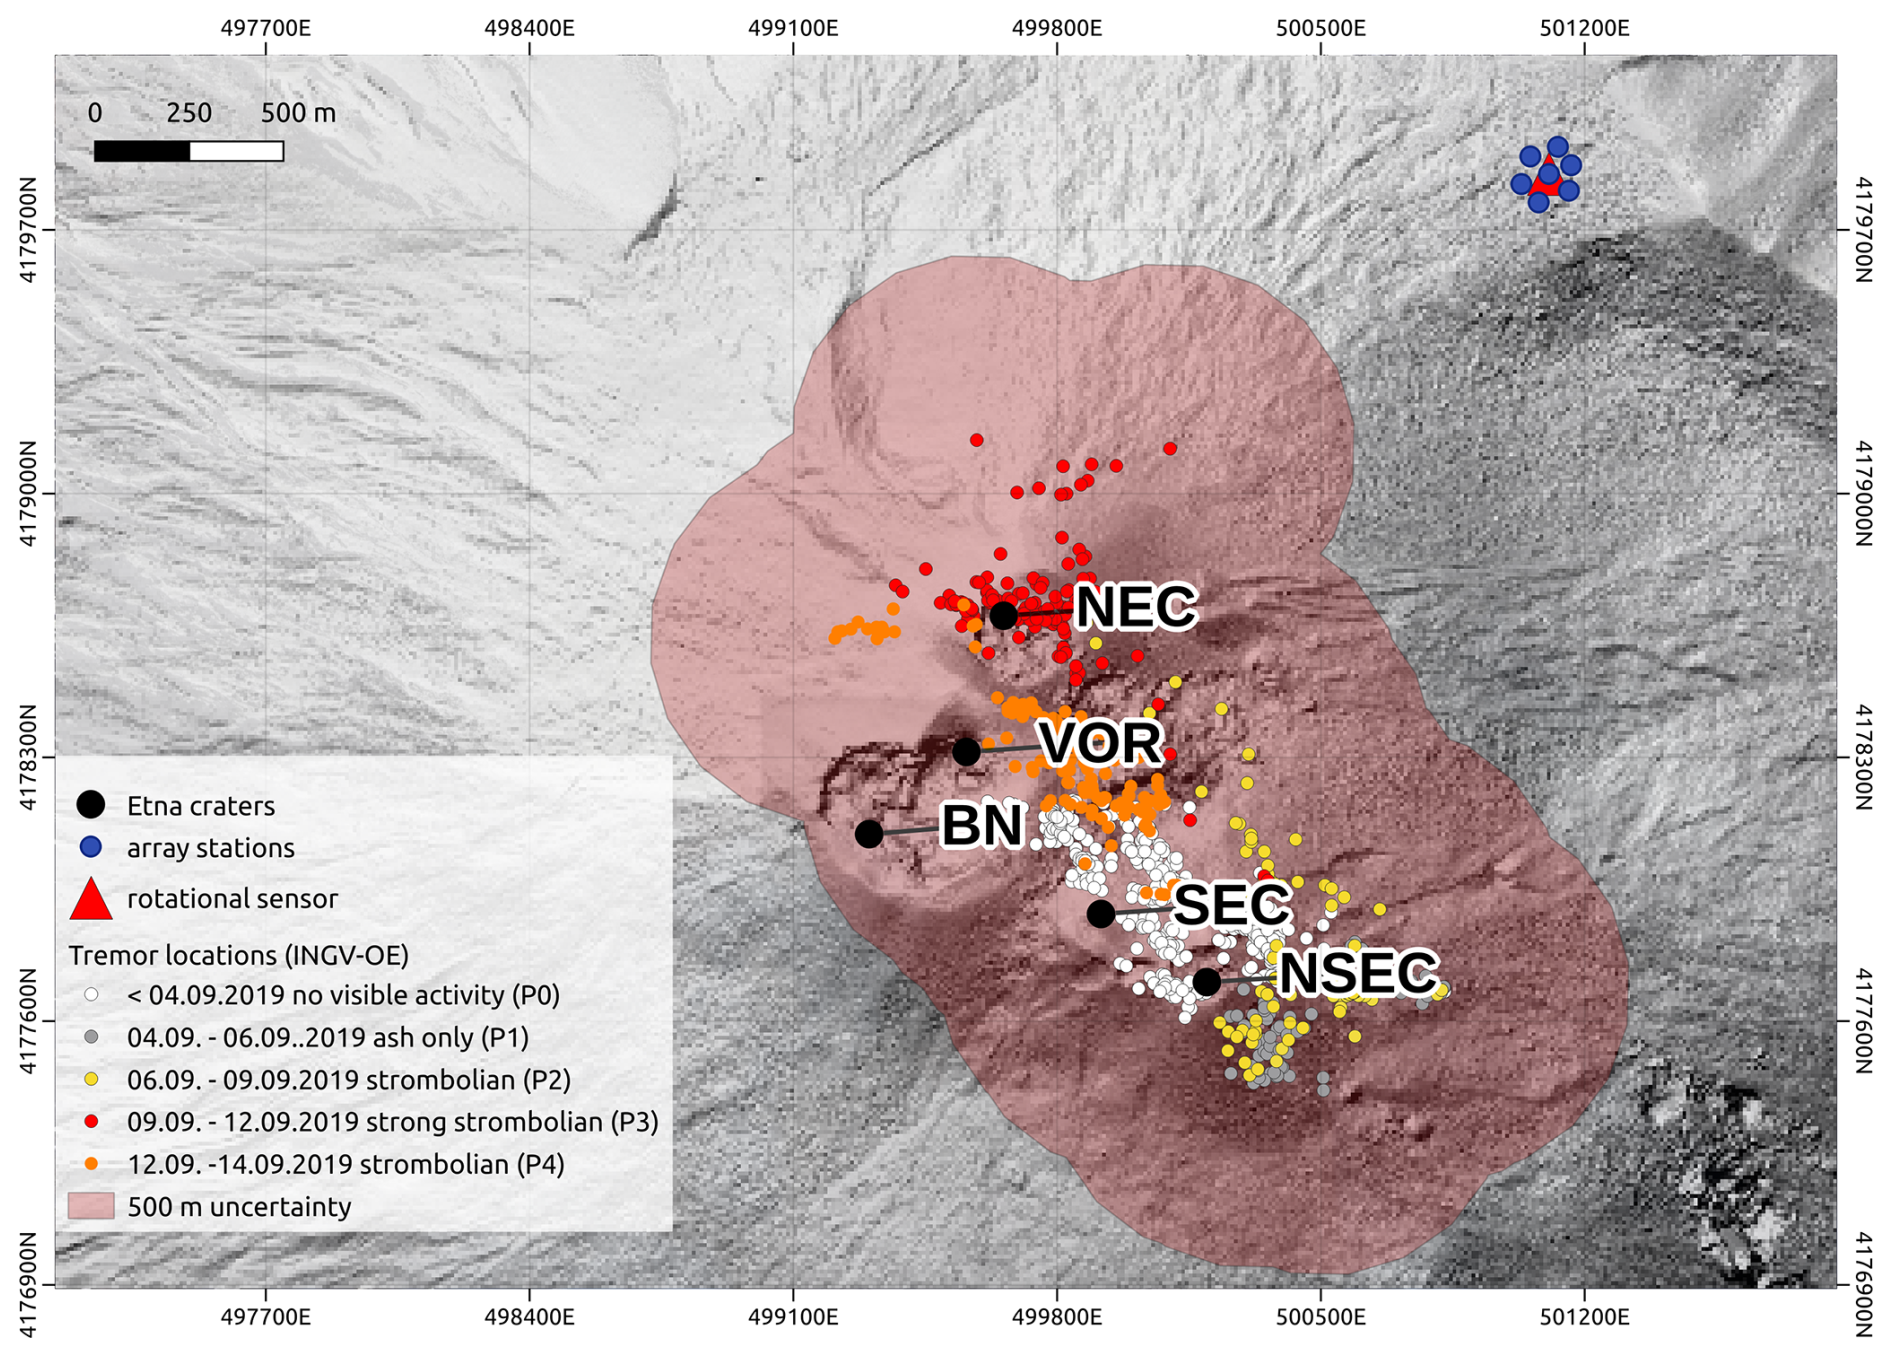
Figure 2Illustration of the tremor locations (white (phase 0), grey (phase 1), yellow (phase 2), red (phase 3) and orange (phase 4)) according to eruption phases, array stations (blue dots) and rotational sensor (red triangle). Uncertainties of 500 m are drawn around the locations as transparent red circles. Summit craters are indicated.
Table 1Eruption phases, classifications of superficial activity and INGV-OE locations.
Both instruments' components, the vertical rotation (HJZ) and the vertical velocity (HHZ) show similar RMS amplitude changes over time (Fig. 3a). RMS data for all components of Bb17 and RS1 show similar trends (Fig. S8). Before 3 September 2019 03:00 PM UTC tremor amplitude is low. It then rises and ash emissions (phase 1 as grey colour in Fig. 3a) start on 4 September at NEC. At the first tremor increase, the frequency ranges from 1–2 Hz and is strongest on the horizontal array components and the vertical rotational sensor component. Phase 2 with Strombolian activity starts on 6 September, but the tremor RMS does not increase further compared to phase 1. A minor peak in amplitude is visible on 8 September from 02:58 to 06:30 UTC. A significant increase on 9 September at 01:30 UTC marks the beginning of phase 3 (red colour in Fig. 3a) with sustained Strombolian activity at NEC until 10 September. Strong amplitude tremor energy reaches from 1 Hz to 5 Hz (Figs. S1 and S9). Large amplitudes are visible until 12 September (Fig. 3a), when another minor peak appears, after which the amplitude decreases to a level similar to the eruption start. This is assigned to phase 4 until the end of analysed time on 14 September 2019.
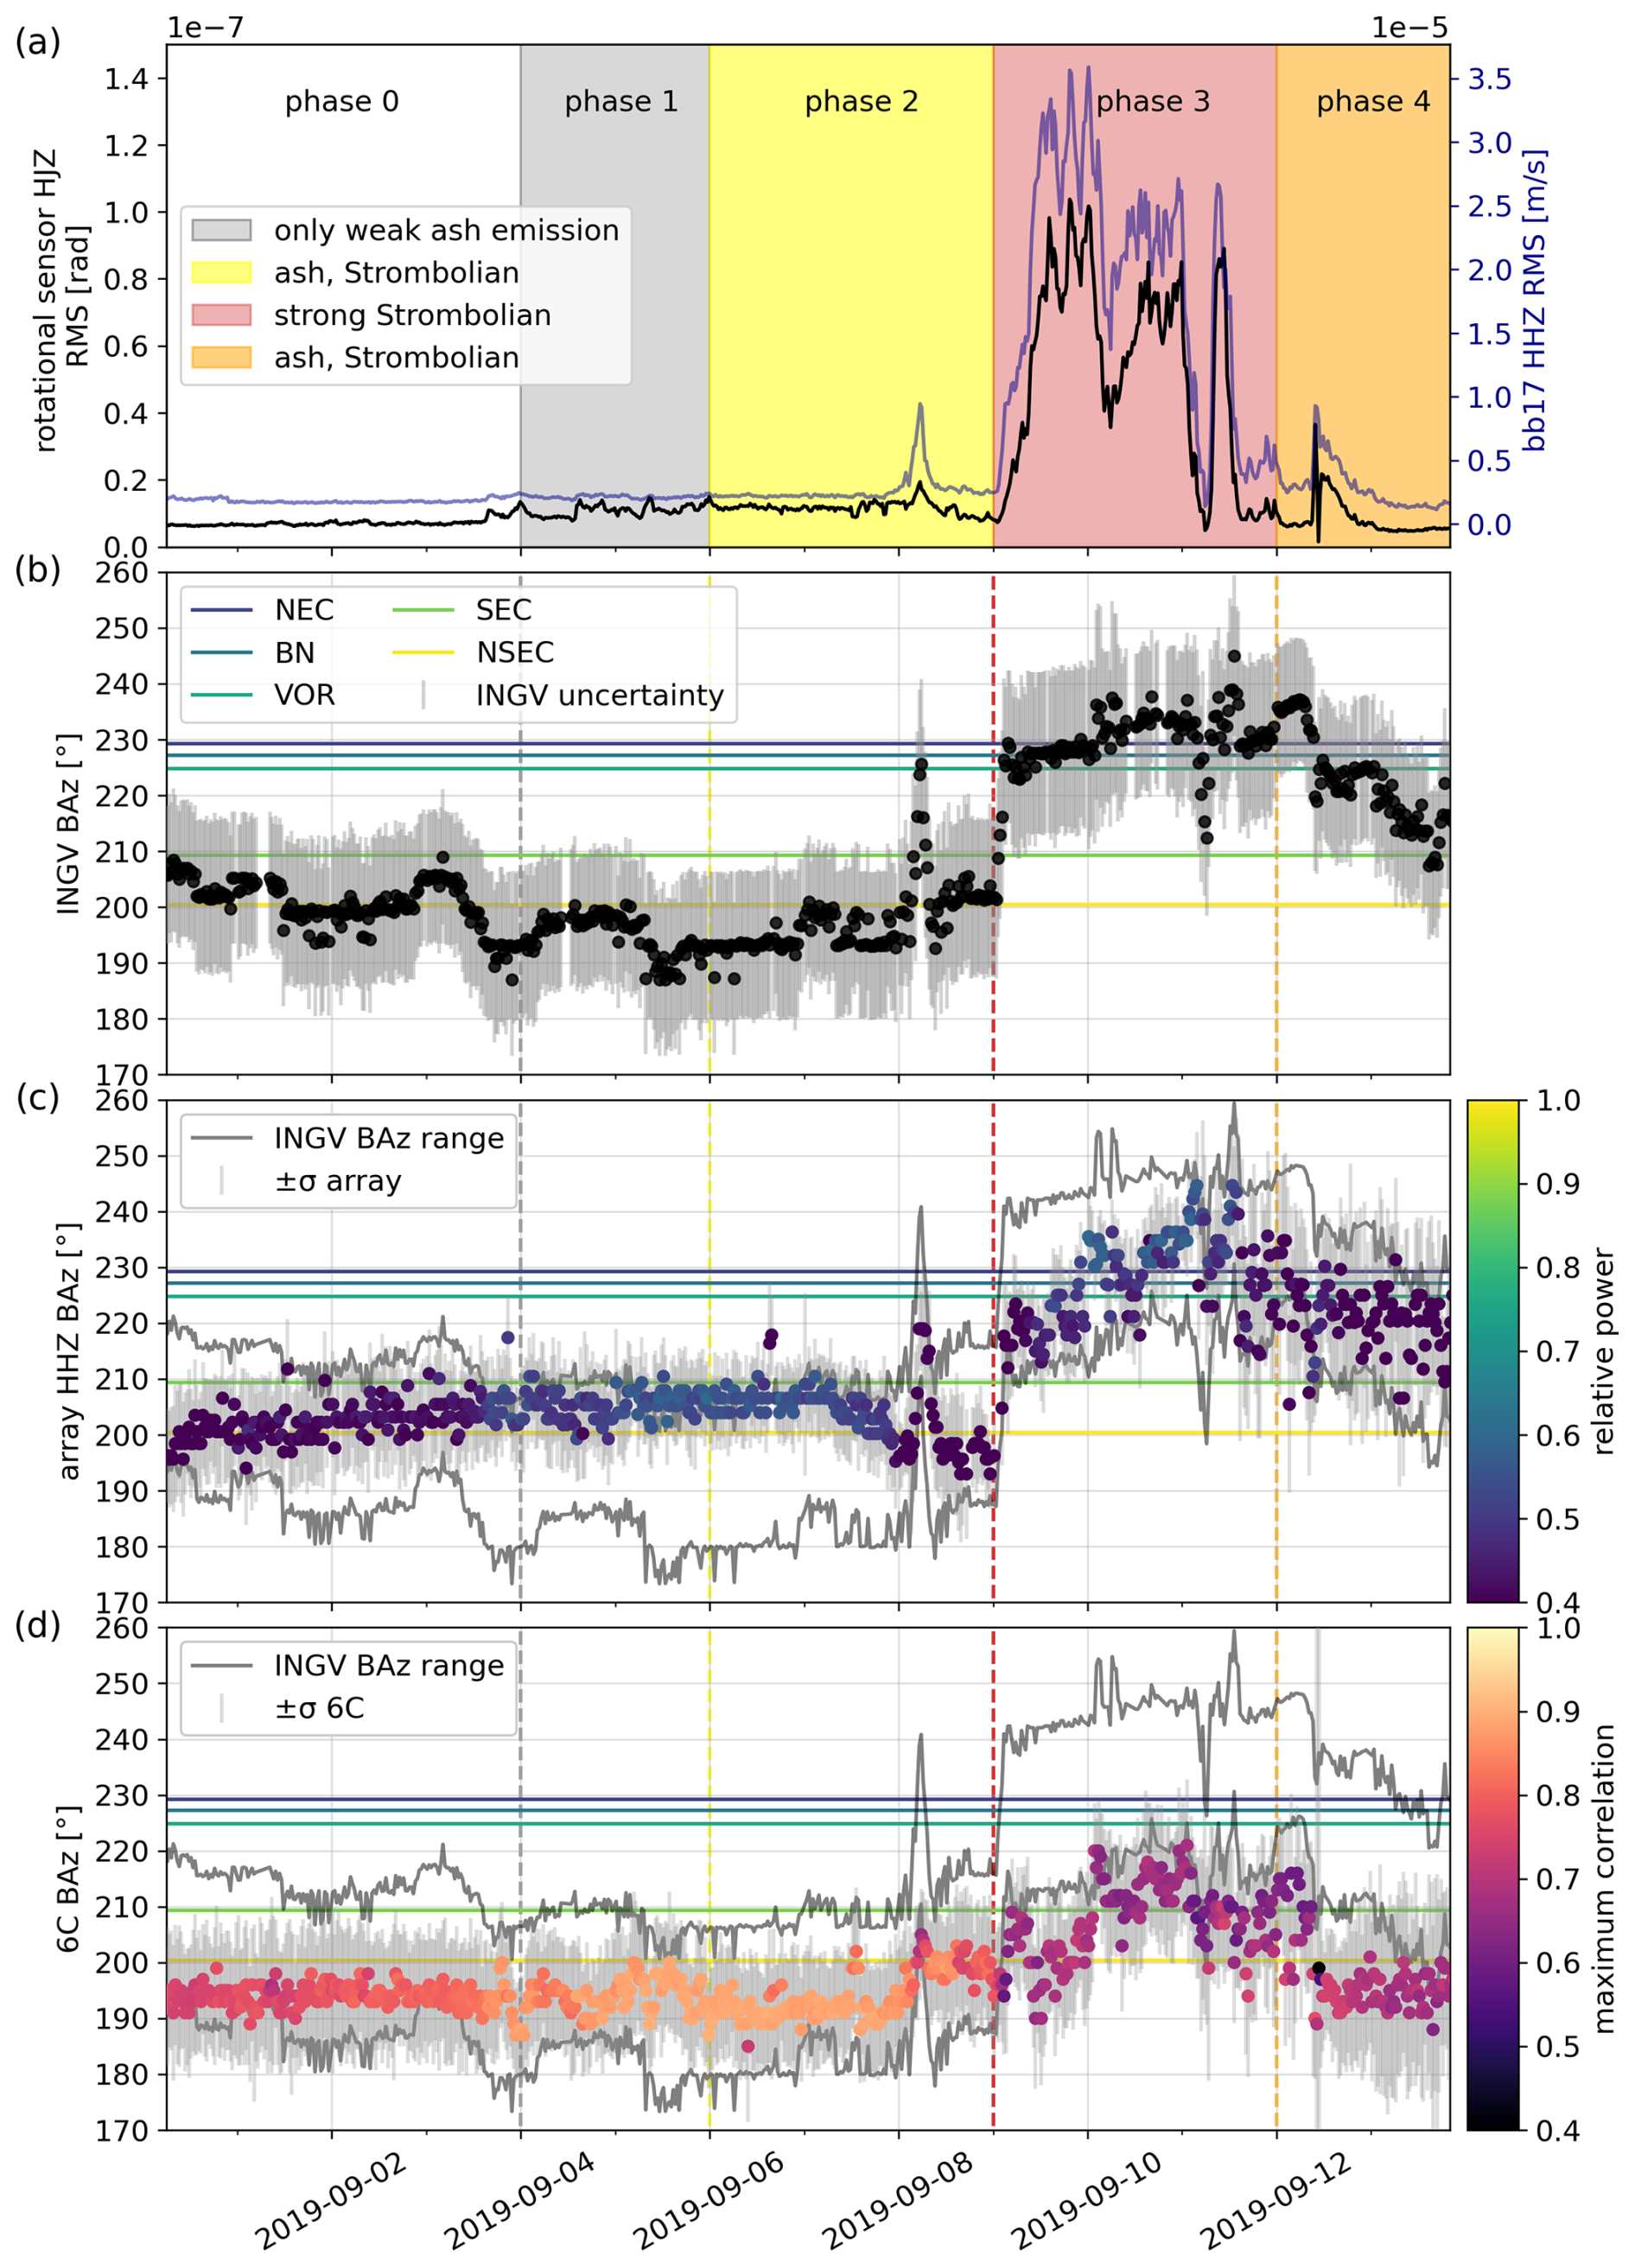
Figure 3Back azimuth tremor comparison from 31 August to 14 September 2019. (a) RMS of seismic data of the Bb17 seismometer (HHZ component, blue) filtered from 0.5 to 10 Hz and rotational sensor (HJZ component, black) filtered from 0.5 to 2.5 Hz plotted above observed activity as coloured blocks. (b) Black points show the INGV-OE BAz, with the respective uncertainty bars of 500 m. Coloured horizontal lines indicate the BAz of the craters. (c) Back azimuths derived using the vertical array component, coloured according to the semblance with grey vertical bars indicating the associated uncertainty. Grey lines in the background show the INGV-OE BAz uncertainty range. (d) The back azimuth values derived using the 6C method, coloured according to correlation between the transverse acceleration and the vertical rotation rate.
4.1.2 Tremor back azimuths
We compare the time series of tremor back azimuths derived from (i) array processing, (ii) a rotational sensor and (iii) the INGV-OE network catalogue locations from the end of August to 14 September 2019 (Fig. 3).
From phase 0 to phase 2, we generally observe a INGV-OE back azimuth changes from 210 to 190°, which fall within the ±10° uncertainty range (Fig. 3b). On 8 September, however, during the RMS peak from 03:00 to 06:00 AM UTC, BAz values increase from 190 to 225°, pointing to the northern (NEC, BN, VOR) craters. The BAz values then migrate back to 190° until the next day, when the BAz values then continuously move from 200 to 230°, the directions of the northern craters, coinciding with the increase of Strombolian activity observed at those. During phase 3 the BAz values are stable at around 230 to 235°, pointing still to the northern craters. On 12 September (phase 4), back azimuth values start to decrease from around 240 to 210° until 14 September. The INGV-OE reference back azimuths and uncertainty ranges are shown in Fig. 3c, d as grey lines for comparison.
The array-derived BAz (Fig. 3c) fit the INGV-OE reference range until the beginning of phase 1. From 4 until 8 September, BAz with higher relative power than during phase 0 show directions towards the southern craters and are within the upper limit of the INGV-OE reference. On 8 September with the first strong tremor amplitude peak, array and INGV-OE BAz overlap. Directional estimates continue to agree in phase 3 in which Strombolian activity intensified. Nevertheless, the array BAz scatter more strongly within the INGV-OE reference range. In phase 4 Strombolian activity was still noted, but switched from NEC to VOR crater between 12 and 13 September. Array BAz fall within the INGV-OE range but have higher uncertainties reaching outside the range.
During phases 0, 1 and 2, the 6C-derived BAz (Fig. 3d) vary mostly between 185 and 200° within the INGV-OE reference range and show little changes with respect to the uncertainties. Correlation between the horizontal seismometer and vertical rotational sensor components is highest during phase 1 and 2. From phase 3 to phase 4, the 6C BAz point to directions south of the INGV-OE BAz range, even accounting for the uncertainties. Directions point to NSEC and SEC instead of the northern craters where strong Strombolian activity was observed.
In summary, phase 0 features different direction trends for all methods. During phase 1, 6C-derived BAz fit the reference better than the array results, even though the tremor onset on 3 September is clearly visible on both instruments (Figs. S1, S8, S9). Phase 2 is best displayed by the 6C BAz as well, but the first RMS amplitude peak on 8 September and corresponding direction changes are better represented by the array-derived BAz. In phase 3 with highest tremor amplitude and following decreasing amplitudes we see closest agreement between the array-derived BAz values and the INGV-OE locations' BAz. For all methods, the semblance and maximum correlation are highest from 4 until 8 September, phases 1 and 2. However, some time windows during phase 3 also show high semblance for the array.
4.1.3 Tremor slownesses and phase velocities
The hypocentral distance (Fig. 4b) of tremor INGV-OE locations to the array centre varies from 2.1 to 2.5 km until the end of phase 2, when it decreases with the first RMS amplitude peak to 1.6 km distance before increasing to 2 km again. At the beginning and end of phase 3, the distance drops from ≈2 to ≈1.6 km each time. At the onset of phase 4, tremor is located at a distance between ≈2.2 and ≈2 km. The horizontal resolution is constrained by 500 m, the vertical resolution by 1000 m uncertainty. Accordingly, small-scale variations in the estimated source position fall within the range of methodological uncertainty and cannot be considered resolvable with confidence. The strongest change in distance represents the deepening of the tremor source during phase 3 with sustained Strombolian activity. The tremor migrated from the surface at ≈2.9 km down to 1.6 km altitude, a trend which is significant despite the vertical uncertainty.
Array-derived slowness values (Fig. 4c) slightly decrease to 1.2 s km−1 from phase 0 to phase 1. With exception of the peak on 8 September, slowness values remain stable during phase 2. Highest slowness values of around ≈1.7 s km−1 are reached during the RMS peak and with the strong tremor amplitude increase at the beginning of phase 3. From 10 to 12 September slowness variations are not significant with respect to the uncertainties. With the beginning of phase 4, slownesses show an increasing trend to 1.6 s km−1. Interestingly, slowness values are stable at the times of highest relative power, which coincides with the beginning of visible activity and the strong Strombolian activity.
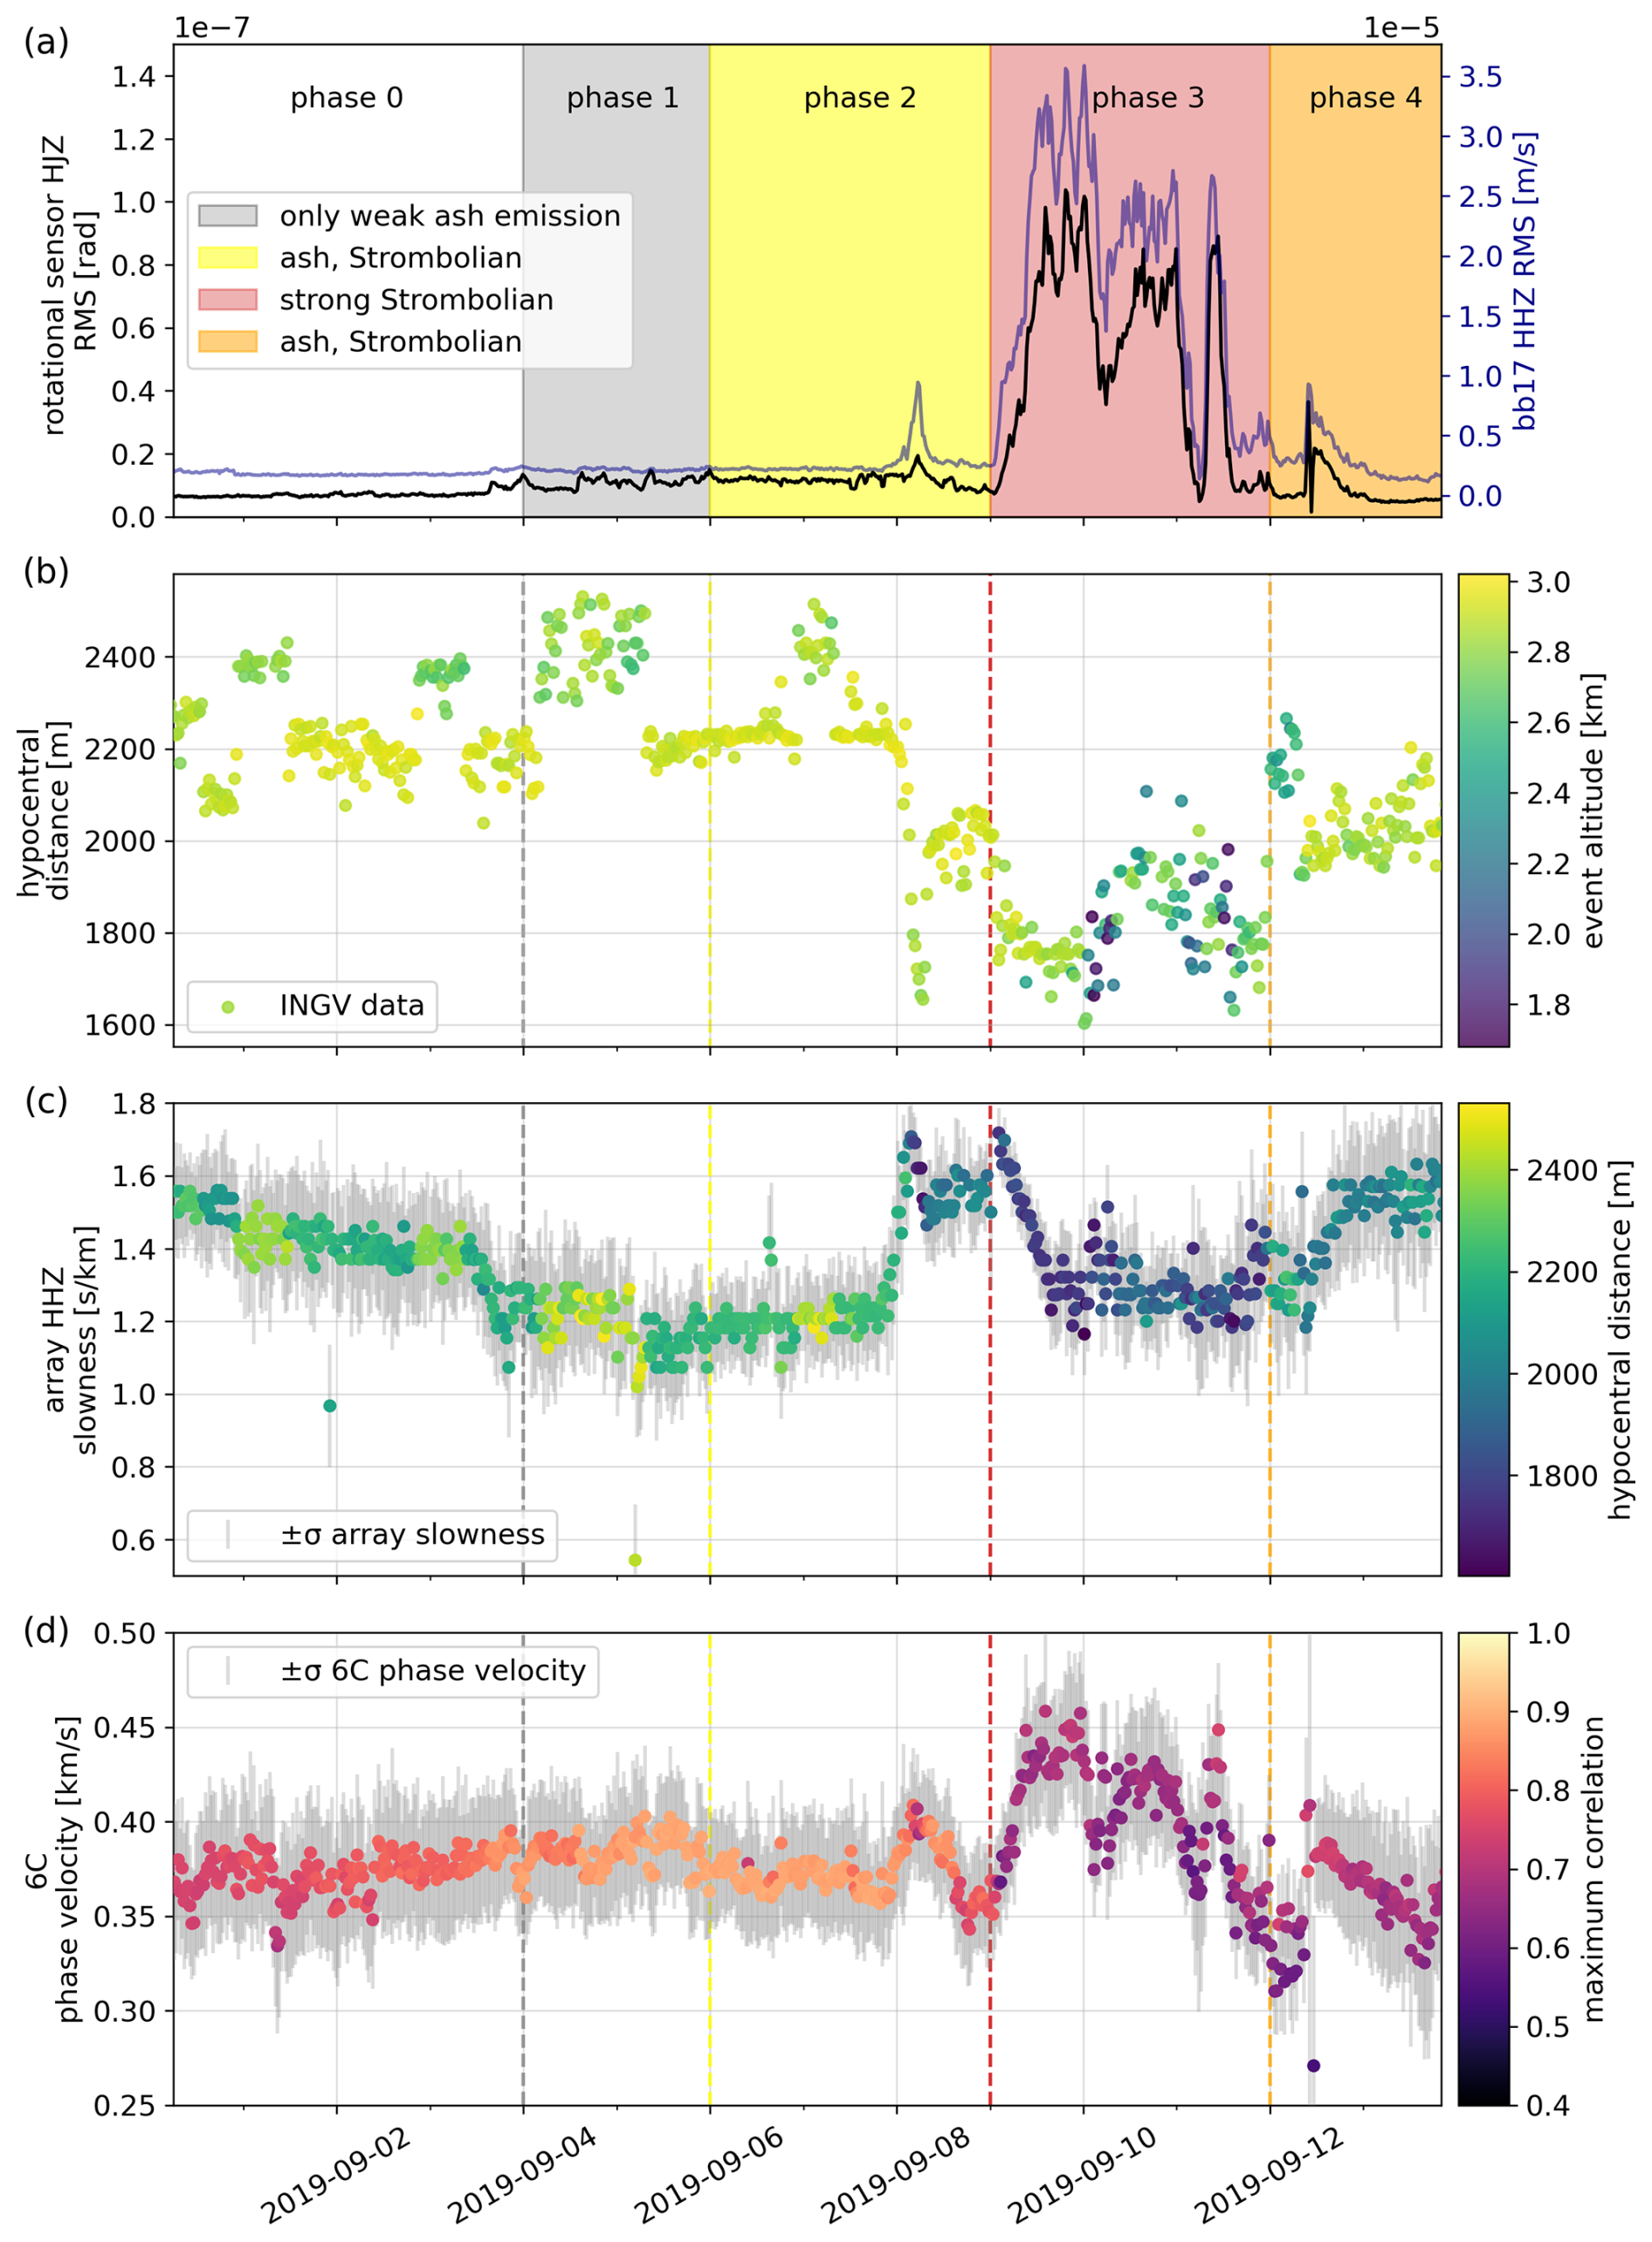
Figure 4Slowness and phase velocity comparison for the tremor from 31 August until 14 September 2019. (a) RMS of 0.5 to 10 Hz filtered seismic data of the Bb17 seismometer (HHZ component, blue) alongside the RMS of rotational sensor data (HJZ component, black) filtered from 0.5 to 2.5 Hz. Observed activity is indicated as coloured blocks and as vertical dashed lines in the following subplots. (b) Hypocentral distance from the array to the tremor locations coloured by event altitude. (c) Slowness values derived using the vertical array component, coloured by hypocentral distance. (d) Phase velocities derived using the 6C-method, coloured by correlation between the transverse acceleration and the vertical rotation rate.
Phase velocities obtained from the 6C method (Fig. 4d) seem stable around 0.35 and 0.4 km s−1 during phase 0, 1 and 2. With the beginning of phase 3 the velocities increase slightly from 0.35 to 0.45 km s−1. The shape of velocity changes seems to represent the RMS tremor amplitude changes, indicating slightly higher velocities with higher tremor amplitudes. In phase 4 the values drop to ≈0.33 km s−1.
The most pronounced changes in tremor distance, altitude, array slowness, and 6C phase velocities occur during the end of phase 2 and throughout phase 3, coinciding with elevated RMS tremor amplitude and intense Strombolian activity. Velocities derived from the combination of the transverse acceleration and vertical rotation correlations (6C velocities) correlate with peaks in tremor amplitude.
4.2 Long-period event analysis
In the following we first present the LP event signal-to-noise ratios, and show an exemplary long-period event to explain the processing used to obtain one event back azimuth and phase velocity value for every LP event. We then present an comparative overview of all 371 analysed LP events.
4.2.1 Signal-to-noise ratio of LP events
While most events show comparable SNR across components, some exhibit highest SNR on the vertical seismometer component (HHZ), supporting the use of the vertical component for the array analysis (Fig. S9). The SNR from the vertical component of the rotational sensor (HJZ) mostly exceeds those of the horizontal components (HJN and HJE) by a factor of two. The SNR for the selected LP event on 2 September 15:51:10 UTC is shown in Figs. S11, S12 and S13. For that LP event, SNR values are highest for the array's horizontal components (HHN and HHZ) and for the rotational sensor's HJZ and HJN components. This event is detected on all components, but exhibits highest amplitudes on the horizontal components of the co-located seismometer and on the vertical component of the rotational sensor as shown in the spectrogram (Fig. S4).
4.2.2 Example LP event: back azimuth, phase velocity and slowness
The HHZ component of one array station is shown alongside the vertical component of the rotational sensor (Fig. 5a, b). The LP event is shown within the grey dashed lines. Another lower amplitude event is also visible approximately 10 s earlier on both instruments' components. Array-derived back azimuths fluctuate between mostly 180 to 240° (Fig. 5c). At the event start, the BAz is consistent with the INGV-OE reference (red line) and semblance between the array stations is high. Sliding windows of 5 s (Fig. 5c) and overlap of 90 % lead to temporal smearing of the high semblance and back azimuth results in comparison with the event waveform and high amplitudes. A slight increase in semblance is also observed approximately 10 s prior to the event, coinciding with the potential recording of another LP event with lower amplitude. Slowness values are lowest at the event start with ≈0.5 s km−1, increasing linearly to 2 s km−1 towards the event's end. The rotational sensor back azimuth (Fig. 5d) range is broader than the array results with ≈150 to 230°. At the event start 6C BAz indicate a direction of 201°, thus pointing 24° further south than the INGV-OE reference. Phase velocities are highest at the event start reaching up to ≈0.8 km s−1 and 10 s prior at 0.6 km s−1.
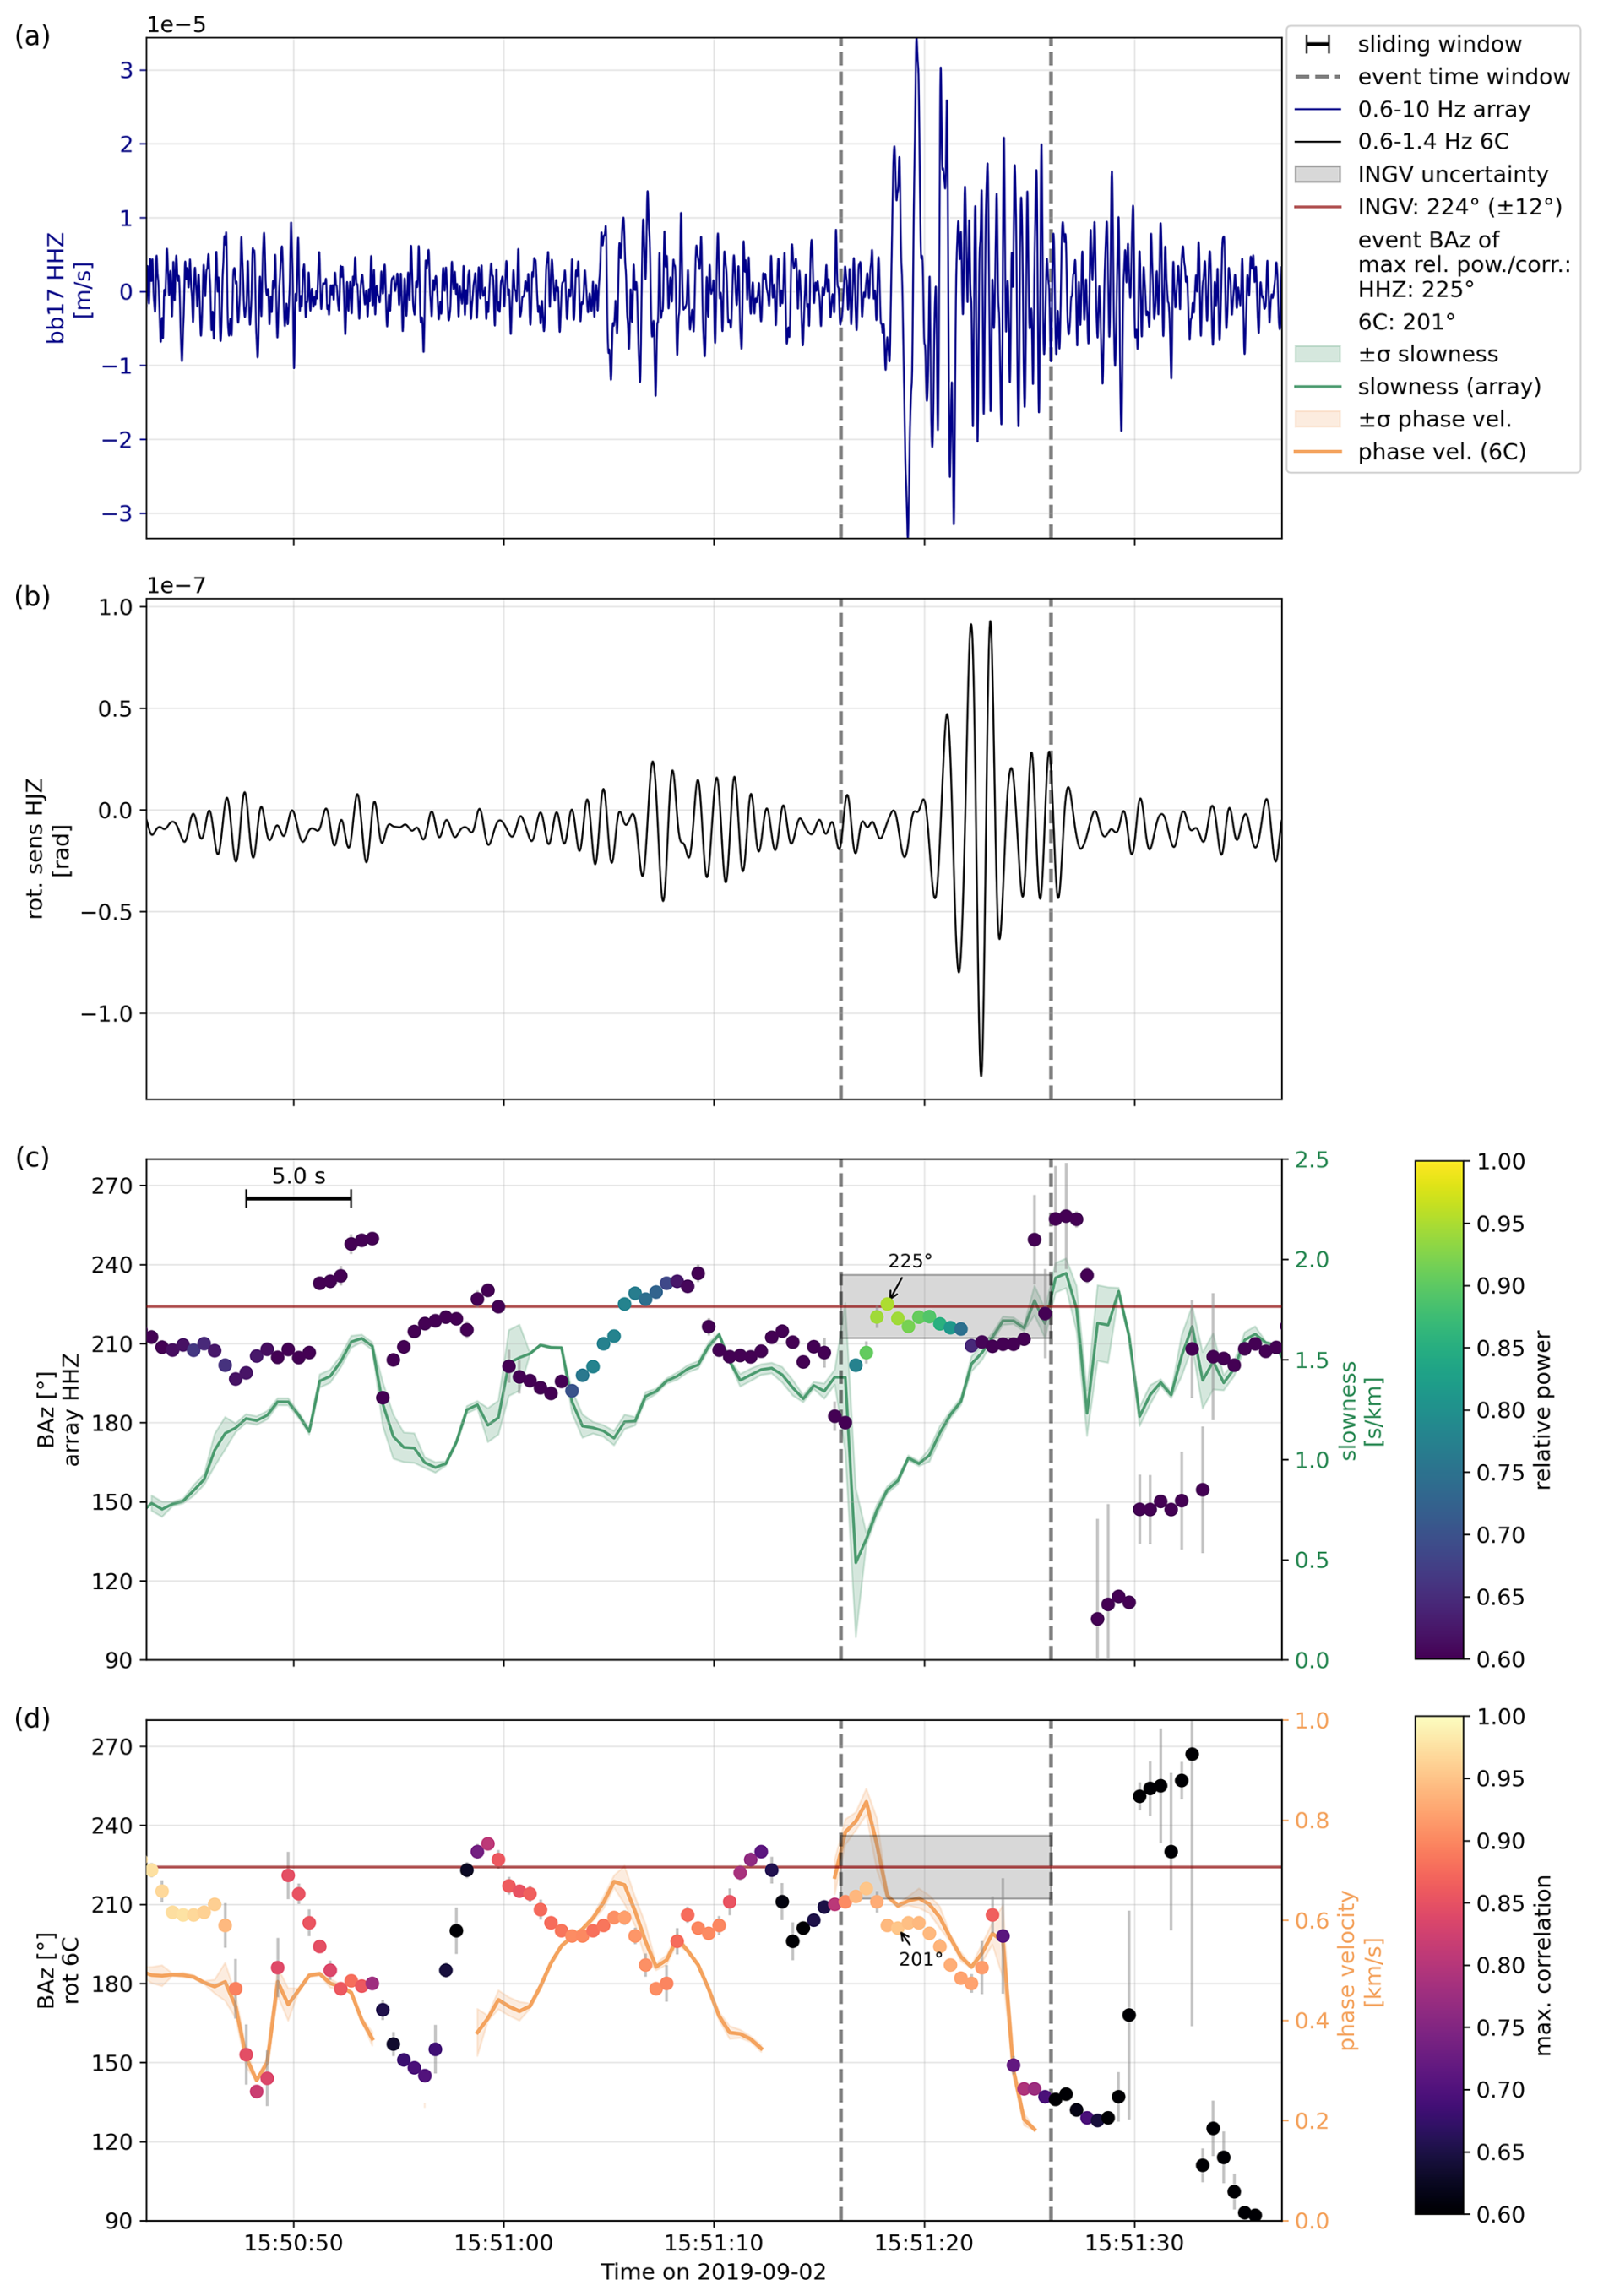
Figure 5Comparison of the long-period event at 15:51:10 on 2 September 2019. (a) Bandpass-filtered seismograms (2nd-order) are shown for the vertical component of seismometer Bb17 (0.6–10 Hz) and (b) for the vertical component of the rotational sensor (0.6–1.4 Hz). Grey, dashed lines indicate the event time windows, the black line (c) the sliding window. (c, d) BAz and slowness (phase velocities) derived using the vertical components of the array (c) and the 6C method (d). Colours indicate the semblance for the array and maximum correlation for the 6C results. The BAz of highest power (correlation) is annotated. The INGV-OE value is shown as a red line with its uncertainty as a grey rectangle. Array slowness is shown as a green line (c) and phase velocities as an orange line (d) with the respective uncertainty.
4.2.3 LP event catalogue: temporal and spatial distribution
We analysed a total of 371 LP events (Fig. 6a) from 24 August to 14 September 2019, with no LP events in the INGV-OE catalogue from 6 to 14 September, during the eruption phase (Fig. 6d). Additional LP events are visible during this phase but not listed in the catalogue, either because they were not possible to locate with low amplitude in comparison to the tremor amplitude (Sciotto et al., 2022) or because of the catalogue frequency range set for our study. Other small-amplitude signals are visible, but have not been detected by the INGV-OE network, see Fig. 5a, b at 15:51:05. We do see similar small-amplitude signals for 103 of the 371 LP events picked. All 371 catalogue events have been located by the INGV-OE routine at eleven locations (Fig. 6a) at altitudes varying from 2.75 to 3.25 km, with an uncertainty of 1 km. 189 LP catalogue events occurred from 27 until 29 August (Fig. 6d). Prior to the first visible activity on 4 September, LP BAz from the INGV-OE catalogue point to the NEC, BN and VOR craters alternately. First LP events further south appear from the evening on 3 September until early 4 September, however other LP events are still detected at the northern craters. Only four LP events are located by the INGV-OE at the southern craters (Fig. 6a).
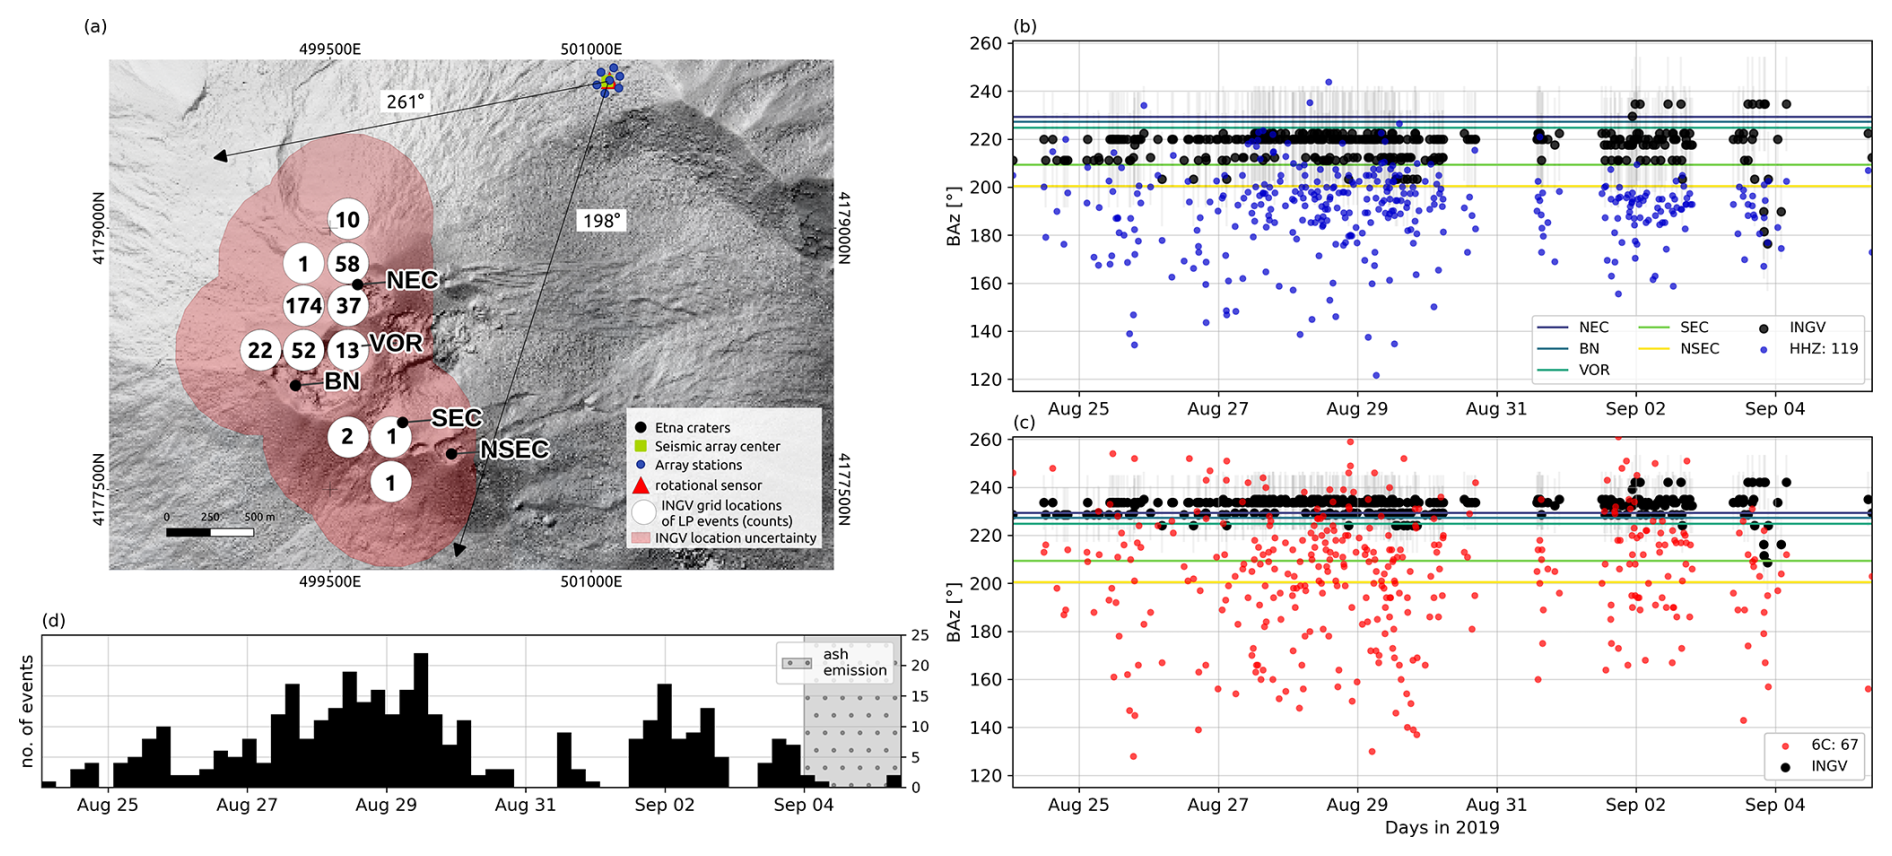
Figure 6Overview of all 371 LP event back azimuths. (a) INGV locations with uncertainty (red) showing LP event counts. (b) BAz for all LP events by the vertical array components. (c) BAz from rotational sensor 6C method. The crater directions are shown as coloured horizontal lines and the legend shows the counts of LP events whose BAz align with the reference (black dots), including uncertainty. (d) LP event numbers over time with start of visible activity.
4.2.4 Back azimuths of the LP events
If the LP event back azimuth estimated from the array or 6C method falls within the corresponding uncertainty range of the INGV-OE BAz, the event is counted as a valid result for the respective method, as indicated in the legend (Fig. 6b, c). For all LP events the uncertainty range of INGV-OE BAz varied from ±10–14°. The respective BAz are obtained at the event time of highest semblance (array) or highest correlation (6C). Of 371 LP events, we obtained 119 valid BAz from the HHZ components and 67 valid BAz from the 6C method, see legends in Fig. 6b, c. INGV-OE locations point to the northern craters until 4 September when few LP events are located at SEC (Fig. 6b, c). HHZ components' BAz point mostly to a direction in between the northern and southern craters about 10–15° further south compared to the INGV-OE reference (Fig. 6b). Higher event signal-to-noise ratios from the array mostly result in BAz between the northern and southern crater region. 6C BAz results do not focus on a specific area throughout the entire time analysed, but also deviate towards the south in comparison with the reference directions (Fig. 6c). Higher SNRs on the HJZ component do not systematically result in back azimuths that better match the INGV-OE reference, suggesting that high SNR alone does not imply more accurate BAz estimates.
No clear deviation according to specific sites classified in Fig. 7a is observed either. The array-derived BAz predominantly align approximately 20° south of the reference direction, with deviations reaching up to 40° further south in some cases (Fig. 7b, e). The majority of 6C BAz measurements also exhibit deviations of around 20° south, but also reach up to 80° south of the direction indicated by the INGV-OE location (Fig. 7c, f), resulting in directions far outside the expected range of Mount Etna’s crater region. A higher number of high-SNR events is observed at location IV for both methods, which also corresponds to the area with the greatest concentration of located LP events. Whereas INGV-OE and array-derived directions (Figs. 6b, 7d) are focussed on the crater region, 6C BAz show a broad range reaching outside the crater range (Figs. 6c, 7d).
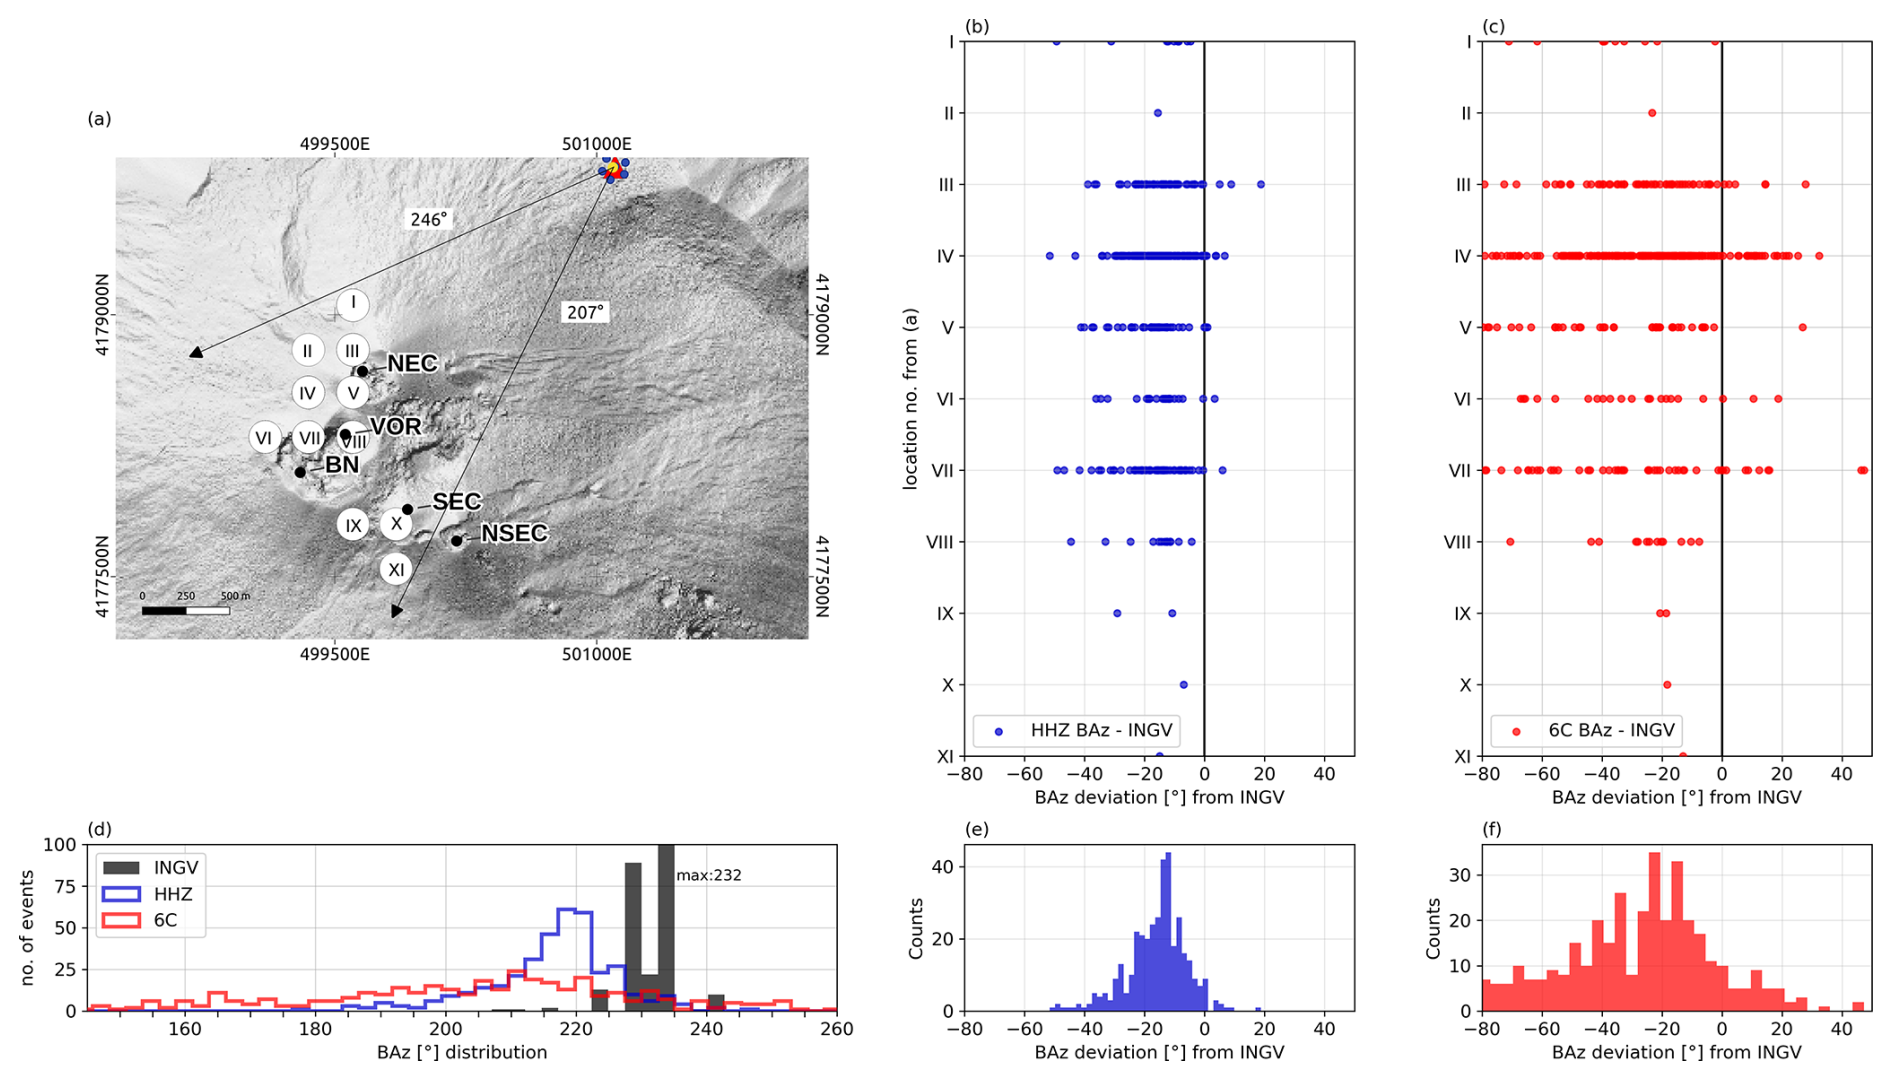
Figure 7Overview of all 371 LP event back azimuth deviations from the reference. (a) Numbered INGV locations of LP events. (b–c) BAz deviation from reference locations marked in subfigure (a). (d) Back azimuth distribution for all methods. Histograms of the array (e) and 6C (f) deviations from the INGV-OE reference.
4.2.5 Slownesses and phase velocities of the LP events
We present the results of phase velocity analyses and spectrograms to characterize the wave types long-period events consist of. In particular, we aim to determine whether the observed long-period events exhibit characteristics of SH body waves or of Love-waves (surface waves). Calculating phase velocities with the 6C approach for different frequency ranges (Fig. 8a), we observe a decrease of velocity with increasing frequencies. The frequency content of LP events may be constant (Fig. 8b) or vary during the event duration (Fig. 8c). The temporal evolution of the phase velocities for all 371 LP events obtained in the frequency range of 0.6 to 1.4 Hz indicates a slight decrease of velocity over the event time (Fig. 8d).
To enhance the analysis, we also apply array analysis to a selection of volcanic-tectonic (VT) events, where the P- and S-wave arrival times can be detected precisely. One exemplary VT event with the corresponding BAz and slowness results is shown in Fig. S14. The HHZ components show high semblance for the event start and resulting back azimuths are in strong agreement with the INGV-OE reference (Fig. S14d). The P-wave arrival is visible on the HHZ component seismogram and array-derived slowness is at 0.15 s km−1 (Fig. S14a, g). Slownesses observed for S-waves (Fig. S14b) increase non-linearly. A further step-wise slowness increase is observed for the following surface waves. Comparing these VT event P-, S- and surface wave slownesses with the slownesses obtained for the 371 LP events (Fig. S15a), the array-derived LP event slownesses from around 0.6 to 1.5 s km−1 match expected VT event surface wave velocities.
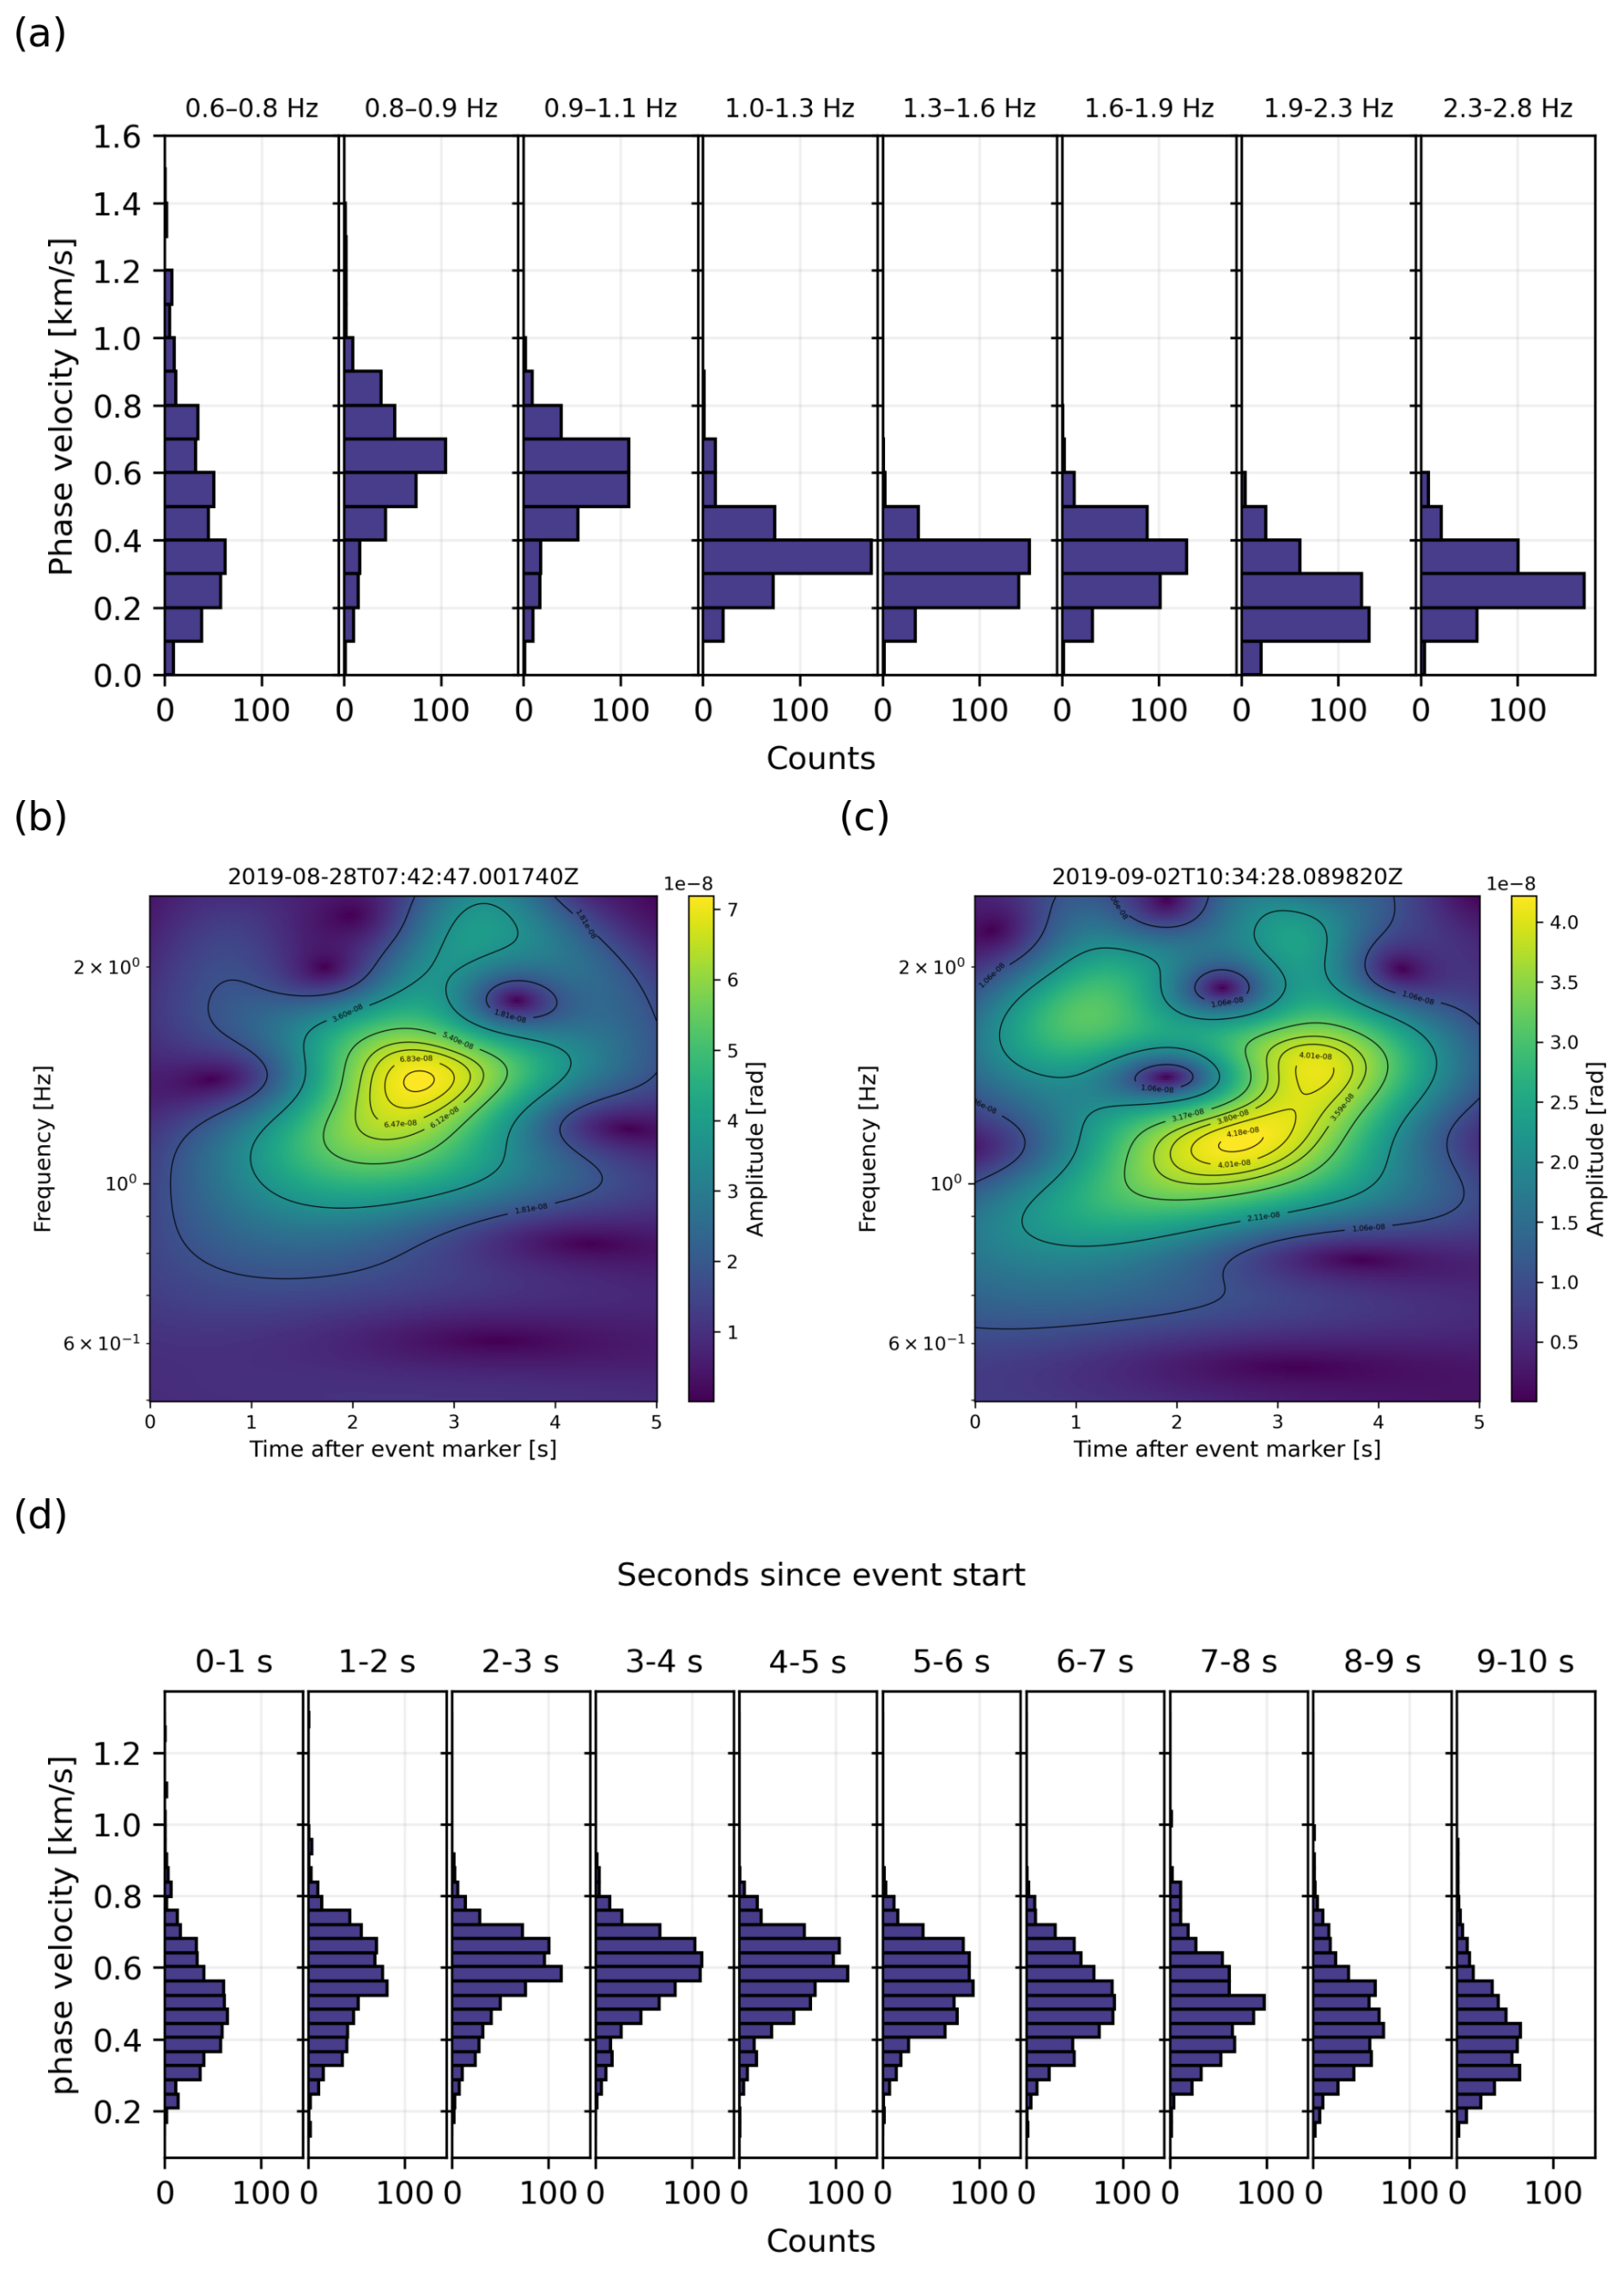
Figure 8Overview of LP event frequency-dependent phase velocity, signal spectrograms, and velocity changes over event time. (a) Phase velocities of the 371 LP events obtained by the 6C method for different frequency ranges respectively. (b, c) Exemplary rotational sensor (HJZ) spectrograms of the high amplitude LP events. (d) Phase velocity evolution over the event time for all the LP events in the 0.6 to 1.4 Hz frequency range.
5.1 Limitations and constraints of the applied methods
Array performance depends on the array response defined by the station set-up. Here, Bb17 was placed on a granitic plate with the rotational sensor, while others were buried directly. Additionally, the event distance should be much larger than the aperture of the array (Schweitzer et al., 2012). Tremor sources are located 1.2–2.5 km from the array, and LP events at 1.7–2.6 km. The array aperture is of 0.156 km, thus suitable for analysing events at that distance. Minimum and maximum slowness (1–2 s km−1) and the frequency range (0.6–1.4 Hz) of the exemplary LP event (Fig. 5, S4) yield wavelengths of 0.36–1.7 km. At 1.7–2.6 km distance, longer wavelengths may be poorly resolved, as the wavefront can no longer be assumed planar (Schweitzer et al., 2012).
Sliding window lengths of 0.5 and 5 min applied in the array analysis result in similar trends as the here presented 30 min processing windows (Fig. S3) and confirm reliability of the results. The strong main lobe near the slowness grid centre (i.e., at low slowness) leads to multiple possible BAz solutions within the high-semblance region (Fig. S16). A larger array aperture would enhance the BAz resolution for lower frequencies (Schweitzer et al., 2012). Based on the general array response (Fig. S2) and the slowness grid results for the start of the exemplary LP event (Fig. S16), we can conclude, that it primarily emphasizes the main lobe when a narrow-band coherent signal is present. Low uncertainties for LP events derive from similar back azimuths and slowness values obtained by higher resolution results, but can be confirmed by synthetic simulations (Fig. S7). With a high SNR of 10 we expect uncertainties of less than 10° and 0.02 s km−1, whereas a lower SNR leads to higher uncertainties for back azimuth and slowness results.
Local heterogeneities affect small arrays more than large ones, with near-surface structures distorting the wavefield. For Etna volcano, these heterogeneities and topographic effects have been used to explain differences in the inversion of slowness data, with two arrays pointing to different directions of the same recorded tremor signal (Saccorotti et al., 2004), while site effects do not show a strong influence on the network tremor locations (Cannata et al., 2013). However, according to Battaglia et al. (2005) and Cannata et al. (2013), two simultaneously active sources could lead to volcanic tremor sources being located in between the actual locations by the network amplitude decay technique. LP events and tremor share the 0.6–1.4 Hz range, complicating separation, but tremor locations from the INGV-OE network match actual volcanic activity well (Cannata et al., 2013; Sciotto et al., 2022).
Finally, we compare the BAz from the array components and the 6C station results to the INGV-OE reference locations assuming that those are close to the true locations. However, the amplitude-based method of the network for tremor is associated with uncertainties of around 500 m. The rotational sensor is sensitive to local heterogeneities which limits the accuracy of direction results and velocities (Donner, 2021; Keil et al., 2022).
5.2 Tremor source parameters: Comparative and joint analysis of the array, 6C, and the INGV-OE network
INGV-OE tremor locations (Fig. 2) indicate, despite some outliers, a location clustering according to the eruption phases. Pre-eruptive back azimuths differ between the methods and possibly result from low tremor amplitudes and stronger influence of noise (Fig. 3b–d). From the eruption start with ash emission (phase 1) through Strombolian activity (phase 2) at the northern craters, INGV-OE and 6C tremor directions point south of the southern craters to SEC and NSEC. Array HHZ directions point to SE and NSE crater. We assume activity at both crater regions during phase 1 and 2, that are respectively indicated by the array directions (southern craters) and visible activity (northern craters). The network and 6C BAz results possibly indicate insufficient high amplitudes to resolve correct directions at the general crater region or might be deviated due to local heterogeneities (Donner, 2021 and references therein) that could effectively be mitigated by the array analysis.
During the high amplitude tremor and strong Strombolian activity, INGV-OE and array-derived back azimuths coincide and align with visible activity. They are assumed to be correct. The systematically lower back azimuths estimated by the 6C method during this phase 3, compared to those from array and network analyses, raise the question of whether the rotational sensor's 6C method is more sensitive to secondary activity south of NSEC, or whether they result from small-scale structures (Keil et al., 2022), given that the 6C method relies on a single-point measurement. Multiple active tremor sources have been confirmed for an eruption in 1999 on Mt. Etna (Cannata et al., 2008) and can not be excluded for this 2019 eruption. However, we believe that the back azimuth differences by the 6C method are rather caused by local site heterogeneities. We assume that a secondary activity would to some extent as well be displayed by array back azimuths.
The accuracy of array results depends on the semblance of all stations. As semblance is low before any visible activity, the array BAz are not in agreement with the reference (Fig. 3c). At the onset of the eruption, the tremor amplitude increases slightly with high correlation and semblance for both methods. Lower array semblance and lower 6C station correlation are observed from phase 3 onwards. At the same time tremor depth changes occur. We hypothesize that the difference in medium propagation paths results in low semblance. While the array slowness reaches similar values during high semblance, the 6C phase velocities represent the tremor amplitude changes and are stable with the exception of phase 3 only, as noted by Eibl et al. (2022a). During phase 3, the reduced 6C station correlation between the seismometer and rotational sensor might be caused by the deepening of the tremor source and consequently wave type mixing associated with intense Strombolian activity on the surface but tremor at depth. Eibl et al. (2022a) already noticed SV type of waves during the elevated Strombolian activity. Distance increase by around 5 km and tremor slowness decrease were interpreted as tremor deepening by Eibl et al. (2017a) on Iceland. However, in this case the distance changes by 0.8 km and might thus not show a significant change in slowness.
We conclude, that low tremor amplitude results in diverging direction estimates by all methods, which could confirm either noise dominance or secondary sources, as interpreted for LP events by Schick et al. (1982) and tremor by Cannata et al. (2008) on Mt. Etna. During high tremor amplitudes the phase-based array results fit the INGV-OE reference directions and the visible activity locations, whereas the amplitude-based 6C method might be deviated by local heterogeneities (Donner, 2021; Keil et al., 2022) or due to SV wave types. The tremor slowness decreases with increasing depths while phase velocities increase coherently. Relatively high slowness values of around 1.2 to 1.7 s km−1 in comparison to slowness values of 0.5 to 0.7 s km−1 for volcanic tremor on Iceland (Eibl et al., 2017a) could be related to deeper sources, higher complexity of the volcanic edifice and surface wave type tremor. Assuming that array slownesses represent surface waves (1.2–1.4 s km−1), we convert them to phase velocities of 0.7 to 0.8 km s−1. There is a discrepancy of around 0.3 km s−1 compared with the phase velocities derived using the 6C method. This might be, as mentioned before, due to small-scale structures deviating the incoming waves (Donner, 2021; Keil et al., 2022), or due to a mixtures of wave types during phase 3 (Eibl et al., 2022a), resulting in slower phase velocities.
5.3 Love wave type LP events: velocities and directions
Even though the eruption, starting on 4 September 2019 with weak ash emissions, took place at at NEC and VOR crater (Eibl et al., 2022a), most LP events point to a source at shallow depth further north of the North East crater according to the network directions. In previous studies, LP events at Mt. Etna have been mentioned to be present without volcanic activity as well, thus not directly related to volcanic activity (Cannata et al., 2009).
For the exemplary LP event on 2 September 2019 no clear direction change is observed comparing the BAz of the small-amplitude signals emerging around 15:50:45 and 15:51:05 in Fig. 5a, b, – prior to the detected LP event at 15:51:15. Persistent low amplitude activity could explain similar directions before and after the defined LP event, we thus interpret those high correlation times as real pulse signals of lower amplitude than the LP events.
We achieve better fitting BAz from the array processing for all the LP events than from the 6C analysis. Towards the visible activity start, array BAz seem to focus more on the crater area, a change which is not observed for the 6C BAz. However, the array and 6C BAz seem to be both influenced by a deviation of 20° towards south, but the 6C BAz even up to 80°, the latter thus generally more scattered in comparison with the INGV-OE directions. Disagreement could possibly be related to the faults indicated in Fig. 1d, which have already been found to cause short wavelength discrepancies in the comparison of strain recorded by Distributed Dynamic Strain Sensing (DDSS) and the array derived strain (Currenti et al., 2021; Jousset et al., 2025). Station Bb22, which was also used in our study, seemed to be most affected by the faults (Currenti et al., 2021). Nevertheless, no significant waveform differences were observed between the array stations. The faults may affect the entire array, not just the nearest station. The INGV-OE network locations are constrained by an estimated 500 m uncertainty, making it difficult to even distinguish between northern and southern craters. If this separation is not possibly due to the uncertainties, then array back azimuths point at least mostly to the summit region, fitting visible activity in general. 6C LP event BAz results, from a point measurement, are possibly again affected by local heterogeneities, as LP event amplitudes and LP event SNR for the HJZ component do not show a clear effect on the BAz reference agreement. Low 6C SNR relative to the array, however, likely contribute to the increased scatter (Brotzer et al., 2025) observed in the results (Figs. 6, 7).
The frequency increase over the LP event time is interpreted as dispersion. Combined with the decrease in 6C phase velocity at higher frequencies, this behaviour is consistent with the presence of surface waves (Chouet et al., 1997; Bormann et al., 2012; Udías and Buforn, 2018). Rotational sensor recordings suggest a SH-wave dominated wavefield and the array-derived slownesses are typical for surface waves in volcanic media. The joint interpretation of array and rotational sensor results hence allow us to constrain that long-period events at Etna between 24 August to 6 September 2019 were predominantly composed of Love-waves. 6C LP phase velocities of mostly 0.4–0.7 km s−1, as mentioned by Eibl et al. (2022a) match the shear wave velocity range of 0.4–1.1 km s−1 obtained from distributed acoustic sensing (DAS) investigation on Mt. Etna (Jousset et al., 2022). Zuccarello et al. (2016) obtained the same range of shear wave velocities (0.4–0.7 km s−1) down to 130 m depth. Tremor array slowness values are around 1.2 s km−1 with high semblance and agree with expected surface wave slownesses from the analysis of a 2.4 magnitude VT event that occurred on 6 September 09:34 UTC at NEC. The 6C phase velocities correspond to higher slowness values of 2.2 to 2.8 s km−1 which is possibly related to local scattering.
We present a direct comparison between back azimuths derived from a seismic array and those obtained from a six-component-station of a rotational sensor and a seismometer in a volcanic setting. Differences in tremor and long-period event back azimuths between the two methods and in comparison with the network reference of the INGV-OE highlight the complexity and influence of the volcanic edifice. We conclude that low amplitude tremor leads to back azimuth disagreement between all three methods and none leads to directions indicating the actual surface activity. During high amplitude tremor, the INGV-OE network and array BAz overlap and point to the northern craters where strong Strombolian activity was observed. The 6C BAz, however, point back in a direction 20° further south, which is interpreted to result from topography or local heterogeneities. The array tremor slownesses indicate reliable results with slightly faster velocities during the eruption confirming a deeper tremor source. 6C phase velocities are higher and the disagreement might derive likewise from topographic influence or local structures. Eibl et al. (2022a) noted a mixed tremor wavefield during strong Strombolian activity. As the 6C method relies on the SH-type waves only, it can not be expected to represent the mixed wavefield directions accurately. Applying another method for SV-type waves on the horizontal components of the rotational sensor (Wassermann et al., 2020) resulted in expected directions towards the northern craters (Eibl et al., 2022a). Likewise, applying array processing on the horizontal array components for the low amplitude eruption phases mainly consisting of SH-type waves should result in more accurate directions too. We thus suggest adapting the methodology according to the wavefield once known.
As LP event back azimuths show southward deviation from the INGV-OE reference for both methods, we assume a strong topographic effect due to the volcanic site itself (Schick et al., 1982), which could to some extent also affect the array (Chouet et al., 1997; Eibl et al., 2017a). Nonetheless, array-derived BAz encompass the entire crater region and network locations yield uncertainties comprising the entire summit area as well. Scattered 6C BAz could derive from local heterogeneities (Singh et al., 2019) or the distance of the 6C set-up to the events (Izgi et al., 2025), as a direct influence of event SNR and amplitude could be excluded.
Sciotto et al. (2022) stated, that tremor amplitudes at Mt. Etna are more connected to volcanic activity, than the LP event amplitudes, which could be confirmed in terms of locations in our work. They deduce from their findings, that tremor and LP events at Mt. Etna most likely have different source mechanisms. Further possible interpretation of no clear correlation between LP events and other eruptions on Mt. Etna are given by De Barros et al. (2009); Cannata et al. (2009); Sciotto et al. (2022).
Adding more stations improves the array's ability to filter seismic signals based on their slowness and direction, allowing for better isolation of the target signals and suppression of unwanted energy (Schweitzer et al., 2012). Even more information could be obtained from a second array together with another 6C station at two different locations to derive event locations instead of directions while compensating for structural effects on the wavefield (Métaxian et al., 2002). Relocating the instruments to a different site of Mount Etna could offer a more detailed understanding of the path effects mentioned by Saccorotti et al. (2004). Finally, we recommend further investigation of the low-amplitude signals preceding the network-detected LP events to better constrain source information. Fibre optic technologies, of which rotational sensors, are promising for volcano monitoring in terms of understanding volcanic processes and structure (Jousset et al., 2025). We recommend more testing of rotational sensors in volcanic environments to understand specific influence of topography and scattering on both methods. While the array processing appears to provide more accurate directions of tremor and LP event signals, the rotational sensor facilitates wavefield separation. Outcomes of our study highlight the advantage of combining both approaches, resulting in improved volcano-seismic source characterization.
The rotational sensor and Bb17 data is available at GEOFON (https://doi.org/10.14470/ME7564062119; Eibl et al., 2022b). The seismic array data will be available at GEOFON (https://doi.org/10.14470/0/8V007505; Jousset, 2026). Array processing and 6C result files are available at Zenodo (https://doi.org/10.5281/zenodo.18754264; Vesely et al., 2026).
The supplement related to this article is available online at https://doi.org/10.5194/se-17-465-2026-supplement.
PJ, EE, and GC planned the campaign; EE, GC, and PJ installed the sensors; EE developed the conceptualization; NV and EE analysed the data; NV developed the visualisations and wrote the manuscript draft; EE, MO, GC, GdG, MS and PJ reviewed and edited the manuscript.
At least one of the (co-)authors is a member of the editorial board of Solid Earth. The peer-review process was guided by an independent editor, and the authors also have no other competing interests to declare.
Publisher's note: Copernicus Publications remains neutral with regard to jurisdictional claims made in the text, published maps, institutional affiliations, or any other geographical representation in this paper. The authors bear the ultimate responsibility for providing appropriate place names. Views expressed in the text are those of the authors and do not necessarily reflect the views of the publisher.
We thank the ”Geophysical Instrument Pool Potsdam” from GFZ for providing instruments and the “Parco dell’Etna” and the municipalities (Linguaglossa and Castiglione di Sicilia) for the permit to deploy the instruments in the Etna national park. This work was possible thanks to support with logistics and in the field of Daniel Vollmer from University of Potsdam and Danilo Contrafatto, Graziano Larocca, Daniele Pellegrino and Mario Pulvirenti from the Istituto Nazionale di Geofisica e Vulcanologia-Osservatorio Etneo (INGV-OE). Many thanks go to Gizem Izgi and the anonymous reviewers for improving comments and discussion.
This research was funded by the Deutsche Forschungsgemeinschaft (DFG, German Research Foundation) (grant no. 440761244).
This paper was edited by Antonella Longo and reviewed by two anonymous referees.
Almendros, J., Chouet, B., and Dawson, P.: Spatial extent of a hydrothermal system at Kilauea Volcano, Hawaii, determined from array analyses of shallow long-period seismicity: 1. Method, Journal of Geophysical Research: Solid Earth, 106, 13565–13580, https://doi.org/10.1029/2001JB000310, 2001. a
Almendros, J., Abella, R., Mora, M. M., and Lesage, P.: Array analysis of the seismic wavefield of long-period events and volcanic tremor at Arenal volcano, Costa Rica, Journal of Geophysical Research: Solid Earth, 119, 5536–5559, https://doi.org/10.1002/2013JB010628, 2014. a
Battaglia, J., Got, J.-L., and Okubo, P.: Location of long-period events below Kilauea Volcano using seismic amplitudes and accurate relative relocation, Journal of Geophysical Research: Solid Earth, 108, https://doi.org/10.1029/2003JB002517, 2003. a
Battaglia, J., Aki, K., and Ferrazzini, V.: Location of tremor sources and estimation of lava output using tremor source amplitude on the Piton de la Fournaise volcano: 1. Location of tremor sources, Journal of Volcanology and Geothermal Research, 147, 268–290, https://doi.org/10.1016/j.jvolgeores.2005.04.005, 2005. a, b
Bernauer, F., Wassermann, J., Guattari, F., Frenois, A., Bigueur, A., Gaillot, A., de Toldi, E., Ponceau, D., Schreiber, U., and Igel, H.: BlueSeis3A: Full Characterization of a 3C Broadband Rotational Seismometer, Seismol. Res. Lett., 89, 620–629, https://doi.org/10.1785/0220170143, 2018. a
Bernauer, F., Behnen, K., Wassermann, J., Egdorf, S., Igel, H., Donner, S., Stammler, K., Hoffmann, M., Edme, P., Sollberger, D., Schmelzbach, C., Robertsson, J., Paitz, P., Igel, J., Smolinski, K., Fichtner, A., Rossi, Y., Izgi, G., Vollmer, D., Eibl, E. P. S., Buske, S., Veress, C., Guattari, F., Laudat, T., Mattio, L., Sèbe, O., Olivier, S., Lallemand, C., Brunner, B., Kurzych, A. T., Dudek, M., Jaroszewicz, L. R., Kowalski, J. K., Bońkowski, P. A., Bobra, P., Zembaty, Z., Vackář, J., Málek, J., and Brokesova, J.: Rotation, Strain, and Translation Sensors Performance Tests with Active Seismic Sources, Sensors, 21, https://doi.org/10.3390/s21010264, 2021. a
Beyreuther, M., Barsch, R., Krischer, L., Megies, T., Behr, Y., and Wassermann, J.: ObsPy: A Python Toolbox for Seismology, Seismological Research Letters, 81, 530–533, https://doi.org/10.1785/gssrl.81.3.530, 2010. a, b
Bormann, P., Engdahl, B., and Kind, R.: Seismic Wave Propagation and Earth models, in: New Manual of Seismological Observatory Practice 2 (NMSOP-2), edited by: Bormann, P., Deutsches GeoForschungsZentrum GFZ, Potsdam, 1–105, https://doi.org/10.2312/GFZ.NMSOP-2_ch2, 2012. a
Brotzer, A., Igel, H., Bernauer, F., Wassermann, J., Mellors, R., and Vernon, F.: On single-station, six degree-of-freedom observations of local to regional seismicity at the Piñon Flat Observatory in Southern California, Seismica, 4, https://doi.org/10.26443/seismica.v4i1.1416, 2025. a, b, c
Buttkus, B.: Multidimensional Filters, Springer Berlin Heidelberg, Berlin, Heidelberg, 549–580, ISBN 978-3-642-57016-2, https://doi.org/10.1007/978-3-642-57016-2_25, 2000. a
Cannata, A., Catania, A., Alparone, S., and Gresta, S.: Volcanic tremor at Mt. Etna: Inferences on magma dynamics during effusive and explosive activity, Journal of Volcanology and Geothermal Research, 178, 19–31, https://doi.org/10.1016/j.jvolgeores.2007.11.027, 2008. a, b
Cannata, A., Hellweg, M., Di Grazia, G., Ford, S., Alparone, S., Gresta, S., Montalto, P., and Patanè, D.: Long period and very long period events at Mt. Etna volcano: Characteristics, variability and causality, and implications for their sources, Journal of Volcanology and Geothermal Research, 187, 227–249, https://doi.org/10.1016/j.jvolgeores.2009.09.007, 2009. a, b, c
Cannata, A., Di Grazia, G., Montalto, P., Ferrari, F., Nunnari, G., Patanè, D., and Privitera, E.: New insights into banded tremor from the 2008–2009 Mount Etna eruption, Journal of Geophysical Research: Solid Earth, 115, https://doi.org/10.1029/2009JB007120, 2010. a
Cannata, A., Di Grazia, G., Aliotta, M., Cassisi, C., Montalto, P., and Patanè, D.: Monitoring Seismo-volcanic and Infrasonic Signals at Volcanoes: Mt. Etna Case Study, Pure and Applied Geophysics, 170, https://doi.org/10.1007/s00024-012-0634-x, 2013. a, b, c, d, e, f
Cannata, A., Di Grazia, G., Giuffrida, M., Gresta, S., Palano, M., Sciotto, M., Viccaro, M., and Zuccarello, F.: Space-Time Evolution of Magma Storage and Transfer at Mt. Etna Volcano (Italy): The 2015–2016 Reawakening of Voragine Crater, Geochemistry, Geophysics, Geosystems, 19, 471–495, https://doi.org/10.1002/2017GC007296, 2018. a
Cannavo', F., Sciotto, M., Cannata, A., and Di Grazia, G.: An Integrated Geophysical Approach to Track Magma Intrusion: The 2018 Christmas Eve Eruption at Mount Etna, Geophysical Research Letters, 46, 8009–8017, https://doi.org/10.1029/2019GL083120, 2019. a
Chouet, B.: Resonance of a fluid-driven crack: Radiation properties and implications for the source of long-period events and harmonic tremor, Journal of Geophysical Research: Solid Earth, 93, 4375–4400, https://doi.org/10.1029/JB093iB05p04375, 1988. a
Chouet, B.: Long-period volcano seismicity: its source and use in eruption forecasting, Nature, 380, 309–316, https://doi.org/10.1038/380309a0, 1996a. a
Chouet, B.: Volcano Seismology, pure and applied geophysics, Pure Appl. Geophys., 160, 739–788, https://doi.org/10.1007/PL00012556, 2003. a, b
Chouet, B.: Volcanoes, Non-linear Processes in, in: Complexity in Tsunamis, Volcanoes, and their Hazards, Springer New York, NY, 469–502, ISBN 978-1-0716-1705-2, https://doi.org/10.1007/978-1-0716-1705-2, 2009. a
Chouet, B. and Matoza, R. S.: A multi-decadal view of seismic methods for detecting precursors of magma movement and eruption, Journal of Volcanology and Geothermal Research, 252, 108–175, https://doi.org/10.1016/j.jvolgeores.2012.11.013, 2013. a
Chouet, B., Saccorotti, G., Martini, M., Dawson, P., De Luca, G., Milana, G., and Scarpa, R.: Source and path effects in the wave fields of tremor and explosions at Stromboli Volcano, Italy, Journal of Geophysical Research: Solid Earth, 102, 15129–15150, https://doi.org/10.1029/97JB00953, 1997. a, b, c
Chouet, B. A.: New Methods and Future Trends in Seismological Volcano Monitoring, Springer Berlin Heidelberg, Berlin, Heidelberg, 23–97, ISBN 978-3-642-80087-0, https://doi.org/10.1007/978-3-642-80087-0_2, 1996b. a
Cochard, A., Igel, H., Schuberth, B., Suryanto, W., Velikoseltsev, A., Schreiber, U., Wassermann, J., Scherbaum, F., and Vollmer, D.: Rotational Motions in Seismology: Theory, Observation, Simulation, in: Earthquake Source Asymmetry, Structural Media and Rotation Effects, edited by: Teisseyre, R., Majewski, E., and Takeo, M., Springer Berlin Heidelberg, Berlin, Heidelberg, 391–411, ISBN 978-3-540-31337-3, https://doi.org/10.1007/3-540-31337-0_30, 2006. a, b, c
Currenti, G. and Bonaccorso, A.: Cyclic magma recharge pulses detected by high-precision strainmeter data: the case of 2017 inter-eruptive activity at Etna volcano, Scientific Reports, 9, 1–7, https://doi.org/10.1038/s41598-019-44066-w, 2019. a
Currenti, G., Jousset, P., Napoli, R., Krawczyk, C., and Weber, M.: On the comparison of strain measurements from fibre optics with a dense seismometer array at Etna volcano (Italy), Solid Earth, 12, 993–1003, https://doi.org/10.5194/se-12-993-2021, 2021. a, b, c, d
De Barros, L., Bean, C. J., Lokmer, I., Saccorotti, G., Zuccarello, L., O'Brien, G. S., Métaxian, J.-P., and Patanè, D.: Source geometry from exceptionally high resolution long period event observations at Mt Etna during the 2008 eruption, Geophysical Research Letters, 36, https://doi.org/10.1029/2009GL041273, 2009. a, b
Di Grazia, G., Falsaperla, S., and Langer, H.: Volcanic tremor location during the 2004 Mount Etna lava effusion, Geophysical Research Letters, 33, https://doi.org/10.1029/2005GL025177, 2006. a, b, c, d
Donner, S.: Chapter Three – Rotational ground motion measurements for regional seismic moment tensors: A review, in: Inversion of Geophysical Data, edited by: Schmelzbach, C., 62 Advances in Geophysics, 141–186, Elsevier, https://doi.org/10.1016/bs.agph.2021.06.002, 2021. a, b, c, d
Douglas, A.: 23 – Seismometer Arrays – Their Use in Earthquake and Test Ban Seismology, in: International Handbook of Earthquake and Engineering Seismology, edited by: Lee, W. H., Kanamori, H., Jennings, P. C., and Kisslinger, C., vol. 81 of International Geophysics, 357–367, Academic Press, https://doi.org/10.1016/S0074-6142(02)80226-1, 2002. a
Efron, B.: The Jackknife, the Bootstrap and Other Resampling Plans, Society for Industrial and Applied Mathematics, https://doi.org/10.1137/1.9781611970319, 1982. a
Eibl, E. P. S., Bean, C., Jónsdóttir, I., Hoskuldsson, A., Thordarson, T., Coppola, D., Witt, T., and Walter, T. R.: Multiple Coincident Eruptive Seismic Tremor Sources During the 2014-2015 Eruption at Holuhraun, Iceland, Journal of Geophysical Research: Solid Earth, 122, https://doi.org/10.1002/2016JB013892, 2017a. a, b, c, d
Eibl, E. P. S., Bean, C., Vogfjörd, K., Ying, Y., Lokmer, I., Möllhoff, M., O'Brien, G., and Pálsson, F.: Tremor-rich shallow dyke formation followed by silent magma flow at Bárdarbunga in Iceland, Nature Geoscience, 10, 299–304, https://doi.org/10.1038/ngeo2906, 2017b. a
Eibl, E. P. S., Bean, C. J., Einarsson, B., Pàlsson, F., and Vogfjörd, K. S.: Seismic ground vibrations give advanced early-warning of subglacial floods, Nature Communications, 11, https://doi.org/10.1038/s41467-020-15744-5, 2020. a
Eibl, E. P. S., Rosskopf, M., Sciotto, M., Currenti, G., Di Grazia, G., Jousset, P., Krüger, F., and Weber, M.: Performance of a Rotational Sensor to Decipher Volcano Seismic Signals on Etna, Italy, Journal of Geophysical Research: Solid Earth, 127, e2021JB023617, https://doi.org/10.1029/2021JB023617, 2022a. a, b, c, d, e, f, g, h, i, j, k, l, m, n, o, p, q
Eibl, E. P. S., Vollmer, D., Jousset, P., Currenti, G., Contrafatto, D., Larocca, G., Pellegrino, D., and Pulvirenti, M.: 1-month seismological experiment on Etna, Italy in 2019, GFZ Data Services [data set], https://doi.org/10.14470/ME7564062119, 2022b. a
Eibl, E. P. S., Vogfjörd, K. S., Ófeigsson, B. G., Roberts, M. J., Bean, C. J., Jones, M. T., Bergsson, B. H., Heimann, S., and Dietrich, T.: Subaerial and subglacial seismic characteristics of the largest measured jökulhlaup from the eastern Skaftá cauldron, Iceland, Earth Surf. Dynam., 11, 933–959, https://doi.org/10.5194/esurf-11-933-2023, 2023. a
Ferrazzini, V., Aki, K., and Chouet, B.: Characteristics of seismic waves composing Hawaiian volcanic tremor and gas-piston events observed by a near-source array, Journal of Geophysical Research: Solid Earth, 96, 6199–6209, https://doi.org/10.1029/90JB02781, 1991. a
Hadziioannou, C., Gaebler, P., Schreiber, K., Wassermann, J., and Igel, H.: Examining ambient noise using colocated measurements of rotational and translational motion, Journal of Seismology, 16, https://doi.org/10.1007/s10950-012-9288-5, 2012. a, b, c, d
Heimann, S., Kriegerowski, M., Isken, M., Cesca, S., Daout, S., Grigoli, F., Juretzek, C., Megies, T., Nooshiri, N., Steinberg, A., Sudhaus, H., Vasyura-Bathke, H., Willey, T., and Dahm, T.: Pyrocko – An open-source seismology toolbox and library, GFZ Data Services, https://doi.org/10.5880/GFZ.2.1.2017.001, 2017. a, b
Izgi, G., Eibl, E. P. S., Donner, S., and Bernauer, F.: Performance Test of the Rotational Sensor blueSeis-3A in a Huddle Test in Fürstenfeldbruck, Sensors, 21, 3170, https://doi.org/10.3390/s21093170, 2021. a, b
Izgi, G., Eibl, E. P. S., Krueger, F., and Bernauer, F.: Direction finding in an active source experiment in Fürstenfeldbruck, Germany using 6 DoF measurements, Geophysical Journal International, 240, 2042–2059, https://doi.org/10.1093/gji/ggaf021, 2025. a, b
Jousset, P.: Broadband seismic data and fibre optic technologies for dense monitoring and quantification of volcanic events (INFRADAS), GFZ Data Services. Dataset/Seismic Network [data set], https://doi.org/10.14470/0/8V007505, 2026. a
Jousset, P., Neuberg, J., and Sturton, S.: Modelling the time-dependent frequency content of low-frequency volcanic earthquakes, J. Volcanol. Geoth. Res., 128, 201–223, https://doi.org/10.1016/S0377-0273(03)00255-5, 2003. a
Jousset, P., Currenti, G., Schwarz, B., Chalari, A., Tilmann, F., Reinsch, T., Zuccarello, L., Privitera, E., and Krawczyk, C. M.: Fibre optic distributed acoustic sensing of volcanic events, Nature Communications, 13, https://doi.org/10.1038/s41467-022-29184-w, 2022. a
Jousset, P., Currenti, G., Murphy, S., Eibl, E. P. S., Caudron, C., Retailleau, L., Wollin, C., Klaasen, S., Nishimura, T., Fichtner, A., Spica, Z., Lemarchand, A., and Krawczyk, C.: Fiber Optic Sensing for Volcano Monitoring and Imaging Volcanic Processes, in: Modern Volcano Monitoring, edited by Spica, Z. and Caudron, C., Springer Nature Switzerland, Cham, ISBN 978-3-031-86841-2, 509–567, https://doi.org/10.1007/978-3-031-86841-2_17, 2025. a, b
Keil, S., Wilczek, A., Wassermann, J., and Kremers, S.: Comparing single-station 6C measurements and array measurements for seismic microzonation in Munich, Germany, Geophysical Journal International, 231, 1634–1652, https://doi.org/10.1093/gji/ggac273, 2022. a, b, c, d, e, f
McNutt, S. R.: 25 – Volcano Seismology and Monitoring for Eruptions, in: International Handbook of Earthquake and Engineering Seismology, edited by: Lee, W. H., Kanamori, H., Jennings, P. C., and Kisslinger, C., vol. 81 of International Geophysics, 383–406, Academic Press, https://doi.org/10.1016/S0074-6142(02)80228-5, 2002. a, b, c, d
Métaxian, J.-P., Lesage, P., and Valette, B.: Locating sources of volcanic tremor and emergent events by seismic triangulation: Application to Arenal volcano, Costa Rica, Journal of Geophysical Research: Solid Earth, 107, ECV 10-1–ECV 10-18, https://doi.org/10.1029/2001JB000559, 2002. a, b
Neuberg, J., Luckett, R., Baptie, B., and Olsen, K.: Models of tremor and low-frequency earthquake swarms on Montserrat, Journal of Volcanology and Geothermal Research, 101, 83–104, https://doi.org/10.1016/S0377-0273(00)00169-4, 2000. a
Rost, S. and Thomas, C.: Array Seismology: Methods and Aapplications, Reviews of Geophysics, 40, 2-1–2-27, https://doi.org/10.1029/2000RG000100, 2002. a, b, c, d
Saccorotti, G., Chouet, B., and Dawson, P.: Wavefield properties of a shallow long-period event and tremor at Kilauea Volcano, Hawaii, Journal of Volcanology and Geothermal Research, 109, 163–189, https://doi.org/10.1016/S0377-0273(00)00310-3, 2001. a
Saccorotti, G., Zuccarello, L., Del Pezzo, E., Ibanez, J., and Gresta, S.: Quantitative analysis of the tremor wavefield at Etna Volcano, Italy, Journal of Volcanology and Geothermal Research, 136, 223–245, https://doi.org/10.1016/j.jvolgeores.2004.04.003, 2004. a, b, c
Scarfì, L., Aloisi, M., Barberi, G., and Langer, H.: Observing Etna volcano dynamics through seismic and deformation patterns, Scientific Reports, 13, 12951, https://doi.org/10.1038/s41598-023-39639-9, 2023. a
Schick, R., Cosentino, M., Lombardo, G., and Patanè, G.: Volcanic tremor at Mount Etna. A brief description, Mem. Soc. Geol. Ital., 23, 191–196, 1982. a, b
Schweitzer, J., Fyen, J., Mykkeltveit, S., Gibbons, S. J., Pirli, M., Kühn, D., and Kværna, T.: Seismic Arrays, in: New Manual of Seismological Observatory Practice 2 (NMSOP-2), edited by Bormann, P., pp. 1–80, Deutsches GeoForschungsZentrum GFZ, Potsdam, https://doi.org/10.2312/GFZ.NMSOP-2_ch9, 2012. a, b, c, d, e
Sciotto, M., Cannata, A., Di Grazia, G., and Montalto, P.: Volcanic tremor and long period events at Mt. Etna: Same mechanism at different rates or not?, Physics of the Earth and Planetary Interiors, 324, 106850, https://doi.org/10.1016/j.pepi.2022.106850, 2022. a, b, c, d
Singh, S., Capdeville, Y., and Igel, H.: Correcting wavefield gradients for the effects of local small-scale heterogeneities, Geophysical Journal International, 220, 996–1011, https://doi.org/10.1093/gji/ggz479, 2019. a, b
Soubestre, J., Seydoux, L., Shapiro, N. M., de Rosny, J., Droznin, D. V., Droznina, S. Y., Senyukov, S. L., and Gordeev, E. I.: Depth Migration of Seismovolcanic Tremor Sources Below the Klyuchevskoy Volcanic Group (Kamchatka) Determined From a Network-Based Analysis, Geophysical Research Letters, 46, 8018–8030, https://doi.org/10.1029/2019GL083465, 2019. a
Trnkoczy, A.: Understanding and parameter setting of STA/LTA trigger algorithm, in: New Manual of Seismological Observatory Practice 2 (NMSOP-2), edited by: Bormann, P., 1–20, Deutsches GeoForschungsZentrum GFZ, Potsdam, Germany, https://doi.org/10.2312/GFZ.NMSOP-2_IS_8.1, 2012. a
Udías, A. and Buforn, E.: Principles of Seismology, Cambridge University Press, 2 edn., ISBN 9781107138698, 2018. a
Vesely, N. I. K., Eibl, E., and Ohrnberger, M.: Seismic array and rotational sensor processing results of tremor, long-period and volcanic-tectonic events on Mount Etna in August, September 2019, Zenodo [data set], https://doi.org/10.5281/zenodo.18754264, 2026. a
Wassermann, J.: Locating the sources of volcanic explosions and volcanic tremor at Stromboli volcano (Italy) using beam-forming on diffraction hyperboloids, Physics of the Earth and Planetary Interiors, 104, 271–281, https://doi.org/10.1016/S0031-9201(97)00041-1, 1997. a, b, c
Wassermann, J., Wietek, A., Hadziioannou, C., and Igel, H.: Toward a Single-Station Approach for Microzonation: Using Vertical Rotation Rate to Estimate Love-Wave Dispersion Curves and Direction Finding, Bulletin of the Seismological Society of America, https://doi.org/10.1785/0120150250, 2016. a
Wassermann, J., Bernauer, F., Shiro, B., Johanson, I., Guattari, F., and Igel, H.: Six-Axis Ground Motion Measurements of Caldera Collapse at Kīlauea Volcano, Hawai'i–More Data, More Puzzles?, Geophysical Research Letters, 47, e2019GL085999, https://doi.org/10.1029/2019GL085999, 2020. a, b, c
Wassermann, J., Braun, T., Ripepe, M., Bernauer, F., Guattari, F., and Igel, H.: The use of 6DOF measurement in volcano seismology – A first application to Stromboli volcano, Journal of Volcanology and Geothermal Research, 424, 107499, https://doi.org/10.1016/j.jvolgeores.2022.107499, 2022. a, b
Yilmaz, Ö. and Doherty, S.: Seismic Data Analysis: Processing, Inversion, and Interpretation of Seismic Data, Nr. 10, Bd. 2, Society of Exploration Geophysicists, 2 edn., ISBN 1-56080-099-2, 2001. a
Zobin, V. M.: Chapter 12 – Volcanic Tremor, in: Introduction to Volcanic Seismology (Third Edition), edited by: Zobin, V. M., Elsevier, Oxford, third edition edn., 263–288, ISBN 978-0-444-63631-7, https://doi.org/10.1016/B978-0-444-63631-7.00012-1, 2017. a
Zuccarello, L., Paratore, M., La Rocca, M., Ferrari, F., Messina, A., Branca, S., Contrafatto, D., Galluzzo, D., Rapisarda, S., and García, L.: Shallow velocity model in the area of Pozzo Pitarrone, Mt. Etna, from single station, array methods and borehole data, Annals of Geophysics, 59, https://doi.org/10.4401/ag-7086, 2016. a, b
Zuccarello, L., De Angelis, S., Minio, V., Saccorotti, G., Bean, C. J., Paratore, M., and Ibanez, J. M.: Volcanic Tremor Tracks Changes in Multi-Vent Activity at Mt. Etna, Italy: Evidence From Analyses of Seismic Array Data, Geophysical Research Letters, 49, e2022GL100056, https://doi.org/10.1029/2022GL100056, 2022. a, b