the Creative Commons Attribution 4.0 License.
the Creative Commons Attribution 4.0 License.
 | 12 May 2026
Patterns of contemporary horizontal stress orientation in the Earth's crust derived from the World Stress Map Database 2025
Oliver Heidbach
Knowledge of the present-day stress field of the Earth's crust is essential for understanding geodynamic processes, as well as for the exploration and management of geo-reservoirs. The World Stress Map (WSM) project provides the only open-access global database of crustal stress information. To mark the project's 40th anniversary, the WSM database has been substantially updated, and now contains more than twice the number of data records on the orientation of maximum horizontal stress (SHmax) in comparison to the previous release in 2016. The new database includes 100 842 quality-ranked data records documenting the SHmax orientation in the Earth's crust. As stress data records are clustered around plate boundaries and in sedimentary basins, we provide mean SHmax orientation estimates on regular global grids of 2, 1, 0.5 and 0.2° using search radii between 50 and 500 km to facilitate the analysis of stress patterns. The results reveal that in intraplate regions, where stress data density has increased significantly, the earlier hypothesis that plate boundary forces and relative plate motion primarily control the SHmax orientation needs to be revised. The SHmax orientation rotates in some areas by more than 50° over spatial scales of 50–500 km. Two notable examples include an ∼ 50° rotation of the SHmax orientation in the Alpine foreland, from N–S in the East to NW–SE in the West, and SHmax orientation rotations > 50° over distances of less than 100 km in eastern Australia.
- Article
(9939 KB) - Full-text XML
- BibTeX
- EndNote


The present-day stress field of the Earth's crust is a key physical quantity for understanding geodynamic processes, such as global plate tectonics and earthquakes. With the anticipated increase in subsurface use, such as the exploration of deep geothermal reservoirs and geo-energy storage, new and modified utilisation concepts place additional demands on geomechanical integrity and long-term stability, making knowledge of crustal stress equally essential for applied research (Segall and Fitzgerald, 1998; Henk, 2008; Zoback, 2010; Addis, 2017; Ziegler et al., 2024).
Stress data for the upper crust were first collected in the 1930s using surface relief methods. In the 1950s, flat jack and borehole relief methods were introduced, followed by hydraulic fracturing in the 1970s to measure the magnitude of the least principal stress (Amadei and Stephansson, 1997). The late 1970s saw the use of borehole breakouts as an additional stress indicator (Bell and Gough, 1979; Hottman et al., 1979; Plumb and Hickman, 1985). Furthermore, the expansion of global seismological networks in the 1960s led to increased use of earthquake focal mechanisms as stress indicators for the deeper part of the Earth's crust (Dziewonski et al., 1981). These advancements, along with other stress indicators from engineering, geological, and geophysical methods, ultimately led to the initiation of the World Stress Map (WSM) project in 1986 as a task force of the International Lithosphere Program.
The initial objective of the WSM was to test Voigth's mid-1960s hypothesis that plate tectonics forces predominantly control the orientation of the maximum horizontal stress (SHmax) in the Earth's crust (Voight et al., 1968). This hypothesis was broadly supported by the first release of the WSM database in 1989, which included 3574 quality-ranked data records (Zoback et al., 1989). However, the subsequent 1992 release, containing approximately 7300 data records, already revealed second-order contributions from lateral density and strength contrasts, producing stress patterns of the SHmax orientation with wavelengths on the order of several hundred kilometres (Zoback, 1992). The further expanded WSM database 2005, comprising 15 969 data records, confirmed these second-order patterns and also showed examples for rotations of the SHmax orientation on smaller scales (Heidbach et al., 2007). The new 2025 release of the WSM, with 100 842 data records, allows these local rotations to be resolved in greater detail.
This paper presents the 2025 database release of the WSM project based on a revised quality-ranking scheme for SHmax orientation data records. Because data records are strongly clustered, we also provide 13 datasets of the mean SHmax orientation on global grids, filtered for different wavelengths of the crustal stress pattern of the SHmax orientation.
The backbone of the WSM is its quality-ranking scheme for the data records, which enables the integration of rock stress information from different methods that sample very different rock volumes (Ljunggren et al., 2003). Most techniques used to estimate individual components of the 3D stress tensor rely on observed deformations, from which the relevant stress information is derived (Amadei and Stephansson, 1997; Zang and Stephansson, 2010; Zoback, 2010; Schmitt et al., 2012). The only exception is microhydraulic fracturing tests in boreholes, where fluid pressure is directly measured as an equivalent of the minimum principal stress magnitude (Thiercelin et al., 1996; Haimson and Cornet, 2003; Schmitt and Haimson, 2018; Desroches et al., 2023). For this reason, the WSM uses the term stress indicator for the applied methods rather than stress measurement.
Since the WSM aims at in-situ stress, i.e. the undisturbed stress field, some of the relief methods, flat jack and borehole slotter are not used. These methods are performed close to a free surface (borehole, cavern, tunnel) which means that they are probably affected by induced stress changes to some extend (Amadei and Stephansson, 1997). The WSM employs eight established stress indicators: overcoring (OC), hydraulic fracturing (HF), borehole breakout (BO), drilling induced tensile fracture (DIF), geological fault slip (GFI), volcanic alignments (GVA), single earthquake focal mechanism (FMS), and inversion of several earthquake focal mechanisms (FMF) (Zoback and Zoback, 1991; Zoback, 1992; Sperner et al., 2003; Rajabi et al., 2025). These stress indicators act on spatial scales ranging from 10−3 m3 (OC) to 109 m3 (FMS) (Ljunggren et al., 2003; Zang and Stephansson, 2010). Each method also carries implicit assumptions about how stress information is derived. To enable the integration of these diverse stress indicators, the WSM uses a quality-ranking scheme based on the number, accuracy, and depth of the information provided.
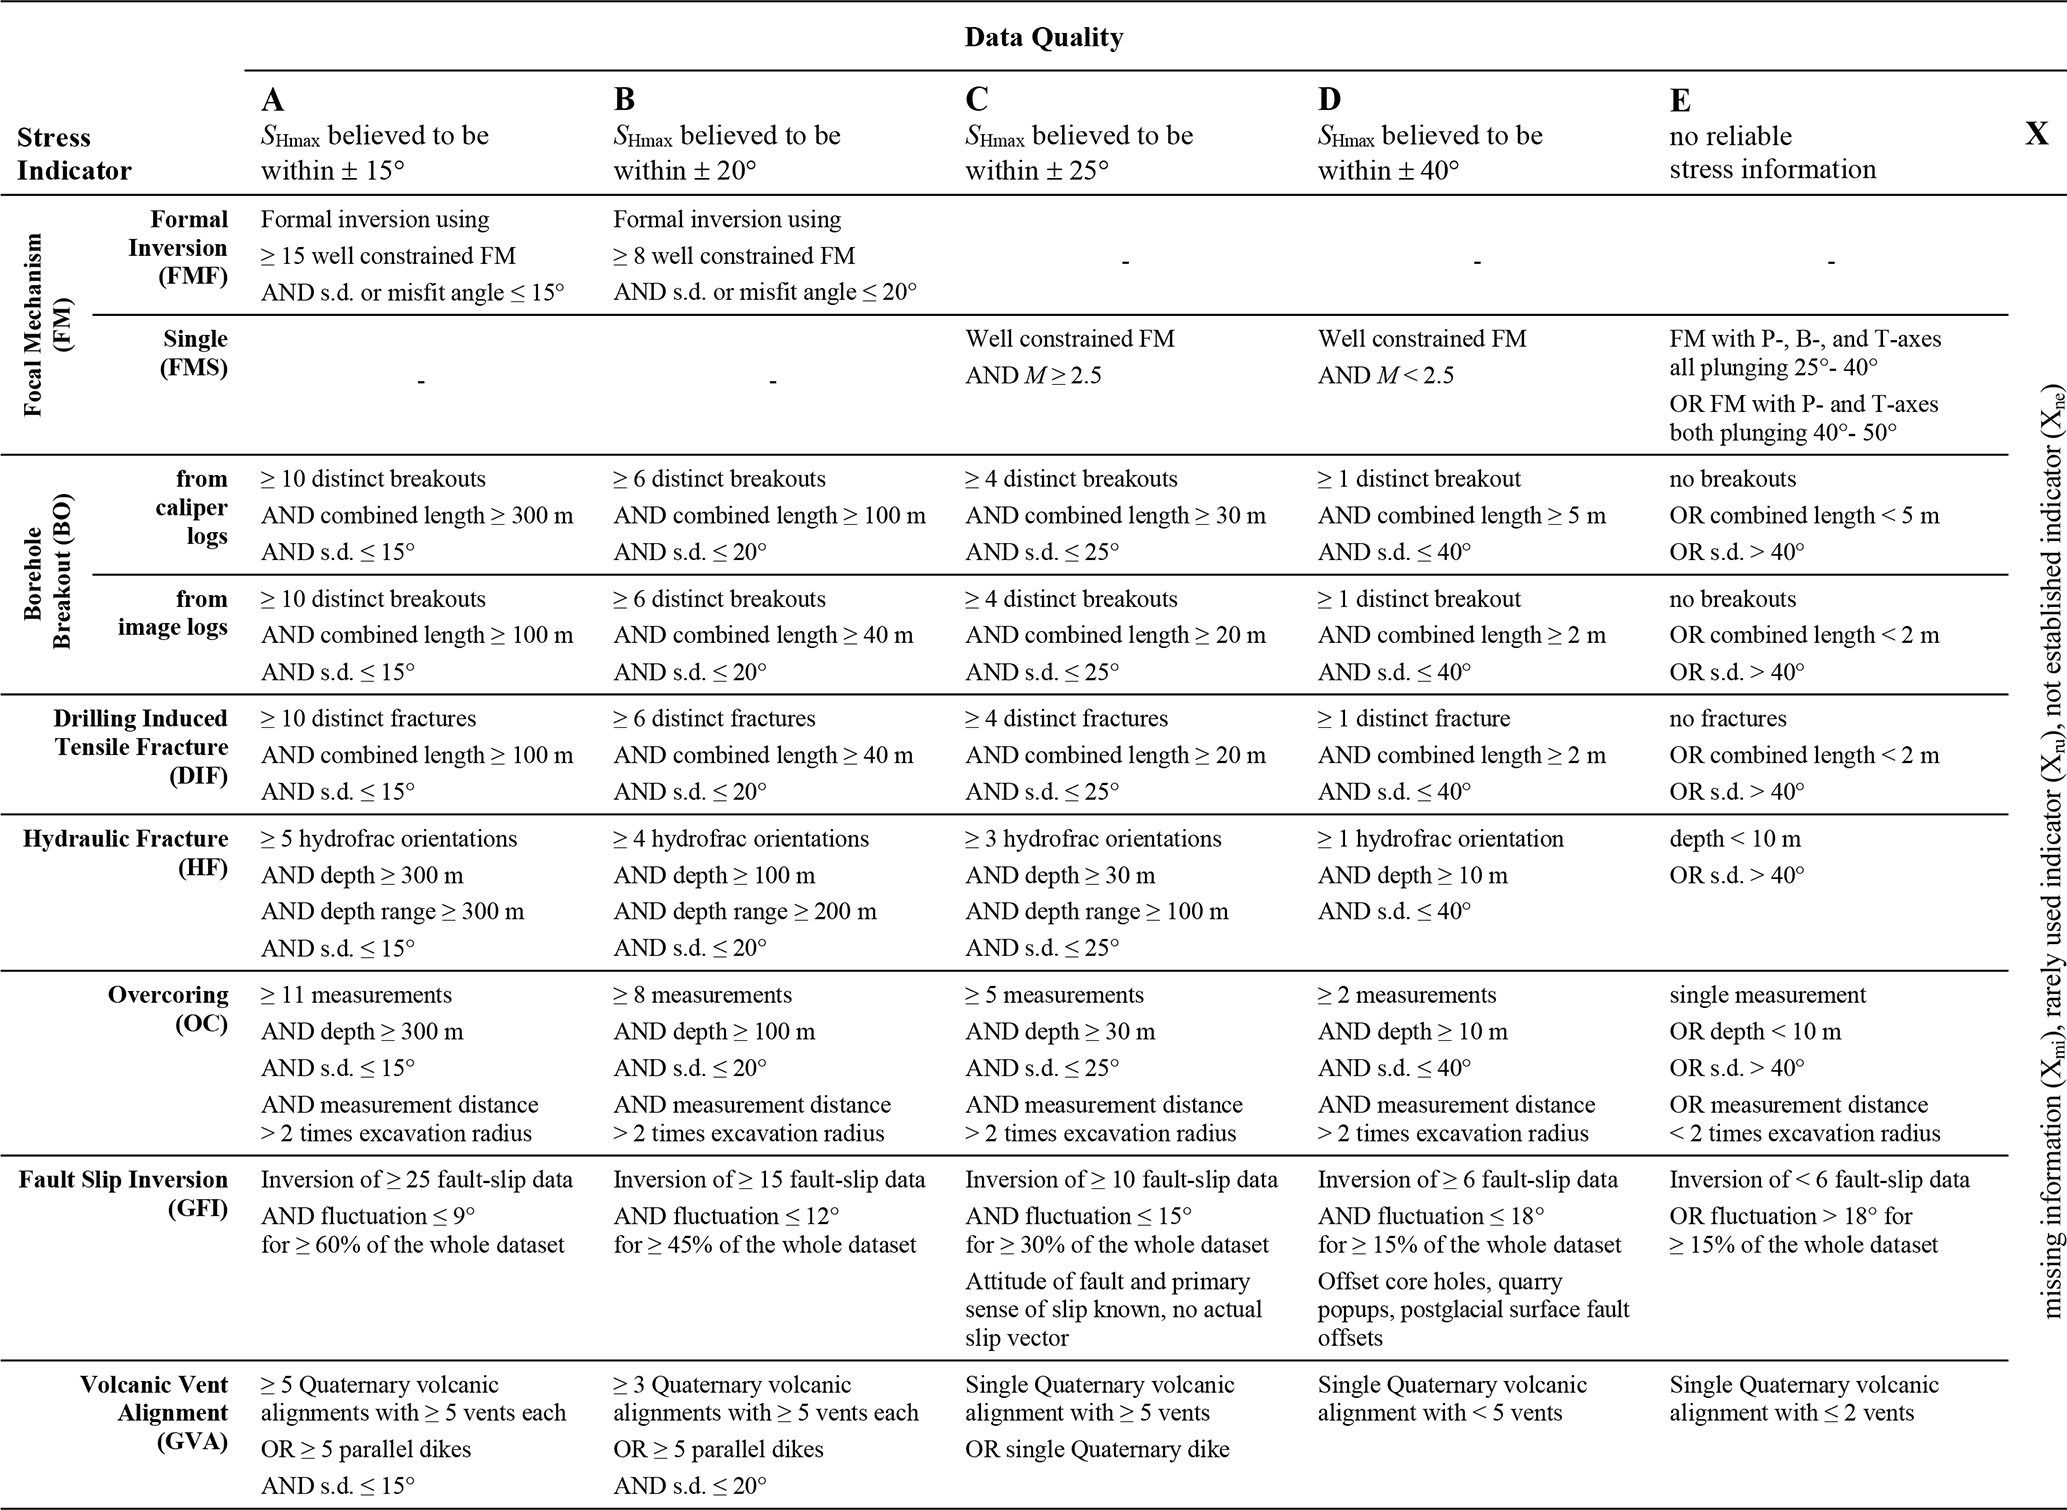
The quality-ranking scheme was initially introduced by Zoback and Zoback (1989), summarized by Mary-Lou Zoback (1992), refined and extended by Sperner et al. (2003), and updated by Heidbach et al. (2010). Each data record is assigned a quality between A and E, with A representing the highest quality and E the lowest. An A-quality indicates that the SHmax orientation is accurate within ±15°, B-quality within ±20°, C-quality within ±25°, and D-quality within ±40°. For most stress indicators, these quality classes are defined based on the standard deviation of the SHmax orientation, with E-quality data records typically exceeding a standard deviation of 40°. In general, data records assigned to A-, B-, and C-quality classes are considered reliable for analysing stress patterns and interpreting geodynamic processes.
For the 2025 release of the WSM, the quality-ranking scheme was refined to reflect the latest technical developments and to define clear rules for quality assignment in a format suitable for implementation in Python routines to enable the automated assignment of quality in the new WSM database infrastructure MaRS (Management and Repository of Stress) (Rajabi et al., 2025). The updated version presented in Table 1 contains the following changes in comparison to the version from 2010 presented by Heidbach et al. (2010):
-
Introduction of a X-quality class with three sub-classes. Xmi: Data records with missing information needed for a final quality assignment. Xru: Data records derived from rarely used stress indicators. Xne: Data records derived from stress indicators that are not well established yet.
-
Removal of the three rarely used stress indicator borehole slotter (BS), average of focal mechanisms (FMA), and petal centerlines (PC) from the quality-ranking scheme. This affected 464 data records and most of them are from FMA data records (n= 429). For book-keeping purposes these data records are now assigned to the X-quality sub-class Xru.
-
Refinement of the rules for assessing D- or E-quality to stress indicator data records derived from BOs, DIFs, HFs and OCs. In the earlier versions, the criteria was not clear. For example, for BO data records derived from caliper logs, it was stated that a D-quality could be assigned if fewer than four breakouts were detected, or if the combined BO length was less than 30 m (and a standard deviation < 40°). This allowed even a single very short BO to be classified as D-quality, which is not meaningful. This has now been revised accordingly (see Table 1).
-
Addition of a requirement for the OC data records, explicitly stating that the measurement must be obtained from a site located at least twice the excavation radius away.
-
Addition of a requirement for the GVA data records, now explicitly providing the number of vents and the number of volcanic alignments.
Further details on the updated WSM quality-ranking scheme, descriptions of stress indicators, new guidelines for the analysing of borehole logs, and technical details of the WSM 2025 database are provided in the WSM Technical Report 25-01 (Rajabi et al., 2025).
Table 1New WSM quality ranking scheme 2025. s.d. denotes standard deviation and M the magnitude of the earthquake.
As outlined above, the new WSM 2025 database contains 100 842 data records (Table 2), more than double the number in the previous 2016 release (Heidbach et al., 2018). This expansion is largely due to the integration of the global compilation of earthquake focal mechanisms from the International Seismological Commission (ISC) (Lentas et al., 2019), and the addition of more than 4000 new data records derived from boreholes across the world.
Furthermore, in this WSM release, the earlier depth limit of 40 km for data compilation has been replaced by a global crustal model from Szwillus et al. (2019) to determine if an FMS data record lies within or below the crust. According to this model, the thickness of the crust varies between 7.2 and 74.9 km, with standard deviations between 0.1 and 11.9 km. We used the reported hypocentral depth and its standard deviation to assess whether an earthquake occurred within the crust or not. For certain special study areas that have been investigated in more detail, comprehensive local compilations of earthquake focal mechanisms are used instead of the ISC dataset for the relevant time period. Full details and references for these areas are provided in the WSM Technical Report WSM TR 25-01 (Rajabi et al., 2025).
Table 2Data records of the new WSM database 2025 sorted in classes of data quality and stress indicators. The discrepancy of 792 data records to the entire WSM 2025 dataset with 100 842 data records is due to the missing data records from stress indicators that are rarely used (Xru-quality for BS, PC, FMA) and those from methods that are not yet established as reliable stress indicators (Xne-quality). Details are given the WSM Technical Report TR 25-01 (Rajabi et al., 2025).
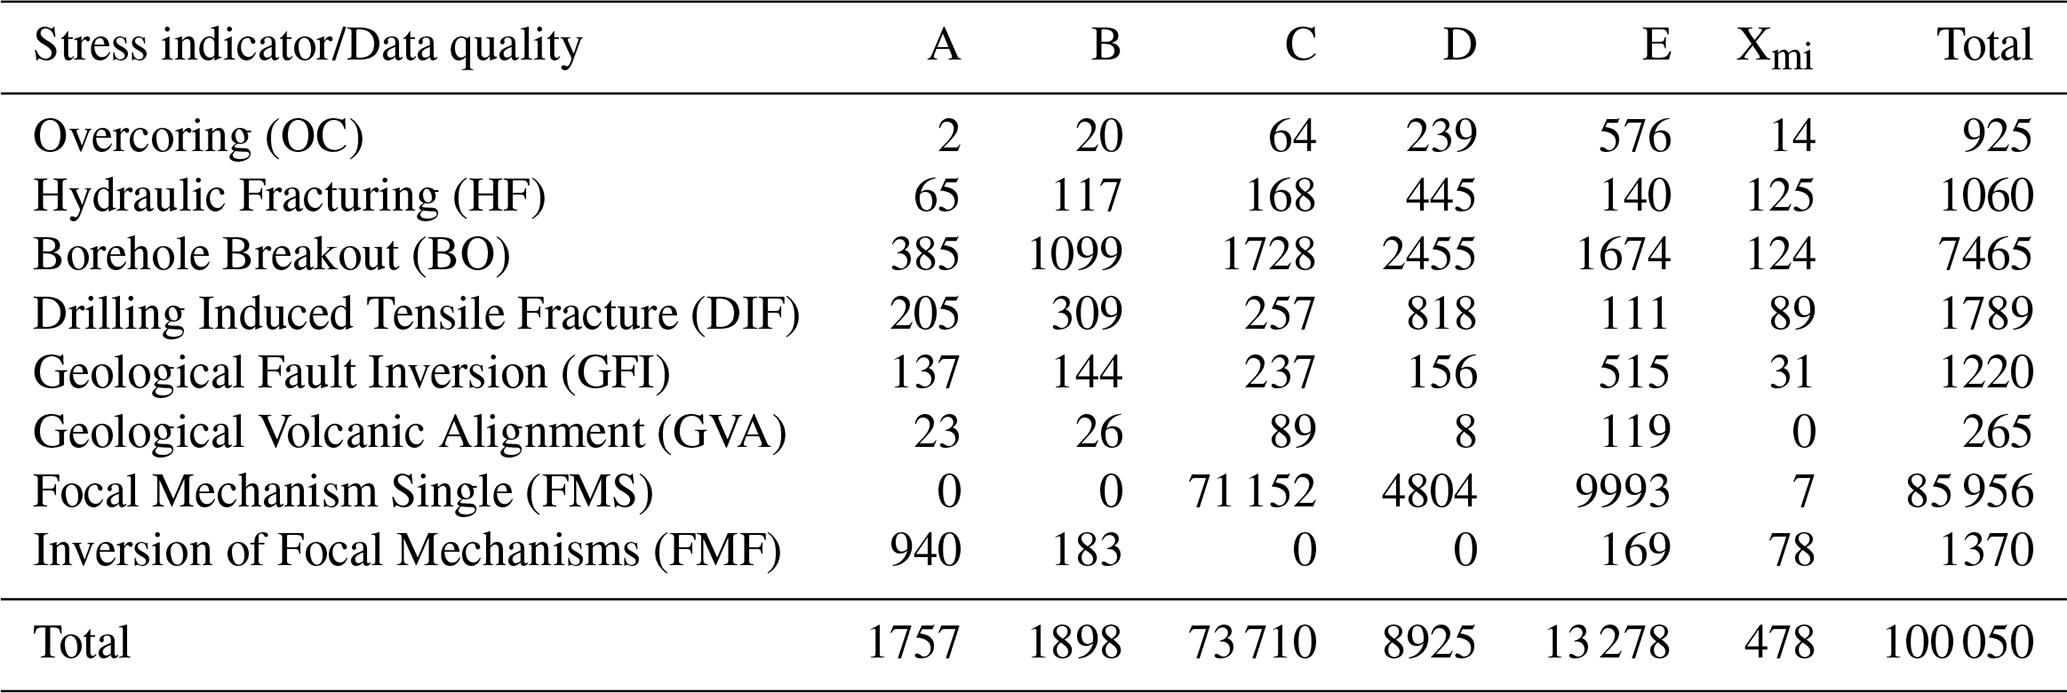
Figure 1 presents the global stress map using the 77 365 A-C quality data records from the new WSM 2025 database. Plotting the data of the entire crust in map view is justified, as rotation of the SHmax orientation with depth is not observed beyond the prevailing standard deviation of the data records. Exceptions are observed in some boreholes when they are drilled through faults, such as the San Andreas fault (Hickman and Zoback, 2004) or intraplate settings (Rajabi et al., 2016; Rajabi et al., 2017b; Heidbach et al., 2025) or in areas with mechanical decoupling horizons (Tingay et al., 2009, 2011). However, the vast majority of data from deep boreholes show no significant rotation of the SHmax orientation with depth. Likewise, no systematic rotation of SHmax orientations is observed when comparing borehole data from the upper crust with data records derived from earthquake focal mechanisms from greater depth, confirming this earlier observation (Zoback, 1992; Heidbach et al., 2010; Pierdominici and Heidbach, 2012; Heidbach et al.; 2025).
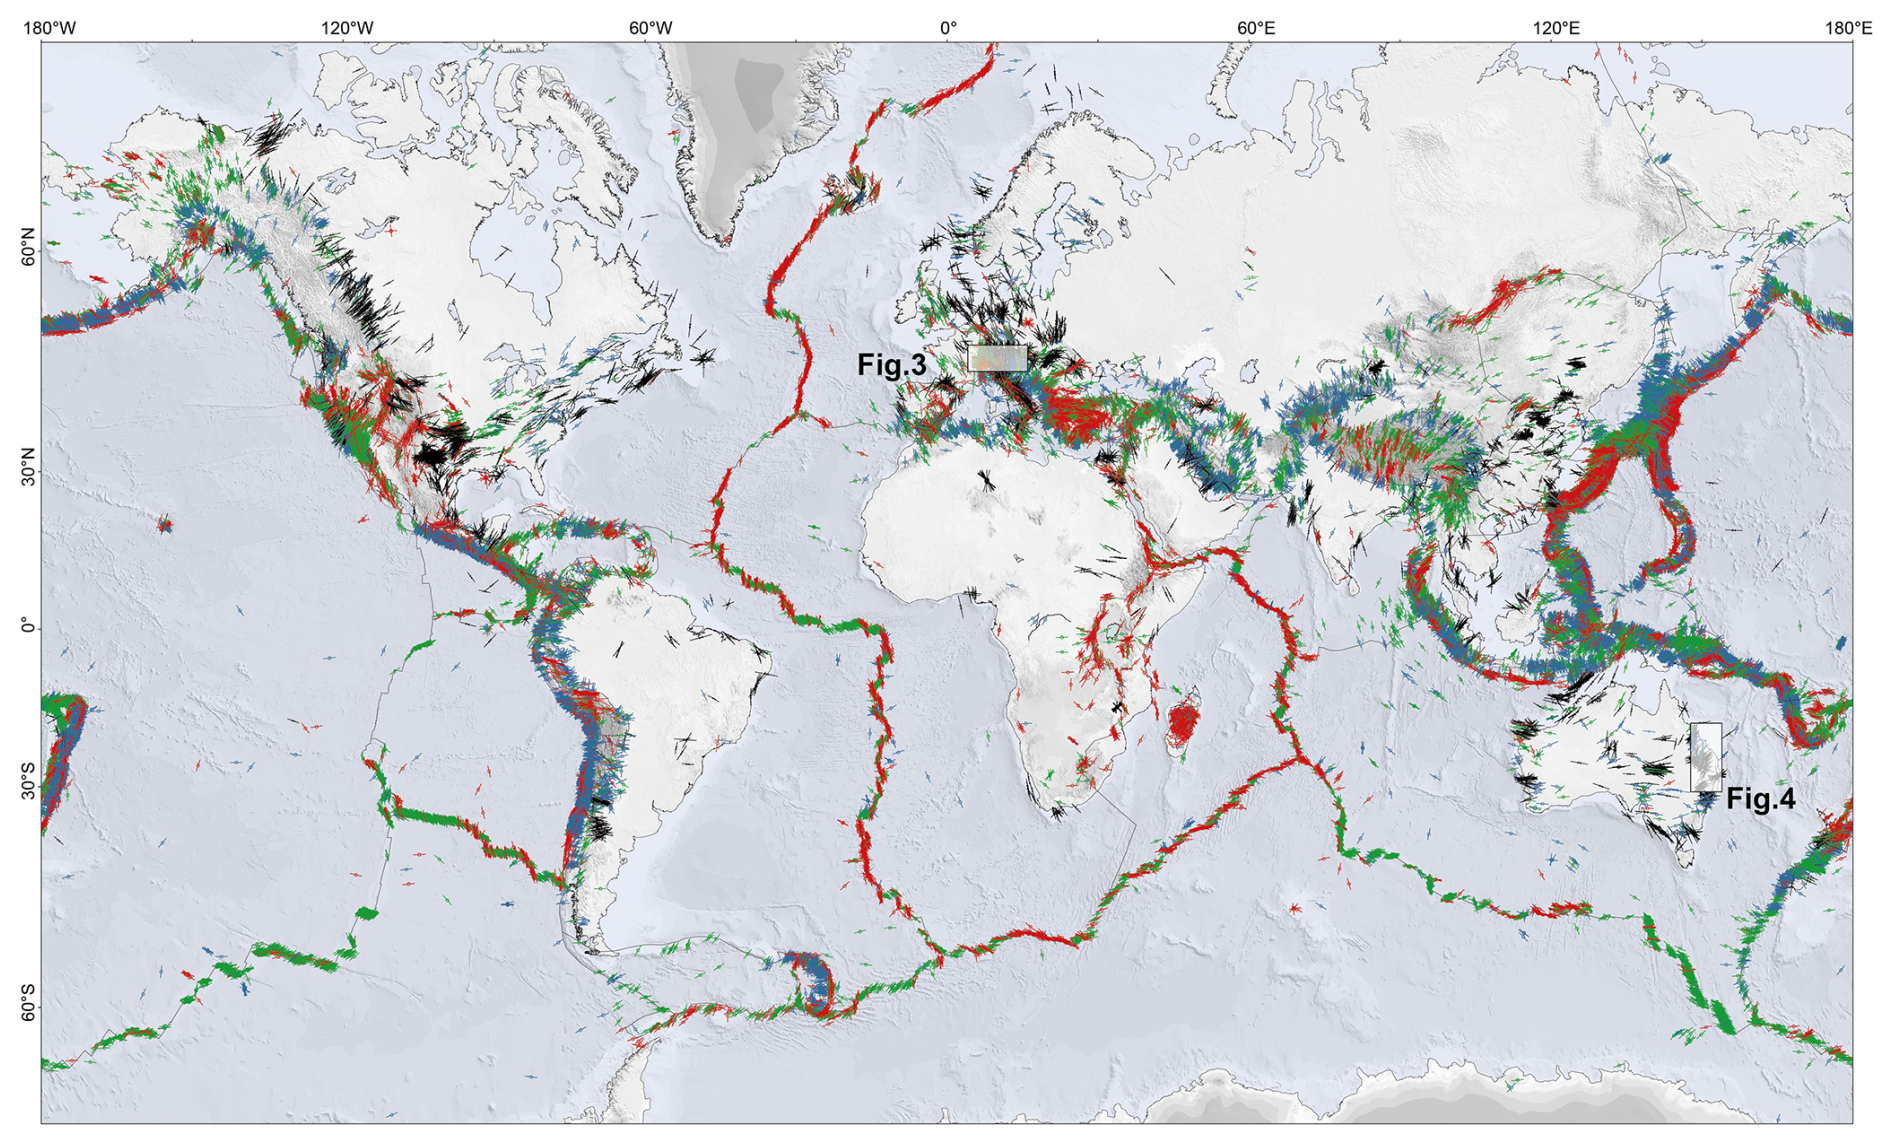
Figure 1World Stress Map 2025. Lines indicate the orientation of maximum horizontal stress (SHmax). Colours of the lines indicate normal faulting stress regime (red), strike-slip stress regime (green), thrust faulting stress regime (blue), and black for unknown stress regime. Displayed are the 77 365 data records with A-C quality. Grey lines are the plate boundaries from the global tectonic model PB2002 of Bird (2003). Topography and bathymetry is taken from Tozer et al. (2019). Plotting order of the data is from deep to shallow.
The data on Fig. 1 are plotted according to their depth resulting in a map where the shallowest data are plotted on top. The azimuth of the lines in Fig. 1 represent the SHmax orientation, and the colour of the lines indicate the stress regime. The vast majority of data records with stress regime assignment are from earthquake focal mechanisms, which means that the displayed stress regime reflects conditions at greater depths. However, analysis of stress magnitudes in several boreholes around the world have shown that the stress regime changes with depth (Brudy et al., 1997; Rajabi et al., 2017a; Qin et al., 2024; NAGRA, 2024). The horizontal stress magnitudes are controlled by gravity and lateral surface forces from the plate boundaries, whereas the vertical stress, SV, is controlled by gravity. Thus, at shallow depths, the horizontal stress magnitudes are larger than SV, resulting in a thrust faulting stress regime. Consequently, the stress regime shown in the maps represent the conditions prevailing at the depths where earthquakes nucleate, not necessarily those at shallow depth of a few kilometres, where is most relevant for practical applications in geo-reservoirs. This is particularly important for deep geological repositories for radioactive waste, which are typically planned at depth between 400–1000 m, where stress regime changes are more likely (Hergert et al., 2015; NAGRA, 2024) and can directly impact the design of underground facilities (Fuchs and Müller, 2001; Brady and Brown, 2004).
As shown in Fig. 1, most stress data records are clustered around plate boundaries and within sedimentary basins. To analyse the pattern of SHmax orientation across different spatial scales, we provide estimates of the mean SHmax orientation on regular global grids of 2, 1, 0.5 and 0.2°. The mean SHmax orientation and its standard deviation (s0), on these grids, are calculated using circular statistics for axial data (Mardia and Jupp, 2000):
with
where θi is the SHmax orientation of individual data records i among the total number N of data records, and wi is the weighting coefficient used to calculate the mean SHmax orientation. The value for the mean SHmax orientation is estimated for a given search radius and a minimum required number of data records within that radius. For the estimation of the mean SHmax orientation we use the tool stress2grid v1.1 from Ziegler and Heidbach (2019).
Using a fixed search radius effectively filters the pattern of the SHmax orientation according to the wavelength defined by the chosen search radius and, thus, does not resolve rotations of the mean SHmax orientation at spatial scales smaller than the employed search radius. Therefore, we provide 13 global datasets of the mean SHmax orientation calculated with search radii of 500, 250, 100, and 50 km (Heidbach and Rajabi, 2026). We use grids of 2, 1, 0.5, and 0.2° for the search radius of 500 and 250 km, and grids of 1, 0.5, and 0.2° for the 100 km search radius. For the 50 km search radius we only use grids of 0.5 and 0.2°. Within each search radius, a minimum of five data records is required and that these data records are located on the same tectonic plate as the grid point using the global plate boundary model PB2002 from Bird (2003).
The significance of the mean SHmax orientation estimates in the 13 datasets is further improved by weighting the input data using two parameters:
Data quality weighting with wQ=1/15 for A-, for B-, and for C-quality data.
Inverse distance weighting relative to the grid point. This assumes that the closer a data record is to a grid point, the more strongly the stress state at the grid point influences that data record. Consequently, the contribution of an individual data record to the mean SHmax orientation increases as its distance from the grid point decreases. To avoid that data records located very close to a grid point are overrepresented by the distance weight, a minimum distance threshold is applied so that all data records within 10 % of the search radius are assigned the same weighting coefficient (Ziegler and Heidbach, 2019).
Figure 2 presents a global stress map of the mean SHmax orientation using the dataset of the 2° grid with a search radius of 500 km. The map shows that within intraplate regions, substantial rotations of the SHmax orientation occur. This observation now confirms, with the data, the earlier hypothesis that second-order effects arising from lateral variations in rock stiffness and density can cause rotations of the SHmax orientation, locally overriding the primary control of plate tectonic forces (Zoback, 1992; Heidbach et al., 2007; Rajabi et al., 2017c).
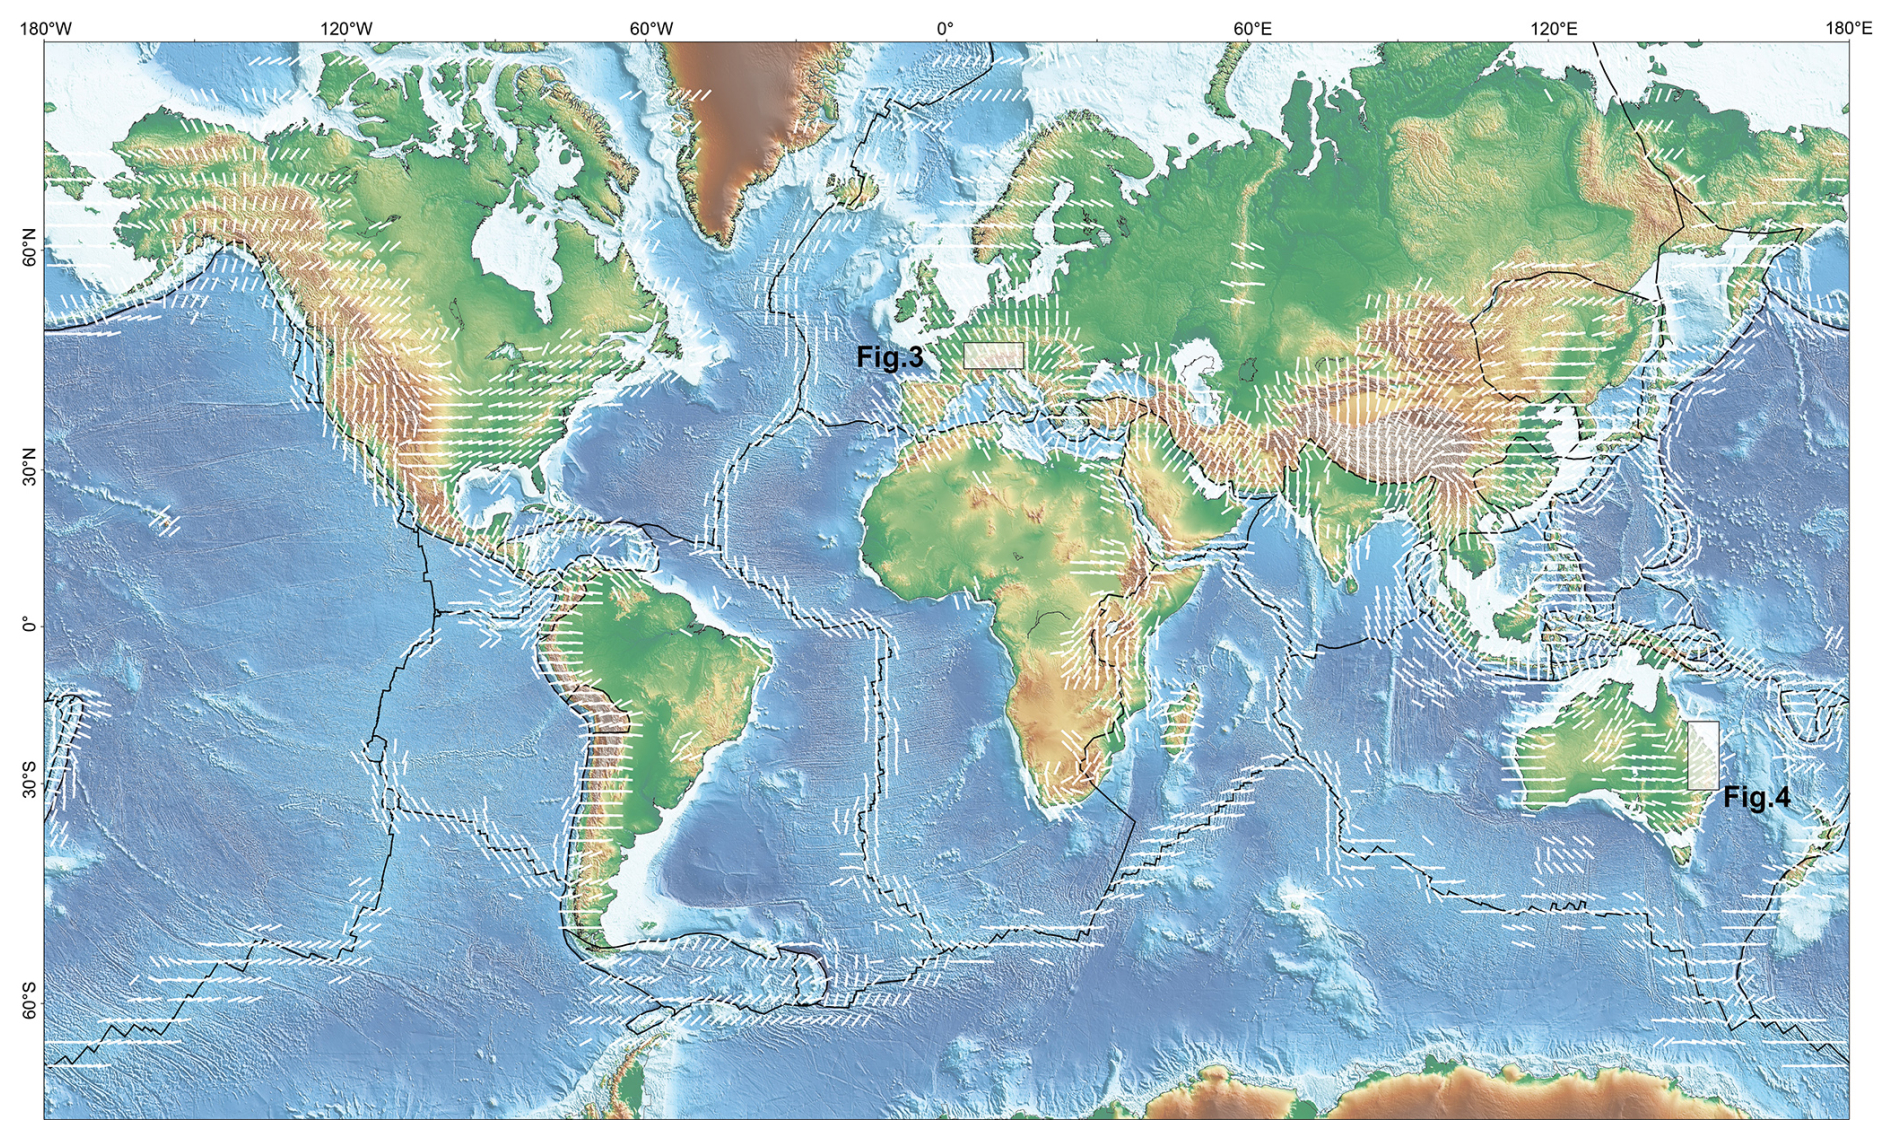
Figure 2Mean SHmax orientation on a 2° grid using the search radius of 500 km and the A–C quality data displayed in Fig. 1. Black lines are the plate boundaries from the global plate boundary model PB2002 (Bird, 2003). Global topography and bathymetry is from Tozer et al. (2019).
This effect is particularly evident in the forelands of high topography, where the excess of gravitational potential energy results in SHmax orientations perpendicular to the strike of the mountain belts (Zoback and Mooney, 2003). In the Alpine foreland, for example, the SHmax orientation rotates by approximately 50° from a north-south in the east to about N130° E in the Western Alps (Fig. 3) as explained earlier by Reinecker et al. (2010) and in more detail by Heidbach et al. (2025) for Switzerland and its surrounding areas, and in the western part of Austria by Levi et al. (2019). Comparable stress patterns are observed for example in the greater Himalaya region (Hu et al., 2017) and in the Rocky Mountains of Canada (Reiter et al., 2014). Besides this obvious topography control there are also intraplate regions with low lateral density contrasts, i.e. low topography, that show rotations of the SHmax orientation on spatial scales of hundreds of kilometres or less.
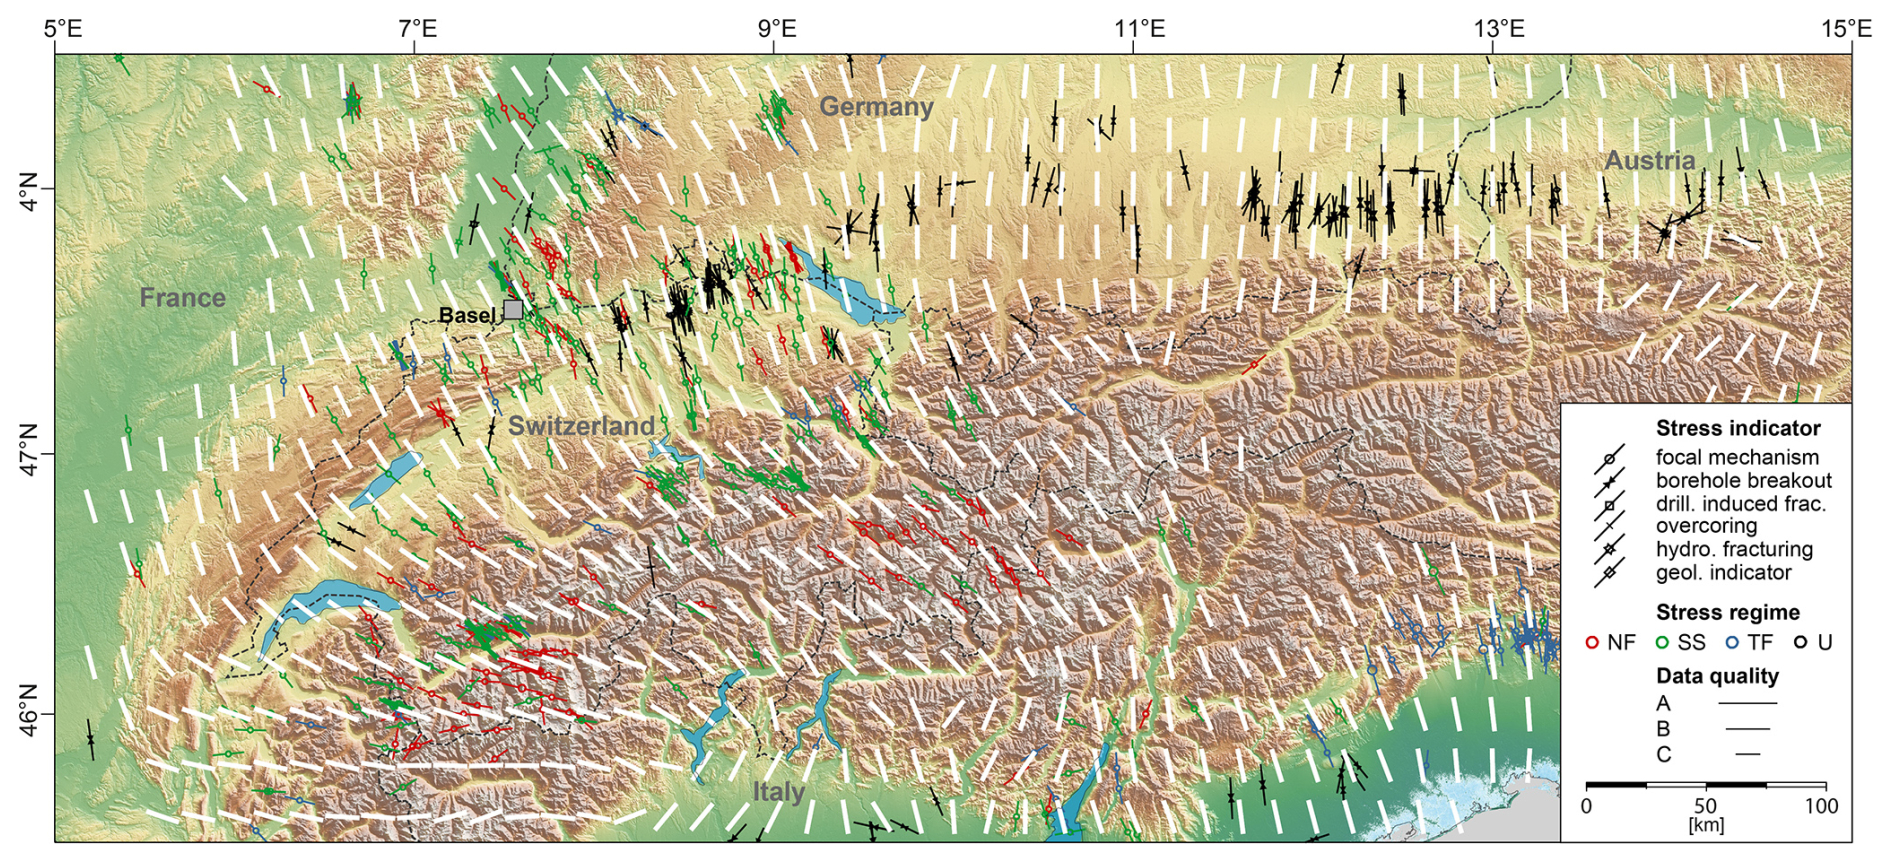
Figure 3Stress map of the Alpine foreland. Black and coloured lines indicate data records of the orientation of maximum horizontal stress (SHmax) with A–C quality. Line length is according to data quality and their colours mark the stress regime with red for normal faulting (NF), green for strike-slip faulting (SS), blue for thrust faulting (TF), and black for unknown stress regime (U). White bars on the 0.2° grid show the dataset of the mean SHmax orientation with a search radius of 50 km. Dashed black line denote the national boundaries.
Another prominent example for very well data-based documented intraplate rotation of the SHmax orientation is eastern Australia (Fig. 4). Mean SHmax orientation estimated using a 50 km search radius on a 0.2° grid reveals rotations exceeding 50° over distances of < 100 km. The northern part of the Bowen Basin in north-eastern to eastern Australia provides insight into why some regions exhibit large rotations of the SHmax orientation whereas others do not. An exceptionally dense dataset from 680 vertical boreholes distributed over an area of 300×100 km2 shows no lateral or vertical variation in SHmax orientation despite the presence of a fault network and lateral stiffness contrast (Rajabi et al., 2024). The mean SHmax orientation for the entire dataset of this region is N18° E with a standard deviation of ±18°. By contrast, further south in the southern part of the Bowen Basin and in the overlying Surat Basin, the SHmax orientation rotates by up to 60° within 100 km are observed (Rajabi et al., 2017b, c).
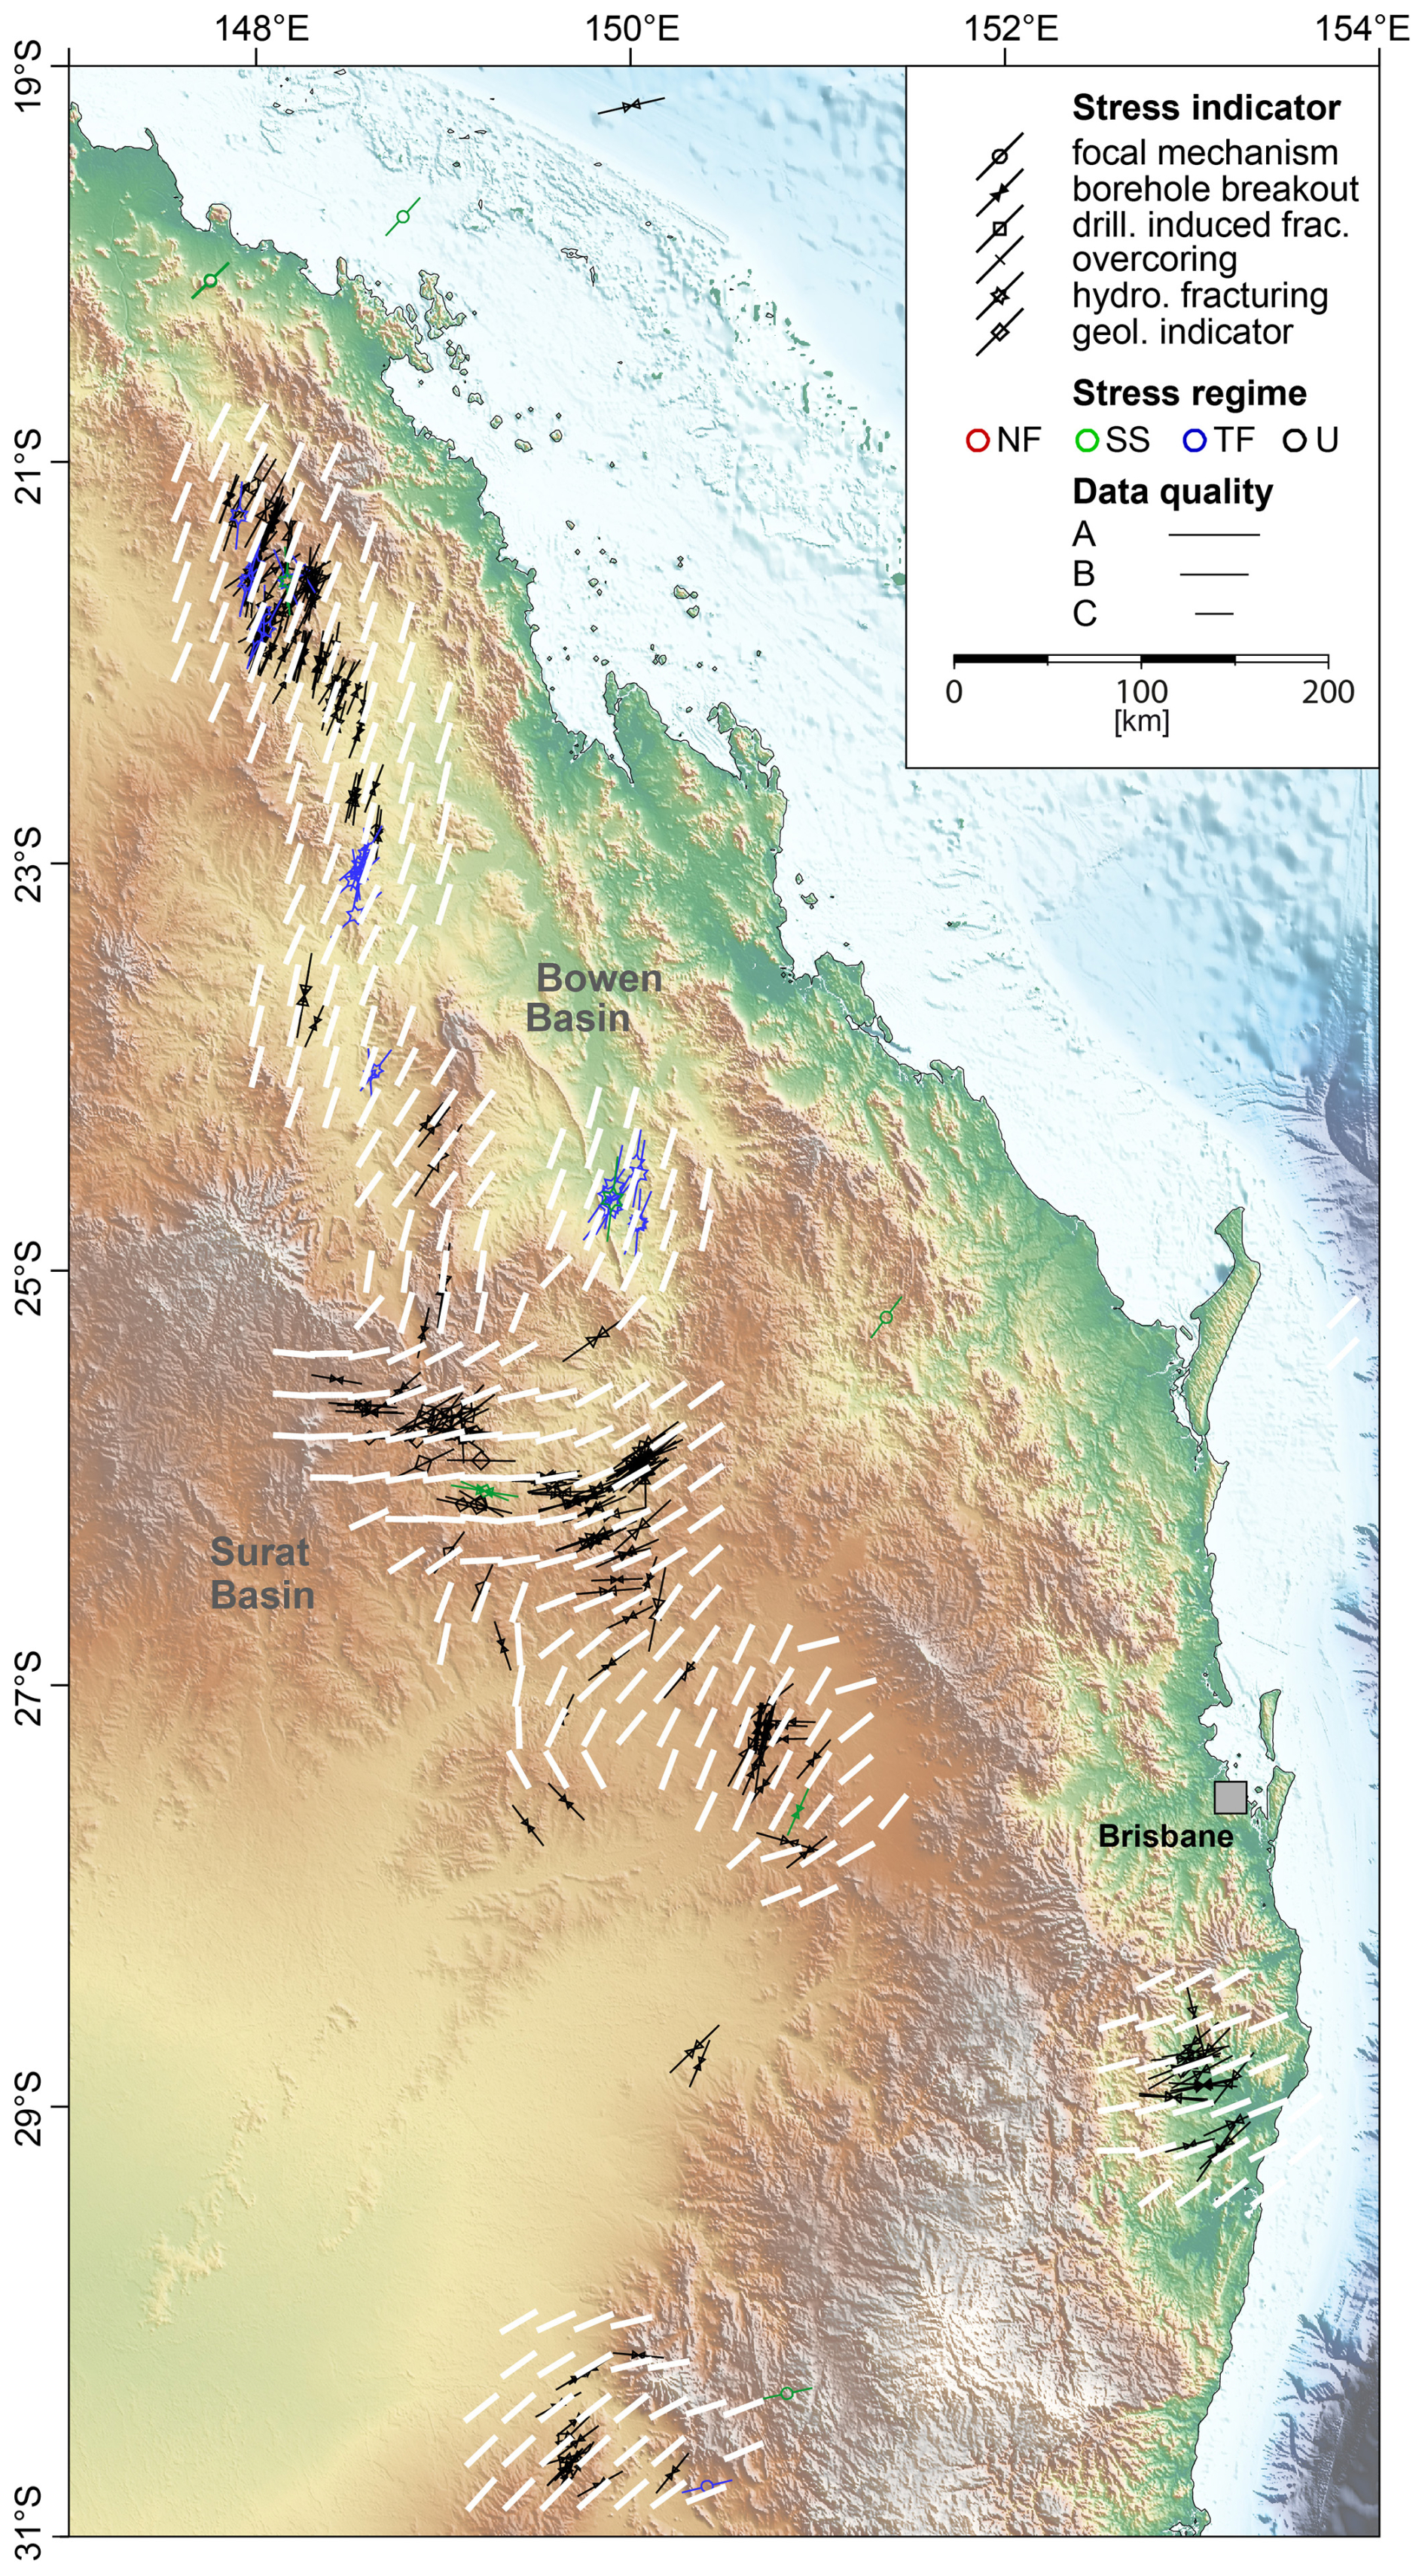
Figure 4Stress map of north-eastern to eastern Australia. Black and coloured lines indicate data records of the orientation of maximum horizontal stress (SHmax) with A–C quality. Line length is according to data quality and their colours mark the stress regime with red for normal faulting (NF), green for strike-slip faulting (SS), blue for thrust faulting (TF), and black for unknown stress regime (U). White bars on the 0.2° grid show the dataset of the mean SHmax orientation with a search radius of 50 km.
Similar intraplate rotations of the SHmax orientation are also identified in the greater Texas-New Mexico region, where the data density is also high (Lund Snee and Zoback, 2020). In both regions, these rotations also occur in the absence of significant topography and show no correlation with fault occurrence. Moreover, the rotations are gradual, supporting the interpretation that faults exert limited control on the stress field beyond distances of a few kilometres, if at all (Reiter et al., 2024; Velagala et al., 2026). Since the data density even in areas with high resolution is only on the order of one data record per 100 km2, rotations of the SHmax orientation on lateral spatial scales < 10 km cannot be resolved. Furthermore, the rotation should be larger than the standard deviation of individual data records, which is for most data records ± 20–25°.
Nevertheless, there are still large intraplate regions such as central western Europe or north-eastern North America that show remarkably uniform SHmax orientation over distances > 1000 km, parallel to the direction of absolute plate motion (Zoback, 1992; Müller et al., 1992). Here, plate tectonic forces are the key control for the SHmax orientation and for the large differences in horizontal stress magnitudes. However, in regions where several plate tectonic forces superimpose such that the horizontal differential stress between the magnitudes of the minimum horizontal stress Shmin and SHmax is small, regional and local topography as well as stiffness contrasts exert a relatively stronger control on the SHmax orientation. For example, in north-eastern Australia, plate tectonic forces along the Solomon subduction and the New Guinea collision zone appear to dominate the stress pattern, whereas further south, superposition with the plate tectonic forces related to the New Hebrides subduction zone may generate a stress state characterized by low horizontal stress differences. In such a setting, regional and local stress-controlling factors have a relatively larger impact and can lead to substantial rotations of the SHmax orientation (Ziegler et al., 2017).
With increasing resolution, the number of intraplate regions that shows rotations of the SHmax orientation at spatial scales between 50 and 500 km is also increasing. These rotations can be used as proxies, together with geomechanical-numerical models, to quantify the relative importance of plate boundary forces that control the long wavelength pattern in comparison to regional and local controls of the crustal stress state. These rotations also have significant implications for evaluating tectonic fault criticality and for ensuring the safe and efficient application of subsurface technologies essential to the energy transition (Segall and Fitzgerald, 1998; Jolie et al., 2021; Ahlers et al., 2021; Ziegler et al., 2024). A detailed assessment of the relative contributions of plate tectonic forces, gravitational potential energy, and regional to local stiffness contrasts requires geomechanical-numerical modelling (Rajabi et al., 2017b; Coblentz et al., 2024; Peña Clavijo et al., 2024). In regions displaying significant lateral rotations of the SHmax orientation, such observations provide valuable constraints on model parameters and model boundary conditions (Ziegler et al., 2017; Reiter, 2021). However, in regions with sparse data coverage or uniform SHmax orientation, stress magnitudes data become essential for geomechanical model calibration (Lecampion and Lei, 2010; Ziegler et al., 2016, Ziegler and Heidbach, 2020; Laruelle et al., 2026). Accordingly, while the compilation of SHmax orientation data will continue, the WSM is being expanded to include stress magnitude data. Initial efforts have focused on analysing and compiling stress magnitudes from Germany and neighbouring countries and on developing a quality-ranking scheme that will form an additional backbone for the future development of the WSM (Morawietz et al., 2020).
The tool stress2grid that is used to estimate the mean SHmax orientation is available at https://doi.org/10.5880/wsm.2019.002 (Ziegler and Heidbach, 2019).
The new WSM database 2025 is available at https://doi.org/10.5880/wsm.2025.001 (Heidbach et al., 2025). User-defined stress maps can be plotted using the online tool CASMO (Heidbach et al., 2004) on the WSM project website. The 13 datasets of the mean SHmax orientation on regular global grids are available at https://doi.org/10.5880/wsm.2026.001 (Heidbach and Rajabi, 2026).
O.H. and M.R. conducted the estimation of the mean SHmax orientation on regular global grids, analysed the stress pattern, and wrote the paper.
The contact author has declared that neither of the authors has any competing interests.
Publisher's note: Copernicus Publications remains neutral with regard to jurisdictional claims made in the text, published maps, institutional affiliations, or any other geographical representation in this paper. The authors bear the ultimate responsibility for providing appropriate place names. Views expressed in the text are those of the authors and do not necessarily reflect the views of the publisher.
We acknowledge the following individual scientists who contributed significantly to the success of the WSM project in one way or the either in the past 40 years: Adams, J., Ágústsson, K., Alt, R., Al-Zoubi, A. S., Andreoli, M., Árnadóttir, S., Ask, D., Ask, M., Assumpcao, M., Barth, A., Babyyev, G., Balfour, N., Baptie, B., Barr, M., Batchelor, T., Becker, A., Bell, S., Bergerat, F., Bergman, E., Bluemling, P., Bohnhoff, M., Bonjer, K.-P., Bosworth, W., Bratli, R., Brereton, R., Brudy, M., Bungum, H., Chatterjee, R., Colmenares, L., Connolly, P., Cornet, F., Cui, X.F., Custodio, S., Delvaux, D., Deichmann, N., Denham, D., Desroches, J., Diehl, T., Ding, J. M., Di Giacomo, D., Doeveny, P., Enever, J., Feijerskov, M., Fellgett, M. W., Finkbeiner, T., Fleckenstein, P., Fuchs, K., Gay, N., Gerner, P., Giger, S., Gough, D.I., Gowd, T.N., Grasso, M., Gregersen, S., Grünthal, G., Gupta, H., Guzman, C., Gvishiani, A., Haimson, B., Hake, T., Hanssen, T. H., Harris, J., Hauk, C., Heidbach, O., Hergert, T., Hersir, G. P., Hickman, S., Hillis, R., Horvath, F., Hu, X. P., Jacob, K., Jarosinski, M., Jurado, M. J., King, R., Kingdon, A., Kjorholt, H., Klein, R., Knoll, P., Kropotkin, P., Kurfeß, D., Larsen, R., Lammers, S., Lindholm, C., Logue, A., López, A., Lund, B., Lund Snee J., Magee, M., Mariucci, M. T., Marschall, I., Mastin, M., Maury, V., Mercier, J., Mildren, S., Montone, P., Mularz-Pussak, M., Müller, B., Negut, M., Oncescu, M.C., Paquin, C., Pavoni, N., Pierdominici, S., Pondrelli, A., Ragg, S., Rajabi, M., Rajendran, K., Ranjbarkarami, R., Reinecker, J., Reiter, K., Rettelbach, N., Reynolds, S., Röckl, T., Roth, F., Rummel, F., Schmitt, D., Schoenball, M., Sebrier, M., Sherman, S., Sperner, B., Storchak, D., Stephansson, O., Stromeyer, D., Suarez, G., Suter, M., Tingay, M., Tolppanen, P., Townend, J., Tsereteli, N., Udias, A., van Dalfsen, W., van Eijs, R., Van-Kin, L., Von Specht, S., Velagala, A., Wenzel, F., Williams, J., Wiprut, D., Wolter, K., Xie, F. R., Xu, Z. H., Yunga, S., Zhizhin, M., Ziegler, M. O., Zoback, M. D., and Zoback, M.-L. Finally we also want to thank cordially any contributor of data, especially the companies and state organisations that contributed their data.
This research has been supported by the International Lithosphere Program and an Australian Research Council Discovery Early Career Researcher Award (grant no. DE200101361).
The article processing charges for this open-access publication were covered by the GFZ Helmholtz Centre for Geosciences.
This paper was edited by Christoph Schrank and reviewed by David Healy and two anonymous referees.
Addis, M. A.: The geology of geomechanics: petroleum geomechanical engineering in field development planning, Geological Society, London, Special Publications, 458, 7–29, https://doi.org/10.1144/sp458.7, 2017.
Ahlers, S., Henk, A., Hergert, T., Reiter, K., Müller, B., Röckel, L., Heidbach, O., Morawietz, S., Scheck-Wenderoth, M., and Anikiev, D.: 3D crustal stress state of Germany according to a data-calibrated geomechanical model, Solid Earth, 12(8), 1777–1799, https://doi.org/10.5194/se-12-1777-2021, 2021.
Amadei, B. and Stephansson, O.: Rock Stress and its Measurements, Chapman and Hall, New York, 1997.
Bell, J. S. and Gough, D. I.: Northeast-southwest compressive stress in Alberta: Evidence from oil wells, Earth Planet. Sci. Lett., 45, 475–482, https://doi.org/10.1016/0012-821X(79)90146-8, 1979.
Bird, P.: An updated digital model for plate boundaries, Geochemistry Geophysics Geosystems, 4, 1027, https://doi.org/10.1029/2001GC000252, 2003.
Brady, B. H. G. and Brown, E. T.: Rock Mechanics For Underground Mining, 3rd, Kluwer Academic Publishers, 2004.
Brudy, M., Zoback, M. D., Fuchs, K., Rummel, F., and Baumgartner, J.: Estimation of the complete stress tensor to 8 km depth in the KTB scientific drill holes: Implications for crustal strength, J. Geophys. Res., 102, 18453–18475, https://doi.org/10.1029/96jb02942, 1997.
Coblentz, D., van Wijk, J., Carmichael, J., Johnson, C., Delorey, A., Chai, C., Maceira, M., and Richardson, R. M.: New approaches to an old problem: addressing spatial gaps in the World Stress Map, Geological Society, London, Special Publications, 546, 47–68, https://doi.org/10.1144/sp546-2023-27, 2024.
Desroches, J., Peyret, E., Gisolf, A., Wilcox, A., Di Giovanni, M., Schram de Jong, A., Sepehri, S., Garrard, R., and Giger, S.: Stress Measurement Campaign in Scientific Deep Boreholes: Focus on Tools and Methods, Petrophysics, 64, 621–639, https://doi.org/10.30632/PJV64N5-2023a2, 2023.
Dziewonski, A. M., Chou, T.-A., and Woodhouse, J. H.: Determination of earthquake source parameters from waveform data for studies of global and regional seismicity, J. Geophys. Res., 86, 2825–2852, https://doi.org/10.1029/JB086iB04p02825, 1981.
Fuchs, K. and Müller, B.: World Stress Map of the Earth: a key to tectonic processes and technological applications, Naturwissenschaften, 88, 357–371, https://doi.org/10.1007/s001140100253, 2001.
Haimson, B. C. and Cornet, F. H.: ISRM Suggested Methods for rock stress estimation—Part 3: hydraulic fracturing (HF) and/or hydraulic testing of pre-existing fractures (HTPF), Int. J. Rock Mech. Mining Sc., 40, 1011–1020, https://doi.org/10.1016/j.ijrmms.2003.08.002, 2003.
Heidbach, O., Barth, A., Connolly, P., Fuchs, F., Müller, B., Reinecker, J., Sperner, B., Tingay, M., and Wenzel, F.: Stress Maps in a Minute: The 2004 World Stress Map Release, EOS T., 85, 521–529, 2004.
Heidbach, O., Reinecker, J., Tingay, M., Müller, B., Sperner, B., Fuchs, K., and Wenzel, F.: Plate boundary forces are not enough: Second- and third-order stress patterns highlighted in the World Stress Map database, Tectonics, 26, TC6014, https://doi.org/10.1029/2007TC002133, 2007.
Heidbach, O., Tingay, M., Barth, A., Reinecker, J., Kurfeß, D., and Müller, B.: Global crustal stress pattern based on the World Stress Map database release 2008, Tectonophys., 482, 3–15, https://doi.org/10.1016/j.tecto.2009.07.023, 2010.
Heidbach, O., Rajabi, M., Cui, X., Fuchs, K., Müller, B., Reinecker, J., Reiter, K., Tingay, M., Wenzel, F., Xie, F., Ziegler, M. O., Zoback, M.-L., and Zoback, M. D.: The World Stress Map database release 2016: Crustal stress pattern across scales, Tectonophys., 744, 484–498, https://doi.org/10.1016/j.tecto.2018.07.007, 2018.
Heidbach, O., Reinecker, J., Diehl, T., Desroches, J., Ziegler, M. O., Reiter, K., Vietor, T., and Giger, S. B.: The present-day crustal stress field of the Molasse Basin in Switzerland, Swiss J. Geosci., 118, https://doi.org/10.1186/s00015-025-00487-6, 2025.
Heidbach, O. and Rajabi, M.: Global datasets of the mean orientation of maximum horizontal stress S_Hmax on regular grids, GFZ Data Services [data set], https://doi.org/10.5880/wsm.2026.001, 2026.
Heidbach, O., Rajabi, M., Di Giacomo, D., Harris, J., Lammers, S., Morawietz, S., Pierdominici, S., Reiter, K., von Specht, S., Storchak, D., and Ziegler, M. O.: World Stress Map Database Release 2025, GFZ Data Services [data set], https://doi.org/10.5880/wsm.2025.001, 2025.
Henk, A.: Perspectives of Geomechanical Reservoir Models – Why Stress is Important, European Magazine, 4, 1–5, 2008.
Hergert, T., Heidbach, O., Reiter, K., Giger, S., and Marschall, P.: Stress field sensitivity analysis in a sedimentary sequence of the Alpine foreland, northern Switzerland, Solid Earth, 6, 533–552, https://doi.org/10.5194/se-6-533-2015, 2015.
Hickman, S. and Zoback, M. D.: Stress orientations and magnitudes in the SAFOD pilot hole, Geophys. Res. Lett., 31, https://doi.org/10.1029/2004gl020043, 2004.
Hottman, C. E., Smith, J. H., and Purcell, W. R.: Relationship Among Earth Stresses, Pore Pressure, and Drilling Problems Offshore Gulf of Alaska, J. Petrol. Tech., 1477–1484, 1979.
Hu, X., Zang, A., Heidbach, O., Cui, X., Xie, F., and Chen, J.: Crustal stress pattern in China and its adjacent areas, Journal of Asian Earth Sciences, 149, 20–28, https://doi.org/10.1016/j.jseaes.2017.07.005, 2017.
Jolie, E., Scott, S., Faulds, J., Chambefort, I., Axelsson, G., Gutiérrez-Negrín, L. C., Regenspurg, S., Ziegler, M., Ayling, B., Richter, A., and Zemedkun, M. T.: Geological controls on geothermal resources for power generation, Nature Reviews Earth & Environment, 2, 324–339, https://doi.org/10.1038/s43017-021-00154-y, 2021.
Laruelle, L., Ziegler, M. O., Reiter, K., Heidbach, O., Desroches, J., Giger, S. B., and Degen, D.: Minimum Amount of Stress Magnitude Data Records For Reliable Geomechanical Modelling, Rock Mech. Rock Eng., https://doi.org/10.1007/s00603-025-05194-0, 2026.
Lecampion, B. and Lei, T.: Reconstructing the 3D Initial Stress State over Reservoir Geomechanics Model from Local Measurement and Geological Priors: A Bayesian Approach, Schlumberger Journal of Modelling, Design and Simulations, 1, 100000–100104, 2010.
Lentas, K., Di Giacomo, D., Harris, J., and Storchak, D. A.: The ISC Bulletin as a comprehensive source of earthquake source mechanisms, Earth System Science Data, 11, 565–578, https://doi.org/10.5194/essd-11-565-2019, 2019.
Levi, N., Habermueller, M., Exner, U., Piani, E., Wiesmayr, G., and Decker, K.: The stress field in the frontal part of the Eastern Alps (Austria) from borehole image log data, Tectonophys., 769, https://doi.org/10.1016/j.tecto.2019.228175, 2019.
Ljunggren, C., Chang, Y., Janson, T., and Christiansson, R.: An overview of rock stress measurement methods, Int. J. Rock Mech. Mining Sc., 40, 975–989, https://doi.org/10.1016/j.ijrmms.2003.07.003, 2003.
Lund Snee, J. E. and Zoback, M. D.: Multiscale variations of the crustal stress field throughout North America, Nat. Common., 11, https://doi.org/10.1038/s41467-020-15841-5, 2020.
Mardia, K. V. and Jupp, P. E.: Directional Statistics, Wiley, 2000.
Morawietz, S., Heidbach, O., Reiter, K., Ziegler, M. O., Rajabi, M., Zimmerman, G., Müller, B., and Tingay, M.: An open-access stress magnitude database for Germany and adjacent regions, Geothermal Energy, https://doi.org/10.1186/s40517-020-00178-5, 2020.
Müller, B., Zoback, M.-L., Fuchs, K., Mastin, L., Gregersen, S., Pavoni, N., Stephansson, O., and Ljunggren, C.: Regional Patterns of Tectonic Stress in Europe, J. Geophys. Res., 97, 11783–11803, https://doi.org/10.1029/91JB01096, 1992.
NAGRA: In-situ stress field in the siting regions Jura Ost, Nördlich Lägern and Zürich Nordost, NAGRA, Wettingen, NAGRA Arbeitsbericht NAB 24-19, 2024.
Peña Clavijo, S., Dash, A., Baby, G., Alafifi, A. M., and Finkbeiner, T.: Modelling principal stress orientations in the Arabian Plate using plate velocities, Geological Society, London, Special Publications, 546, 193–214, https://doi.org/10.1144/sp546-2022-327, 2024.
Pierdominici, S. and Heidbach, O.: Stress field of Italy – Mean stress orientation at different depths and wave-length of the stress pattern, Tectonophys., 532-535, 301–311, https://doi.org/10.1016/j.tecto.2012.02.018, 2012.
Plumb, R. A. and Hickman, S. H.: Stress-induced borehole elongation: A comparison between the four-arm dipmeter and the borehole televiewer in the Auburn Geothermal Well, J. Geophys. Res., 90, 5513–5521, https://doi.org/10.1029/JB090iB07p05513, 1985.
Qin, X., Zhao, X., Zhang, C., Li, P., Chen, Q., and Wang, J.: Measurement and Assessment of the In-Situ Stress of the Shazaoyuan Rock Block, a Candidate Site for HLW Disposal in Northwest China, Rock Mech. Rock Eng., 57, 4011–4031, https://doi.org/10.1007/s00603-024-03775-z, 2024.
Rajabi, M., Tingay, M., and Heidbach, O.: The present-day stress field of New South Wales, Australia, Australian J. Earth Sci., 63, 1–21, https://doi.org/10.1080/08120099.2016.1135821, 2016.
Rajabi, M., Heidbach, O., Tingay, M., and Reiter, K.: Prediction of the present-day stress field in the Australian continental crust using 3D geomechanical–numerical models, Australian J. Earth Sci., 64, 435–454, https://doi.org/10.1080/08120099.2017.1294109, 2017a.
Rajabi, M., Tingay, M., King, R., and Heidbach, O.: Present-day stress orientation in the Clarence-Moreton Basin of New South Wales, Australia: A new high density dataset reveals local stress rotations, Basin Res., 29, 622–640, https://doi.org/10.1111/bre.12175, 2017b.
Rajabi, M., Tingay, M., Heidbach, O., Hillis, R., and Reynolds, S.: The present-day stress field of Australia, Earth Science Reviews, 168, 165–189, https://doi.org/10.1016/j.earscirev.2017.04.003, 2017c.
Rajabi, M., Ziegler, M. O., Heidbach, O., Mukherjee, S., and Esterle, J.: Contribution of mine borehole data toward high-resolution stress mapping: An example from northern Bowen Basin, Australia, Int. J. Rock Mech. Mining Sc., 173, https://doi.org/10.1016/j.ijrmms.2023.105630, 2024.
Rajabi, M., Lammers, S., and Heidbach, O.: WSM database description and guidelines for analysis of horizontal stress orientation from borehole logging, WSM Technical Report TR 25-01, GFZ Helmholtz Centre for Geosciences, Potsdam,, https://doi.org/10.48440/wsm.2025.001, 2025.
Reinecker, J., Tingay, M., Müller, B., and Heidbach, O.: Present-day stress orientation in the Molasse Basin, Tectonophys., 462, 129–138, https://doi.org/10.1016/j.tecto.2009.07.021, 2010.
Reiter, K., Heidbach, O., Schmitt, D. R., Moeck, I., Ziegler, M. O., and Hauck, C.: Crustal stress field pattern of Canada, Tectonophys., 636, 111–124, https://doi.org/10.1016/j.tecto.2014.08.006, 2014.
Reiter, K.: Stress rotation – impact and interaction of rock stiffness and faults, Solid Earth, 12, 1287–1307, https://doi.org/10.5194/se-12-1287-2021, 2021.
Reiter, K., Heidbach, O., and Ziegler, M. O.: Impact of faults on the remote stress state, Solid Earth, 15, 305–327, https://doi.org/10.5194/se-15-305-2024, 2024.
Schmitt, D. R., Currie, C. A., and Zhang, L.: Crustal stress determination from boreholes and rock cores: Fundamental principles Tectonophys., 580, 1–26, https://doi.org/10.1016/j.tecto.2012.08.029, 2012.
Schmitt, D. R. and Haimson, B. C.: Hydraulic fracturing stress measurements in deep holes, in: Rock Mechanics and Engineering Volume I: Principles, Feng, X.-T. (ed.), CRS Press, Boca Raton, 183–226, 2018.
Segall, P. and Fitzgerald, S. D.: A note on induced stress changes in hydrocarbon and geothermal reservoirs, Tectonophys., 289, 117–128, https://doi.org/10.1016/s0040-1951(97)00311-9, 1998.
Sperner, B., Müller, B., Heidbach, O., Delvaux, D., Reinecker, J., and Fuchs, K.: Tectonic stress in the Earth's crust: advances in the World Stress Map project, in: New insights in structural interpretation and modelling, Nieuwland, D. A. (ed.), Geological Society, London, Special Publications, 101–116, https://doi.org/10.1144/gsl.sp.2003.212.01.07, 2003.
Szwillus, W., Afonso, J. C., Ebbing, J., and Mooney, W. D.: Global Crustal Thickness and Velocity Structure From Geostatistical Analysis of Seismic Data, J. Geophys. Res., 124, 1626–1652, https://doi.org/10.1029/2018jb016593, 2019.
Thiercelin, M. J., Plumb, R. A., Desroches, J., Bixenman, P. W., Jonas, J. K., and Davie, W. R.: A New Wireline Tool for In-Situ Stress Measurements, SPE Formation Evaluation, 19–25, https://doi.org/10.2118/25906-PA, 1996.
Tingay, M., Hillis, R., Morley, C. K., King, R. C., Swarbrick, R. E., and Damit, A. R.: Present-day stress and neotectonics of Brunei: Implications for petroleum exploration and production, AAPG Bulletin, 93, 75–100, https://doi.org/10.1306/08080808031, 2009.
Tingay, M., Bentham, P., De Feyter, A. and Kellner, A.: Present-day stress-field rotations associated with evaporites in the offshore Nile Delta, Geological Society of America Bulletin, 123, 1171–1180, https://doi.org/10.1130/B30185.1, 2011.
Tozer, B., Sandwell, D. T., Smith, W. H. F., Olson, C., Beale, J. R., and Wessel, P.: Global Bathymetry and Topography at 15 Arc Sec: SRTM15+, Earth and Space Science, 6, 1847–1864, https://doi.org/10.1029/2019ea000658, 2019.
Velagala, L. S. A. R., Heidbach, O., Ziegler, M. O., Reiter, K., Rajabi, M., Henk, A., Giger, S. B., and Hergert, T.: Spatial influence of fault-related stress perturbations in northern Switzerland, Solid Earth, 17, 179–201, https://doi.org/10.5194/se-17-179-2026, 2026.
Voight, B., Taylor, J. W., and Voight, J. P.: Tectonophysical implications of rock stress determinations, Geologische Rundschau, 58, 655–676, 1968.
Zang, A. and Stephansson, O.: Stress in the Earth's Crust, Springer, Heidelberg, 323 pp., 2010.
Ziegler, M. O., Heidbach, O., Reinecker, J., Przybycin, A. M., and Scheck-Wenderoth, M.: A multi-stage 3-D stress field modelling approach exemplified in the Bavarian Molasse Basin, Solid Earth, 7, 1365–1382, https://doi.org/10.5194/se-7-1365-2016, 2016.
Ziegler, M. O., Heidbach, O., Zang, A., Martínez-Garzón, P., and Bohnhoff, M.: Estimation of the differential stress from the stress rotation angle in low permeable rock, Geohpys. Res. Lett., 44, 6761–6770, https://doi.org/10.1002/2017GL073598, 2017.
Ziegler, M. and Heidbach, O.: Matlab script Stress2Grid v1.1, GFZ Data Services [code], https://doi.org/10.5880/wsm.2019.002, 2019.
Ziegler, M. O. and Heidbach, O.: The 3D stress state from geomechanical–numerical modelling and its uncertainties: a case study in the Bavarian Molasse Basin, Geothermal Energy, 8, https://doi.org/10.1186/s40517-020-00162-z, 2020.
Ziegler, M., Finkbeiner, T., Massiot, C., and Goteti, R.: The quest for high fidelity, accurate geomechanical models and the research leading to it, Geological Society, London, Special Publications, 546, 1–7, https://doi.org/10.1144/sp546-2024-38, 2024.
Zoback, M.-L.: First- and Second- Order Patterns of Stress in the Lithosphere: The World Stress Map Project, J. Geophys. Res., 97, 11703–11728, https://doi.org/10.1029/92JB00132, 1992.
Zoback, M.-L. and Mooney, W. D.: Lithospheric Bouyancy and Continental Intraplate Stresses, International Geology Review, 45, 95–118, https://doi.org/10.2747/0020-6814.45.2.95, 2003.
Zoback, M.-L. and Zoback, M. D.: Tectonic stress field of the continental United States, in: Geophysical Framework of the Continental United States, edited by: Pakiser, L. C., and Mooney, W. D., Geol. Soc. Am. Mem., Boulder, Colorado, 523–539, https://doi.org/10.1130/MEM172-p523, 1989.
Zoback, M.-L., Zoback, M. D., Adams, J., Assumpção, M., Bell, S., Bergman, E. A., Blümling, P., Brereton, N. R., Denham, D., Ding, J., Fuchs, K., Gay, N., Gregersen, S., Gupta, H. K., Gvishiani, A., Jacob, K., Klein, R., Knoll, P., Magee, M., Mercier, J. L., Müller, B. C., Paquin, C., Rajendran, K., Stephansson, O., Suarez, G., Suter, M., Udías, A., Xu, Z. H., and Zhizhin, M.: Global patterns of tectonic stress, Nature, 341, 291–298, https://doi.org/10.1038/341291a0, 1989.
Zoback, M. D.: Reservoir Geomechanics, Cambridge, Cambridge, 449 pp., 2010.
Zoback, M. D. and Zoback, M.-L.: Tectonic stress field of North America and relative plate motions, in: Neotectonics of North America, Slemmons, D. B., Engdahl, E. R., Zoback, M. D., and Blackwell, D. D. (eds.), Geological Society of America, Boulder, Colorado, 339–366, https://doi.org/10.1130/DNAG-CSMS-NEO.339, 1991.
- Abstract
- Introduction
- New World Stress Map 2025 based on an update of the quality-ranking scheme
- Global stress patterns using the mean SHmax orientation on regular grids
- Conclusions and outlook
- Code availability
- Data availability
- Author contributions
- Competing interests
- Disclaimer
- Acknowledgements
- Financial support
- Review statement
- References