the Creative Commons Attribution 4.0 License.
the Creative Commons Attribution 4.0 License.
 | 19 May 2026
Persistent deformation in a post-collisional stable continental region: insights from 20 years of cGPS in Romania
Laura Petrescu
Boudewijn Ambrosius
Felix Borleanu
Eduard Ilie Nastase
Ioan Munteanu
The Carpathian Region, located at the edge of the East European Platform, presents a unique tectonic setting where major deformation associated with subduction and collision appears to have ceased around 8 million years ago. Yet vertical movements and seismicity continued afterward till the present day, suggesting ongoing crustal deformation and challenging our understanding of intraplate earthquakes and the processes driving these phenomena in an area considered a stable continental interior. In this study, we analyze over two decades of continuous GPS (cGPS) data from 143 permanent stations to estimate both horizontal and vertical crustal motions, constructing the most accurate model of crustal deformation in the region to date. The estimated velocity field indicates a southward drift of the South Carpathians and Moesia relative to Eurasia, with velocities ranging from 0.5 to 2 mm yr−1. We detect a more complex pattern of vertical uplift and subsidence in the foredeep, challenging a previously held view that this region is solely subsiding. This pattern may reflect localized uplift in response to processes such as the Vrancea Slab break-off beneath the South-East Carpathians. Crustal-scale active faults accommodate the observed differential motion, fragmenting the foreland. Furthermore, using a regularized horizontal velocity vector field, we estimate strain rate variations, maximum shear strain, and dilatation patterns across Romania, which align with observed stress regimes and earthquake mechanisms. This agreement validates our results and indicates an influence of surface plate kinematics on the observed seismicity, in addition to the deep Vrancea Slab dynamics. Our findings provide insights into the causes of crustal deformation at the transition between active collision zones and stable continental platforms, enhancing our understanding of intraplate seismicity in regions traditionally considered tectonically stable.
- Article
(14009 KB) - Full-text XML
-
Supplement
(3435 KB) - BibTeX
- EndNote


A key tectonic question lies in understanding the nature of active deformation and frequent seismicity in regions situated at the transition between subduction/collision systems and more stable continental interiors. The Carpathian Region in Romania marks such a transition between the active Africa-Eurasia subduction system to the south and the stable continental core of Eurasia: the East European Platform (Fig. 1). Although this area is not considered a traditionally active plate boundary, with most geological evidence suggesting that major deformation associated with the collision ceased around 8 million years ago (Maţenco and Bertotti, 2000), it continues to experience frequent crustal and subcrustal seismicity. Active deformation and seismicity are observed along major faults and geological contacts (e.g., swarms near Tg. Jiu and Galaţi, Craiu et al., 2017; Radulian et al., 2023; Borleanu et al., 2024). Notably, the Vrancea Slab, a relic lithospheric plate sinking, retreating, and stretching beneath the East Carpathians Bend Zone, may still be coupled with the overlying crust, as suggested by the thermochronological studies, which showed an increase in uplift, post 8 Ma, especially along the western flank of the Focsani Basin (Necea et al., 2005, 2013, 2021). This coupling could be driving long-term surface deformation (Ismail-Zadeh, 2012; Petrescu et al., 2021), contributing to ongoing seismicity (Radulian et al., 2019; Petrescu et al., 2025) and exhibiting the largest present-day strain concentration in continental Europe (Wenzel et al., 1999).
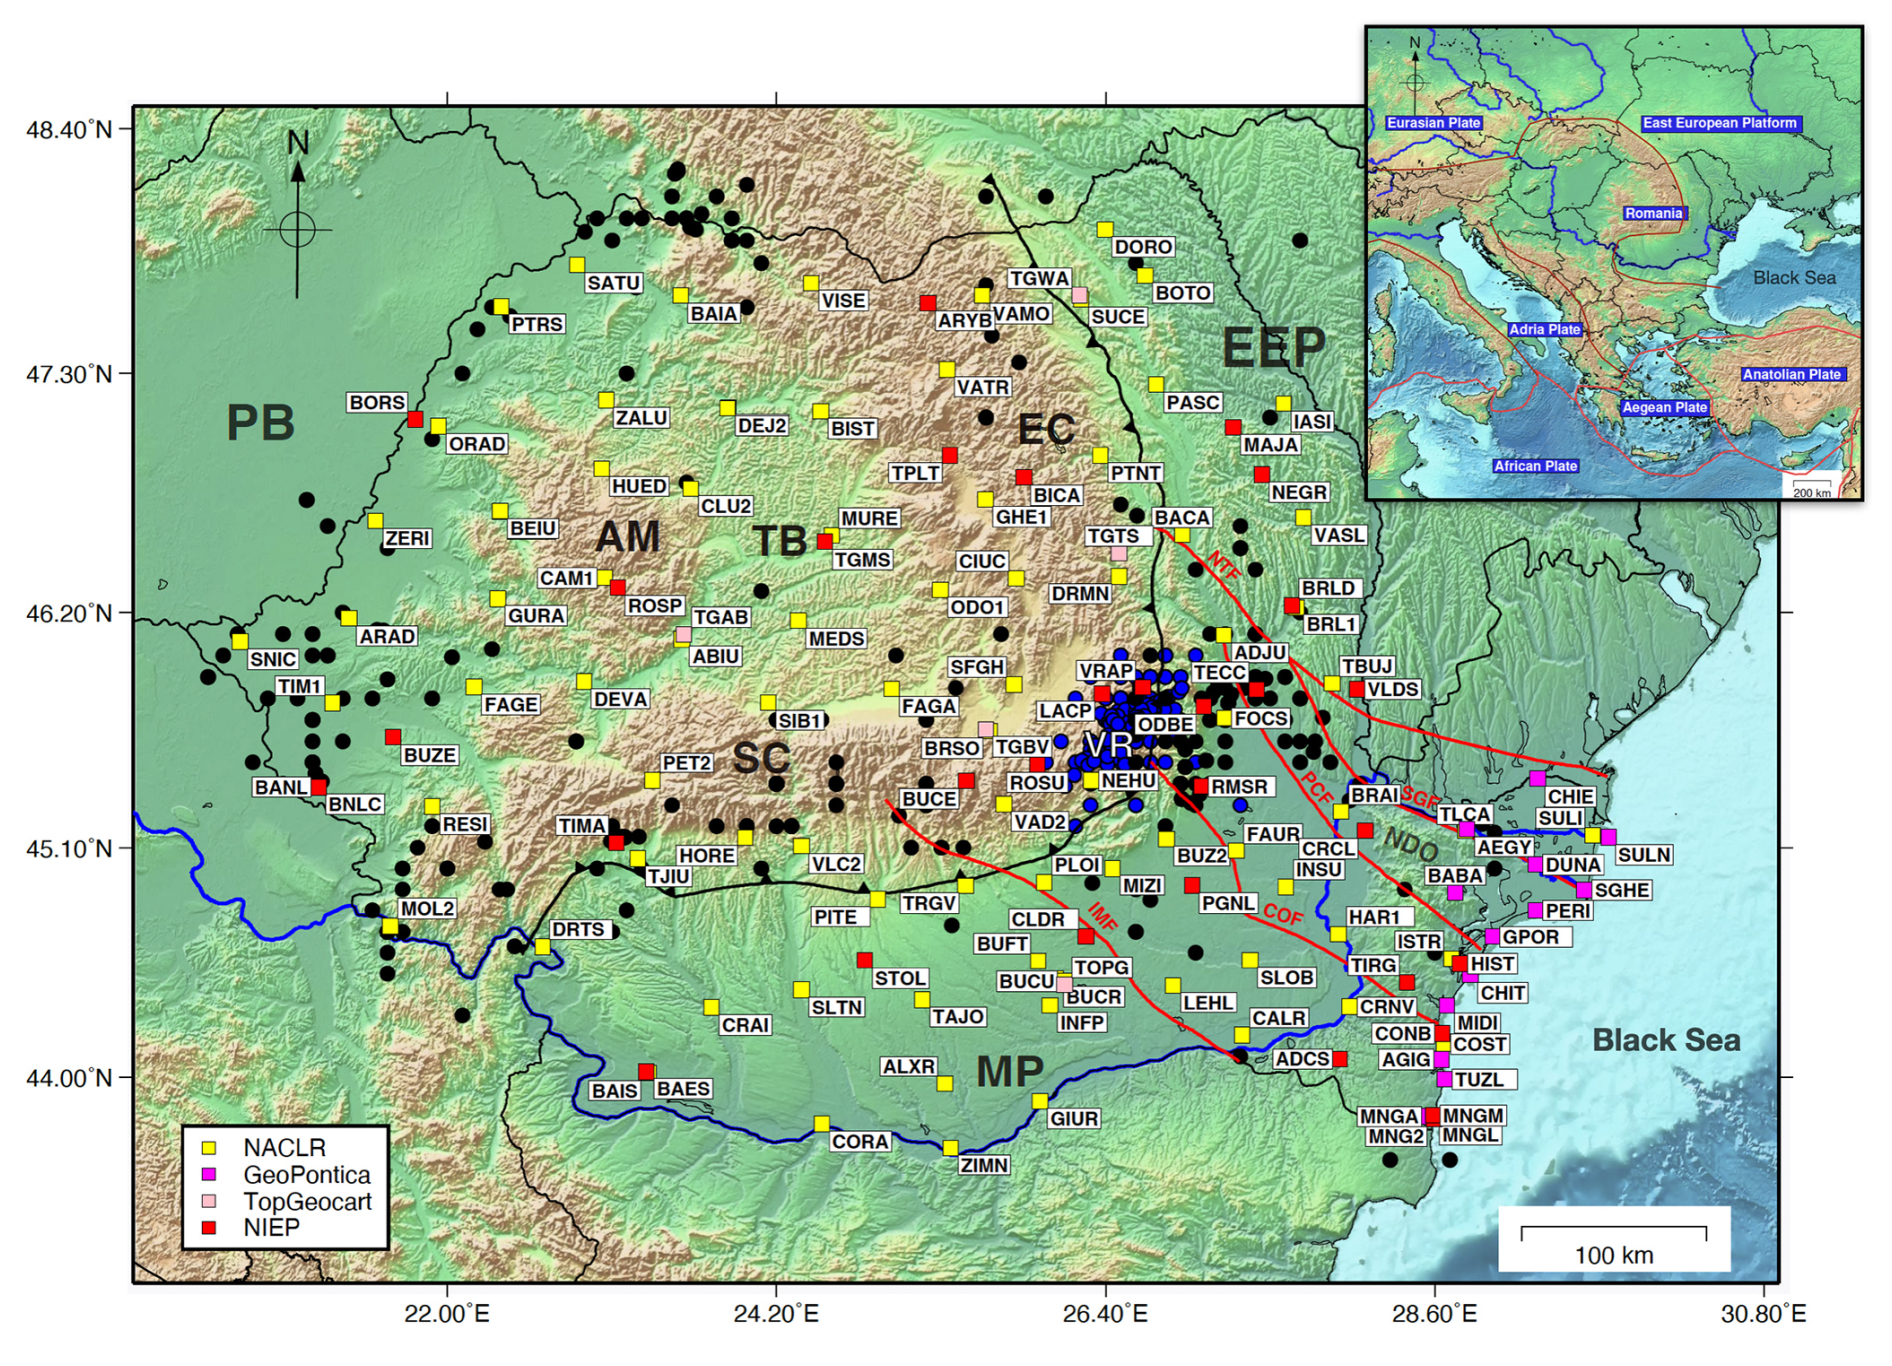
Figure 1The distribution of the available cGPS stations used in this study (coloured squares), and earthquakes distribution according to the Romanian earthquakes catalog (ROMPLUS, Popa et al., 2022) between August 1679 and September 2024. Earthquakes are color-coded by depth: black for crustal events (H<60 km, Mw >3.5), blue for intermediate-depth events (60<H (km) <167, Mw >4). The major faults are plotted as solid red lines and identified with their acronyms: IMF – Intra-Moesian Fault, COF – Capidava Ovidiu Fault, PCF – Peceneaga Camena Fault, NTF – New Trotus Fault, and SGF – Sfântu Gheorghe Fault. The old trust fault is represented by a solid, black, toothed line. The major tectonic units are in bold characters: AM – Apuseni Mountains, SC – South Carpathians, EC – East Carpathians, VR – Vrancea, NDO – North Dobrogea Orogen, PB – Pannonian Basin, TB – Transylvanian Basin, EEP – East European Platform, and MP – Moesian Platform. Further acronyms in the color legend box include: NACLR – National Agency for Cadastre and Land Registration, GeoPontica – National Research-Development Institute for Marine Geology and Geoecology GNSS network, TopGeocart is a private company, operating its own GNSS network, NIEP – National Institute for Earth Physics. The inset shows the regional tectonic setting, with plate boundaries indicated in red.
Measuring crustal motion is relevant for understanding ongoing deformation processes and seismic hazards in such a tectonically complex region. In this study, we estimate both horizontal and vertical motions using Global Positioning System (GPS) data from permanent stations that operated in Romania in the past 20 years. These measurements provide key information about how the region is deforming and how this relates to the observed seismicity. The data also shed light on the connection between surface deformation and subsurface dynamics, including the potential role of the sinking slab in driving seismic activity. Furthermore, the GPS data allows us to assess whether deformation is concentrated along major fault zones or more broadly distributed across the crust, offering a clearer picture of how past tectonic events continue to shape the region's seismic behavior.
The first vertical velocity maps of Romania, based on repeated leveling data from first- and second-order national network lines, were published by Cornea et al. (1978, 1979a, b). Following the major earthquake of 4 March 1977 (M 7.2), high-accuracy leveling measurements allowed for the development of a more refined vertical velocity map (Popescu and Dragoescu, 1987). Subsequent research extended these efforts to the broader Carpatho-Balkan region (Joó et al., 1987). Dinter and Schmitt (2001), after two years of GPS monitoring in Romania, detected no measurable deformation but recommended expanding the network and conducting repeated measurements at two-year intervals to capture crustal dynamics better. Van der Hoeven et al. (2005) later published results from annual GPS campaigns conducted between 1997 and 2004. However, velocity solutions derived from temporary GPS deployments were subject to influences such as equipment changes, monument removals, and antenna setup inconsistencies, as well as local effects such as sediment compaction and site instability. Compared to the high precision of modern continuous GPS (cGPS) solutions, the historical campaign data exhibit three to four times higher uncertainty (van der Hoeven et al., 2005). These limitations highlight the need for continuous GPS measurements to better resolve crustal and mantle dynamics in geologically active regions.
The tectonic evolution of the Romanian region is essential for understanding present-day deformation and seismic activity. The Carpathian Mountains dominate the topography, with neo-tectonic and associated seismicity pervasive in the East Carpathians Bend Zone and extending into the South Carpathians and the surrounding foreland (Petrescu et al., 2021), underlain by the Moesian Platform (MP), a thick lithospheric block with Precambrian-aged basement, shaped by multiple tectonic phases throughout the Paleozoic to Cenozoic times (Fig. 1). Th MP is bounded by two Alpine Orogens, the Carpathians to the north and West and the Balkanides to the south, while the eastern margin extends into the Black Sea Basin. It is largely covered by Neogene sediments and extends eastward to the Black Sea, where its uplifted basement is exposed in the Dobrogea Region. The platform is separated into crust blocks by several faults, such as the Intra-Moesian Fault (IMF) and the Capidava-Ovidiu Fault (COF, Fig. 1).
To the northeast, the MP transitions into the East European Platform (EEP), a thick and geologically stable continental core that forms part of the Eurasian Plate. The boundary between the two is marked by the North Dobrogea Orogen (NDO) (Hippolyte, 2002), a remnant of the Hercynian Orogeny (Seghedi et al., 1999), located between the Peceneaga-Camena Fault (PCF) and Sfântu Gheorghe Fault (SGF, Fig. 1). Part of this now partially eroded orogen is buried beneath Neogene foredeep sediments from the younger Carpathian collision, while to the east, it has undergone uplift.
Over the past 20 million years, the concomitant roll-back of the Carpathian and Dinaridic Slab Adria Plate led to the opening of the Pannonian Basin coeval with the formation of the Carpathian Fold and Thrust Belt of the Outer Carpathians and associated foreland basin (Balla, 1986; Barrier et al., 2018; Maţenco and Radivojevic, 2012), essentially shaping the present-day European continent (Schmid et al., 2020). In Romania, the slab roll-back forced the clock wise rotation of the Carpathian Orogen and obliquely thrusting over the foreland units MP, forming the South Carpathians, and collided with the passive margin of the East European Platform, creating an asymmetric foreland basin (Săndulescu, 1984; Maţenco and Bertotti, 2000; Csontos and Vörös, 2004).
Beneath the Southeast Carpathians, where multiple tectonic units interact, the notorious Vrancea Slab, a lithospheric block that is plunging almost vertically into the mantle (Ren et al., 2012). It is stretching and causing frequent high-magnitude destructive earthquakes in Romania, both at intermediate depths and in the overlying crust (Radulian et al., 2019; Petrescu et al., 2021; Enescu et al., 2023). Analysing the crustal motions above this sinking slab provides an opportunity to gain insights into crustal deformation in a triple-junction tectonic setting (Beşuţiu et al., 2017). Major collisional-related shortening deformation in the Carpathians is thought to have ended around 8–11 Ma, based on the cessation of late Miocene thrusting (Maţenco et al., 2007 and references therein), while fission-track analysis suggests the onset of exhumation (or uplift) at 4 Ma in the SE Carpathians and 12 Ma in the East and South Carpathians (Sanders et al., 1999; Cloetingh et al., 2006). Present-day GPS measurements provide valuable insights into how these long-term geological processes continue to shape ongoing crustal motion and deformation, particularly in the Vrancea Zone (Fig. 1), where slab-related dynamics are still influencing surface motion. The crustal deformations observed today are also influenced by the relative motion of surrounding crustal blocks, complicating the understanding of the region's complex and dynamic geological behavior.
We analyzed data from cGPS stations across Romania, which are part of four different networks (Fig. 1). The primary network, supported by the National Institute for Earth Physics (NIEP), was first developed in 2001. Initially, the network consisted of seven stations, equipped with Leica CRS1000 receivers and LEIAT504 choke-ring antenna protected by a dome. These stations were placed in remote areas and were designed to operate with minimal maintenance, relying on power converters and batteries. Over time, the network has grown, and today it includes 33 stations, with five of the original stations still in use. The newer stations are equipped with Leica GRX1200, LEIAR GR30, and GR50 receivers. Most of the antennas are Leica (LEIAT504, LEIAR10, LEIAR20) and are placed on concrete pillars. Only one is mounted on a polar mast (MNG2). The stations transmit real-time data via the internet, and NIEP is responsible for the equipment, installation, ongoing maintenance, and data analysis.
We also used GPS data from the GeoPontica network, developed by the National Research and Development Institute for Marine Geology and Geoecology (GeoEcoMar), the National Center for Monitoring and Alarm to Natural Marine Hazards – Euxinus, covering the period from 2013 to the present. This network includes 13 stations, the antennas are mounted on a deep-drilled, braced monument. In addition, we included data from the ROMPOS (NACLR) network, managed by the National Agency for Cadastral and Land Registration, comprising 86 reference stations across Romania. We were also granted access to data from the private TopGeocart network, which includes 8 stations. Most of these GPS antennas are mounted on building rooftops or fixed to the structures housing the receivers.
In total, this selection resulted in 143 available stations. The data are stored in a repository, organized by network, year, and Julian day, in the Receiver Independent Exchange (RINEX) version 2 and 3 format, sampled at 30 s intervals. For this study, we only selected stations that are (still) operational after 1 January 2024. This reduced the selection to 130 stations (Fig. 1).
For the data processing, we use the GipsyX software (Bertiger et al., 2020), developed at NASA's Jet Propulsion Laboratory (JPL), Pasadena, USA. It features Precise Point Positioning (PPP), which enables (daily) geodetic position determination of a single GPS station. Accuracy can vary depending on the quality of the GPS receiver, the antenna, and local conditions (e.g., multipath). Weekly updated data files, provided by JPL, contain precise GPS satellite orbits, Earth Rotation Parameters (ERP), satellite clock corrections, spacecraft altitude information, and so-called wide lane phase biases to enable signal ambiguity resolution. In addition, we apply ocean loading corrections for each station, obtained from the Onsala Space Observatory, Chalmers University of Technology (Bos and Scherneck, 2011). To model the wet tropospheric signal delays, we use data from VMF (Vienna Mapping Functions) (re3data.org, 2016).
Processing the recordings from the 130 selected stations with this software resulted in a repository with daily solutions for each station. Subsequently, to reduce noise, we combined the daily solutions into weekly ones. Then, we converted the reference plate of these solutions to the Eurasian tectonic reference plate using the ITRF14 rotation parameters of that plate (Altamimi et al., 2017). From this data, we created a time series for each station. To evaluate the impact of reference frame choice, we tested several local transformation approaches, including Euler pole rotation, network mean removal, and selected-station mean removal. Statistical comparisons showed that the Euler pole rotation was similar to the EU14 reference frame, which further justifies using EU14 as our preferred reference frame (Figs. S1, S2, and S3; Tables S5 and S6 in the Supplement).
Next, we estimated a linear trend (velocity), yearly, and half-yearly seasonal signals. In addition, for undocumented changes, the estimation model also includes position jumps at times identified from an inspection of the raw time series. All recent time series are affected by a reference frame change on 19 August 2024, by JPL. These are now also modeled as position jumps. An example of the results is presented in Fig. 2 for the long – lived station VRAP. Apparently, this station was re-equipped in 2011, and from the vertical residuals, it seems that it took a few years to settle down on its original monument.
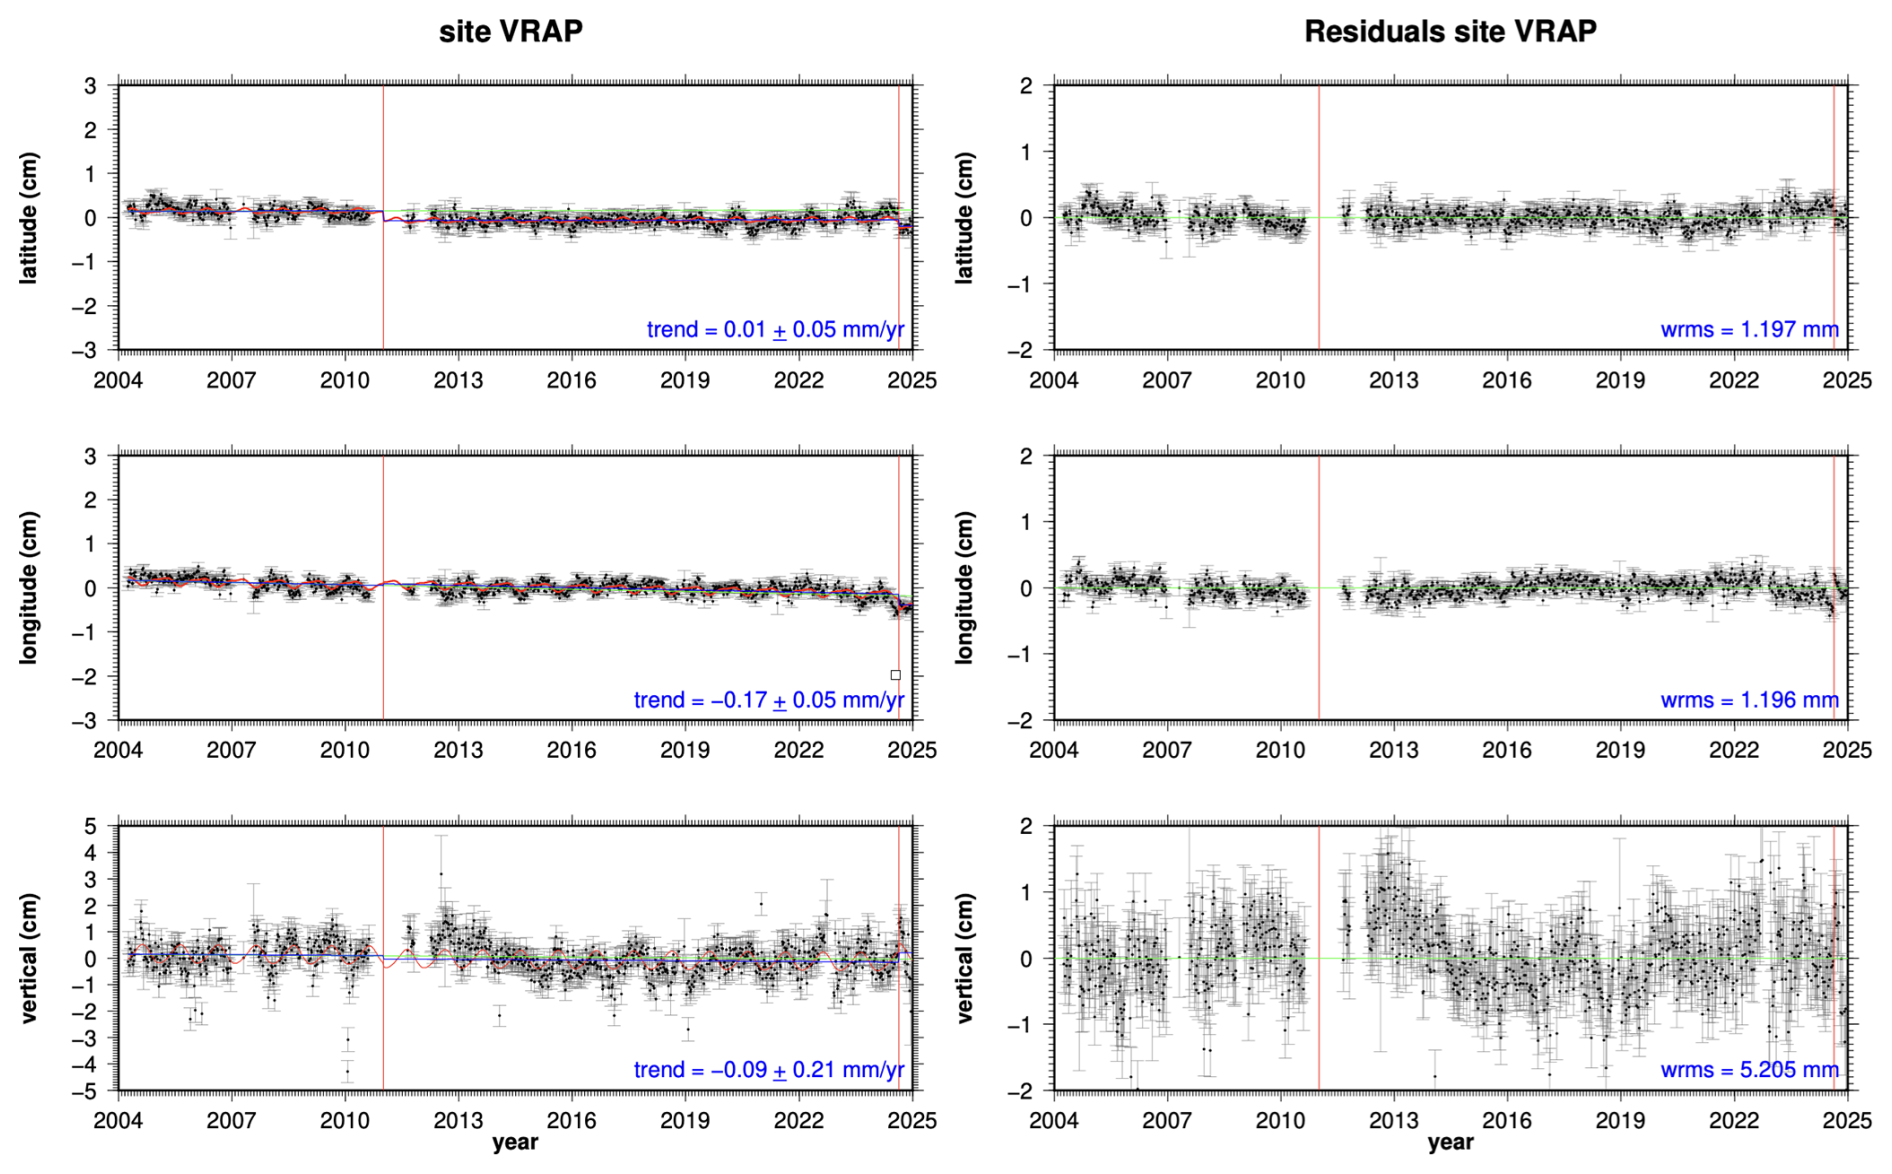
Figure 2Time series of the VRAP station. The left panel shows the raw series with the modeled functions. The red curve represents the estimated yearly and half-yearly functions. In the left panel, the green line represents the estimated velocity before the first jump. The vertical red lines represent position jumps. The right panel shows the residuals after subtracting the modeled functions, including the estimated position jumps.
4.1 Horizontal time series selection and quality control
In this step, to ensure the best possible quality of the time series solutions, we selected stations with uncertainties (sigmas) less than 0.2 mm yr−1 and velocity vectors smaller than 2 mm yr−1. We consider that these criteria guarantee a reliable selection of credible solutions. However, a small number of these sites still exhibit anomalous velocities. These are likely caused by local effects such as landslides, station instability, local geological conditions, subsurface compaction, undocumented antenna changes, and multipath interference. The main reason is that most GPS antennas are mounted on buildings and unstable steel rods. In our analysis, we try to model them as position jumps. The dates of these “unknown” jumps were established using a manual process by examining the “raw” time series plots for each station.
This process automatically eliminates the shorter-lived time series, reducing the number of accepted solutions to 99, with the shortest series extending more than four years. This means that all 99 accepted solutions satisfy the criterion established by Blewitt et al. (2001), who claim that the series should be longer than two and a half years for a reliable estimate of the seasonal terms, which is essential for the reliability of the velocity estimate.
The accuracies (σ) at the 95 % confidence level were estimated using the weighted root mean square (WRMS) of the fit according to the formula:
where Tspan is the length of the time series in years. This approach provides estimates of velocities and their uncertainties. This empirical approach relates the scatter of the residuals to the stability of the velocity estimate and provides a practical measure of the combined effect of unmodeled noise sources. A similar approach has been previously applied in geodetic studies (e.g., Muntean et al., 2016).
The use of WRMS-based uncertainties is justified by the relatively long duration of the analyzed time series (all exceeding four years), which reduces the impact of temporally correlated noise on velocity estimation. In addition, careful modelling of discontinuities (e.g., offsets due to equipment changes or local effects) further minimizes bias in the residuals. Under these conditions, the adopted approach provides stable and internally consistent uncertainty estimates across the network. Quantitatively, the mean uncertainty is 0.12 mm yr−1, yielding a mean signal-to-noise ratio of 4.9, with values reaching up to 15. These results indicate that the observed velocities significantly exceed their formal uncertainties and are therefore well resolved (Fig. S4).
We also compared our results with those of Piña-Valdés (2022) for stations with common solutions and found an average difference of less than 0.08 mm yr−1 (Figs. 3 and S4 and S5 in the Supplement). This level of agreement demonstrates general consistency. The results for the 99 accepted sites are summarized in Table S1 in the Supplement.
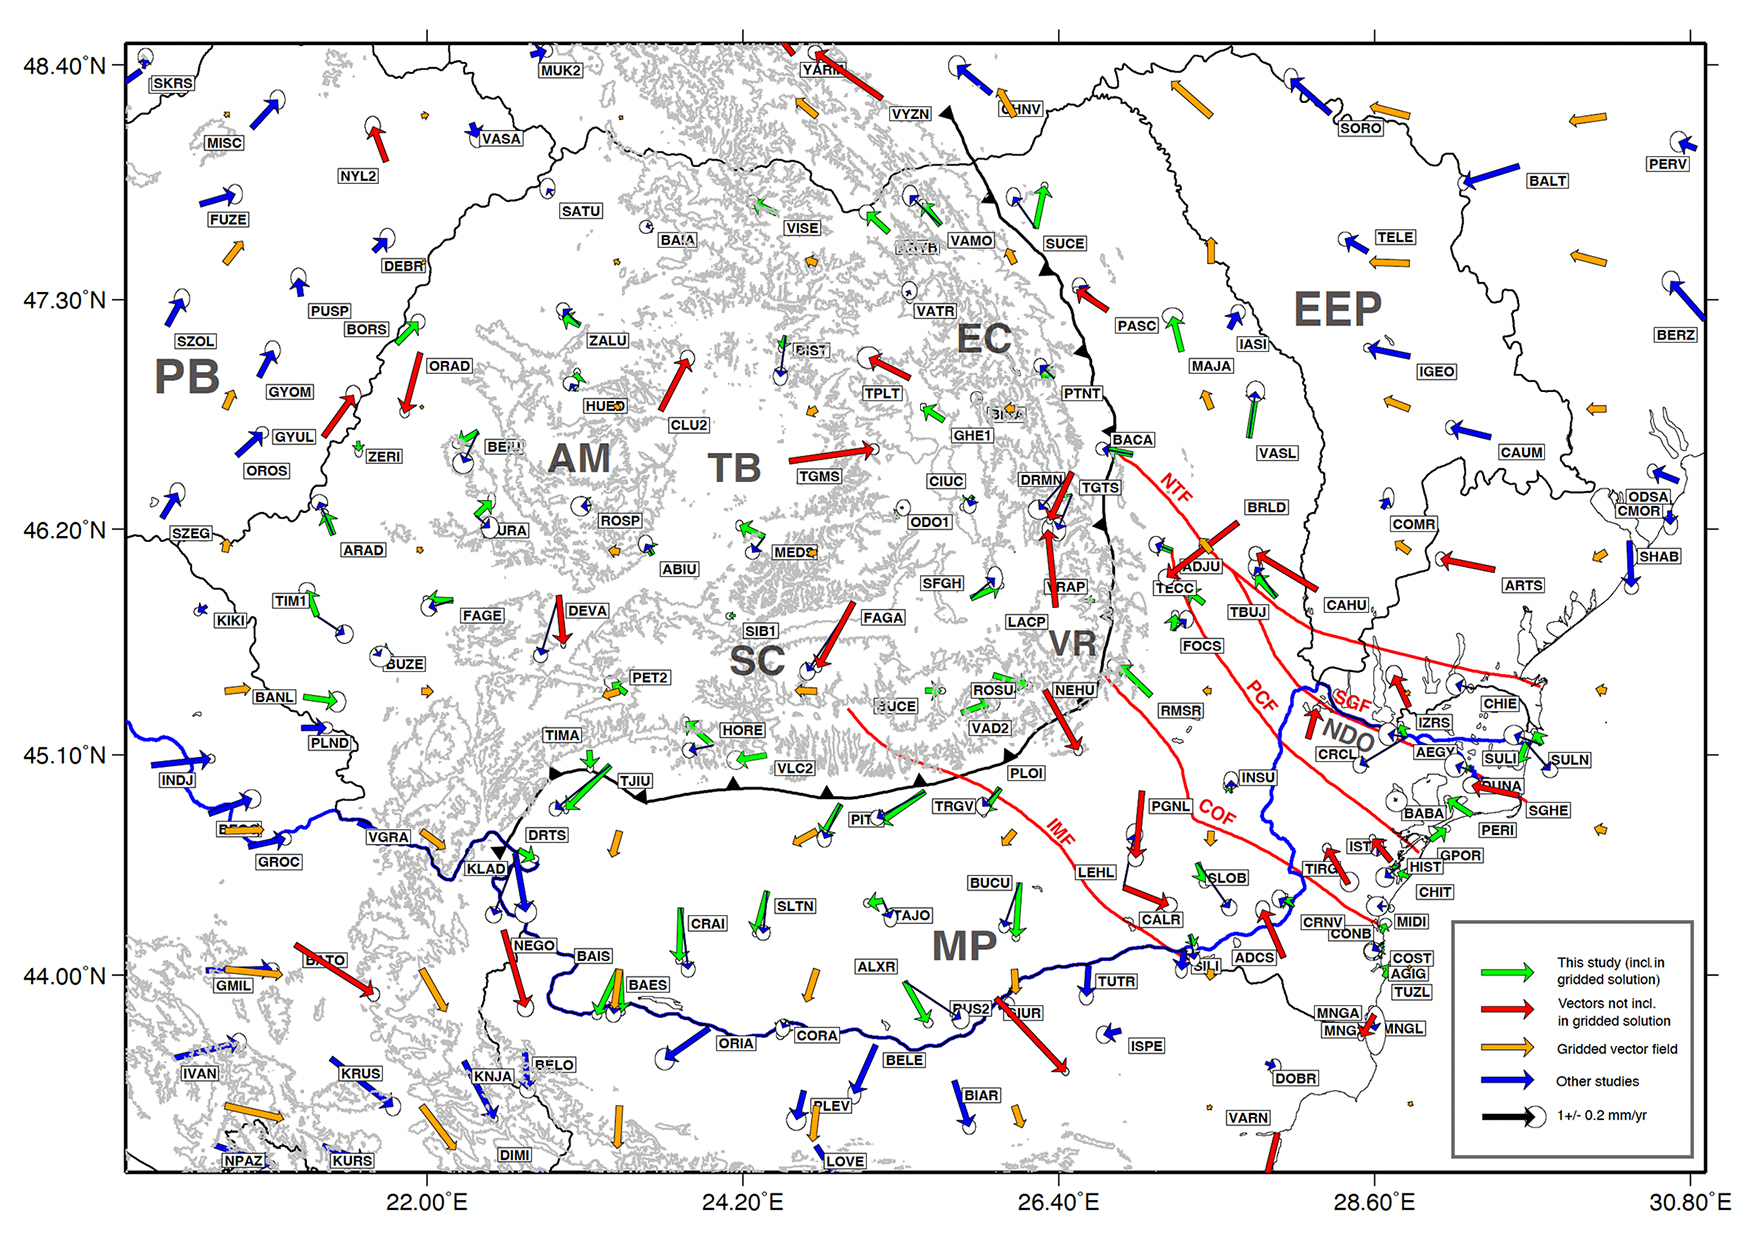
Figure 3GPS-derived horizontal velocity vectors with respect to the ITRF-2014 Eurasian plate according to Altamimi et al. (2017). Green vectors represent our results, blue vectors were taken from Piña-Valdés et al. (2022). The red vectors were excluded while creating the interpolated velocity field on a regular (8×8) grid, represented as orange vectors. The error ellipses are 95 % confidence level. Faults and acronyms are as in Fig. 1.
4.2 Creating a gridded, smooth horizontal velocity field
To create a smooth, coherent representation of the computed time series solutions, we use a spatial gridding approach: we set up an 8×8 grid of latitude and longitude nodes with each node linked to a square search box. The size of these boxes depends on the distance (in km) between nearby nodes, ensuring the north-south and east-west dimensions are equal. The next step we eliminate outliers with a velocity larger than two times the median. Then, we calculate the average of the EW and NS velocity components of the remaining solutions. During this process, 22 of the 99 solutions are excluded as outliers. The final result is a gridded dataset of 47 nodes showing the velocities for each node. The other 17 nodes are not presented since there were no Romanian cGPS stations available in the search area (see Table S2 in the Supplement).
When we include the literature (Piña-Valdés et al., 2022; Serpelloni et al., 2022), solutions for the countries neighbouring Romania, the number of solutions increases to 160. After applying the aforementioned editing step, this number decreases to 133. These solutions are based on a collection of shorter time series from before 2021. Nevertheless, they provide valuable additional information.
4.3 Vertical data selection
For the vertical component, we apply a different approach. This component is hardly affected by horizontal station instabilities, but mostly by undocumented antenna changes. We tackle this problem by estimating vertical position jumps on the dates when they appear in the time series. Furthermore, we select only solutions with an absolute velocity <2 mm yr−1 and an accuracy <1.0 mm yr−1, which we consider credible. Some sites show subsidence, but these are mostly located in coastal areas, on slow landslides, and compacting sedimentary areas. As a result, from the 130 available solutions of the four Romanian permanent networks, 95 solutions were accepted (Fig. 4). The results are presented in Fig. 4 and Table S3 (Supplement). We also compared our solutions with those of Piña-Valdés (2022) and found an average difference of less than 0.03 mm yr−1.
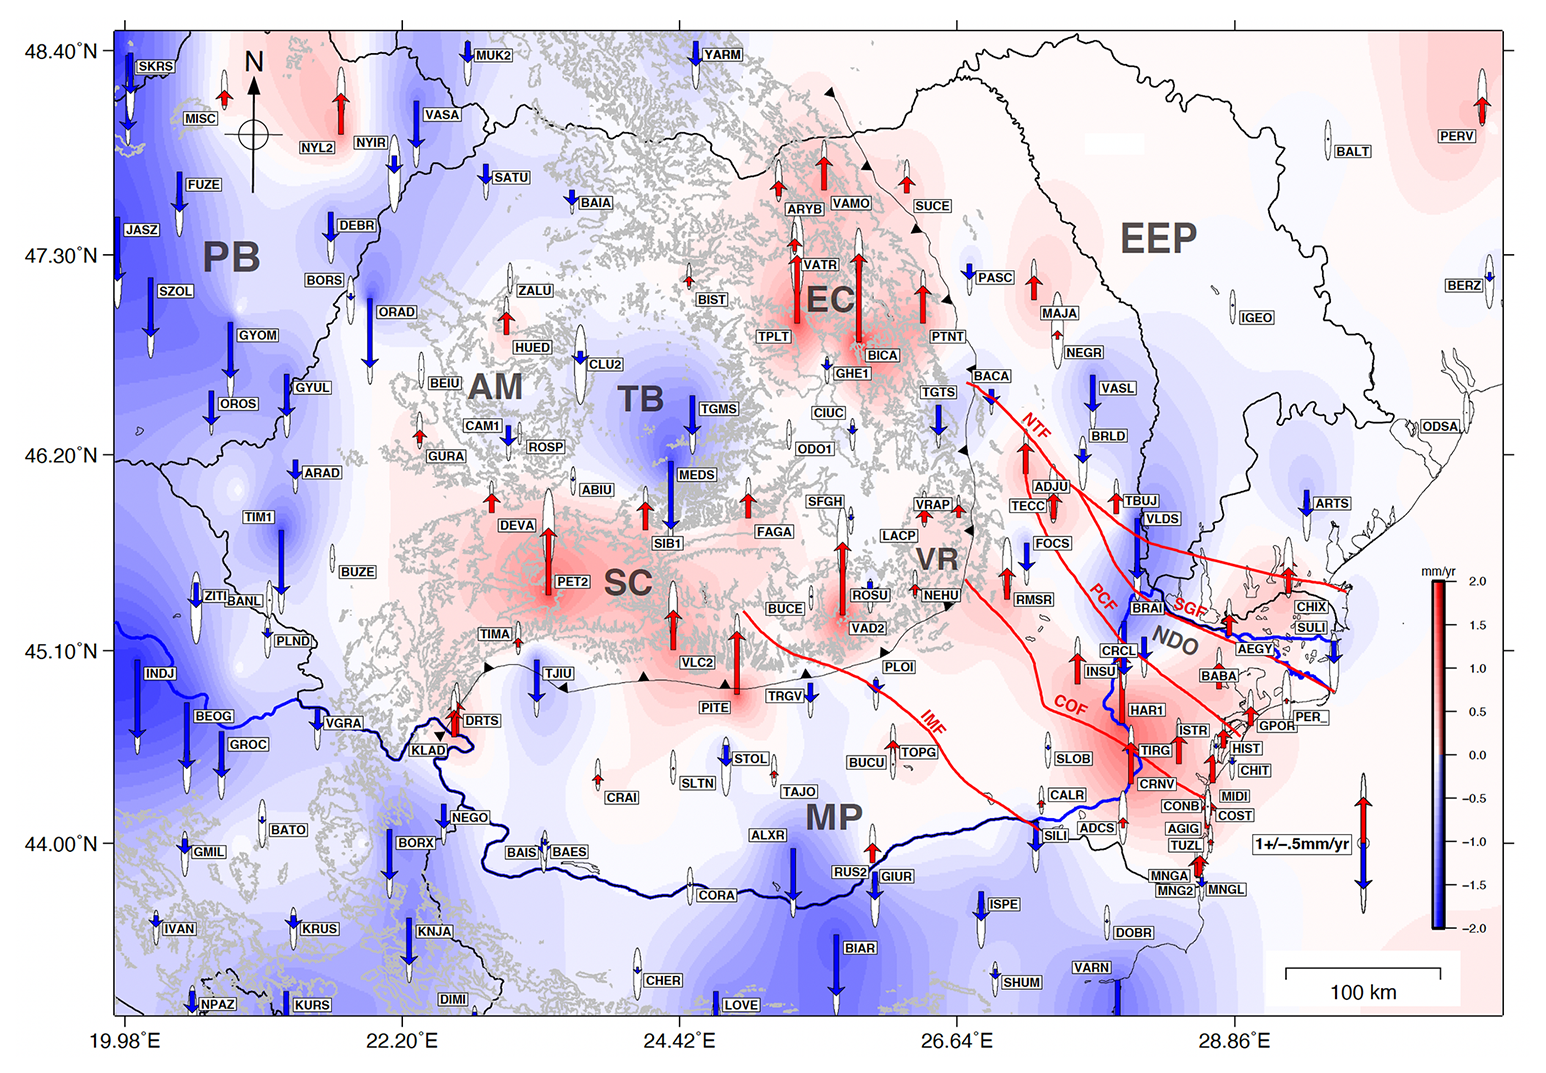
Figure 4GPS-derived vertical velocity vectors. Red vectors indicate uplift, while blue vectors indicate subsidence. The background is a gridded interpolation field. The error ellipses are at the 95 % confidence level. Faults and acronyms are as in Fig. 1.
When we include the literature solutions, the pattern does not change much. It mostly adds subsidence sites in the area west and south-west of Romania. The total number of accepted vertical sites increased to 145.
4.4 Strain rate estimation
To better understand deformation and seismic hazard in this complex tectonic region, we further estimate strain rate from the interpolated horizontal vector field of GPS velocities (Fig. 3). We use the open-source software STRAINTOOL, which employs the VISR (Velocity Interpolation for Strain Rate) algorithm developed by Shen et al. (2015). This algorithm interpolates our gridded solution to derive horizontal strain rates across the region, using a weighted least squares approach on a denser regular grid. At each grid point, the horizontal velocity field is approximated by a bilinear function, and a Gaussian function based on the distance between the interpolation grid point and the other grid points is used for distance-weighting. This algorithm allows us to obtain the spatial variation of strain rate, including the maximum shear strain rate (which indicates how much the crust is laterally distorted), and the dilatational strain rate (which reflects areas of extension or compression). These are valuable parameters for understanding the tectonic regime, whether a region is being compressed, extended, or sheared, and how this deformation relates to observed earthquake focal mechanisms.
5.1 The horizontal velocity field
Many horizontal velocity measurements indicate a predominantly southward movement in the MP, with variations spanning approximately ± 20° toward the southeast and southwest (Fig. 3). The IMF appears to mark a slight orientation change from S-SE to S-SW oriented motion vectors. This shift is also reflected in the South Carpathians, which are obliquely thrust over the MP, defined by strong and sometimes sharp lateral variation in rheology across the major faults like IMF or COF, which imposed the formation of tear-faults and oblique ramps into the Carpathian Orogen (Fig. 3). Hence, the magnitude and direction of motion vary significantly across the IMF and COF or other major faults in the MP and foreland units in general, like PCF and NTF, that are defining crustal blocks with different rheologies, thermal history, and response under the orogenic loading. In contrast, vectors in the EEP show a slight northwestward motion relative to the Eurasian plate. This shift occurs across the PCF and NTF, which define the boundaries of the North-Dobrogea Orogen (Fig. 3), a transitional zone between the EEP margin and the MP. As a result, the EEP undergoes a subtle yet persistent movement relative to Eurasia, diverging from the southward-moving MP through a series of crustal-scale faults that accommodate lateral displacement.
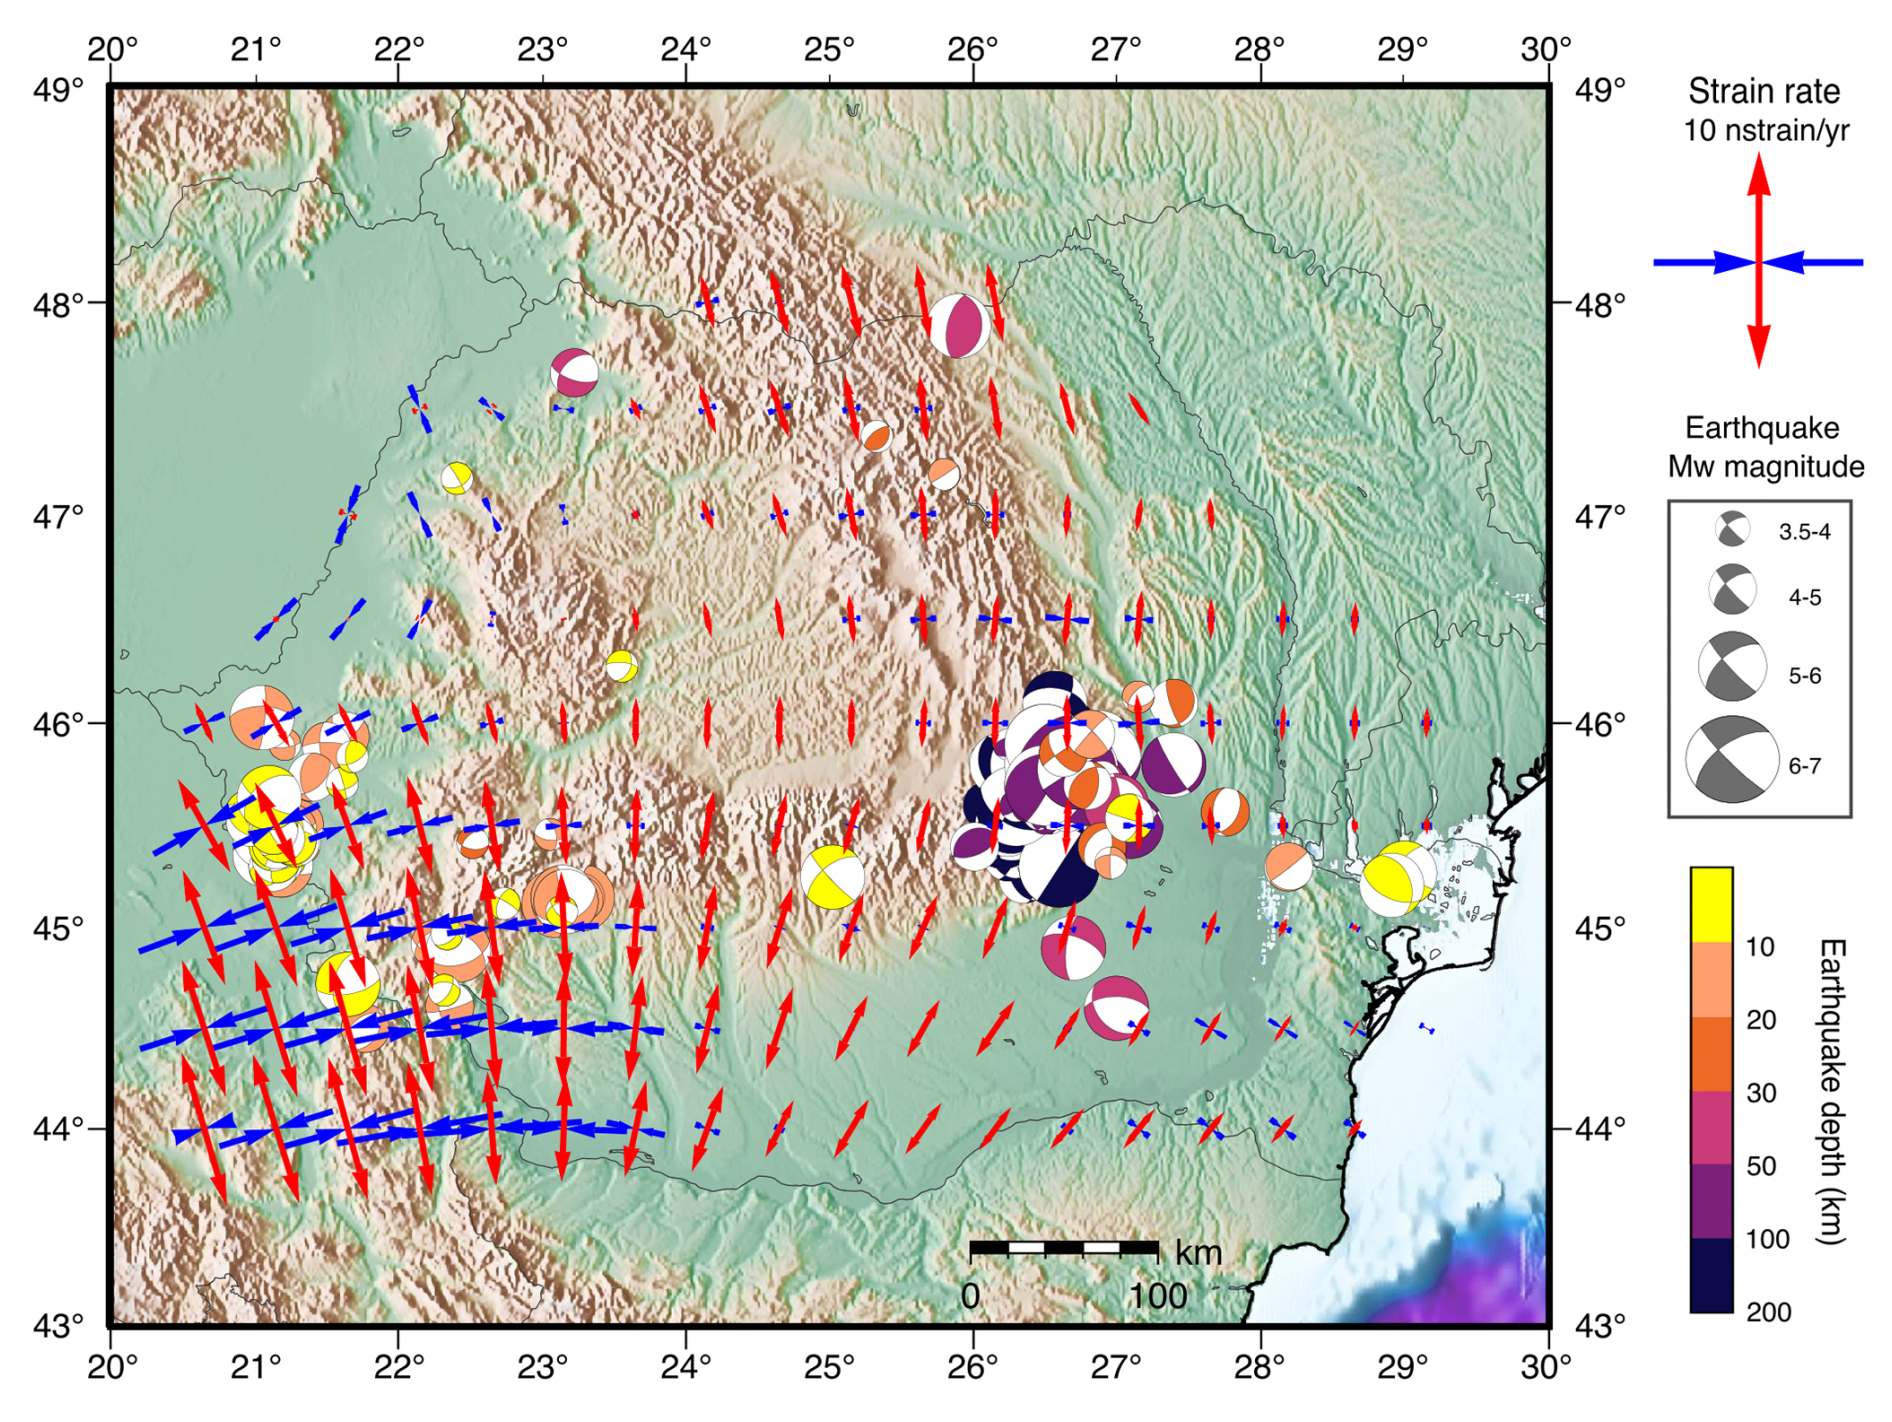
Figure 5Map showing the principal axes of strain rates determined from the regularized GPS horizontal velocity vector field from this study and mechanisms of earthquakes with Mw>3.5 from the REFMC catalogue (Radulian et al., 2019).
The Transylvanian Basin (TB) and the East Carpathians, on the other hand, show minimal horizontal motion. GPS stations in these areas indicate limited deformation, with inconsistent directional patterns and low overall coherence in movement. Small horizontal motions are observed in the Pannonian Basin (PB) in an NNE direction, which reoriented toward different directions near the Apuseni Mountains (see Figs. 1 and 3).
Overall, the foreland region, particularly the MP, appears to be drifting southward, while the other areas remain relatively stable, indicating that the foreland is more dynamically active than the surrounding regions.
5.2 The vertical velocity field
The Carpathians predominantly experience uplift (Fig. 4), concentrated in the East Carpathians (e.g., BICA, TPLT) and the South Carpathians (e.g., VAD2, and PITE). While some scattered stations (ROSU, TGTS) indicate subsidence, the overall trend suggests uplift rates ranging between 0.5 and 2 mm yr−1. The Vrancea bend zone is an interesting exception because it only shows a minor uplift (e.g., LACP and VRAP).
The foreland region exhibits an intricate interplay of uplift and subsidence. The Moesian Platform, which occupies the area bounded by the Carpathians, the Balkans, and the Black Sea, shows a north-south dichotomy in vertical motion. In its southern part, across the E-W trending Danube River and towards the Balkans, the crust is predominantly subsiding. Northward and northeastward toward the Carpathians, the Capidava-Ovidiu Fault, the trend gradually transitions to uplift. The most pronounced uplift occurs in Dobrogea, the exposed basement of the Moesian Platform near the Black Sea, where all geodetic stations record consistent uplift along the coast and the Danube. Notably, the Danube changes its course northward across this transition zone.
The East European Platform, forming the eastern foreland of the Carpathians, exhibits only minor vertical movements. Several stations in its northern part record slight uplift, which transitions southward into subsidence toward the Neogene Trotuş Fault, known in literature as the New Trotuş Fault (Maţenco et al, 2007). This subsiding trend extends farther south into parts of the NDO, continuing across the SGF and the PCF, which delineates the boundary with the MP. On the opposite side, the MP is undergoing uplift, reflecting strong differential crustal deformation along these seismically active fault networks.
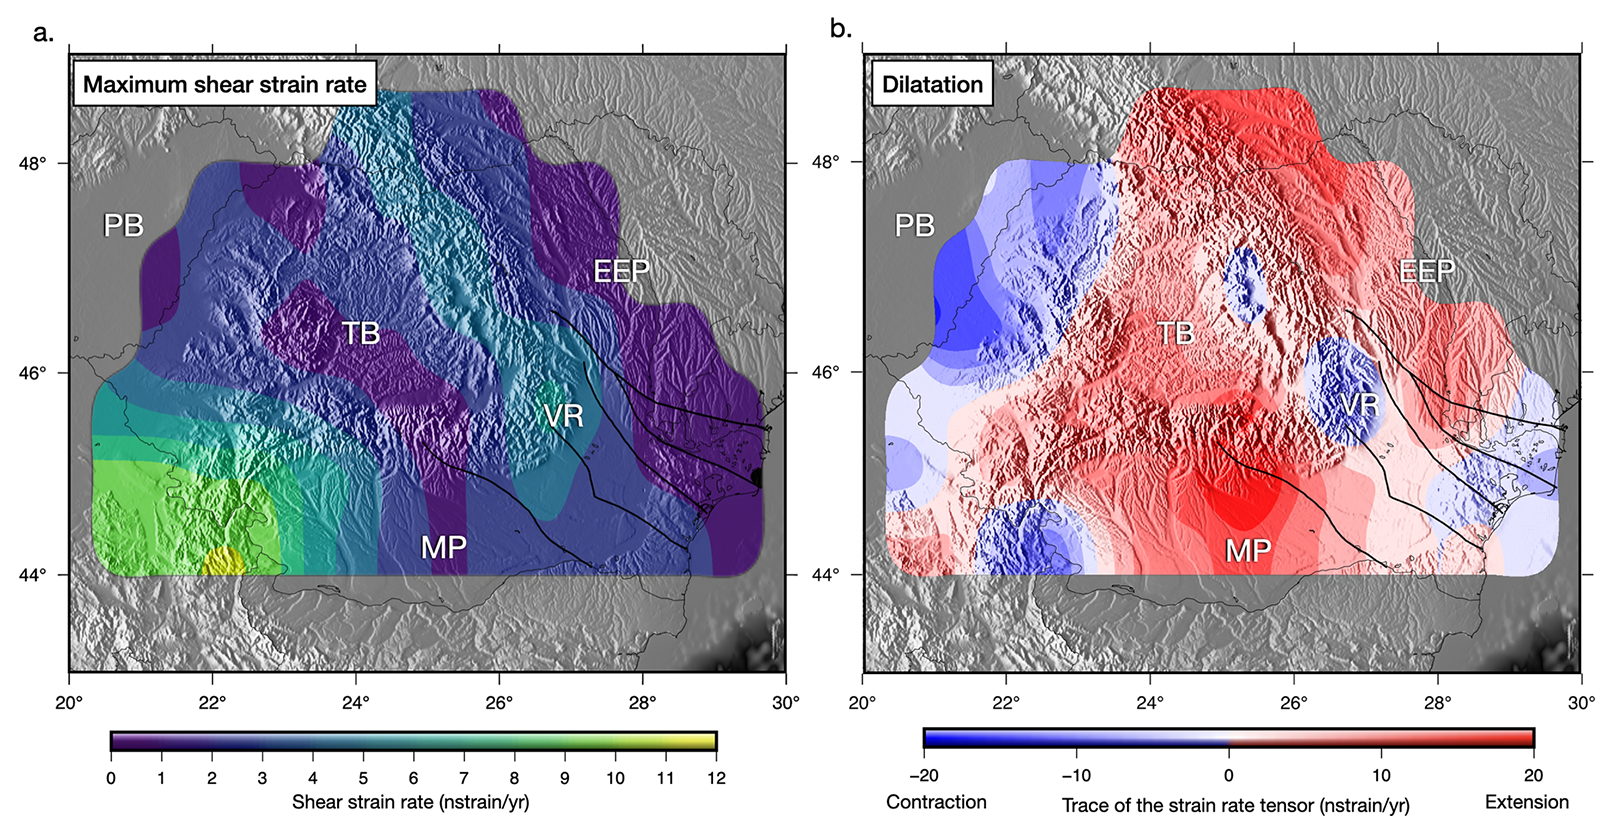
Figure 6Maps showing (a) maximum shear strain rate and (b) dilatational strain rate (both in nanostrain/year), derived from the regularized GPS velocity field in Romania (Table S2 in the Supplement). The maximum shear strain rate illustrates the intensity and direction of lateral crustal deformation, while the dilatational strain rate is the trace of the strain rate tensor (volumetric rate of change) and indicates regions of extension (red-positive) and compression (blue-negative). Major faults are shown as thick black lines. Acronyms are described in the caption of Fig. 1.
In the back-arc region relative to the Carpathians, in the Transylvanian and Pannonian basins, estimated crustal motions suggest subsidence relative to stable Eurasia. However, the Apuseni Mountains, a prominent highland dividing the two subsiding basins, exhibit a cluster of stable and slightly uplifted motion vectors. Plotted vectors range between −2 and +2 mm yr−1, with an uncertainty of 1.0 mm yr−1 (Table S3 of the Supplement). This is a general feature for most stations in Europe.
5.3 GPS-estimated strain rates
We estimated strain rate variation across Romania (Fig. 5) from the regularized horizontal velocity vector field, and the distribution of maximum shear strain rate and dilatation (Fig. 6a, b). The dilatation rate quantifies the extent to which the Earth's crust is either expanding or contracting. It is derived by combining the principal strain rates, with positive values indicating extension and negative values indicating contraction. High positive dilatation values indicate regions experiencing extension, while negative values suggest compression, as seen in processes such as thrust faulting. On the other hand, the maximum shear strain rate measures the degree of shear deformation within the crust, without affecting its overall volume. This is determined by calculating the difference between the principal strain rates. Elevated shear strain rates are associated with regions undergoing significant shear deformation, such as strike-slip fault zones, while lower values typically occur in areas experiencing predominantly extensional or compressional deformation.
The distribution of strain rates is quite complex (Fig. 5 and Table S4 in the Supplement), which is expected given the region's complicated tectonic framework, with multiple blocks of diverse strengths converging to form a sinuous orogenic track. The highest strain rates were estimated in the southwest, at the border between Romania and Serbia (Fig. 6a). This region also experiences the highest shear strain rate (Krézsek et al., 2013)
Dilatation patterns estimated from the strain tensor show a transition from compression in the PB to extension in the intra-orogenic TB. The South Carpathians and the surrounding foreland regions, including the MP and the EEP, are predominantly characterized by extension (Fig. 6b). However, localized areas of compression are observed in the Eastern and South-East Carpathians, particularly in the Vrancea Zone.
6.1 Regional tectonic context
To put our results in a broader context, we plot them against previous GPS-derived velocity vectors (Serpelloni et al., 2022; Piña-Valdés et al., 2022) in Fig. 7. While there is some overlap with the Romanian networks, the differences between datasets are minor. To reduce clutter in the figures and minimize the impact of large tectonic motions in the south, we excluded stations with an absolute horizontal velocity exceeding 7 mm yr−1, as shown in Fig. 7a, horizontal and Fig. 7b, vertical, with the UU-07 seismic tomography model of Amaru et al. (2007), updated based on Wortel and Spakman (2000), at 200 km depth, serving as background.
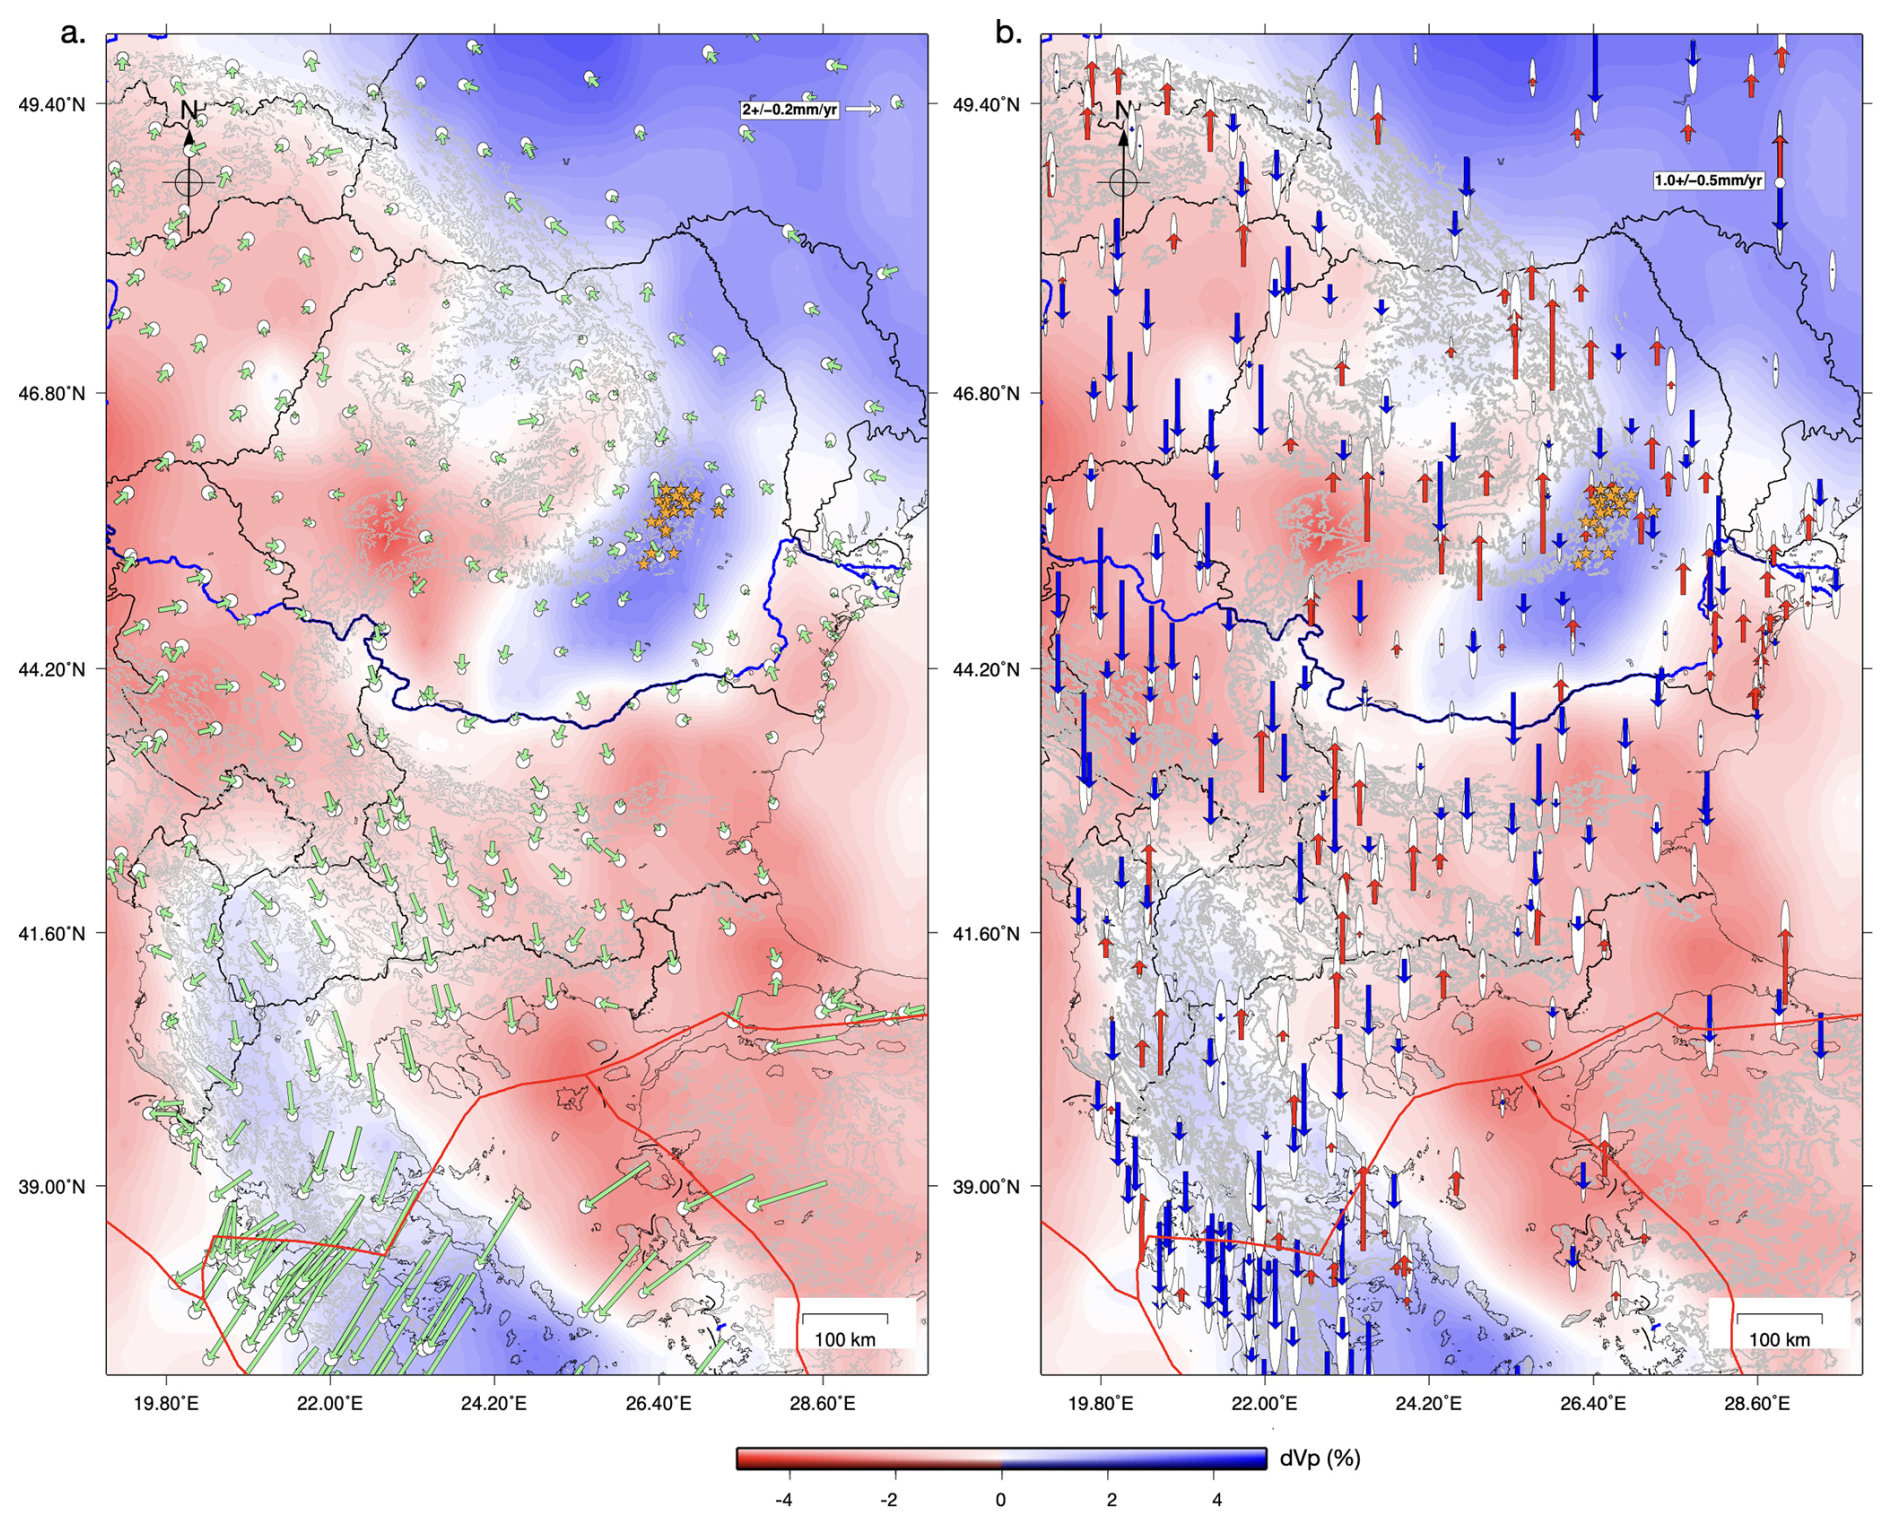
Figure 7Regional horizontal (a) and vertical crustal motions (b) from this study, Serpelloni et al. (2022), and Piña-Valdés et al. (2022). The horizontal vector field was scaled for visibility. The background colours show Vp seismic velocity anomalies at 200 km depth from the UU-P07 seismic model of Amaru et al. (2007). Red lines mark the active plate boundaries between Eurasia, Anatolia, and Aegean plates in the south. Orange stars mark earthquakes Mw>6 from the Vrancea Zone (Radulian et al., 2019).
In the regional plate tectonic context, the observed velocity field highlights the complex interactions between major tectonic plates and blocks that converged in this geodynamically complex region. Seismic tomography shows the high velocity thick cratonic lithosphere to the north-east which is supposed to be tectonically stable, the Vrancea Slab as an elongated high velocity block sinking beneath the Carpathians, and the Adria and the Hellenic slabs subducting beneath the Balkan Peninsula (Fig. 7). To the south, crustal motion velocities increase significantly (Fig. 7), reflecting the rapid motion of the Hellenic subduction system as the African Plate subducts beneath the Eurasian Plate, driving southeastward deformation in Greece. Eastward, the Anatolian Plate is moving westward due to tectonic escape caused by the northward collision of the Arabian Plate with Eurasia. This westward motion is a dominant feature of the eastern Mediterranean and plays a key role in accommodating the overall regional deformation.
To the west, the Pannonian Basin, a hyper-extended lithosphere back-arc basin, shows relatively low horizontal deformation rates, suggesting it is currently tectonically stable, with mirror positive inversion of its eastern margin. However, the influence of the Adriatic Plate, a promontory of the African Plate, is meaningful. The Adria Plate, subducting eastwards (Fig. 7), exerts a northeastward push on the Carpathian-Pannonian system, contributing to compressional forces and tectonic inversion along the basin (Bada et al., 2007). These larger-scale processes interact with the local tectonic architecture, such as the Vrancea Slab and associated seismicity (orange stars in Fig. 7), resulting in a complex and heterogeneous deformation regime that bridges the stable cratonic lithosphere and the active subduction-driven tectonics to the south and south-west.
6.2 Correlation with earthquake mechanisms and stress indicators
The GPS-derived strain rate field across Romania is characterized by a broadly distributed, long-wavelength deformation pattern. At the regional scale, the field is dominated by N-S extension across much of the foreland and the Carpathian chain, transitioning to localized E-W compression in the southwestern and eastern sectors (Fig. 6). While the GPS data provides a smooth representation of the velocity field, the discrete crustal deformation captured by earthquake focal mechanisms (Fig. 5) and stress indicators from the World Stress Map (WSM2016, Heidbach et al., 2007, Fig. 8) or from focal mechanisms inversion (Petrescu et al., 2021) offers a higher-resolution, albeit more heterogeneous, view of how this regional strain is partitioned along inherited structures. This inherent difference in spatial “wavelength” between geodetic and seismic data is essential for interpreting the transition from plate-scale kinematics to fault-specific failure.
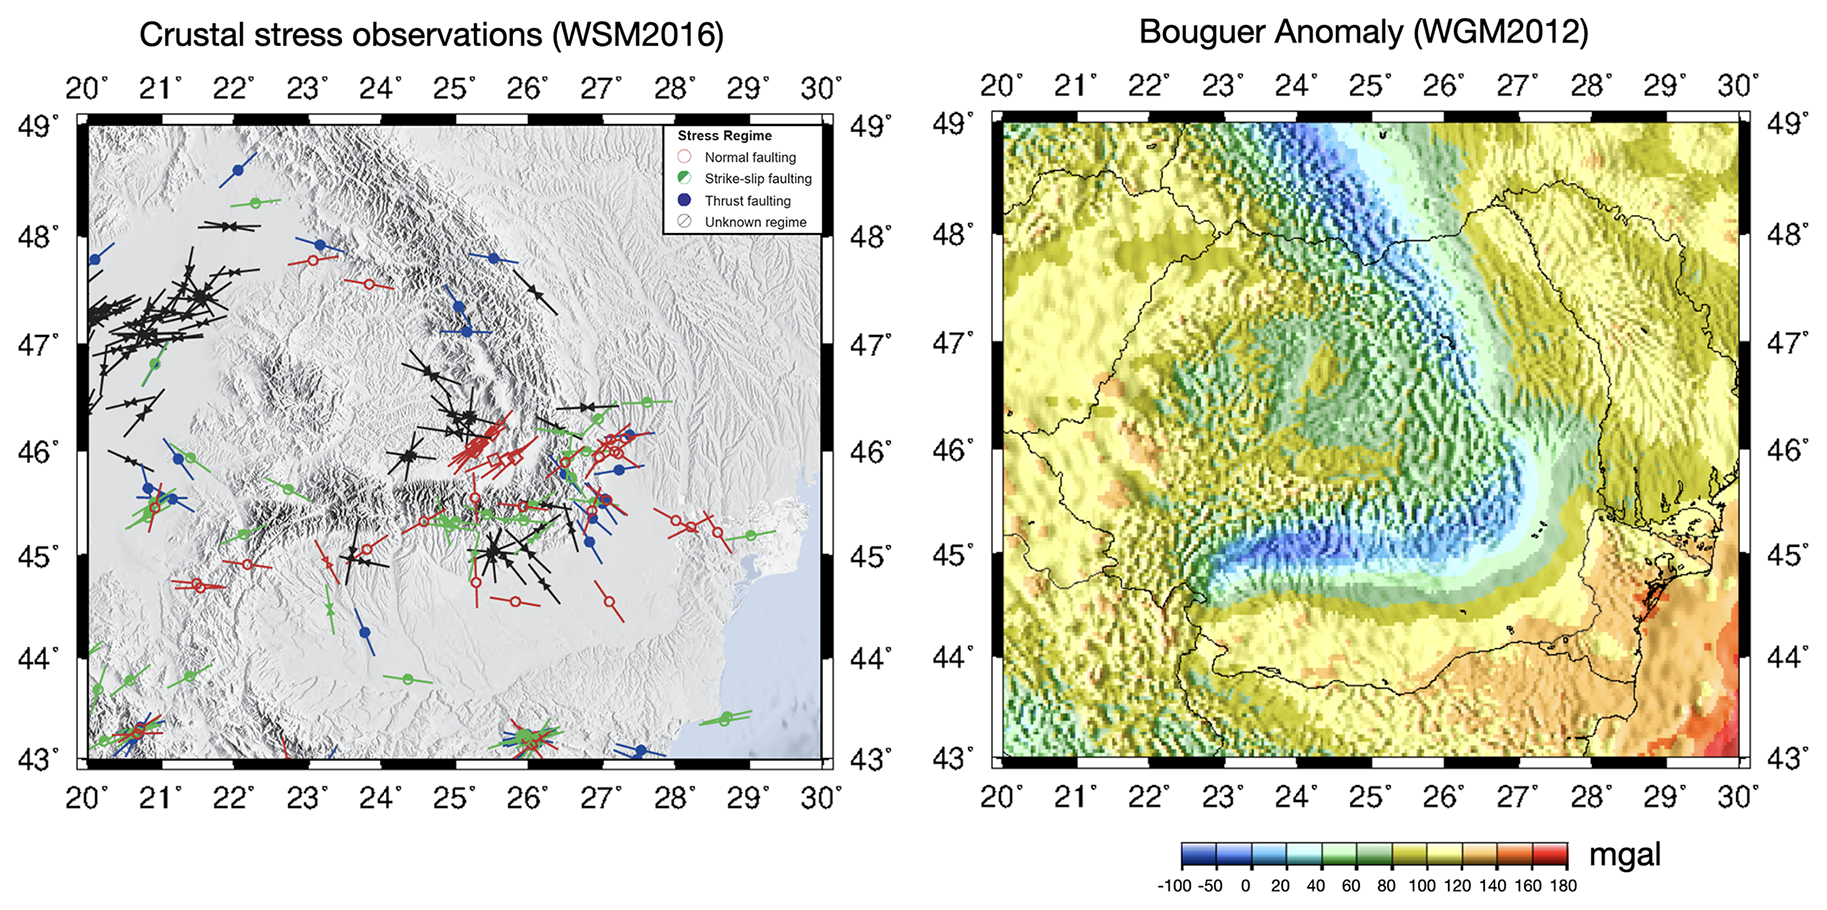
Figure 8Left: Crustal stress observations compiled from focal mechanisms, borehole breakouts, and other geological indicators, from the World Stress Map (Heidbach et al., 2018). Colours indicate the most likely stress regime. Right: Bouguer gravity anomalies from the World Gravity Map (WGM2012) maintained by the Bureau Gravimétrique International (Bonvalot et al., 2012).
Despite these scale differences, we observe some spatial correlations between the strain rate and seismic regimes. In the compressive domains, the negative dilatation rates observed in the Vrancea and the Eastern Carpathians (Fig. 6b) align with clusters of thrust-faulting stress indicators (Fig. 8) and reverse-faulting mechanisms (Fig. 5), confirming localized crustal shortening and compression at the bend zone. Conversely, the extensional signals identified in the foreland and South Carpathians are corroborated by recent normal-faulting earthquake swarms, such as those occurring near the SGF (Fig. 5 and Craiu et al., 2017) and recent intense seismic sequences in the South Carpathians (Radulian et al., 2023; Borleanu et al., 2024). In areas characterized by high shear strain (Fig. 6a), specifically the southwestern Carpathians, the prevalence of strike-slip and oblique-slip focal mechanisms (Fig. 5) reflects a complex regime of strain partitioning along major fault systems. This alignment across multiple independent datasets, GPS, focal mechanisms, and stress indicators, supports the reliability of the derived strain field.
In regions like the Moesian Platform, the relationship between geodetic strain and seismic indicators is more nuanced. This variability in focal mechanisms, especially among smaller-magnitude events (M 3–4), likely reflecting the activation of secondary, oblique faults accommodating local adjustments within the regional stress framework. This complex pattern (Fig. 5) is particularly evident near large-offset faults where differing rheological properties of crustal blocks that make up the MP (Maţenco et al., 2003; Petrescu et al., 2019) and the influence of pre-existing lithospheric heterogeneities (e.g., Bertotti et al., 2003; Tărăpoancă et al., 2004) lead to pronounced strain partitioning. While the smooth GPS field is not intended to resolve every local pocket of shear or compression, the broad agreement between the primary strain axes and the dominant earthquake regimes suggests that the geodetic model reflects the regional-scale deformation patterns characterizing the Romanian crust.
6.3 Interactions between slab dynamics and surface uplift
Our results indicate a clear uplift trend in the foredeep basin area, supporting a typical post-collisional rebound and uplift behavior, as observed in many other orogenic systems. These observations differ from previous temporary GPS models (van der Hoeven et al., 2005) and lower resolution geological datasets (Merten et al., 2005, 2010), which suggested that subsidence dominated the evolution of the region as a typical response to slab subduction and retreat (Tărăpoancă et al., 2004). This represents a notable change from earlier interpretations, which tended to highlight uplift in the Dobrogea forebulge while assuming subsidence further towards the Carpathian Orogen. This is also in line with some historical long-term repeated leveling methods (e.g., Popescu and Dragoescu, 1987; Joó et al., 1987) and is further supported by recent InSAR analyses (Poncoş et al., 2022).
The discrepancy may reflect either a shift in the tectonic regime over time or methodological limitations in capturing ongoing geodynamic processes. The observed uplift may be associated with a partial decoupling between the subducting lower lithosphere and the overlying crust (Petrescu et al., 2021), allowing stress relaxation and isostatic rebound of the upper crust in the foreland. This scenario is consistent with the distribution of intermediate-depth seismicity and the focal mechanism patterns observed in the Vrancea Zone. In addition, Mitrofan et al. (2014) suggested a partial transmission of deformation from the slab to the crust, further supporting the idea of vertical stress transfer from the mantle to the surface.
While the continued uplift in Dobrogea is confirmed, the GPS data suggest that this uplift extends into the foredeep, highlighting the presence of vertical motions in the foredeep basin that are not solely driven by active subduction dynamics. Instead, the observed uplift in both regions may be linked to slab break-off, a late-stage process in the subduction and continental collision cycle (Andrews and Billen, 2009). As mentioned before, the Dobrogea uplifted area at the transition to the Black Sea Basin is parallel to the SE Carpathians, again suggesting the interplay between collisional processes affecting the Orogen and the flexural response of the lower plate, with the forebulge outward migration (from the orogen), accompanied by coeval uplift and erosion.
Seismic imaging suggests that the Vrancea Slab has partially torn and rotated at ∼ 150 km depth (Martin et al., 2006), leaving a deeper slab segment (200–310 km) still weakly attached (Heidbach et al., 2007). If break-off continues to be active (Müller et al., 2010), asthenospheric upwelling through the torn slab segment (Petrescu et al., 2023) may be dynamically supporting present-day uplift in both the SE Carpathians and foredeep. Numerical simulations of subduction-collision systems with spontaneous slab break-off (Duretz et al., 2011) predict post-break-off uplift rates of 0.1–0.8 km Myr−1 (0.1–0.8 mm yr−1), which closely match our observed uplift. Additionally, an increase in slab dip may promote low-wavelength lithospheric folding following continental collision (e.g., Cloetingh et al., 2004; Maţenco et al., 2007), contributing further to the uplift observed in both the SE Carpathians and the foredeep.
Our results also reveal a significant uplift in the East Carpathians (Fig. 4), not just the SE Carpathians, raising the question of whether past slab break-off there (Nemcok et al. 1998) could still be influencing present-day vertical motions. Geodynamic reconstructions suggest that the subducted passive margin of the East European Platform progressively broke off from north to south along the East Carpathians (Sperner et al., 1996), culminating in the currently detaching Vrancea Slab (Sperner et al., 2001; Koulakov et al., 2010; Lorinczi and Houseman, 2010). While the initial isostatic response to slab break-off is expected to occur within a few million years (Duretz et al., 2011) or up to 7 million years after convergence stops (Andrews and Billen, 2009), prolonged effects such as mantle flow, residual buoyancy, and lower-crustal flow could be sustaining regional uplift. This interpretation is further supported by Bouguer gravity anomalies (Fig. 8), which show relatively positive values (0–40 mGal) over the mountain belt, suggesting the presence of denser material at depth or incomplete isostatic compensation. The north-to-south younging of post-collisional volcanism (Seghedi et al., 2004) suggests that slab detachment propagated southward over time, with the East Carpathians experiencing earlier break-off than the SE Carpathians. If asthenospheric upwelling and lithospheric weakening occurred during that time, they could have led to prolonged crustal adjustments that continue to manifest as uplift today.
In addition to the SE and East Carpathians, we also identify localized uplift in the South Carpathians. This region marks the collision between the Dacia Block and the Moesian Platform, where oblique thrusting over the thick Moesian lithosphere (Maţenco et al., 1997) may be inducing flexural or isostatic responses (Bertotti et al., 2003). Bouguer gravity anomalies in this area transition from strongly negative values (∼ −100 mGal) near the foredeep in the south to over +100 mGal at the contact with the Transylvanian Basin (Fig. 8), indicating a shift from thick, low-density crust to denser material in the north. This pattern suggests differential isostatic compensation, where northward crustal thinning leads to less mass deficit and reduced buoyancy, potentially causing flexural uplift. This contrast could drive vertical displacements, as observed. Alternatively, deeper mantle processes, such as residual slab dynamics or lithospheric-scale deformation associated with orogenic curvature, may also influence the observed uplift.
This study integrates the most stable and longest GPS data records from Romania over a period of 20 years. Our results provide a substantial improvement in spatial coverage and resolution of vertical and horizontal crustal motions in a tectonically complex region sitting at the transition between dynamically active subduction systems and the stable East European Platform, with additional influences exerted by a descending slab.
We observe pronounced horizontal southward motion in the Moesian Platform, minimal motion in the Transylvanian Basin and East Carpathians, and a slight north-west motion of the Eastern European Platform, in a Eurasian reference frame. The relative motions between these regions generate a dominantly extensional strain field with localized zones of compression and shear, broadly consistent with stress regimes inverted from earthquake clusters, although individual events capture more localized deformation heterogeneity.
Earlier studies in the region relied on campaign-style GPS observations. In contrast, our dataset includes cGPS data from 130 stations spanning more than 20 years, providing improved spatial density and temporal resolution. Our extended and more reliable data also reveal uplift in the foredeep of the SE Carpathians, challenging a previously held view that this area is solely subsiding based on temporary GPS station data. This insight provides a new perspective on the region's slab dynamics, which may be influenced by slab break-off and the fragmented nature of the foreland, with its blocks of varying rheological strength. These differential vertical motions are accommodated by seismically active faults on a crustal scale.
Overall, this study significantly advances our understanding of the tectonic processes that shape regions at the intersection of active subduction/collision zones and stable continental platforms. It provides key constraints on the interplay between slab dynamics, surface plate kinematics, and the resulting crustal deformation, an essential step toward improving seismic hazard assessment.
The GipsyX software is licensed to the Department of Geophysics of the University of Bucharest (UNIBUC). We were allowed to use this software in an ongoing collaboration with UNIBUC. The strain rate estimation code STRAINTOOL (Anastasiou et al., 2021) is available at https://doi.org/10.5281/zenodo.5501234 Most figures were made using the open-source GMT software (Wessel et al., 2013).
The RINEX-format GNSS data (sampled at 30 s intervals) analyzed in this study are only available from the NIEP (National Institute of Earth Physics) network online at http://gnss.infp.ro/#/site (last access: 10 January 2025). The rest of the data can be made available from the organisations responsible with their maintenance upon reasonable request and data sharing agreements. All individual velocity solutions and strain rate estimates from this study are provided in the Supplement.
The supplement related to this article is available online at https://doi.org/10.5194/se-17-747-2026-supplement.
AM: Conceptualization, Methodology, Data Curation, Formal analysis, Investigation, Writing – Original Draft, Visualization LP: Formal analysis, Writing – Original Draft, Visualization BA: Software, Data Curation, Formal analysis, Visualization, Writing – Review and Editing, Supervision FB: Writing – Review and Editing EN: Writing – Review and Editing, Managed the NIEP GNSS network technically IM: Writing – Review and Editing
The contact author has declared that none of the authors has any competing interests.
Publisher's note: Copernicus Publications remains neutral with regard to jurisdictional claims made in the text, published maps, institutional affiliations, or any other geographical representation in this paper. The authors bear the ultimate responsibility for providing appropriate place names. Views expressed in the text are those of the authors and do not necessarily reflect the views of the publisher.
We acknowledge the Netherlands Research Centre for Integrated Solid Earth Science (ISES) for the initial establishment in 2001 of seven cGPS stations in Romania dedicated to long-term geodetic and geophysical research in the region. This early enterprise comprised a collaborative effort of the University of Bucharest (V. Mocanu), the National Institute for Earth Physics (L. Munteanu), the Delft University of Technology (B. A. C. Ambrosius), and the Utrecht University (W. Spakman). We thank the National Center for Monitoring and Alarm to Natural Marine Hazards – Euxinus (GeoPontica), as well as the National Agency for Cadaster and Land Registration and the TopGeocart company, for providing access to their data. Supported by the Ministerul Cercetării și Inovării through the CRESCENTO Project (no.346/390022/08.09.2021) and the GEOMONITOR Project (contract no. 28Sol(T28)/2025). The authors thank Dr. Stefan Leinen, an anonymous reviewer, and the editors for their constructive comments on the original manuscript.
This research has been supported by the Ministerul Cercetării și Inovării (grant no. PN23360101) and the NextGenerationEU (grant no. 760008/30.12.2022).
This paper was edited by Elias Lewi and reviewed by two anonymous referees.
Altamimi, Z., Meìtivier, L., Rebischung, P., Rouby, H., and Collilieux, X.: ITRF2014 plate motion model, Geophys. J. Int., 209, 1906–1912, https://doi.org/10.1093/gji/ggx136, 2017.
Amaru, M. L.: Global travel time tomography with 3-D reference models, PhD thesis, Utrecht Univ., Utrecht, The Netherlands, http://hdl.handle.net/1874/19338 (last access: 10 October 2024), 2007.
Anastasiou, D. G., Papanikolaou, X., Ganas, A., and Paradissis, D.: StrainTool: A software package to estimate strain tensor parameters, Zenodo [code], https://doi.org/10.5281/zenodo.5501234, 2021.
Andrews, E. R. and Billen, M. I.: Rheologic controls on the dynamics of slab detachment, Tectonophysics, 464, 60–69, https://doi.org/10.1016/j.tecto.2007.09.004, 2009.
Bada, G., Horváth, F., Dövényi, P., Szafián, P., Windhoffer, G., and Cloetingh, S.: Present-day stress field and tectonic inversion in the Pannonian basin, Global Planet. Change, 58, 165–180, https://doi.org/10.1016/j.gloplacha.2007.01.007, 2007.
Balla, Z.: Palaeotectonic reconstruction of the central Alpine-Mediterranean belt for the Neogene, Tectonophysics, 127, 213–243, https://doi.org/10.1016/0040-1951(86)90062-4, 1986.
Bertiger, W., Bar-Sever, Y., Dorsey, A., Haines, B., Harvey, N., Hemberger, D., Heflin, M., Lu, W., Miller, M., Moore, A. W., Murphy, D., Ries, P., Romans, L., Sibois, A., Sibthorpe, A., Szilagyi, B., Vallisneri, M., and Willis, P.: GipsyX/RTGx, a new tool set for space geodetic operations and research, Adv. Space Res., 66, 469–489, https://doi.org/10.1016/j.asr.2020.04.015, 2020.
Bertotti, G., Maţenco, L., and Cloetingh, S. A. P. L.: Vertical movements in and around the south-east Carpathian foredeep: lithospheric memory and stress field control, Terra Nova, 15, 299–305, https://doi.org/10.1046/j.1365-3121.2003.00499.x, 2003.
Beşuţiu, L., Manea, V., Pomeran, M.: Vrancea seismic zone as an unstable triple junction: new evidence from observations and numerical modelling, in: Proceedings of the 9th Congress of the Balkan Geophysical Society, European Association of Geoscientists & Engineers, 2017, 1–5, https://doi.org/10.3997/2214-4609.201702541, 2017.
Blewitt, G., Lavallée, D., Clarke, P., and Nurutdinov, K.: A new global mode of Earth deformation: Seasonal cycle detected, Science, 294, 2342–2345, https://doi/10.1126/science 106532001, 2001.
Bonvalot, S., Balmino, G., Briais, A., Kuhn, M., Peyrefitte, A., Vales, N., Biancale, R., Gabalda, G., Moreaux, G., Reinquin, F., and Sarrailh, M.: World Gravity Map, 1:50000000 map, BGI-CGMW-CNES-IRD (Eds.), Paris, https://doi.org/10.14682/2012GRAVISOST, 2012.
Borleanu, F., Petrescu, L., Fojtikova, L., Munteanu, I., Silvennoinen, H., Placinta, A. O., Oros, E., and Enescu, B.: ML 5.7 Southern Carpathians earthquake sequence: Insights from seismic observations, ESC2024-S17/50-808, https://www.erasmus.gr/UsersFiles/microsite1277/Documents/ESC2024_Abstract_Book.pdf (last access: 17 March 2025), 2024.
Bos, M. S. and Scherneck, H. G.: Ocean tide loading provider, http://holt.oso.chalmers.se/loading/index.html (last access: 13 September 2024), 2011.
Cloetingh, S., Bada, G., Maţenco, L., Lankreijer, A., Horváth, F., and Dinu, C.: Modes of basin (de) formation, lithospheric strength and vertical motions in the Pannonian-Carpathian system: inferences from thermo-mechanical modelling, Geo. Soc. Mem., 32, 207–221, https://doi.org/10.1144/GSL.MEM.2006.032.01.12, 2006.
Cloetingh, S. A. P. L., Burov, E., Maţenco, L., Toussaint, G., Bertotti, G., Andriessen, P. A. M., Wortel, M. J. R., and Spakman, W.: Thermo-mechanical controls on the mode of continental collision in the SE Carpathians (Romania), Earth Planet. Sc. Lett., 218, 57–76, https://doi.org/10.1016/S0012-821X(03)00645-9, 2004.
Cornea, I. and Popescu, M. N.: The Vrancea Earthquake of March 4, 1977, and the Recent crustal vertical movements in Romania, in: Cornea & Radu (Eds.): Seismological Research of March 4, 1977 Earthquake, Preprint Central Inst. of Phys., 559–568, 1979a (in Romanian).
Cornea, I., Dragoescu, I., Popescu, M. N., and Visarion, M.: Monography of recent vertical crustal movements in the S. R. of Romania, Preprint Central Inst. of Phys., 100, 1978 (in Romanian).
Cornea, I., Dragoescu, I., Popescu, M. N., and Visarion, M.: Map of recent vertical crustal movements of the territory of S. R. of Romania, St. Cerc. Geol., Geofiz., Geogr., Geofizica, 17, 3–20, 1979b (in Romanian).
Craiu, A., Craiu, M., Diaconescu, M., and Marmureanu, A.: 2013 Seismic swarm recorded in Galati area, Romania: focal mechanism solutions, Acta Geod. Geophys., 52, 53–67, https://doi.org/10.1007/s40328-016-0161-9, 2017.
Csontos, L. and Vörös, A.: Mesozoic plate tectonic reconstruction of the Carpathian region, Palaeogeogr. Palaeocl., 210, 1–56, https://doi.org/10.1016/j.palaeo.2004.02.033, 2004.
Dinter, G. and Schmitt, G.: Three Dimensional Plate Kinematics in Romania, Nat. Hazards, 23, 389–406, https://doi.org/10.1023/A:1011116615142, 2001.
Duretz, T., Gerya, T. V., and May, D. A.: Numerical modelling of spontaneous slab breakoff and subsequent topographic response, Tectonophysics, 502, 244–256, https://doi.org/10.1016/j.tecto.2010.05.024, 2011.
Enescu, B., Ghiţă, C., Moldovan, I. A., and Radulian, M.: Revisiting Vrancea (Romania) intermediate-depth seismicity: some statistical characteristics and seismic quiescence testing, Geosciences, 13, 219, https://doi.org/10.3390/geosciences13070219, 2023.
Heidbach, O., Ledermann, P., Kurfeß, D., Peters, G., Buchmann, T., Maţenco, L., Negut, M., Sperner, B., Müller, B., and Nuckelt, A.: Attached or not attached: slab dynamics beneath Vrancea, Romania, in: International symposium on strong Vrancea earthquakes and risk mitigation, 4–20, https://digbib.bibliothek.kit.edu/volltexte/beilagen/1/index.html (last access: 15 May 2026), 2007.
Heidbach, O., Rajabi, M., Cui, X., Fuchs, K., Müller, B., Reinecker, J., Reiter, K., Tingay, M., Wenzel, F., Xie, F., and Ziegler, M. O.: The World Stress Map database release 2016: Crustal stress pattern across scales, Tectonophysics, 744, 484–498, https://doi.org/10.1016/j.tecto.2018.07.007, 2018.
Hippolyte, J. C.: Geodynamics of Dobrogea (Romania): new constraints on the evolution of the Tornquist–Teisseyre Line, the Black Sea and the Carpathians, Tectonophysics, 357, 33–53, https://doi/10.1016/S0040-1951(02)00361-X, 2002.
Ismail-Zadeh, A., Maţenco, L., Radulian, M., Cloetingh, S., and Panza, G.: Geodynamics and intermediate-depth seismicity in Vrancea (the south-eastern Carpathians): current state-of-the art, Tectonophysics, 530, 50–79, https://doi.org/10.1016/j.tecto.2012.01.016, 2012.
Joó, I., Arabadžijski, D., Füry, M., Meščerskij, I. N., Mihaila, M., Mladenovski, M. M., Németh, Z., Steinberg, J., Thury, J., Vanko, J., and Wyrzykowski, T.: New investigations or recent vertical movements in the Carpatho-Balkan region, J. Geodyn., 8, 99–113, https://doi.org/10.1016/0264-3707(87)90028-7, 1987.
Koulakov, I., Zaharia, B., Enescu, B., Radulian, M., Popa, M., Parolai, S., and Zschau, J.: Delamination or slab detachment beneath Vrancea? New arguments from local earthquake tomography, Geochem. Geophy. Geosy., 11, Q03002, https://doi.org/10.1029/2009GC002811, 2010.
Krézsek, C., Lăpădat, A., Maţenco, L., Arnberger, K., Barbu, V., and Olaru, R.: Strain partitioning at orogenic contacts during rotation, strike–slip and oblique convergence: Paleogene-Early Miocene evolution of the contact between the South Carpathians and Moesia, Global Planet. Change, 103, 63–81, https://https://doi.org/10.1016/j.gloplacha.2012.11.009, 2013.
Lorinczi, P. and Houseman, G.: Lithospheric gravitational instability beneath the Southeast Carpathians, Tectonophysics, 474, 322–336, https://doi.org/10.1016/j.tecto.2008.05.024, 2009.
Maţenco, L. and Bertotti, G.: Tertiary tectonic evolution of the external East Carpathians (Romania), Tectonophysics, 316, 255–286, https://doi.org/10.1016/S0040-1951(99)00261-9, 2000.
Maţenco, L. and Radivojević, D.: On the formation and evolution of the Pannonian Basin: Constraints derived from the structure of the junction area between the Carpathians and Dinarides, Tectonics, 31, TC6007, https://doi.org/10.1029/2012TC003206, 2012.
Maţenco, L., Zoetemeijer, R., Cloetingh, S., and Dinu, C.: Lateral variations in mechanical properties of the Romanian external Carpathians: inferences of flexure and gravity modelling, Tectonophysics, 282,147–166, https://doi.org/10.1016/S0040-1951(97)00217-5, 1997.
Maţenco, L., Bertotti, G., Cloetingh, S., and Dinu, C.: Subsidence analysis and tectonic evolution of the external Carpathian-Moesian platform region during Neogene times, Sediment. Geol., 156, 71–94, https://doi.org/10.1016/S0037-0738(02)00283-X, 2003.
Maţenco, L., Bertotti, G., Leever, K., Cloetingh, S. A. P. L., Schmid, S. M., Tărăpoancă, M., and Dinu, C.: Large-scale deformation in a locked collisional boundary: Interplay between subsidence and uplift, intraplate stress, and inherited lithospheric structure in the late stage of the SE Carpathians evolution, Tectonics, 26, TC4011, https://doi.org/10.1029/2006TC001951, 2007.
Merten, S., Andriessen, P. A. M., Juez-Larré, J., Bertotti, G. V., and Dunai, T. J.: Dating the exhumation of the Romanian Carpathians: first results from apatite (U-Th)/He thermochronology, Abstract from Geophysical Research Abstracts, 7, 08138, https://meetings.copernicus.org/www.cosis.net/abstracts/EGU05/08138/EGU05-J-08138.pdf (last access: 27 October 2025), 2005.
Merten, S., Maţenco, L., Foeken, J. P. T., Stuart, F. M., and Andriessen P. A. M.: From nappe stacking to out-of-sequence postcollisional deformations: Cretaceous to Quaternary exhumation history of the SE Carpathians assessed by low-temperature thermochronology, Tectonics, 29, TC3013, https://doi.org/10.1029/2009TC002550, 2010.
Müller, B., Heidbach, O., Negut, M., Sperner, B., and Buchmann, T.: Attached or not attached – evidence from crustal stress observations for a weak coupling of the Vrancea slab in Romania, Tectonophysics, 482, 139–149, https://doi.org/10.1016/j.tecto.2009.08.022, 2010.
Muntean, A., Mocanu, V., Ambrosius, B.: A GPS study of land subsidence in the Petrosani (Romania) coal mining area, Nat. Hazards, 80, 797–810, https://doi.org/10.1007/s11069-015-1997-y, 2016.
Necea, D., Fielitz, W., and Maţenco, L.: Late Pliocene–Quaternary tectonics in the frontal part of the SE Carpathians: Insights from tectonic geomorphology, Tectonophysics, 410, 137–156, https://doi.org/10.1016/j.tecto.2005.05.047, 2005.
Necea, D., Fielitz, W., Kadereit, A., Andriessen, P. A. M., and Dinu, C.: Middle Pleistocene to Holocene fluvial terrace development and uplift-driven valley incision in the SE Carpathians, Romania, Tectonophysics, 602, 332–354, https://doi.org/10.1016/j.tecto.2013.02.039, 2013.
Necea, D., Juez-Larré, J., Maţenco, L., Andriessen, P. A. M., and Dinu, C.: Foreland migration of orogenic exhumation during nappe stacking: Inferences from a high-resolution thermochronological profile over the Southeast Carpathians, Global Planet. Change, 200, 103457, https://doi.org/10.1016/j.gloplacha.2021.103457, 2021.
Nemcok, M., Pospisil, L., Lexa, J., and Donelick, R. A.: Tertiary subduction and slab break-off model of the Carpathian–Pannonian region, Tectonophysics, 295, 307–340, https://doi.org/10.1016/S0040-1951(98)00092-4, 1998.
Petrescu, L. and Enescu, B.: Seismicity of a relic slab: space–time cluster analysis in the Vrancea Seismic Zone, Earth Planets Space, 77, 6, https://doi.org/10.1186/s40623-025-02136-6, 2025.
Petrescu, L., Stuart, G., Tătaru, D., and Grecu, B.: Crustal structure of the Carpathian Orogen in Romania from receiver functions and ambient noise tomography: how craton collision, subduction and detachment affect the crust, Geophys. J. Int., 218, 163–178, https://doi.org/10.1093/gji/ggz140, 2019.
Petrescu, L., Borleanu, F., Radulian, M., Ismail-Zadeh, A., and Maţenco, L.: Tectonic regimes and stress patterns in the Vrancea Seismic Zone: Insights into intermediate-depth earthquake nests in locked collisional settings, Tectonophysics, 799, 228688, https://doi.org/10.1016/j.tecto.2020.228688, 2021.
Petrescu, L., Mihai, A., and Borleanu, F.: Slab tear and rotation imaged with core-refracted shear wave anisotropy, J. Geodyn., 157, 101985, https://doi.org/10.1016/j.jog.2023.101985, 2023.
Piña-Valdés, J., Socquet, A., Beauval, C., Doin, M.-P., D'Agostino, N., and Shen, Z.-K.: 3D GNSS velocity field sheds light on the deformation mechanisms in Europe: Effects of the vertical crustal motion on the distribution of seismicity, J. Geophys. Res.-Sol. Ea., 127, e2021JB023451, https://doi. org/10.1029/2021JB023451, 2022.
Poncoş, V., Stanciu, I., Teleagă, D., Maţenco, L., Bozsó, I., Szakács, A., Birtas, D., Toma, S.A., Stănica, A., and Rădulescu, V.: An Integrated Platform for Ground-Motion Mapping, Local to Regional Scale; Examples from SE Europe, Remote Sensing, 14, 1046, https://doi.org/10.3390/rs14041046, 2022.
Popa, M., Chircea, A., Dinescu, R., Neagoe, C., Grecu, B., and Borleanu, F.: Romanian earthquake catalogue (ROMPLUS), V2, Mendeley Data [data set], https://doi.org/10.17632/tdfb4fgghy.2, 2022.
Popescu, M. N. and Dragoescu, I.: Maps of recent vertical crustal movements in Romania: Similarities and differences, J. Geodyn., 8, 123–136, https://doi.org/10.1016/0264-3707(87)90030-5, 1987.
Radulian, M., Bălă, A., Ardeleanu, L., Toma-Dănilă, D., Petrescu, L., and Popescu, E.: Revised catalogue of earthquake mechanisms for the events occurred in Romania until the end of twentieth century: REFMC, Acta Geod. Geophys., 54, 3–18, https://doi.org/10.1007/s40328-018-0243-y, 2019.
Radulian, M., Popa, M., Dinescu, R., and Bălă, A.: Location improvements for the twin crustal earthquakes recorded in February 2023 in Gorj County, Romania, International Multidisciplinary Scientific GeoConference: SGEM, 23, 57–64, https://doi.org/10.5593/sgem2023/1.1/s01.08, 2023.
Ren, Y., Stuart, G., Houseman, G., Dando, B., Ionescu, C., Hegedüs, E., Radovanović, S., and Shen, Y.: Upper mantle structures beneath the Carpathian–Pannonian region: Implications for the geodynamics of continental collision, Earth Planet. Sc. Lett., 349, 139–152. https://doi.org/10.1016/j. epsl.2012.06.037, 2012.
re3data.org: VMF Data Server; editing status 2024–05–15; re3data.org – Registry of Research Data Repositories, https://doi.org/10.17616/R3RD2H, 2024.
Sanders, C., Andriessen, P., and Cloetingh, S.: Life cycle of the East Carpathian orogen: erosion history of a doubly vergent critical wedge assessed by fission track thermochronology, J. Geophys. Res., 104, 29095–29112, https://doi.org/10.1029/1998JB900046, 1999.
Săndulescu, M.: Geotectonica Romaniei, Editura Tehnică, București, Romania, 336 pp., https://www.scribd.com/document/661087018/Sandulescu-1984-Geotectonica-Romaniei (last access: 3 February 2025), 1984 (in Romanian).
Schmid, S. M., Fügenschuh, B., Kounov, A., Maţenco, L., Nievergelt, P., Oberhänsli, R., Pleuger, J., Schefer, S., Schuster, R., Tomljenović, B., and Ustaszewski, K.: Tectonic units of the Alpine collision zone between Eastern Alps and western Turkey, Gondwana Res., 78, 308–374, https://doi.org/10.1016/j.gr.2019.07.005, 2020.
Seghedi, A., Lang, B., and Heimann, A.: The deformational history of North Dobrogean Hercynian basement as reflected in new 39Ar/40Ar determinations, Romanian Journal of Tectonics and Regional Geology, 77, 64–65, https://doi.org/10.3906/YER-1101-20, 1999.
Seghedi, I., Downes, H., Vaselli, O., Szakács, A., Balogh, K., and Pécskay, Z.: Post-collisional Tertiary–Quaternary mafic alkalic magmatism in the Carpathian–Pannonian region: a review, Tectonophysics, 393, 43–62, https://doi/10.1016/j.tecto.2004.07.051, 2004.
Serpelloni, E., Cavaliere, A., Martelli, L., Pintori, F., Anderlini, L., Borghi, A., Randazzo, D., Bruni, S., Devoti, R., Perfetti, P., and Cacciaguerra, S.: Surface Velocities and Strain-Rates in the Euro-Mediterranean Region From Massive GPS Data Processing, Front. Earth Sci., 10, 907897, https://doi.org/10.3389/feart.2022.907897, 2022.
Shen, Z. K., Wang, M., Zeng, Y., and Wang, F.: Strain determination using spatially discrete geodetic data, Bull. Seismol. Soc. Am., 105, 2117–2127, https://doi.org/10.1785/0120140247, 2015.
Sperner, B.: Computer programs for the kinematic analysis of brittle deformation structures and the Tertiary tectonic evolution of the Western Carpathians, Tübingen Geoscientific Works (TGA) Series A, Geology, Paleontology, Stratigraphy, 27, (NEBIS)001536648EBI01, 1996.
Sperner, B., Lorenz, F., Bonjer, K., Hettel, S., Müller, B., and Wenzel, F: Slab break-off–abrupt cut or gradual detachment? New insights from the Vrancea Region (SE Carpathians, Romania), Terra Nova, 13, 172–179, https://doi.org/10.1046/j.1365-3121.2001.00335.x, 2001.
Tărăpoancă, M., Garcia-Castellanos, D., Bertotti, G., Maţenco, L., Cloetingh, S., and Dinu, C.: Role of the 3-D distributions of load and lithospheric strength in orogenic arcs: polystage subsidence in the Carpathians foredeep, Earth Planet. Sc. Lett., 221, 163–180, https://doi.org/10.1016/S0012-821X(04)00068-8, 2004.
Van der Hoeven, A., Mocanu, V., Spakman, W., Nutto, M., Nuckelt, A., Maţenco, L., Munteanu, L., Marcu, C., and Ambrosius, B.: Observation of present-day tectonic motions in the Southeastern Carpathians: Results of the ISES/CRC-461 GPS measurements, Earth Planet. Sc. Lett., 239, 177–184, https://doi.org/10.1016/j.epsl.2005.09.018, 2005.
Wenzel, F., Lorenz, F., Sperner, B., and Oncescu, M. C.: Seismotectonics of the Romanian Vrancea area, Vrancea Earthquakes: Tectonics, Hazard and Risk Mitigation, 15–26, Kluwer Acad., https://doi.org/10.1007/978-94-011-4748-4_2, 1999.
Wessel, P., Smith, W. H., Scharroo. R., Luis, J., and Wobbe, F.: Generic Mapping Tools: Improved Version Released, Eos, Trans. AGU, 94, 409–410, https://doi.org/10.1002/2013EO450001, 2013.
Wortel, M. J. R. and Spakman, W.: Subduction and slab detachment in the Mediterranean-Carpathian region, Science, 290, 1910–1917, https://doi.org/10.1126/science 290.5498.1910, 2000.