
the Creative Commons Attribution 4.0 License.
the Creative Commons Attribution 4.0 License.
 | 05 Aug 2026
Gas migration and slope instability in the Danube Fan: insights from integrated OBS-MCS seismic analysis
Anke Dannowski
Jörg Bialas
Felix Gross
Jasper Hoffmann
Dirk Klaeschen
Christian Berndt
Gas hydrates and deltaic deep-sea fans are main features in continental margin systems, influencing slope stability, fluid migration, and carbon cycling. In the northwestern Black Sea, the Danube Fan remains poorly constrained with respect to subsurface structure, sediment strength, and hydrate dynamics. Here, we present high-resolution multichannel seismic (MCS) and ocean-bottom seismometer (OBS) data to characterise sedimentary structure and fluid-related features. Two integrated OBS–MCS profiles reveal under-consolidated, clay-rich levee deposits interspersed with mass-transport units, chaotic facies, and gas-related anomalies. Derived P- and S-wave velocity models indicate low shear strength and high -ratios in shallow units, consistent with soft, water-saturated sediments. Deeper layers display compaction-driven velocity increases but remain mechanically weak, rendering the slope prone to failure. Our findings suggest that vertical gas migration is widespread, expressed by seismic chimneys, polarity reversals, and velocity pull-downs, with free gas confined below bottom simulating reflectors and in stratigraphic traps. Hydrates likely occur as sparse, patchy pore-filling accumulations, and the lack of S-wave velocity anomalies suggests they do not act as cementing phases, implying little direct influence on sediment strength or slope stability. The hydrate system appears hydrate-poor, possibly reflecting post-glacial re-equilibration. Overall, lithology, gas migration pathways, and high sedimentation rates emerge as primary controls on hydrate formation and slope instability in the Danube Fan.
- Article
(13296 KB) - Full-text XML
-
Supplement
(1801 KB) - BibTeX
- EndNote


-
Under-consolidated, clay-rich sediments in the Danube Fan generate mechanically weak layers that are prone to slope failure, especially when disturbed by gas pressure build-up or external forces.
-
Gas hydrates are present but with low concentrations and patchy distribution; free gas accumulates beneath hydrate zones in sandy layers, sealed by impermeable clays.
-
The Danube Fan represents a hydrate-poor system, dominated by microbial gas, offering insights into gas hydrate dynamics in fine-grained, deltaic deep-sea environments.
Submarine slope stability and gas hydrate systems are critical components of marine geohazards and carbon cycling along continental margins. In regions such as the Danube Fan, located on the northwestern Black Sea margin, rapid sedimentation, overpressure development, and complex fluid migration contribute to slope instabilities and localised gas accumulations (Popescu et al., 2006, 2004). Understanding these processes is essential not only for assessing landslide risks but also for improving our knowledge of subsurface gas dynamics, which has important implications for marine resource management, carbon storage, and climate change feedbacks.
Gas hydrates, ice-like crystalline compounds of water and gas, typically methane, are stable under high-pressure and low-temperature conditions in marine sediments (Sloan and Koh, 2008). Their stability is sensitive to environmental changes, such as warming bottom waters or sea-level fluctuations, which may trigger dissociation and migration of free gas in the sediment and into the water column (Ruppel and Kessler, 2017). These dynamics are particularly relevant in continental margin settings like the Danube Fan, where gas migration pathways, overpressured sediments, and stratigraphic traps generate favourable conditions for both gas hydrate formation and slope failure (Riedel et al., 2021; Bialas et al., 2020a; Hillman et al., 2018; Zander et al., 2018).
Combined P- and S-wave analysis, provides a valuable tool for characterising sediment properties and further allow the estimation of -ratios that allow the identification of lithological changes, detect free gas and gas hydrates in the subsurface. Together with high-resolution multichannel seismic (MCS) imaging and ground-truth data, fluid dynamics can be studied intensively.
This study presents two high-resolution seismic profiles across a slump scar in the Danube Fan to investigate the subsurface architecture, sediment consolidation state, and gas hydrate occurrence. By integrating velocity modelling with stratigraphic interpretation and drilling data (MeBo200), we aim to constrain the mechanical and fluid-related processes governing slope failure.
Beyond addressing geohazards, this study has the potential to significantly advance our understanding of fluid migration and gas accumulation in under-consolidated marine sediments. Our insights are crucial for optimising site selection and enhancing monitoring strategies in subsurface projects involving fluid-injection, leakage control, and long-term storage, particularly in high-stakes applications, such as carbon capture and storage (CCS). The observed gas trapping and migration mechanisms are to a certain degree analogous to those required for long-term CO2 storage in marine settings (e.g., Yip et al., 2013).
The Danube Fan is a fine-grained turbidite system on a particularly wide shelf (∼120 km) of the northwestern Black Sea. It developed over the past ∼900 ka through a succession of stacked channel-levee systems interbedded with mass-transport deposits (MTDs) (Wong et al., 1997; Winguth et al., 2000; Popescu et al., 2001). The fan system extends from the shelf edge at ∼100 m water depth to the abyssal plain, where water depths exceed 2200 m (Wong et al., 1997).
Erosional processes dominate the upper slope, primarily within the channel-levee systems, while depositional and aggradational processes prevail along the middle and lower slopes (Popescu et al., 2001). Bathymetric data reveal the presence of several submarine canyons and associated channels, with a predominant NW-SE orientation (Fig. 1).
For consistency with previous studies, we adopt the canyon nomenclature established by Wong et al. (1997) and Winguth (1998), where the prefix “S” refers to the southern Danube Fan complex. Canyon numbers ascend from the oldest to the youngest, corresponding to successive activity phases and sedimentary sequences. These canyons represent the most recent depositional phase of the Danube Fan, which developed between ∼75 to 22 ka ago, during the sea-level lowstand associated with the Last Glacial Maximum (LGM; Late Pleistocene Neoeuxinian Stage) (Winguth et al., 2000; Lericolais et al., 2013). During this period, sea-level was ∼100–150 m lower than present, resulting in an isolation of the Black Sea from the global oceans (Ryan et al., 1997; Lericolais et al., 2009).
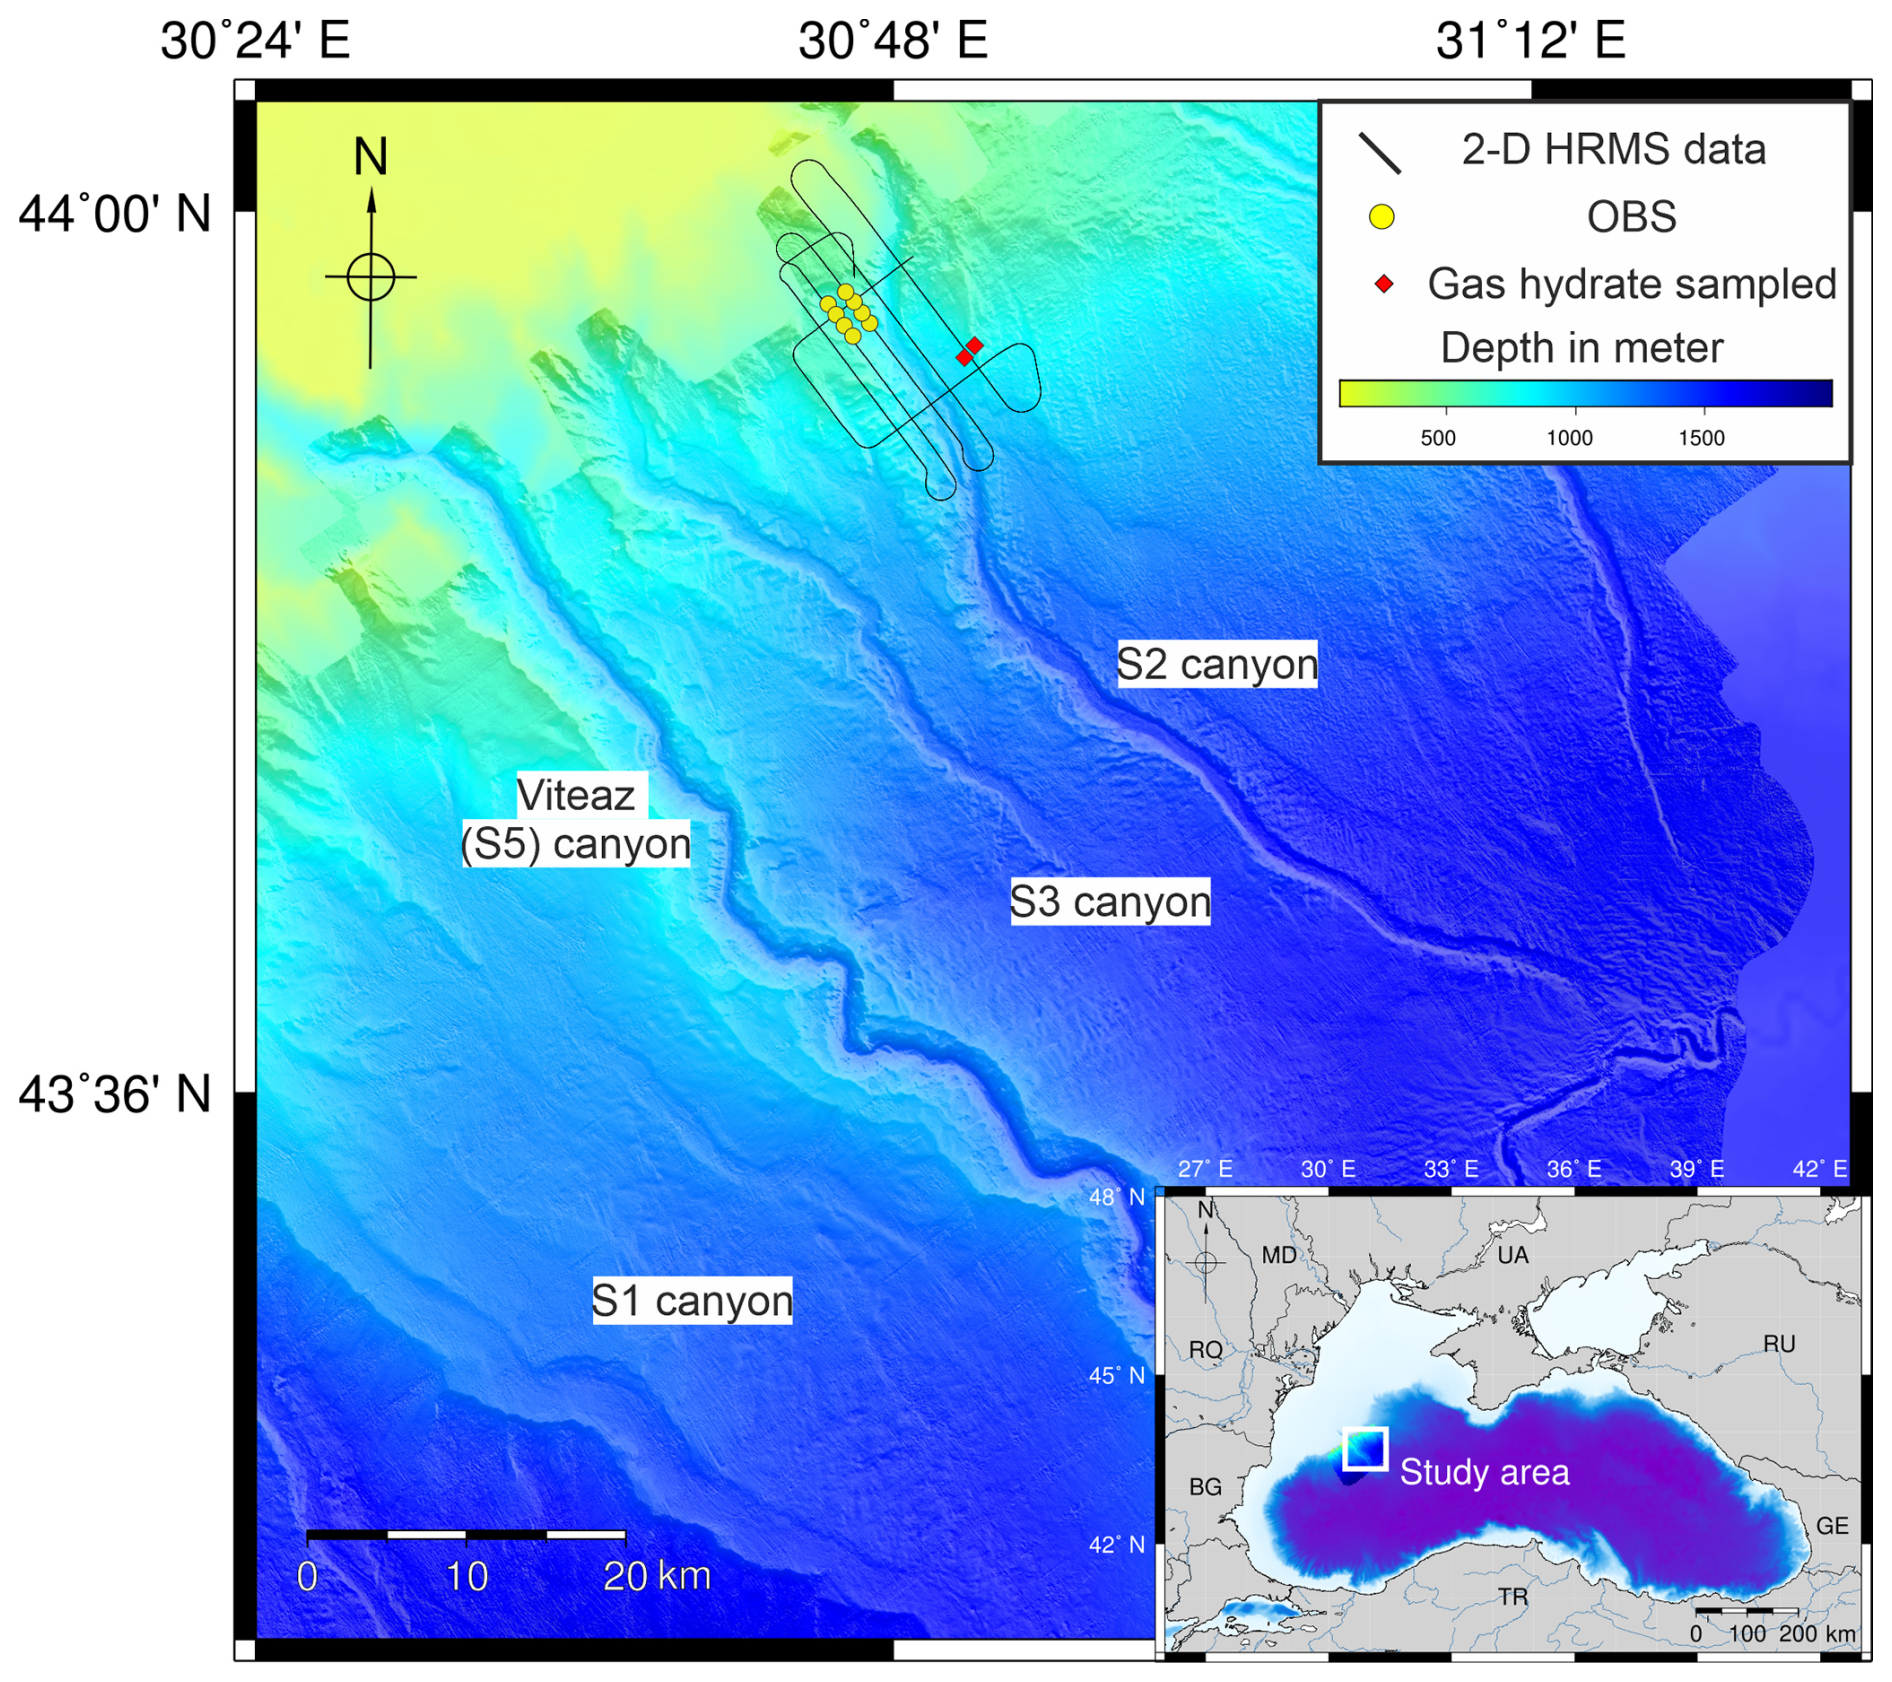
Figure 1Bathymetric overview of the Danube deep-sea fan complex, acquired during MSM-34 (Wintersteller and Bialas, 2016), showing the location of the seismic datasets collected on the western flank of the S2 canyon. Red diamonds indicate sites where gas hydrates were sampled during GHASS (Gas Hydrates, fluid Activities and Sediment deformations in the western Black Sea) cruise (Ker and Riboulot, 2015). Inset: Location of the study area in the north-western Black Sea (ETOPO-1; Amante and Eakins, 2009). Country abbreviations: BG: Bulgaria, RO: Romania, MD: Moldavia, UA: Ukraine, RU: Russia, GE: Georgia, TR: Turkey.
Several studies suggest, that only one canyon was active during each sea level low-stand, with the Viteaz canyon (S5) representing the recently active system (Wong et al., 1997; Winguth et al., 2000; Popescu et al., 2001, 2004). During active phases, the canyons were directly connected to the Danube River and transported large volumes of sediment via channelised turbidity currents towards the deep sea (Popescu et al., 2001). Compared to the more distinctive S5 canyon, S2 exhibits lower sinuosity (Fig. 1). The surrounding seafloor contains extensive MTDs, levee deposits, and fine-grained overbank sediments, including channel overflows (Wong et al., 1997; Badhani, 2016). The isolation of the Black Sea during the LGM and the associated fan sedimentation ceased with postglacial sea-level rise and global reconnection at the end of the Quaternary glaciation, approximately 7500 years ago (Lericolais et al., 2009). Hydrological conditions in the Black Sea have fluctuated in response to glacio-eustatic sea-level changes, alternating between low salinity, oxygenated lacustrine environments and strongly stratified, anoxic marine conditions in deeper waters (Deuser, 1974; Özsoy and Ünlüata, 1997). The onset of deep-water anoxia is closely linked to the formation of sapropels, which result from enhanced biogenic productivity during transitions from limnic to marine settings (Popescu et al., 2007). Today the Black Sea is the world's largest anoxic basin, providing favourable conditions for hydrocarbon formation (Vassilev and Dimitrov, 2002; Jørgensen et al., 2004).
The estimated upper limit of the gas hydrate stability zone (GHSZ), assuming an average bottom-water temperature of 9 °C (Ross and Degens, 1974), lies at ∼720 m water depth (Zander et al., 2017; Riedel et al., 2020), though this depth also depends on the pore water salinity. Pore water salinity in the Black Sea ranges from 22.3 practical salinity units (psu) under marine conditions (Özsoy and Ünlüata, 1997) to as low as 3 psu in limnic conditions (Svitoch et al., 2000).
Within the study area, gas emissions (gas flares) are observed at water depths shallower than 655 m, the upper limit of the GHSZ (Hillman et al., 2018). Gas samples from the Danube Fan show a primarily biogenic origin, with concentrations up to 99 % methane, indicating in-situ formation (Vassilev and Dimitrov, 2002).
As a part of the multidisciplinary research project SUGAR (SUbmarine GAs Hydrate Reservoirs) and MIDAS (Managing Impacts of Deep-SeA ReSource Exploitation), the German research cruise MSM-34 acquired 2-D multichannel seismic (MCS) and 4-component ocean-bottom-seismometer (OBS) data (Dannowski and Bialas, 2025), along with multibeam bathymetry (Bialas et al., 2014). Bathymetric data were collected continuously throughout the cruise using a hull-mounted EM 122 echosounder operating at 12 kHz. The data were processed onboard using generic multibeam processing software (Caress et al., 2008), with sound velocity corrections from regular profiles, manual artefact removal and cleaning, resulting in a gridded dataset with a spatial resolution of 25 m × 25 m.
Seismic data acquisition employed a 0.74 L 0.74 L Generator-Injector (GI) airgun, towed at 2 m depth and fired at 3 s intervals. At an average vessel speed of ∼3.5 kn, this configuration yielded a shot spacing of ∼5.4 m. The GI airgun had a centre frequency of ∼130 Hz.
3.1 OBS Data and Processing
Two OBS profiles, designated A and B, were acquired on the western flank of the S2 canyon within the Danube Fan. Each line included four OBS deployments (Fig. 2). The instruments were equipped with 3-component 4.5 Hz geophones and hydrophones, and data were recorded continuously using a Marine Broadband Seismic recorder (Bialas and Flueh, 1999) at a sampling rate of 1000 Hz.
OBS data processing included the following steps: (1) clock drift correction, (2) instrument relocation on the seafloor using direct wave arrivals, (3) rotation of the horizontal components into radial and transverse components for each shot (Maercklin, 2001), (4) amplitude balancing (max/min normalisation), and (5) bandpass or low-pass filtering to enhance phase identification during traveltime picking. A detailed description of the wavefield rotation procedure, including vector fidelity considerations and the basis for horizontal component rotation, is provided in Sect. S1 in the Supplement.
Overall, the OBS data quality was high. While simple plane-wave theory (e.g., Stein and Wysession, 2003; Yilmaz, 2001) predicts a smooth decay of amplitudes toward zero at normal incidence, the data shown in Fig. 3 deviate from this idealised behaviour. This is because the OBS receivers are located at water depths of ∼600–800 m, placing them in a transition zone between the near-field and far-field of the seismic source. In this regime, the recorded wavefield is strongly non-planar and influenced by near-field contributions, finite-source effects, and instrument-seafloor coupling, including potential tilt effects (e.g., Duennebier and Sutton, 1995; Essing et al., 2021). Non-planar and multimodal wavefield behaviour has been shown in numerical wave-equation simulations to deviate substantially from predictions based on simple plane-wave theory assumptions (e.g., Bai et al., 2014).
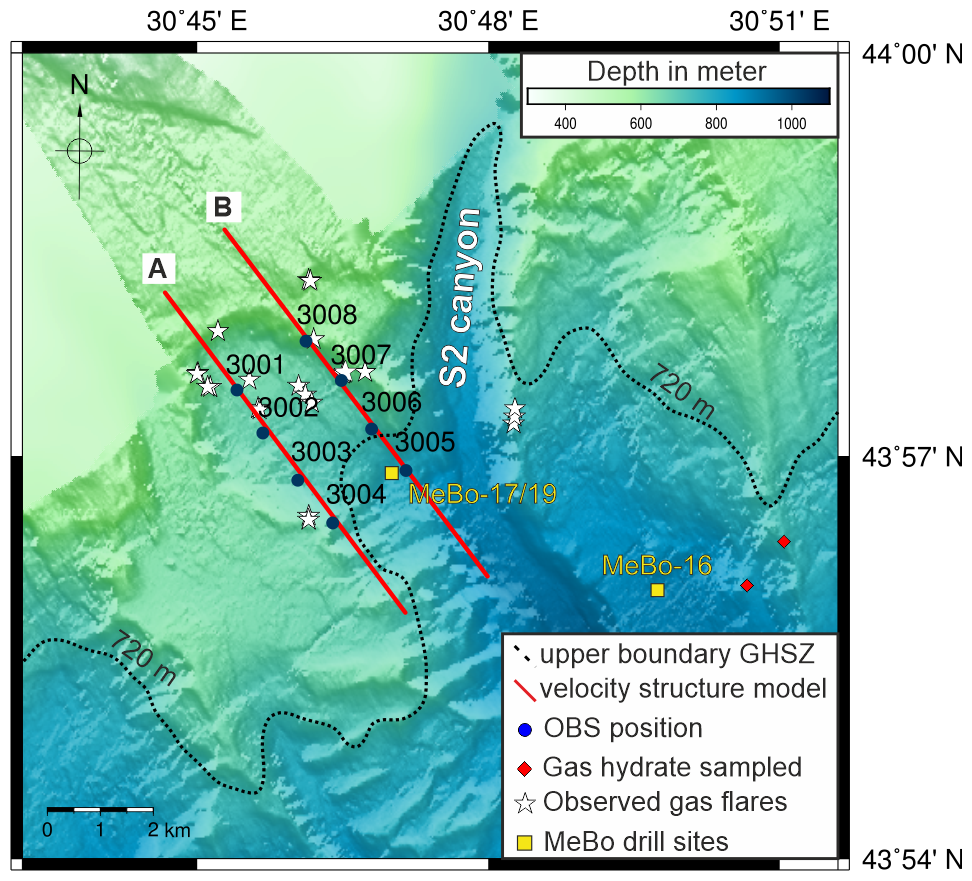
Figure 2Detailed bathymetric map of the study area on the western flank of the S2 canyon, gridded at 25 m × 25 m resolution. Data gaps were filled with the global ETOPO-1 dataset (1 arcmin resolution; Amante and Eakins, 2009). The map shows the spatial extent of the velocity models and associated 2-D MCS profiles (red lines), ocean-bottom-seismometer (OBS) positions (blue dots), gas flares observed in the water column (white stars; Hillman et al., 2018), sampled gas hydrates (red diamonds; Ker and Riboulot, 2015), and MeBo200 drilling sites (yellow rectangles; Riedel et al., 2020). The dashed black line indicates the 720 m isobath, representing the estimated upper boundary of the GHSZ (Zander et al., 2017; Riedel et al., 2020).
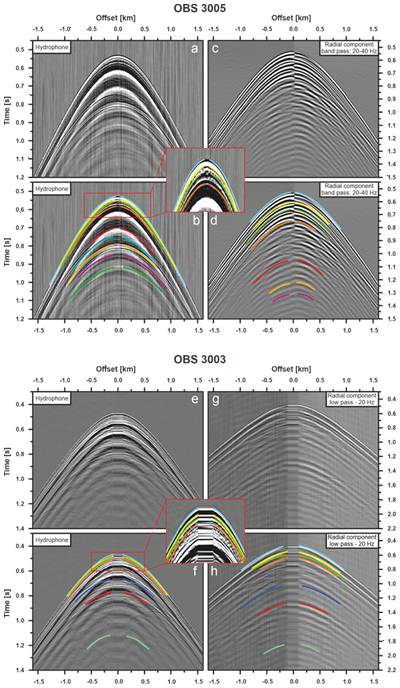
Figure 3(a) Hydrophone component of OBS 3005 and (b) identified P-wave phases used for forward modelling. Inset: Enlarged view of near-seafloor P-wave arrivals. (c) Radial component of OBS 3005 and (d) corresponding converted S-wave phases used in forward modelling. (e) Hydrophone component of OBS 3003 and (f) identified P-wave phases. Note that the horizontally stretched onsets around x=0 km result from a lateral offline position of OBS 3003. Inset: Enlarged view of near-seafloor P-wave arrivals. (g) Radial component of OBS 3003 and (h) corresponding converted S-wave phases used for forward modelling. Note that the S-wave panels are shown on a different timescale due to slower wave propagation velocities.
Such behaviour has been documented in previous OBS studies, which highlight significant deviations from plane-wave assumptions in complex geological settings (e.g., Bünz et al., 2005; Exley et al., 2010; Wang et al., 2018). Additional amplification of horizontal motion may arise from seafloor effects such as sediment compliance, impedance contrasts, ray-angle projections, and shallow conversions (e.g., Shearer and Orcutt, 1987), all of which contribute to the observed signal characteristics at normal incidence.
Multiple P-wave (hydrophone) and converted S-wave (geophone) reflections were clearly identified (Fig. 3). In general, S-wave reflections exhibited a higher signal-to-noise ratio than P-wave signals and were less affected by water-column multiples due to the different frequencies analysed (Fig. 4). To suppress high-frequency noise and emphasise the stable, low-frequency signal content, a bandpass filter of 20–40 Hz for P-waves and a lowpass of 20 Hz for S-waves was applied. Several stations drifted when they were deployed and are now about 30 m offline.
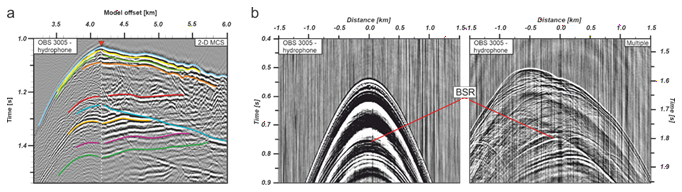
Figure 4OBS 3005 hydrophone dataset (a) Alignment of the hydrophone with the 2-D high-resolution MCS data after applying a Butterworth bandpass filter (20–40 Hz) and equal amplitude scaling. The hydrophone data are adapted to the MCS section in terms of onset and offset timing. The MCS time axis is converted into one-way traveltime. (b) Bottom-simulating reflector (BSR) identified in the first arrival (left) and corresponding first multiple (right). The BSR is observed as a distinct reflection with reversed polarity relative to the seafloor reflection, consistent with a P-wave velocity decrease below the reflector (Fig. 6), likely due to free-gas accumulations. Such free-gas accumulations reverse polarity by reducing acoustic impedance relative to the overlying sediments.
One station (OBS 3002) was excluded from S-wave analysis due to insufficient seafloor coupling. The absence of clear refracted phases across the array restricts the velocity analysis to a localised zone directly underneath each instrument.
3.2 2-D High-resolution MCS Data and Processing
Multichannel seismic (MCS) data were acquired simultaneously with the OBS deployments along profiles A and B (Fig. 2), using a 144-channel streamer. The streamer configuration included a 25 m vibration isolation section, a 55 m tow cable, and 19 active sections of 12.5 m each, yielding a total active length of 237.5 m. Each active section contained 8 channels, with a hydrophone group spacing of 1.5625 m. Data were recorded at a sampling rate of 1000 Hz and binned with a common depth point (CDP) spacing of 1.5625 m.
The MCS data processing workflow comprised the following steps: (1) navigation correction for both streamer and shot positions, (2) crooked-line common mid-point (CMP) binning, (3) gain correction, (4) attenuation of anomalous amplitudes, (5) radon filtering, (6) CMP stacking using water velocity, necessitated by the short streamer length, (7) deconvolution with a prediction lag of 60 ms, averaged over 1000 traces, to suppress injector bubble effects, (8) water-velocity Stolt migration, followed by residual finite-difference migration using spatially and temporally varying velocities from regional profiles (Hillman et al., 2018). Final depth conversion was performed in generic seismic interpretation software, utilising the velocity models derived from the OBS data.
3.3 Phase Identification and OBS-MCS Correlation
The OBS records show both compressional (P-) and shear (S-) wave phases. Phase identification began with picking the P-wave reflections, which were then assigned to specific layers within the seismic velocity model for each station. Prominent reflectors observed in the MCS data served as reference horizons and were cross-checked against corresponding phases in the OBS records. Therefore, the OBS data were aligned to the MCS at zero offset and time-shifted so that the direct water arrivals matched the seafloor reflection in the MCS data, compensating for the two-way traveltime (Fig. 4a). This alignment allowed consistent phase identification across all OBS stations. Additionally, first water multiples were used to help discriminate overlapping arrivals to identify reflection polarity more clearly, especially where direct arrivals were masked by source-related noise (Fig. 4b). P-wave reflections were typically traceable to source-receiver offsets of up to ∼1.2 km (Fig. 3).
Once P-wave arrivals were identified, converted S-wave phases, recorded on the radial components (Fig. 3c and g), were assigned to the same reflectors within the velocity model. This step was the most critical in the analysis, relying on joint forward modelling of both P- and S-wave arrivals. A detailed description of the identification strategy for converted S-wave phases is provided in Sect. S2. Following Digranes et al. (1998), the conversion from P- to S-waves is assumed to occur at the reflector itself. Due to their lower velocities, S-wave reflections could only be traced over shorter offsets, with a maximum source-receiver distance of ∼0.9 km (Fig. 3), resulting in a smaller spatial coverage compared to the P-wave data.
3.4 Forward Modelling
Seismic phases were picked using PASTEUP (Fujie et al., 2008), a graphical user interface (GUI) for Seismic Unix (Stockwell, 1999). Forward modelling was performed with RAYINVR (Zelt and Smith, 1992) using the companion GUI MODELING (Fujie et al., 2008). The initial P-wave velocity structure was adapted from Hillman et al. (2018) and iteratively refined using a trial-and-error forward modelling approach. Interface geometries were locally adjusted by up to ±5 m over ∼200 m of profile length in the upper sections and by ±10 m over ∼500 m in deeper sections, particularly where OBS instruments were located offline.
RAYINVR computes traveltimes through user-defined velocity and depth grids using a 2-D ray-tracing and forward modelling algorithm (Zelt and Smith, 1992). This process yielded detailed final models extending to ∼1.2 km depth, well below the BSR.
Subsequently, the velocity structure and layer geometry were jointly refined for both P- and S-waves by modifying the -ratios within each layer. The plausibility of the P-S-phase correlations was evaluated by examining the S-wave residuals for systematic misfits or unrealistic -ratio values.
In addition, the S-wave parametrisation was intentionally kept less flexible compared to the P-wave model. Although the modelling software allows the definition of vertically varying values (top and bottom layer), this option was not used. Instead, constant ratios were applied across layers. This choice was made to maintain model stability and interpretability within the constraints of the data.
Given the limited offset range and reduced ray coverage of converted S-wave phases, the sensitivity to vertical velocity gradient is low. Introducing additional degrees of freedom would increase the non-uniqueness in the S-wave model. The resulting Vs structure, therefore, reflects a balance between data resolution and model complexity.
The results presented here integrate OBS-derived P- and S-wave velocity models with coincident MCS reflection data to characterise the subsurface of the S2 slope failure zone. Together, these datasets provide complementary constraints on sedimentary architectural, physical properties and fluid-related processes across profiles A and B. Both profiles reveal a consistent three-unit stratigraphic framework, while also highlighting local variations associated with mass-transport deposits, deformation structures, gas-related seismic anomalies, and potential fluid migration pathways.
4.1 Subsurface Structure of Profile A
Profile A traverses the central part of a slope failure zone west of the S2 canyon. OBSs 3001 to 3003 are located within a slump scar, with an average dip angle of 2.5°, while OBS 3004 lies toward the southeastern margin of the study area (Fig. 2). The northwestern headwall forms a ∼100 m high step in the seafloor (Fig. 5a). The profile ends within levee deposits of the Danube Fan.
Based on traveltime picking and forward modelling, three main units (Unit 1–3; Fig. 5) are identified, comprising ten model layers (A1–A10; details in Sect. S3). A1 represents the water column.
Unit 1. Unit 1 shows continuous, high-amplitude reflections with a thickness of ∼40–80 m and can be traced upslope within the slump scar (1.0–5.5 km along profile) and southeast of OBS 3004 (Figs. 5 and 6). Amplitude strength decreases slightly toward the southeast, while stratification remains continuous. A lenticular reflection body (M1), ∼ 20 m thick and ∼500 m wide, is observed between 1.6–2.0 km model offset (Figs. 5 and 8). This body displays semi-transparent, sub-parallel internal reflections.
Unit 2. Unit 2 is characterised by chaotic seismic facies (CSF) with patchy high amplitudes (Figs. 5 and 8). It extends from ∼0.9 to ∼3.6 km along the profile and is ∼150 m thick. Its base is defined by a prominent downward-dipping reflection (DDR; Figs. 5 and 8). Locally, southeast-tilted reflections are observed down to ∼800 m depth. Reflections between 3.5 and 3.8 km model offset dip toward the S2 canyon. Localised high-amplitude reflections occur above a zone of discontinuous and disturbed reflections at ∼4.4 km model offset at 800–1000 m depth. Below, a velocity pull-down anomaly is observed (labelled SC in Fig. 8).
Unit 3. Unit 3 consists of stratified, laterally continuous reflections with a slight northwestward dip, extending to ∼1.2 km depth. Reflections amplitudes decrease with depth and towards the northwest (Figs. 5 and 8), partly due to processing artefacts. Local polarity reversals are observed near a zone of velocity pull-downs (SC). Below ∼1.1 km depth, reflections remain continuous.
4.2 P- and S-wave Velocities of Profile A
The three seismic units identified in the reflection data on profile A are further characterised using the derived P- and S-wave velocity models. The derived Vp and Vs models for profile A are displayed in Fig. 5a and b and summarised in Table S1 in Sect. S3. Vp increases from 1510 m s−1 at the seafloor to 1900 m s−1 at ∼1.2 km depth, while Vs increases from 140 to 860 m s−1 over the same interval (Figs. 5 and 6). The water column is assigned a constant velocity of 1483 m s−1. Both Vp and Vs show minimal lateral variation, resulting in laterally stable -ratios within each layer.
Within Unit 1, Vp increases from 1510 m s−1 beneath the seafloor to 1530 m s−1 in ∼720 m depth, and Vs from 140 to 230 m s−1, resulting in a -ratio decrease from 10.6 to 6.8. Within Unit 2, Vp increases from 1580 to 1760 m s−1 at ∼880 m depth, and Vs from 320 to 460 m s−1, with -ratios decreasing from 5 to 3.8. In Unit 3, Vp increases from 1760 to 1900 m s−1 in ∼1.2 km depth, and Vs from 500 to 860 m s−1, yielding in a -ratio decrease from 3.6 to 2.2. A local velocity decrease (∼80 m s−1 in Vp) is observed at the base of Unit 2 (DDR) associated with a normal-polarity amplitude reflection (Fig. 6).
4.3 Subsurface Structure of Profile B
Profile B crosses a steeper terrain than profile A and intersects the slope failure zone near the NNE sidewall and a gully system entering the S2 canyon (Fig. 2). Based on traveltime picking and final modelling, the subsurface is divided again into three units (Unit 1–3), comprising eleven model layers (B1–B11), with B1 representing the water column (details in Sect. S3). This structure is consistent with profile A.
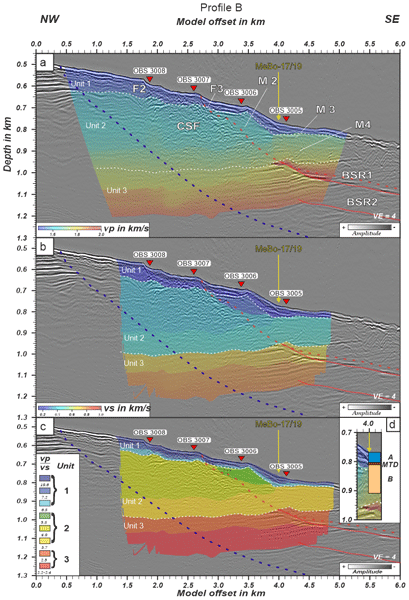
Unit 1. Similar to profile A, Unit 1 is characterised by continuous high-amplitude reflections, but with a stronger variation in thickness, ranging from ∼100 m northwest of the slump scar (0–1.8 km model offset) to ∼30–50 m within (Figs. 7 and 9). Two normal faults (F2 and F3) locally disrupt reflectivity between 1.8 and 2.7 km model offset and extend to ∼100 m below the seafloor.
Unit 2. As in profile A, Unit 2 consists of a chaotic seismic facies (CSF) confined between the faults F2 and F3 (∼1.8–2.7 km model offset) and extends down to ∼900 m depths (Figs. 7 and 9). The CSF is characterised by discontinuous and spatially variable reflection patterns.
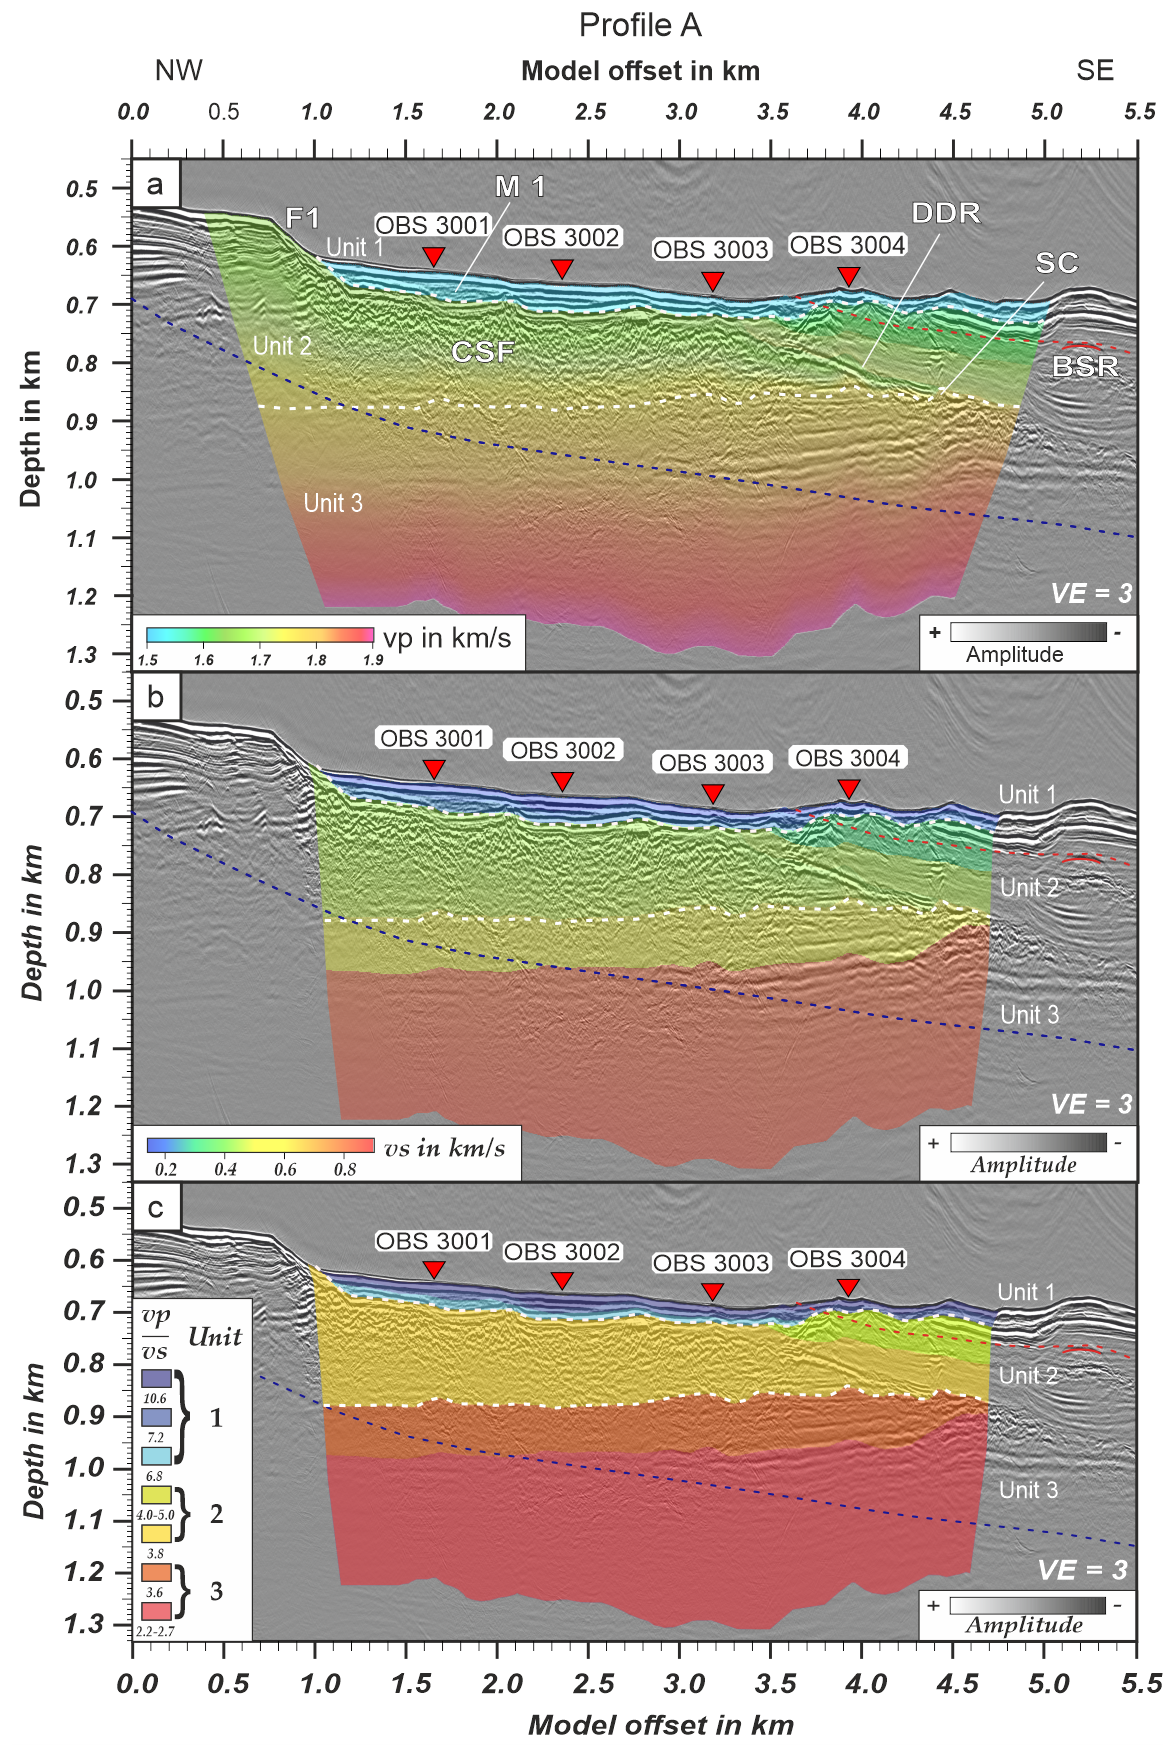
Figure 5Seismic velocity structure models of profile A. (a) P-wave velocity, (b) S-wave velocity, and the corresponding (c) -ratio models overlaying the 2-D MCS seismic data. The seismic section is vertically exaggerated by a factor of three. Inverted red triangles indicate the position of the OBSs along the profile. Seismic anomalies are pointed out: BSR: bottom-simulating reflector, CSF: chaotic seismic facies, DDR: downward dipping reflector, F1: fault, M1: mass transport deposits (MTD), and SC: seismic chimney structure. The dashed white lines mark the boundaries of Unit 2. The dotted red line marks the theoretical base of the present-day GHSZ, calculated using a bottom- water temperature of 9 °C and a geothermal gradient of 22 °C km−1. The blue dotted line indicates the estimated GHSZ base during the Last Glacial Maximum (LGM), assuming a bottom temperature of 4 °C and the same thermal gradient (both after Badhani, 2016). Note: The theoretical BSR marks the upper limit of the GHSZ. At this shallow depth, conditions are not fully stable, so the BSR does not precisely follow the seafloor.
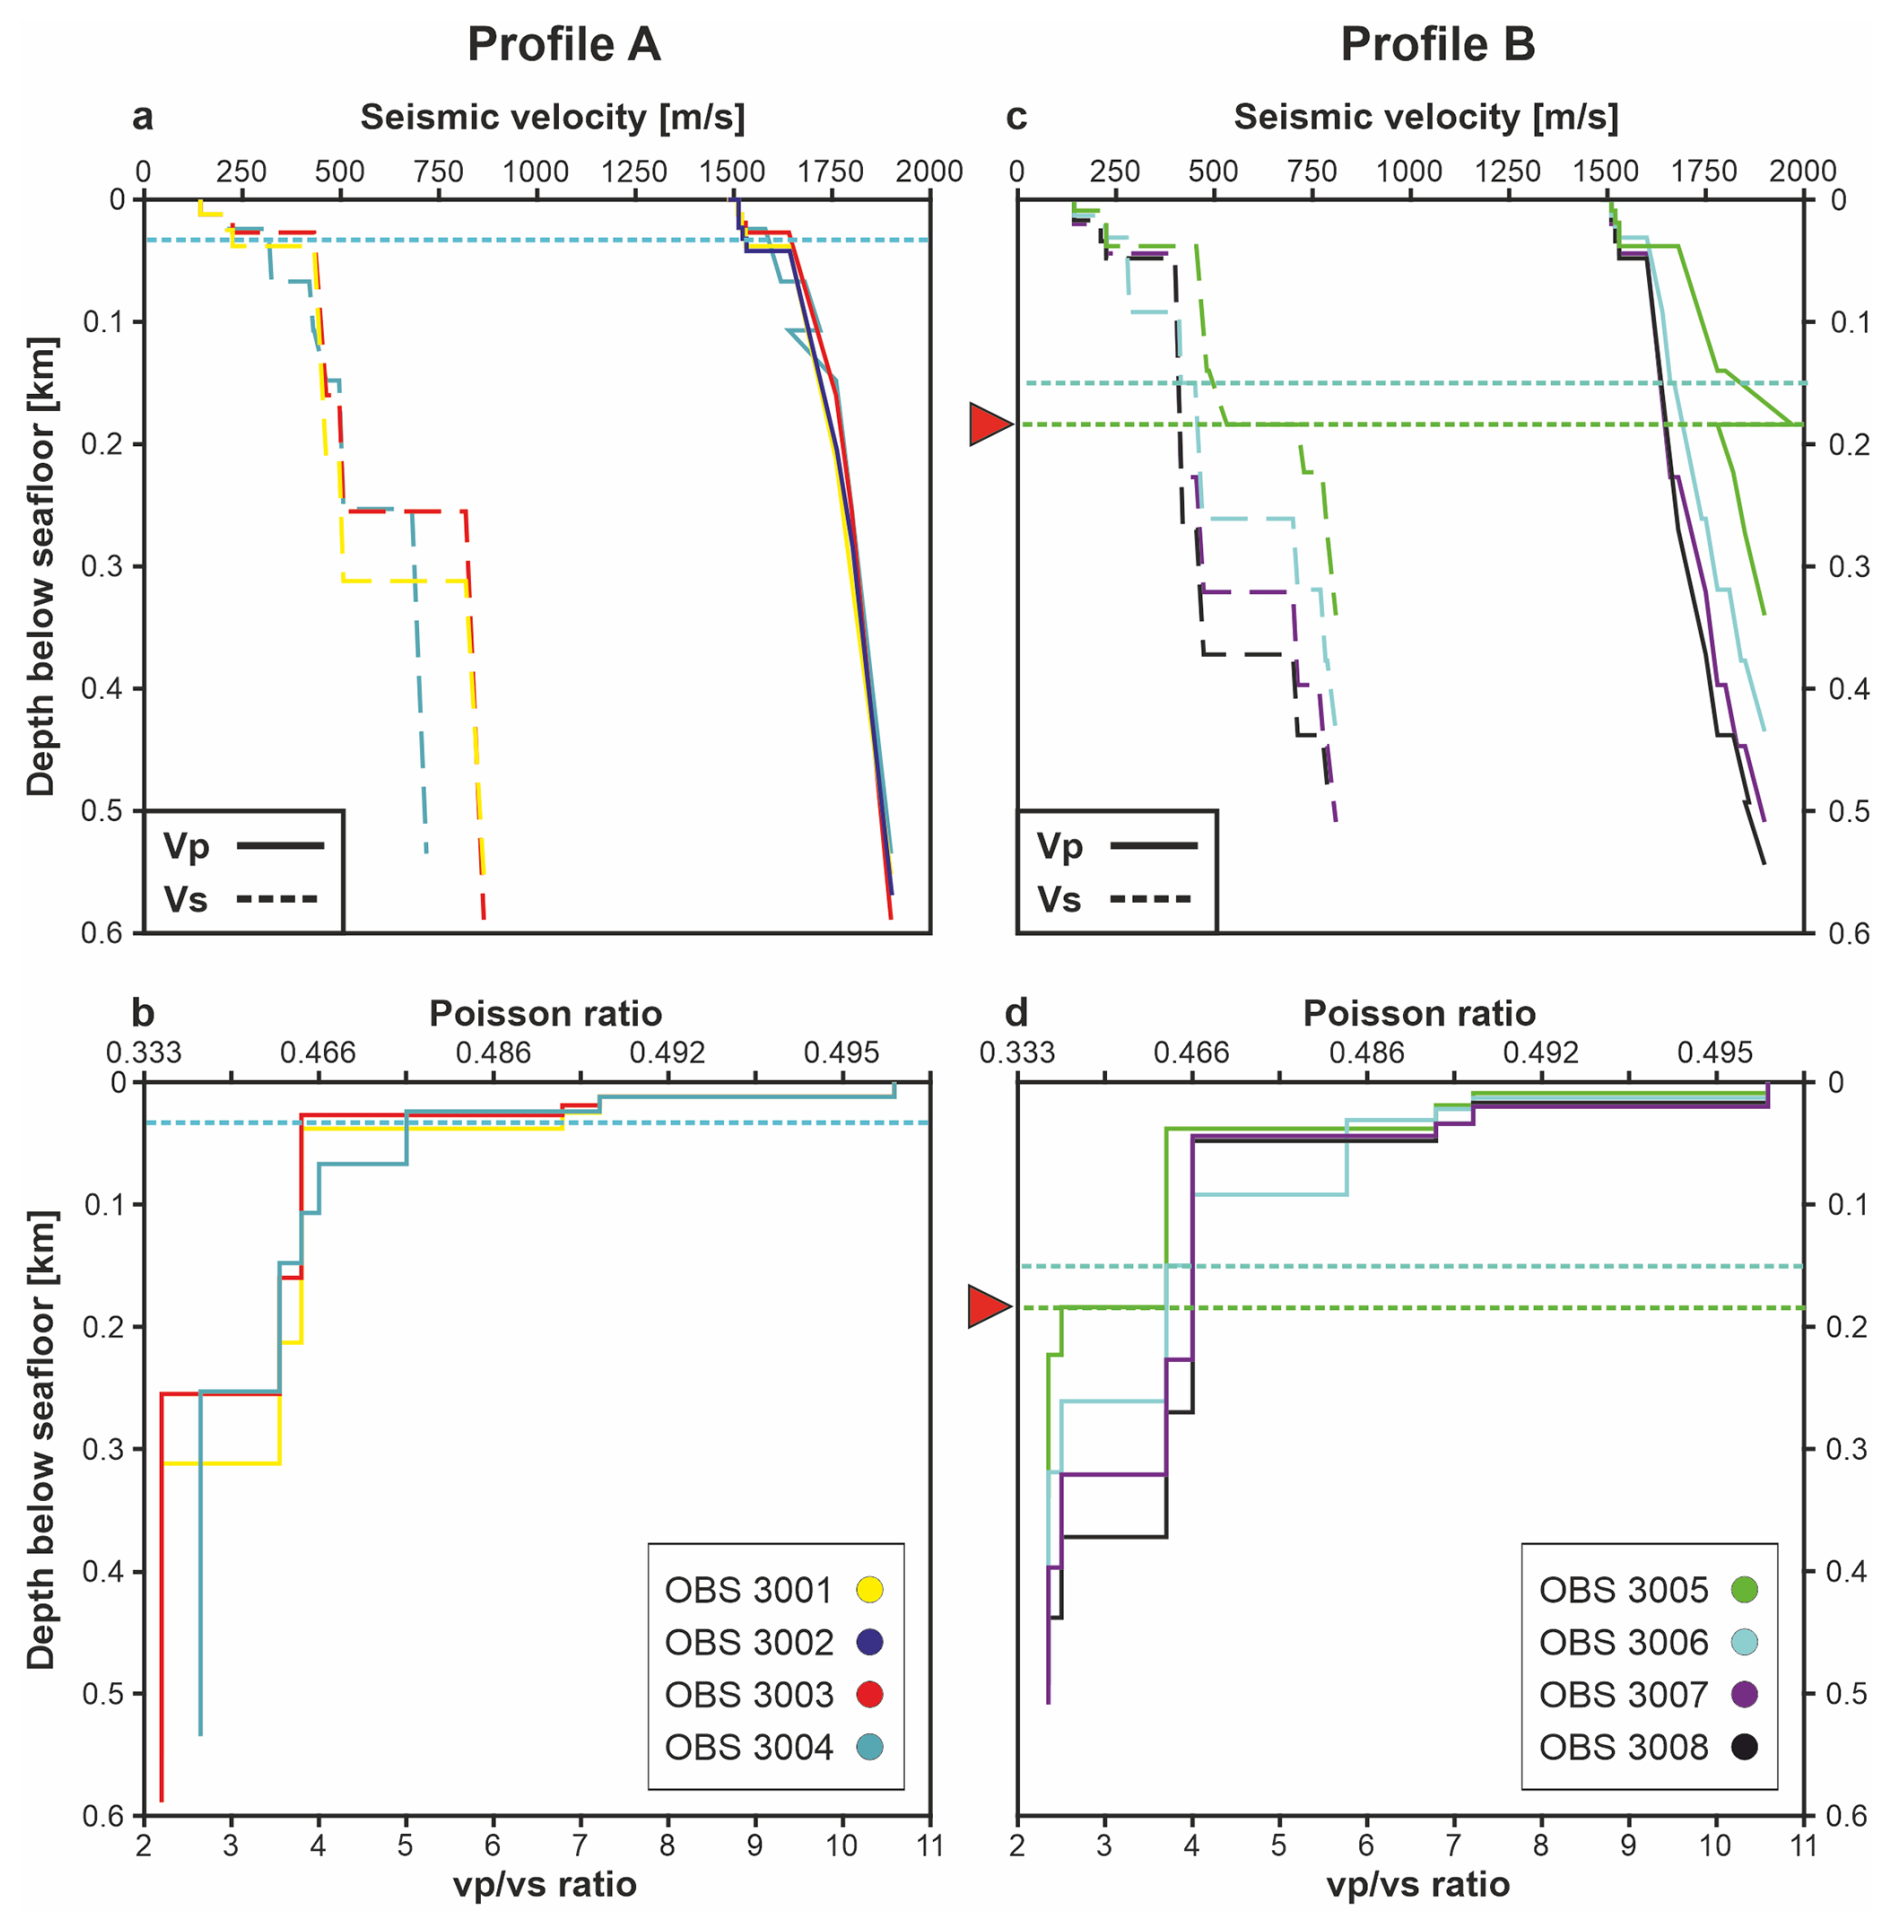
Figure 61-D velocity and ratio profiles for OBS stations along profiles A and B. (a) 1-D P-wave (solid lines) and S-wave (dashed lines) velocity profiles for OBSs 3001–3004 along profile A. (b) Corresponding 1-D and Poisson's ratios. Note: Poisson's ratio is non-linearly related to the -ratio. (c) 1-D P-wave (solid lines) and S-wave (dashed lines) velocity profiles for OBSs 3005–3008 along profile B. (d) Corresponding 1-D and Poisson's ratios. The horizontally dashed lines represent the theoretical base of the GHSZ (after Badhani, 2016) and the red triangle marks the observed BSR depth at OBS 3005. The different depth of the theoretical GHSZ are a direct response to the prevailing pressure and temperature conditions in the shallow setting.
Southeast, the CSF abuts a lens-shaped seismic body (M2), displaying semi-transparent internal reflections and local cross-cutting reflectors, some of which may represent processing artefacts. Adjacent reflections are locally deformed around M2.
Further southeast, two additional semi-transparent seismic bodies (M3 and M4) occur within otherwise sub-horizontal strata. M3 forms an elongated, lens-shaped body extending from ∼4 to 5.2 km model offset at ∼850 m depth, with an internal topographic step of ∼20–30 m. A laterally continuous reflector separates M3 from the underlying body M4 (Figs. 7 and 9).
M4 extends from 3.7–5.4 km model offset at depths of ∼850–950 m and thickens from ∼50 to ∼70 m toward the southeast. Internally, M4 shows deformed reflections and localised zones of elevated amplitude, while reflectivity gradually decreases toward the northwest.
Southeast of 5.4 km model offset, several V-shaped reflectors extend from the seafloor to depths of ∼1 km. Owing to their lack of lateral continuity and stratigraphic coherence, these features are interpreted as likely processing artefacts.
Unit 3. Unit 3 exhibits the same general character as observed in profile A, consisting of sub-horizontal and laterally continuous reflections (Figs. 7 and 9). A major difference is the presence of a strong upward-bending reflector (BSR1) forming the upper boundary of this unit. BSR1 crosscuts the surrounding strata, mimics the seafloor morphology, and exhibits reversed polarity. Below BSR1, several zones of enhanced-amplitude, reversed-polarity reflections are observed. A second, weaker, reversed-polarity reflector (BSR2) occurs at ∼1050 m depth (Figs. 7 and 9). Beneath both BSR horizons, reflections remain laterally continuous and sub-horizontal, with amplitudes gradually decreasing toward the northwest.
4.4 P- and S-wave Velocities of Profile B
The three seismic units identified on profile B are further characterised using the derived P- and S-wave velocity models. The derived Vp and Vs models for profile B are displayed in Fig. 7a and b and summarised in Table S2 in Sect. S3. Vp increases from 1510 m s−1 at the seafloor to 1900 m s−1 at ∼1.15 km depth, and Vs increases from 140 to 810 m s−1. The water column (B1) is assigned a constant velocity of 1483 m s−1.
Overall, the velocity structure of profile B is consistent with profile A, showing laterally stable Vp and Vs distributions and comparable vertical gradients within the three-unit framework. No major lateral velocity heterogeneities are observed that would require a deviation from the established stratigraphic subdivision.
Within Unit 1, Vp increases from 1510 m s−1 at the seafloor to 1530 m s−1 at 50–100 m depth, while Vs increases from 140 to 230 m s−1, corresponding to a -ratios decrease from 10.6 to 6.8.
Within Unit 2, Vp increases from 1600 to 1780 m s−1 at ∼1 km depth, and Vs increases from 280 to 480 m s−1, resulting in a -ratio decrease from 5.8 to 3.7. This decrease is consistent with profile A, but with slightly higher absolute Vs values.
In Unit 3, Vp increases from 1800 to 1900 m s−1 at ∼ 1.2 km depth, while Vs increases from 490 to 810 m s−1, leading to a -ratios decrease from 3.7 to 2.4.
A key difference compared to profile A is observed at the position of BSR1, where a local decrease in Vp of ∼ 190 m s−1 occurs. Vs values remain largely unchanged across this interval, resulting in a distinct reduction in the -ratio. At BSR2, velocity values are not constrained by ray coverage, and the reflector is therefore not resolved in the model.
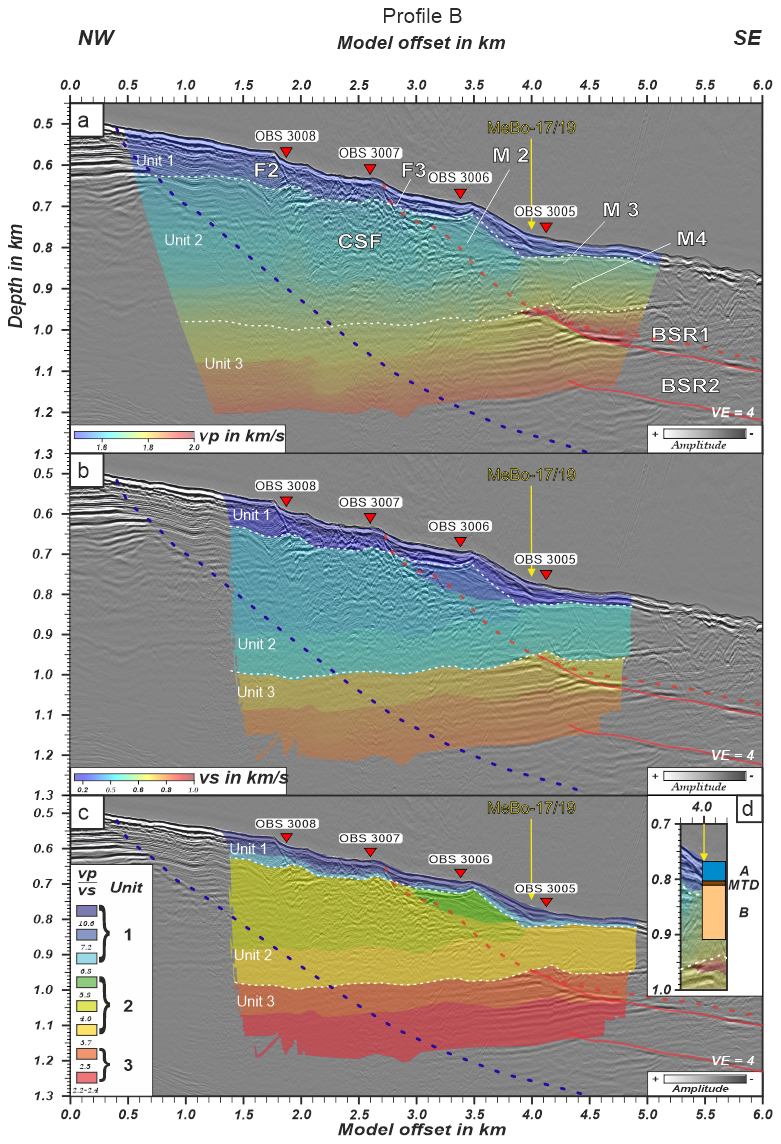
Figure 7Seismic velocity structure models of profile B. (a) P-wave velocity, (b) S-wave velocity, and the corresponding (c) -ratio models overlaying the 2-D MCS seismic data. The seismic section is vertically exaggerated by a factor of three. Inverted red triangles indicate the position of the OBSs along the profile. Seismic anomalies are pointed out: BSR: bottom-simulating-reflector, CSF: chaotic seismic facies, F2 and F3: fault, and M2 to M4: MTD (mass-transport deposit). The dashed white lines mark the boundaries of Unit 2. The dotted red line marks the theoretical base of the present-day GHSZ, calculated using a bottom-water temperature of 9 °C and a geothermal gradient of 22 °C km−1. The blue dotted line indicates the estimated GHSZ base during the Last Glacial Maximum (LGM), assuming a bottom temperature of 4 °C and the same thermal gradient (both after Badhani, 2016). Where the upper limit of the GHSZ outcrops, BSRs may cross underlying units and do not perfectly follow the seafloor, reflecting local pressure and temperature conditions (e.g., Zander et al., 2017, 2018). (d) Simplified stratigraphic framework at the projected MeBo-17/19 borehole location (modified after Riedel et al., 2020) showing three main units: Unit A (silty clays with sand layers) intercalated MTDs representing chaotically reworked material, and Unit B (older fine-grained sediments overchannel-overspill turbidites).
4.5 Constraints and Model Uncertainties
Phase picking and forward modelling are inherently non-unique problems, as the solution depends on manual phase identification, model parametrisation, and the iterative fitting procedure (Diehl, 2008). To quantify and constrain model reliability, we distinguish between traveltime misfit, parameter uncertainty, and interpretational ambiguity.
Traveltime misfit is assessed through picking uncertainties, ray coverage (Figs. S10–S13 in Sect. S3), and statistical residuals (Zelt, 1999). The frequency-dependent effects of filtering (0–20 Hz for S-waves, and 20–40 Hz for P-waves) suppress high-frequency noise and emphasise the stable, low-frequency signal content that improves the reliability of traveltime picking. Pick uncertainties range from 5 to 24 ms (Tables S1 and S2 in Sect. S3) and increase with depth due to decreasing signal-to-noise ratio and reduced phase coherence. In total 8192 and 10 063 picks were used for analysis for profiles A and B, respectively. The resulting Root-Mean-Square (RMS) residuals (3 and 4 ms) and normalized χ2-values (0.27 and 0.33), for profile A and B, respectively, indicate an overall consistent fit between observed and synthetic arrivals. These metrics, however, describe data fit only and do not imply solution uniqueness.
Parameter uncertainty is primarily controlled by ray coverage (Figs. S10–S13 in Sect. S3), discretisation of the velocity model, and the trade-off between velocity and interface geometry inherent to forward modelling (Zelt and Smith, 1992). Ray density reflects both resolution and smoothness and is generally high across the profiles. Single-parameter sensitivity tests indicate allowable perturbations of approximately 1 %–7 % (10–100 m s−1) in Vp, 2 %–14 % (8–30 m s−1) in Vs, and 1 %–9 % (±0.031–0.707) in -ratios within the traveltime uncertainty bounds. A reduced perturbation can be reached by jointly constraining the model for P- and S-waves, resulting in 1 %–3 % (10–50 m s−1). Perturbations were applied layer-wise by changing the top and bottom velocities and keeping the gradients constant; effects on adjacent layers were not included. Vertical resolution is the highest in the upper ∼100 m (10 m node spacing) and decreases with depth (up to 100 m node spacing), while lateral resolution is limited by velocity node spacing (100–500 m). Therefore, depth nodes have a sensitivity of 1–2 m for perturbation. Consequently, small-scale heterogeneities below these scales are not resolvable and are effectively absorbed into smooth velocity gradients or interface adjustments.
Interpretational uncertainty arises from the non-uniqueness of structural assignment. This is mitigated by independent a priori constraints from MCS stratigraphy, previously published velocity models of the Danube Fan (Dannowski et al., 2016; Popescu et al., 2006; Winguth, 1998; Zander et al., 2017), and MeBo200 drilling results (Riedel et al., 2020), which define robust bounds on lithological layering and sediment properties. These constraints reduce ambiguity in correlating velocity contrasts with geological units but do not eliminate equivalent model solutions that satisfy the traveltime data.
Differences in the resolution of P- and S-wave models reflect acquisition geometry and phase physics rather than methodological inconsistency. P-wave modelling benefits from higher signal-to-noise ratios and a broader offset range (∼1.2 km), resulting in denser ray coverage and smoother velocity fields. In contrast, S-wave constraints are limited to P-to-S converted phases with restricted aperture (∼0.9 km), reducing resolution and increasing spatial smoothing. Accordingly, a single value per layer is used to avoid overparameterization unsupported by the data. Since Vs values depend on Vp and -ratios, they were derived using error propagation.
Overall, the presented models represent a geologically constrained, data-consistent solution within a bounded ensemble of admissible models rather than a unique subsurface reconstruction.
This study integrates OBS and MCS profiles from the central (profile A) and eastern (profile B) parts of the S2 slope failure zone. The data are interpreted in the context of velocity observations from the Danube Fan (e.g., Popescu et al., 2006; Zander et al., 2017; Bialas et al., 2020a) and MeBo200 drilling results (Riedel et al., 2020; Bohrmann et al., 2018). The combined dataset reveals a range of structural, lithological and fluid-related features including under-consolidated sediments, indications of focused fluid migration, gas-related seismic anomalies, and MTDs.
5.1 Sedimentary Architecture
Seismic velocities and the integrated OBS-MCS data reveal systematically low P-wave velocities and elevated -ratios in the shallow subsurface (Figs. 5 and 7, Tables S1 and S2 in Sect. S3), reflecting water-rich clays and silts with poor consolidation (Sava and Hardage, 2009; Hamilton, 1979a). Measured P-wave velocities remain below typical reference values for normally consolidated sediments at comparable burial depths (Hamilton, 1979a), indicating a persistently under-consolidated mechanical state throughout the upper sedimentary units. This suggests limited dewatering and incomplete compaction within rapidly accumulated fine-grained deposits.
Drilling results from the MeBo200 campaign (Bohrmann et al., 2018; Riedel et al., 2020, 2021) provide lithological ground truth for the seismic interpretation. The drilling campaign in the Danube deep-sea fan (cruise M142; Bohrmann et al., 2018; Riedel et al., 2020) was conducted to investigate gas hydrate occurrence and constrain sedimentary structures using in-situ coring and logging. The drilling activities were carried out in the Romanian sector of the Black Sea, where multiple sites along the S2 Channel and adjacent canyon flanks were targeted based on pre-existing seismic data. Boreholes reached depths of up to ∼144–147 m below seafloor, recovering Holocene to glacial sedimentary sequences that provide key lithological and petrophysical constraints for seismic interpretation.
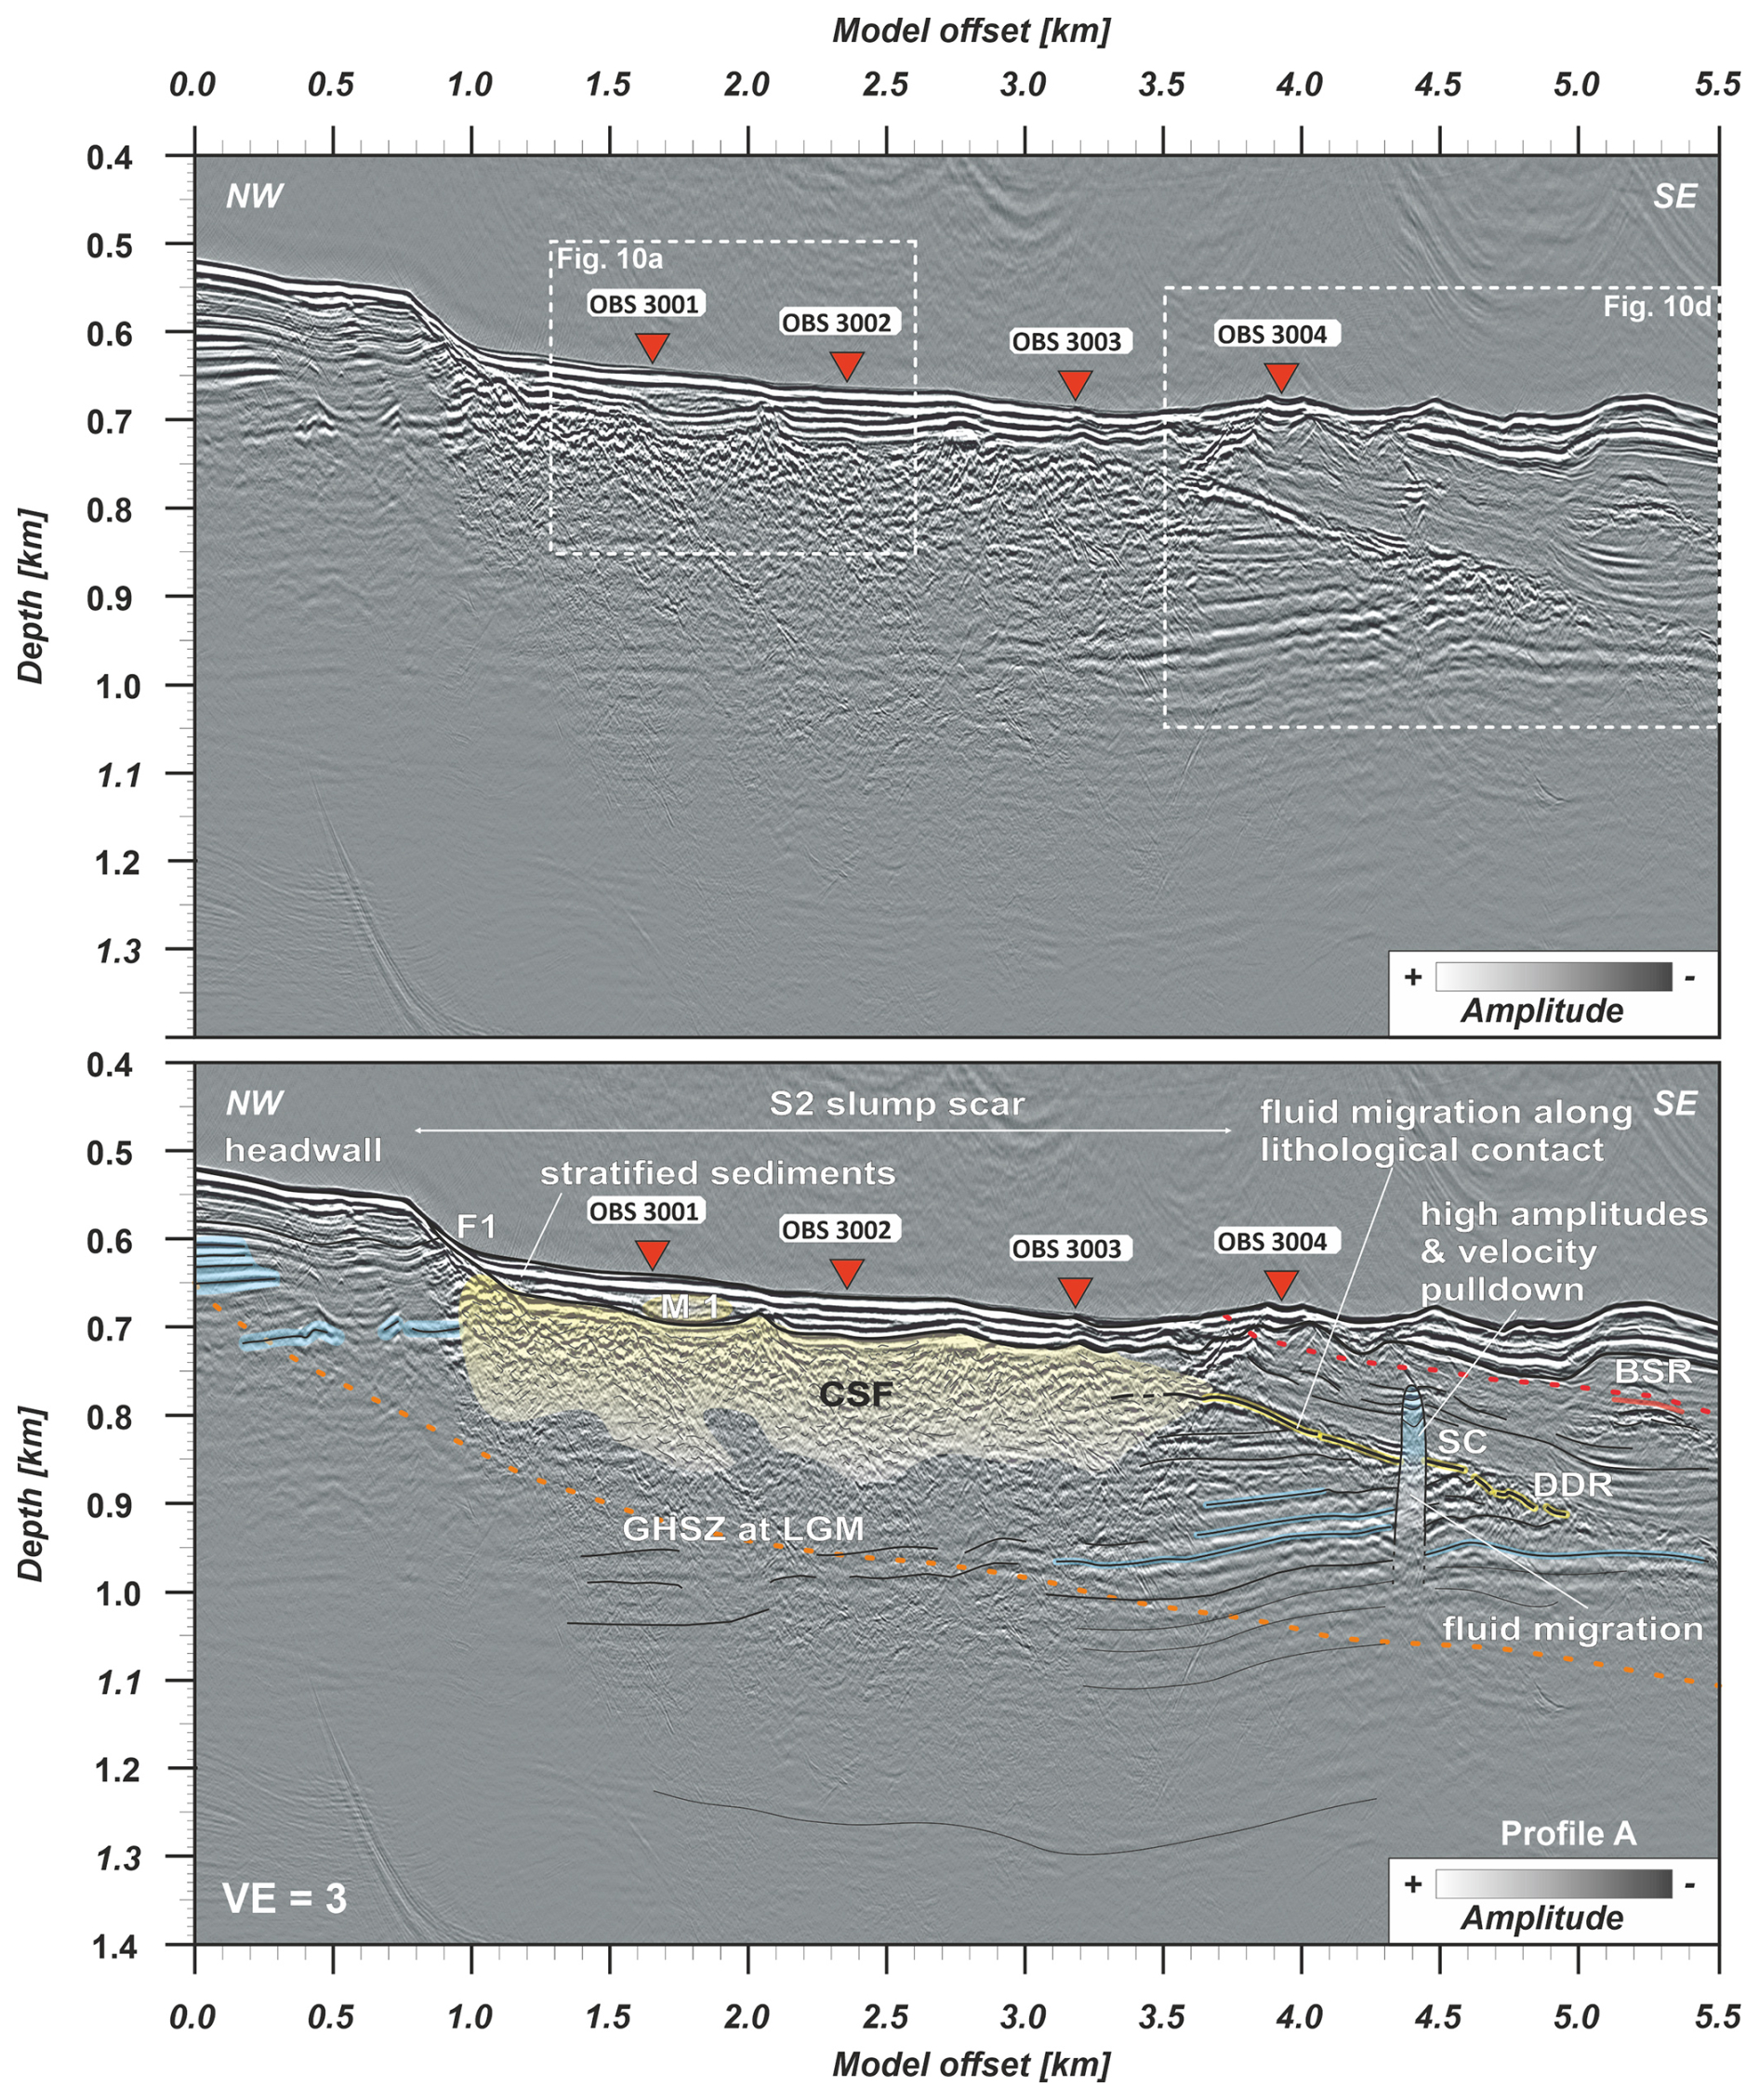
Figure 8Seismic section (upper panel) and interpretation (lower panel) of high-resolution MCS profile A. Gas-charged zones are shaded in light blue. Small-scale mass-transport deposits (MTDs), including M1 and chaotic seismic facies (CSF1), bottom-simulating reflector (BSR), as well as the lithological boundary DDR (downward-dipping reflector), are highlighted in yellow. A seismic chimney (SC) is visible southeast of OBS 3004. The dotted red line marks the theoretical base of the present-day GHSZ, calculated using a bottom-water temperature of 9 °C and a geothermal gradient of 22 °C km−1. The orange dotted line indicates the estimated GHSZ base during the Last Glacial Maximum (LGM), assuming a bottom temperature of 4 °C and the same thermal gradient (both after Badhani, 2016). Boxes indicate enlarged sections shown in Fig. 10.
The MeBo-17/19 sites are located in proximity to OBS 3005 along profile B (Fig. 2), when projected onto profile B, with an approximate lateral offset of ∼125 m northwest of the OBS and ∼250 m southwest of it. Given these relatively small distances compared to the seismic resolution of the MCS and the laterally continuous character of the stratigraphy, the borehole data can be considered broadly representative of the seismic units, while small-scale heterogeneity remains unresolved. The drilled sections are dominated by hemipelagic clays and silts interbedded with sandy levee deposits, consistent with channel-levee and overbank environments of the Danube Fan system (Riedel et al., 2020, 2021).
Stratigraphic correlation indicates that the shallow drilled intervals (0–38 m; A in Fig. 7d) corresponding to Unit 1 are characterised by weakly under-consolidated, high-porosity sediments. Deeper intervals (42–142 m; B in Fig. 7d) corresponding to Unit 2 represent more compacted and stratified levee and channel-related deposits. The drilled MTD interval (MTD in Fig. 7d) is very thin and might correspond to the outcrop of the MTD below OBS 3005.
Measured physical properties from the boreholes, including high porosity, low shear strength, and variable gas content (Riedel et al., 2020, 2021) are consistent with the low P-wave velocities and elevated -ratios observed in the seismic data (Figs. 5 and 7). These agreements provide independent support for the seismic unit interpretation.
These constraints provide independent validation for the seismic interpretation of lithological units and reduce ambiguity in linking seismic velocity structure to sedimentary boundaries. However, due to spatial separation between boreholes and seismic profiles and inherent small-scale heterogeneity, the correlation remains locally constrained and does not resolve fine-scale variability beneath the seismic data resolution.
To quantitatively constrain these observations, the velocity and distributions are evaluated against global marine reference trends (Hamilton, 1979a, b). In terrigenous marine sediments, P-wave velocities typically increase from ∼1500–1600 m s−1 near the seafloor to >2000 m s−1 at greater burial depth, while -ratios decrease from >10 in very soft sediments to ∼2.6 in fully compacted sequences at a depth of ∼1 km. Sandy sediments exhibit similarly high near-surface ratios (>6) but steep near-surface gradients, whereas carbonates and basalts define distinct lower-ratio endmembers (∼1.8–2.1).
Within this framework, the observed seismic units can be quantitatively positioned along the compaction trend. Unit 1 (Vp≈1510–1530 m s−1; –6.8) lies within the upper range of consolidated marine sediments, consistent with high porosity and low effective stress. Unit 2 (Vp≈1580–1780 m s−1; –3.7) represents an intermediate mechanical state consistent with partially compacted or reworked sediments, in agreement with the CSF. Unit 3 (Vp≈1760–1900 m s−1; –2.2) approaches the lower end of fine-grained marine sediments but remains above the fully normally consolidated reference conditions. MeBo200 borehole measurements provide a higher-resolution constraint on physical properties at decimetre to meter scale compared to the seismic datasets. P-velocities range between ∼1400 and 1700 m s−1, with the trend to increase within 140 m depth (Riedel et al., 2020). Locally elevated values greater than 1800 m s−1 are observed within specific stratigraphic intervals. These values are consistent with the velocities observed in the upper Vp model (Fig. 7).
The upper sedimentary drape (Unit 1) shows well-stratified, high-amplitude reflections but relatively low inferred shear strength. Intercalated MTDs, such as the lens-shaped body M1 on profile A (Fig. 8), record past slope failures that infilled depressions near the headwall (e.g., Schnellmann et al., 2006). On profile B, disturbed high-amplitude reflections confined between faults F2 and F3 (Fig. 9) indicate downslope deformation adjacent to the sidewall.
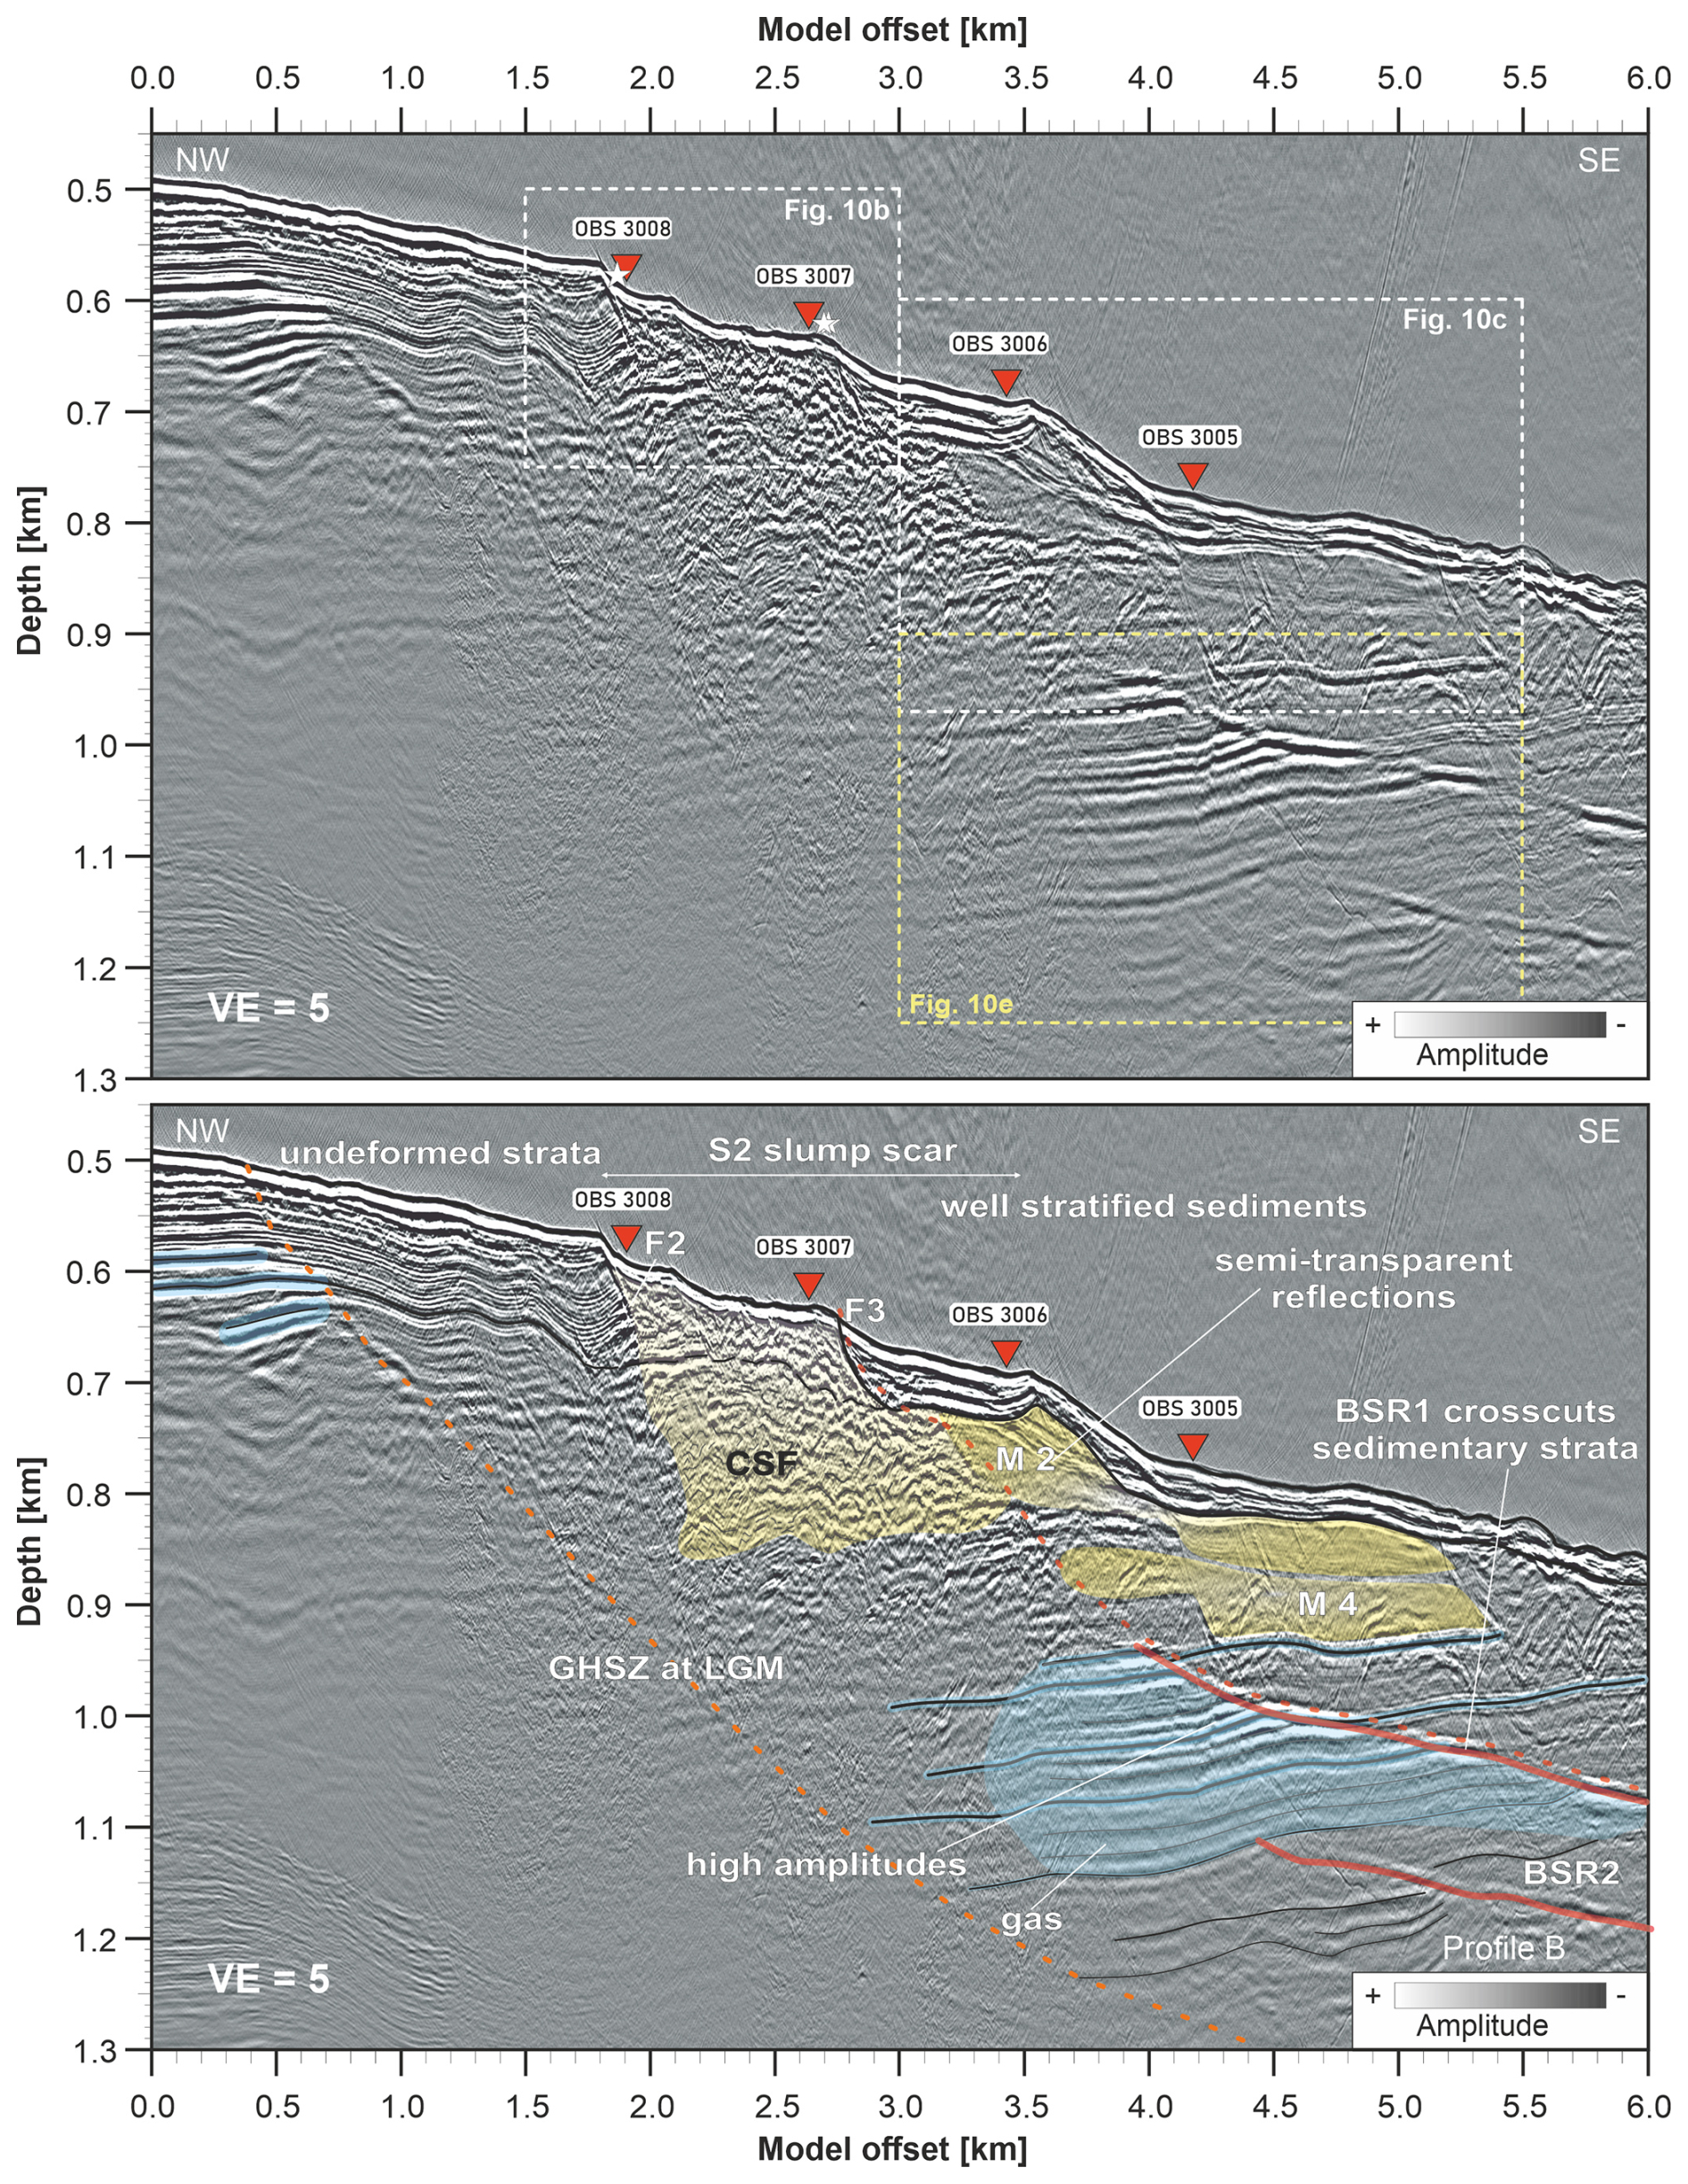
Figure 9Seismic section (upper panel) and interpretation of high-resolution MCS profile B. Gas-charged zones are highlighted in light blue, while small-scale MTDs, including M2, M3, and chaotic seismic facies (CSF2), are marked in yellow. Solid red lines indicate BSRs. The dotted red line marks the theoretical base of the present-day GHSZ, based on a bottom-water temperature of 9 °C and a geothermal gradient of 22 °C km−1. The dotted orange line shows the inferred base of the GHSZ during the Last Glacial Maximum (LGM), assuming a bottom-water temperature of 4 °C (both after Badhani, 2016). White stars indicate gas flares observed during cruise MSM-34 (Hillman et al., 2018). Boxes indicate enlarged sections shown in Fig. 10.
The chaotic seismic facies in Unit 2 (Figs. 8 and 9) is characterised by discontinuous reflections and irregular geometry. Their confinement within the slump scar suggests a local failure origin associated with the S2 slope failure event, followed by deposition of Unit 1. It is interpreted as acoustic turbidity caused by sediment deformation linked to the S2 failure or even the remnants of this event (e.g., Vanneste et al., 2014; Chand and Minshull, 2003; Judd and Hovland, 1992). Semi-transparent MTDs with polarity changes between top and reversed at the base (e.g., M2, M3 on profile B; Fig. 9) indicate vertical density contrasts due to sediment mixing during material transport (Riedel et al., 2020; Mulder and Cochonat, 1996). Together, these deposits record a repeating cycle of failure, remobilisation, and redeposition.
The downward-dipping reflector (DDR) marks a laterally continuous seismic boundary that likely reflects a contrast in lithology, compaction-state, or pore-fluid content. While its exact physical origin cannot be uniquely constrained, its continuity and position suggest a stratigraphic or diagenetic interface separating mechanically distinct sediment packages.
Underlying sediments (Unit 3) represent older levee and overbank deposits formed during active canyon sedimentation. These are dominated by fine-grained clays and silts with minor sandy interbeds (Riedel et al., 2020; Bohrmann et al., 2018). Although compaction increases velocities with depth, the P-wave values remain below normal consolidation trends (Hamilton, 1979a), confirming continued under-consolidation.
This effect is consistent with high-water-content clay-rich sediments, which exhibit low shear strength, cohesion and high compressibility (Ivanik et al., 2025; Ballas et al., 2018; Bartetzko and Kopf, 2007; Keller, 1982), making them sensitive to external forcing and pore-pressure changes (Mitchell and Soga, 2005). Mechanical contrasts between silt- and sand-rich layers generate local stress concentrations at stratigraphic interfaces due to contrasts in stiffness, compaction behaviour, and pore-pressure response, which promotes strain localisation and potential failure planes (Ivanik et al., 2025). The stratigraphic architecture, levee deposits capped by hemipelagic deposits and overprinted MTDs, generates a heterogeneous depositional environment.
Normal faults (F1–F3) mapped in the upper ∼100 m (Figs. 8 and 9) penetrate only shallow units but represent structural discontinuities that may act as local zones of mechanical weakness and potential fluid migration pathways (e.g., Hillman et al., 2018), particularly where overpressure develops. Sand-rich interbeds and chaotic facies (CSF) introduce mechanical heterogeneity, reflecting both past instability and preconditioning for future failure under stress redistribution or pore pressure changes.
Overall, the sedimentary architecture of the S2 slope area is characterised by fine-grained, under-consolidated levee and overbank deposits with intercalated MTDs and sand-rich layers. High ratios, low seismic velocities relative to normal compaction trends, and borehole-derived physical properties consistently indicate a slope system that remains mechanically weak and highly sensitive to external forcing.
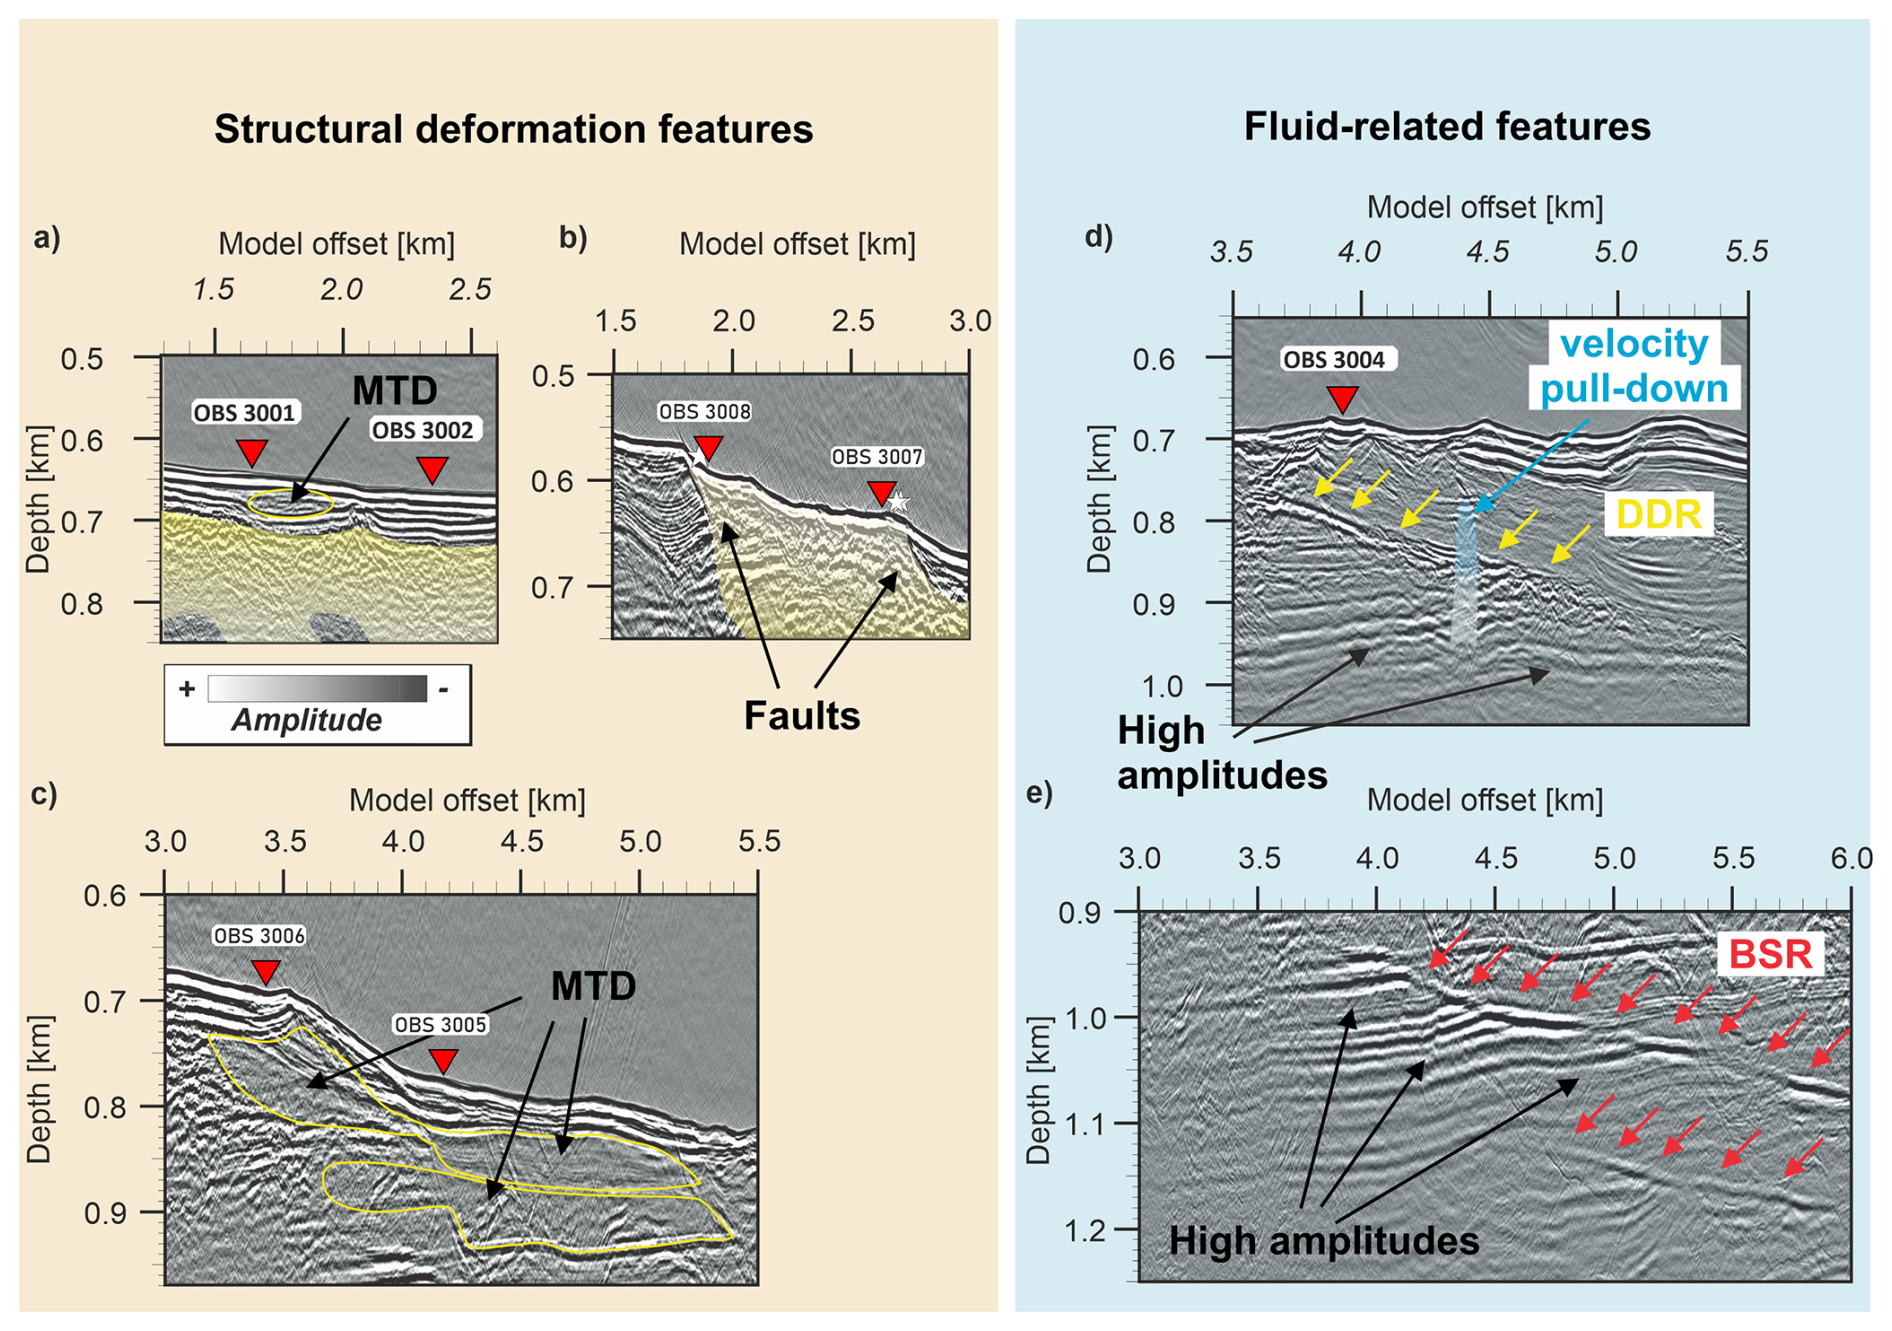
Figure 10Enlarged seismic sections highlighting key structural and fluid-related features within profiles A and B. Left panel: Structural deformation features showing (a) mass-transport deposits (MTDs) and chaotic seismic facies (CSF, yellow semi-transparent zone) from profile A; (b) faults and CSF together with observed gas-flares (Hillman et al., 2018) on profile B; and (c) MTDs along profile B. The faults are interpreted as zones of structural deformation and potential fluid pathways. Right panel: (d) Fluid-related features exhibiting the downward-dipping reflector (DDR; yellow arrows), the seismic chimney (SC, semi-transparent light blue area), and associated high-amplitude reflections beneath the DDR in profile A. The SC is marked by a velocity pull-down in the upper part of the seismic anomaly. (e) displays the bottom-simulating reflectors (BSRs; red arrows) and underlying high-amplitude anomalies in profile B. The high-amplitude reflections are interpreted as indicators for free gas accumulation. Boxes in Figs. 8 and 9 indicate the location of the enlarged sections shown here.
5.2 Gas Migration and Hydrate Dynamics
Gas migration and hydrate processes in the Danube Fan are closely linked to the fine-grained under-consolidated sedimentary architecture described above. Seismic observations reveal a dynamic interplay between free gas occurrence, focused fluid pathways, and transient gas hydrate stability.
Seismic anomalies, including polarity reversals, abrupt amplitude changes, and reflector geometries consistent with pull-down effects, indicate heterogeneity related to gas-bearing fluids. P-wave velocity variations further support the interpretation of gas-related fluid effects, with locally reduced velocities of up to ∼80–190 m s−1 in zones associated with seismic anomalies. Such reductions are consistent with the presence of low gas saturations in porous sediments, which typically reduce P-wave velocities by ∼5 %–15 % in comparable marine systems (e.g., Lee, 2008; Sava and Hardage, 2009).
Beneath OBS 3004, the MCS section shows a local downward deflection of reflections (Fig. 8), which we describe as a velocity pull-down within the seismic imaging. This reflector distortion coincides with a vertically focused zone of disrupted and low-coherency reflections in Unit 2. We refer to this combined expression as a potential seismic chimney (SC). The pull-down is primarily identified in the MCS image; its presence in the forward-modelled velocity structure is less constrained due to the limited OBS offsets, sparse instrument spacing, and the locally restricted modelling approach beneath each station. Therefore, we cannot exclude that parts of the observed distortions arise from structural complexity or imaging limitations rather than a true low-velocity fluid pathway. Nonetheless, the spatial correlation between (i) the downward-deflected reflections, (ii) the vertically disrupted reflection zone, and (iii) the previously documented local gas flares in close proximity to OBS 3004 suggests that vertical fluid migration is a plausible explanation.
If this vertical anomaly represents a focused fluid-migration structure, its characteristics would be consistent with features commonly linked to local overpressure build-up (Judd and Hovland, 2007) or hydrate dissociation (Hillman et al., 2018). Its vertical extent exceeds the present-day base of the GHSZ, which is compatible with scenarios in which upward fluid migration was facilitated by hydrate dissociation following post-glacial warming since the Last Glacial Maximum (Riedel et al., 2020, 2021). The anomaly appears to be capped by a sealing layer, potentially due to insufficient gas pressure to propagate further. However, while these processes provide plausible mechanisms, the available data do not allow to uniquely resolve the origin or evolution of the observed feature.
Alternative explanations for the observed SC and associated velocity pull-down, such as imaging artefacts, local structure complexity, or stratigraphic heterogeneity, cannot be fully excluded given the limited acquisition geometry and the inherent smoothing of the forward modelling approach. However, several observations argue against a purely artefactual origin. Seismic chimneys of comparable geometry and expression have been widely documented in the Danube Fan and adjacent Black Sea region, where they are consistently associated with fluid migration indicators such as gas flares, polarity reversals, and disrupted reflectivity patterns (Hillman et al., 2018; Nasif et al., 2020; Özel et al., 2022; Riedel et al., 2021). In addition, the vertical continuity of the anomaly and its spatial association with disturbed reflectors and amplitude anomalies are characteristics of focused fluid-flow systems rather than isolated stratigraphic features. While local stratigraphic variations or structural heterogeneities may contribute to parts of the observed signal, the integrated seismic expression is most consistent with a vertically focused fluid-migration system (e.g., Judd and Hovland, 2007).
Additional seismic anomalies include polarity-reversed reflections beneath the downward-dipping reflector (DDR), and a drop of ∼80 m s−1 in the Vp (Fig. 5a; Table S1 in Sect. S3). These polarity reversals are consistent with the presence of free gas accumulation in porous, sand-rich horizons sealed by low-permeability silts and clays (e.g., Riedel et al., 2020; Sava and Hardage, 2009). This is further supported by polarity-reversed, high-amplitude horizons on top of the S2 slope failure site that indicate previous gas charging. Such stratigraphically confined accumulations highlight the role of lithological layering and permeability contrasts in controlling gas distribution.
During cruise MSM-34, several active gas flares were detected near the faults F2 and F3, along the headwall, and the southeast sidewall, including sites only ∼40 m from OBS 3004 (Hillman et al., 2018; Bialas et al., 2014). Additional gas flares within the slump scar were revealed at water depths shallower than the predicted GHSZ (Fig. 2), and coincide with vertical fluid escape structures, such as seismic chimneys and disrupted, gas-bearing horizons (Hillman et al., 2018). Even though there is no clear seismic evidence along the profiles analysed confirming faults as active conduits, suggesting that gas escape is more likely episodic and localised similar to the situation at Hydrate Ridge off Oregon (Crutchley et al., 2013) and Formosa Ridge off Taiwan (Kunath et al., 2022). As gas accumulates in sand-rich horizons beneath low-permeability seals, the resulting gas overpressure can locally exceed hydrostatic pressure and capillary entry pressures, enabling episodic migration of gas towards shallower sediments (Løseth et al., 2009; Judd and Hovland, 2007). The microbial degradation of organic-rich sediments supplied by hemipelagic and turbiditic input is the most plausible gas source (Popescu et al., 2006; Jørgensen et al., 2004; Winguth et al., 2000). Thermogenic contributions from deeper reservoirs, common in other deltaic hydrate provinces (such as the Mississippi Fan; Madof et al., 2019; Sassen et al., 2001), are not supported within the Danube Fan (Starostenko et al., 2010). Gas hydrate dissociation could contribute to an episodic increase in gas concentrations.
BSRs with reversed polarity are present in profile B (Fig. 9) and can be interpreted as a direct indicator for the presence of gas hydrates (Boswell et al., 2016). However, their discontinuous character, combined with observed velocity reduction of up to −190 m s−1 across the upper BSR (Figs. 7 and 9, Table S2 in Sect. S3), indicates that it primarily reflects free gas beneath the base of the GHSZ rather than significant hydrate accumulation (e.g., Andreassen et al., 2003).
Recent numerical modelling studies of the Danube paleo-delta hydrate system by Gupta et al. (2024) provide valuable context for the transient and patchy nature of gas hydrate stability observed here. Their simulations highlight the sensitivity of hydrate formation and dissociation to sedimentation sequences and methane phase transition kinetics, which control the dynamic behaviour of hydrate stability in this setting. This explains the observed discontinuous and stacked BSRs, attributed to narrow windows of hydrate formation and dissociation rates that limit hydrate accumulation and promote the coexistence of free gas beneath the GHSZ. Such dynamic processes are consistent with recent modelling emphasising how sedimentation rates and methane phase transitions drive transient hydrate systems (e.g., Iemelianov et al., 2025). Together, these findings support the interpretation of a hydrate-poor but gas-active system undergoing ongoing re-equilibration since the LGM, prone to episodic venting and overpressure.
Local phase reversals at the intersection of BSRs and stratigraphic reflectors (Fig. 9) suggest that free gas may migrate into sand-rich layers. Nevertheless, the limited extent of these accumulations implies that gas overpressure is locally confined, restricting gas migration to discrete pathways rather than widespread upflow (Judd and Hovland, 2007).
The thermally derived current base of the GHSZ lies ∼ 20 m shallower than the observed BSR, suggesting a state of transient disequilibrium in the hydrate system (Burwicz-Galerne et al., 2024; Riedel et al., 2021). This discrepancy suggests that formerly trapped gas has migrated upwards, recharging shallower sediments. The transient disequilibrium state indicated by the observed BSR depth being deeper than the thermally derived GHSZ base aligns well with Gupta et al. (2024), who highlight how gas migration upward, triggered by hydrate dissociation and sediment loading, can cause dynamic fluctuations in hydrate stability and gas saturation over geological timescales. Such transient behaviour likely drives episodic gas venting and overpressure build-up observed in seismic chimneys and fluid escape features, emphasizing the system's sensitivity to recent environmental changes. The presence of multiple former BSRs preserved in the stratigraphy supports a history of dynamic hydrate re-equilibration since the LGM (Riedel et al., 2021; Grevemeyer and Villinger, 2001) or rapid deposition of levee deposits next to the channel as reported elsewhere in the Danube Fan (Zander et al., 2017).
Controlled-source electromagnetic (CSEM) and drilling results indicate very low hydrate saturations, generally close to 0 % within the GHSZ and <10 % just at the interface of the BSR (Burwicz-Galerne et al., 2024; Bialas et al., 2020a; Schwalenberg et al., 2020). Although slightly elevated P-wave velocities were observed (up to 1970 m s−1 above the BSR), the absence of corresponding Vs anomalies suggests only a small fraction of gas hydrates is present and disseminated within the sediment or patchy pore-filling (Priest et al., 2009; Yun et al., 2005). Importantly, within the resolution and uncertainties of our dataset, the lack of S-wave velocity anomalies indicates that hydrates are not acting as cementing phases at grain contacts. Instead, they occur as disseminated or patchy pore-filling accumulations that do not significantly alter bulk shear strength. This implies that hydrate presence does not directly stabilise the sediment framework, and hydrate dissociation has no intrinsic weakening effect. Rather, the impact of hydrates on slope stability in this setting is indirect, operating mainly through dissociation-driven gas release and pore-pressure increase. This form of gas hydrate distribution does not significantly alter the bulk elastic properties of the host sediment. Gas release during MeBo200 drilling near the BSR (Bohrmann et al., 2018) further indicates hydrate destabilisation at shallow levels.
Gas migration in the S2 slope of the Danube Fan is controlled by stratigraphic and structural discontinuities, with sand-rich layers acting as preferred migration pathways (Gupta et al., 2024). Vertical transport is indicated by the seismic chimney, but it cannot be determined which impact such features have due to the limited observation. Below the SC, seismic reflections remain continuous and undisturbed, suggesting that fluid migration is laterally confined and does not penetrate deeper stratigraphic levels. Free gas accumulations are locally trapped beneath low permeability seals and seem to periodically discharge through venting, while hydrate presence is minimal and dynamically re-equilibrating in response to post-glacial conditional changes. Despite the presence of BSRs with reversed polarity, their discontinuous nature and limited hydrate saturation (<10 %) suggest a predominantly hydrate-poor system where free gas accumulates beneath the base of the GHSZ in porous sand horizons sealed by low-permeability layers. This hydrate-poor but gas-active environment promotes localised overpressure and episodic venting, contributing to slope instability and complex methane migration pathways within the Danube Fan.
5.3 Geohazard and Slope Instability
The combination of under-consolidated sediments, focused gas migration, and weak mechanical layering creates a slope system prone to failure in the Danube Fan. Results from the OBS-MCS integrated analysis, MeBo200 drilling, and core analysis support this assumption.
The S2 slope failure zone is bounded by a prominent horse-shoe shaped headwall (Fig. 2), documenting a major mass-wasting event (Hillman et al., 2018). Within this zone, chaotic seismic facies and multiple MTDs record past slope failure episodes (Riedel et al., 2020; Vanneste et al., 2014). Although shallow faults (F1–F3) only penetrate the upper ∼100 m, they represent structural weaknesses that may act as local failure initiation points, particularly where overpressured gas or fluids accumulate (Hillman et al., 2018).
Potential triggers include (1) rapid sedimentation loading during phases of canyon activity, (2) earthquakes, (3) overpressure development through gas charging and hydrate dissociation, and (4) reduction in effective stress due to excess pore pressure in clays and silts (Gupta et al., 2024; Urlaub et al., 2013; Mitchell and Soga, 2005). These triggers range from gradual preconditioning by under-consolidation to episodic external forcing. The role of gas hydrate dissociation in promoting localized overpressure and slope instability has been increasingly recognized in recent numerical and thermodynamic models (Iemelianov et al., 2025). Our integrated seismic and drilling evidence supports this mechanism as a key driver in weakening the under-consolidated sedimentary sequence, thereby enhancing slope failure susceptibility.
Seismic velocity profiles consistently show lower-than-expected P-wave velocities compared to normally consolidated reference curves (Hamilton, 1979a), underscoring prevailing under-consolidation throughout Units 1–3. This condition is confirmed by drilling, which revealed high porosities and clay-rich levee deposits with low undrained shear strength (Riedel et al., 2020; Bohrmann et al., 2018). Such sediments are prone to strength reduction upon external forcing (Gupta et al., 2024; Ballas et al., 2018; Keller, 1982), amplifying slope failure instability.
Localised free gas accumulations, as evidenced by polarity reversals and velocity pull-downs (Riedel et al., 2020; Sava and Hardage, 2009), further contribute to elevated pore pressures. Chimneys and disrupted horizons demonstrate focused zones of fluid migration, redistributing overpressure vertically and laterally across the slope area (Løseth et al., 2009; Judd and Hovland, 2007). Overpressure conditions in such weak sediments reduce the effective stress and can lead to failure propagation across mechanically layered sequences.
Integrated OBS-MCS seismic data and MeBo200 ground-truth data provide complementary evidence for slope instability. OBS results show shallow velocity anomalies associated with chimneys and DDR-related gas accumulations, while cores confirm the presence of mousse-like, homogeneous silty clays in chaotic facies (Riedel et al., 2020; Bohrmann et al., 2018). These deposits lack internal layering and exhibit reduced shear strength, consistent with mass-transport deposits and disturbed slope material. This suggests that localised material and porosity contrasts, rather than gas accumulations, are the key factors regarding slope stability. Together, these data point to a slope system, where stress redistribution and under-consolidation are critical factors controlling failure dynamics.
The geohazard potential of the S2 slope is high, based on the combined effects of (1) weak, under-consolidated clays and silts; (2) stratigraphic discontinuities and shallow faults acting as planes of weakness; and (3) localised overpressure from gas accumulation and hydrate disequilibrium. These conditions suggest that even moderate external triggers, such as sediment loading or regional seismicity, may be sufficient to induce slope failure.
5.4 Comparative Fluid Systems in Continental Margin Fans
Deltaic deep-water fan systems elsewhere show closely comparable controls on under-consolidation and mechanical weakness. The Danube Fan is situated on a passive continental margin of the northwestern Black Sea (Fig. 1), shaped by Pleistocene fluvial influx and hemipelagic sedimentation under a tectonically quiescent regime, with no evidence of significant deformation (Popescu et al., 2001; Winguth et al., 2000). Gas-migration indicators and hydrate behaviour in other systems place the Danube Fan as an endmember case.
The Amazonas Fan, also on a passive margin, is driven by massive sediment supply from the Amazon River, producing thick channel–levee complexes and frequent MTDs (Maslin, 2009; Cobbold et al., 2004). Fine-grained levee deposits (mostly silts and clays) promote under-consolidation and reduced shear strength (Ketzer et al., 2018), while continuous discharge and channel migration generate lithologic heterogeneity and local instability (Souza et al., 2025; Maslin, 2009; Audet, 1998; Flood et al., 1991). Thermogenic-derived hydrocarbons increase the fluid overpressure (Cobbold et al., 2004). BSRs, chimney structures, and widespread venting from within the GHSZ show an active hydrate-free-gas system and transient hydrate stability, with direct hydrate recoveries reported (Praeg et al., 2022; Ketzer et al., 2018). Fault-controlled gas migration forms gas-charged zones with low seismic velocity and acoustic wipeouts, which correspond to weak layers (Ketzer et al., 2018). Gas hydrate concentrations can strengthen the levee deposits initially (e.g., Priest et al., 2009; Yun et al., 2005). Evidence for gas hydrates within the GHSZ is largely inferred from cores presenting different gas hydrate distributions at vent-proximal sites and levee settings (Ketzer et al., 2018). While at vent-proximal sites, nodular to massive types occur, gas hydrates within the levee deposits are rather disseminated, pointing to low-concentrations (Ketzer et al., 2018). But the dissociation of these low concentrated gas hydrates can reduce the shear strength and raises the pore pressure within these deposits, destabilising slopes (Praeg et al., 2022; Ketzer et al., 2018). Those zones are commonly associated with MTDs, indicating past slope failures. The combined effects of hydrate dissociation, pore pressure buildup, and gas-related weakening make the Amazonas Fan particularly prone to submarine landslides, even on gentle slopes.
The Krishna-Godavari Basin is located on a rifted passive margin, where Early Cretaceous rifting superimposed on older Gondwana-age graben systems created a horst-graben architecture (Radhakrishna et al., 2012; Rao, 2001). Thick, rapidly deposited sediments form sand-rich channel-levee deposits embedded in a mud-rich surrounding (Collett et al., 2008, 2019; Kumar et al., 2014). Rapid sediment accumulation and limited dewatering lead to low shear strength and localised overpressure zones, especially in the graben structures (Collett et al., 2019; Chatterjee et al., 2011; Riedel et al., 2010). Inside the Krishna-Godavari Basin, occasionally gas hydrates occur as fracture-filling hydrates in clay-silt-rich sections (Collett et al., 2014), but predominantly as laterally extensive, sand-hosted, pore-filling systems within the GHSZ (Collett et al., 2019). Inside the sandy levee deposits the gas hydrate concentration is locally very high (>50 %, occasionally ∼80 %), with free gas accumulations beneath (Collett et al., 2008, 2019; Riedel et al., 2010). These conditions create strong contrasts between the hydrate-bearing sands and the weak surrounding mud, enhancing slope failure potential. Large-scale slope failures, including an ∼11 km3 event, confirm the high geohazard risk (Dewangan et al., 2025). Together, these factors make the Krishna-Godavari Basin a geohazard-prone margin where sediment instability is closely linked to complex structural settings, rapid sedimentation, and dynamic gas hydrate systems.
The Mississippi Fan, located in the Gulf of Mexico, is strongly influenced by salt tectonics; evaporites deform extensively to form salt diapirs and structural pathways (Boswell et al., 2012; Sassen et al., 2001). The fan lobes are the major structural elements within the fan system (Twichell, 2009). They comprise a sandy channel base, silty-clayey overbanks, sheeted sands, with repeated levee failures linked to fluid migration and undrained loading of low-permeability muds (Damuth and Olson, 2015; Twichell, 2009; Weimer, 1990). The Gulf of Mexico Gas Hydrate Joint Industry Project (JIP) Leg II confirmed high-saturation pore-filling hydrates in thin-bedded to stacked turbidite sands (e.g., Haines et al., 2017). The hydrate saturations are locally up to ∼80 % of the pore space near the base of the GHSZ and are sourced largely by deep thermogenic systems and focused along salt-related faults (Madof et al., 2019; Boswell et al., 2012). In adjacent clay-rich sections, gas hydrates occur primarily as fracture-fill, mostly veins, rather than pore-filling (Lee and Collett, 2012). Dissociation or free-gas build-up beneath sealing layers can reduce effective stress reduction and destabilise slopes (e.g., Madof et al., 2019). These factors make the Mississippi Fan a complex and potentially unstable system where salt tectonics, fluid migration, and high-saturation gas hydrates significantly influence slope stability.
Taken together, these systems define a spectrum of hydrate–slope interactions. The Amazonas, Krishna–Godavari, and Mississippi fans are hydrate-rich, with sand-prone channel–levees and structural pathways concentrating fluids and free gas. In these settings, hydrate formation may initially enhance sediment strength, but dissociation typically drives pore-pressure build-up and slope failure. Among them, the Amazonas Fan is the most prone to instability due to widespread hydrates, free gas, and fault-focused migration. The Krishna–Godavari Basin follows, where rift-related structures, rapid sedimentation, and hydrate-bearing sands interact to produce frequent failures. The Mississippi Fan occupies an intermediate position, with high-saturation hydrates in turbidite sands and salt-related pathways that localise overpressure and slope instability.
In contrast to these, the Danube Fan represents a hydrate-poor but gas-active endmember. Fine-grained, low-permeability levee and lobe sediments host patchy, low-saturation disseminated hydrates and shallow free-gas accumulations beneath BSR-like horizons. Here, instability is governed primarily by under-consolidation and localised gas overpressure, with hydrates exerting a secondary influence. This highlights a distinct geohazard mode in which weak mud-dominated strata and diffuse gas charging control slope failure, rather than hydrate dissociation.
In summary, the comparison underscores that while hydrate-rich systems such as the Amazonas, Krishna–Godavari, and Mississippi fans face slope instability largely through hydrate dissociation and focused fluid migration, the Danube Fan demonstrates how slope failure can arise in hydrate-poor but gas-active margins. Across all systems, the hazard mechanism, weak layers, excess pore pressure, and external triggers remain globally consistent, but the balance between hydrates, gas flux, and sediment properties dictates local failure behaviour and geohazard potential.
This study integrates high-resolution OBS-MCS seismic imaging with drilling and coring data to investigate sedimentary processes, fluid dynamics, and slope stability in the Danube Fan, northwestern Black Sea. The results demonstrate how weak sediment properties, localised fluid migration, and transient hydrate systems interact and affect the slope architecture and geohazard potential.
First, the S2 slope is dominated by rapidly deposited, under-consolidated mud-rich sequences that retain excess pore pressure due to incomplete dewatering. Elevated ratios, low shear strength, and recurrent MTDs highlight how weak and heterogeneous layers precondition the slope to repeated failure.
Second, gas migration and hydrate behaviour exert a critical but have a secondary influence. Seismic anomalies, including chimneys, polarity reversals, and velocity pull-downs, reveal focused pathways for free gas, while hydrate occurrences are sparse, discontinuous, and low in saturation. Disequilibrium between observed BSRs and the predicted base of the GHSZ suggests a system still adjusting to post-glacial boundary conditions. In this hydrate-poor but gas-active margin, slope instability is governed more by gas overpressure within weak muds than by hydrate dissociation.
Third, the geohazard potential of the Danube Fan arises from the combined effects of under-consolidation, structural discontinuities, and localised overpressure. Within the resolution of our dataset, the lack of S-wave velocity anomalies indicates that hydrates do not act as cementing phases at grain contacts. Instead, they occur as sparse, patchy pore-filling accumulations that do not significantly alter bulk shear strength. Even moderate external triggers, sediment loading, earthquake events, or minor hydrate destabilization can initiate slope failure, underscoring the sensitivity of this margin.
Placed in a global context, the Danube Fan defines one end of a spectrum of hydrate–slope interactions. Hydrate-rich systems such as the Amazonas, Mississippi, and Krishna–Godavari fans are dominated by sand-hosted pore-filling hydrates and fracture-related accumulations that destabilise upon dissociation. By contrast, the Danube Fan is characterised by fine-grained lithologies, low-saturation disseminated hydrates, and diffuse microbial gas charging. Instability here reflects weak mud-dominated strata and gas overpressure rather than hydrate dissociation.
In conclusion, the Danube Fan exemplifies how sedimentary architecture, gas migration, and hydrate disequilibrium jointly govern slope stability in delta-fed margins. As a hydrate-poor but gas-active endmember, it advances understanding of Black Sea geohazards and provides a critical analogue for other under-consolidated, fine-grained continental margins in the early stages of hydrate system development.
The high-resolution MCS seismic profiles collected during MSM-34 within the SUGAR project framework (https://doi.org/10.3289/geomar_rep_ns_15_2014, Bialas et al., 2014) are available from PANGAEA (https://doi.org/10.1594/PANGAEA.921631, Bialas et al., 2020b; https://doi.org/10.1594/PANGAEA.921576, Bialas and Riedel, 2020). The seismic lines were analysed and interpreted with IHS Kingdom software. The corresponding OBS data are available from PANGAEA (https://doi.org/10.1594/PANGAEA.987011, Dannowski and Bialas, 2025). To identify the traveltimes derive the forward velocity model, the software packages PASTEUP (https://www.jamstec.go.jp/obsmcs_db/e/software.html) and MODELING (https://www.jamstec.go.jp/obsmcs_db/e/software.html) (Fujie, 2008b, a; Fujie et al., 2008) were used. The software is licensed under the GNU General Public Licence Version 2 and is available at https://www.jamstec.go.jp/obsmcs_db/e/software.html (last access: 6 April 2024).
The bathymetric data were also acquired during MSM-34 cruise and are available from PANGAEA (https://doi.org/10.1594/PANGAEA.860486, Wintersteller and Bialas, 2016). Further, the facility of the National Oceanic and Atmospheric Administration's National Centers (NOAA) was used for access to ETOPO-1 bathymetric data and related metadata from the northwestern Black Sea (Amante and Eakins, 2009). The NOAA's bathymetric data are licensed under the Creative Commons CC0 license or CC BY 4.0 license. Maps and figures were created through Generic Mapping Tools (GMT) version 6 (Wessel et al., 2019a; https://doi.org/10.5281/ZENODO.3407866, Wessel et al., 2019b) licensed under LGPL version 3 or later, available at https://www.genericmapping-tools.org/ (last access: 14 February 2024). Figures were reworked or created with Corel Draw Graphic Suite 2019.
The gas hydrate samples collected during the GHASS (Gas Hydrates, fluid Activities, and Sediment deformation in the western Black Sea) cruise are attributed to Ker and Riboulot (2015). The observed gas flares within the water column in the S2 slope failure zone are adapted from Hillman et al. (2018) and the MeBo200 drill sites are attributed to Riedel et al. (2020). Further, the estimated upper GHSZ boundary is adapted from Zander et al. (2017) and Riedel et al. (2020).
The supplement related to this article is available online at https://doi.org/10.5194/se-17-923-2026-supplement.
HSH: conceptualization, formal analysis, methodology, validation, visualization, writing – original draft, writing – review and editing; AD: conceptualization, formal analysis, investigation, methodology, supervision, validation, writing – review and editing; JB: conceptualization, funding acquisition, investigation, methodology, project administration, resources, supervision, validation, visualization, writing – review and editing; FG: formal analysis, investigation, methodology, writing – review and editing; JH: formal analysis, investigation, methodology, writing – review and editing; DK: formal analysis, methodology, validation, writing – review and editing; CB: conceptualization, validation, methodology, resources, supervision, writing – review and editing.
The contact author has declared that none of the authors has any competing interests.
Publisher's note: Copernicus Publications remains neutral with regard to jurisdictional claims made in the text, published maps, institutional affiliations, or any other geographical representation in this paper. The authors bear the ultimate responsibility for providing appropriate place names. Views expressed in the text are those of the authors and do not necessarily reflect the views of the publisher.
We thank captain and crew of R/V MARIA S MERIAN as well as the scientific cruise participants and the GEOMAR lab technicians who provided excellent support during cruises MSM 34, enabling the data acquisition. The authors are grateful to Michael Riedel for constructive, detailed, and interesting comments on this topic and region, as well as his suggestions for improvement.
The authors would like to thank Leon Thomsen and the anonymous reviewer for their time as well as their thoughtful and constructive comments, which substantially improved the manuscript and enhanced its overall quality. We also sincerely thank the Editor, Kei Ogata, and the Editorial Team for their understanding, patience and support throughout the editorial process.
Data acquisition during R/V MARIA S MERIAN's cruise MSM 34 was funded by the projects SUGAR and MIDAS. The SUGAR project has received funds from the German Ministry of Education and Research (grant nos. 03G0819A, 03G0856A) and Federal Ministry of Economy and Energy (grant no. 03SX320A). MIDAS was funded through the European Union Seventh Framework Program (grant no. 603418). Shiptime was provided through the German Science Foundation (DFG).
The article processing charges for this open-access publication were covered by the GEOMAR Helmholtz Centre for Ocean Research Kiel.
This paper was edited by Kei Ogata and reviewed by Leon Thomsen and one anonymous referee.
Amante, C. and Eakins, B. W.: ETOPO1 1 Arc-Minute Global Relief Model: Procedures, Data Sources and Analysis [data set], https://doi.org/10.7289/V5C8276M, 2009.
Andreassen, K., Berteussen, Karl. A., Sognnes, H., Henneberg, K., Langhammer, J., and Mienert, J.: Multicomponent ocean bottom cable data in gas hydrate investigation offshore of Norway, J. Geophys. Res., 108, 2399, https://doi.org/10.1029/2002JB002245, 2003.
Audet, M. D.: Mechanical properties of terrigenous muds from levee systems on the Amazon Fan, SP, 129, 133–144, https://doi.org/10.1144/GSL.SP.1998.129.01.09, 1998.
Badhani, S.: Slope failure and gas hydrate dissociation in the Danube deep-sea fan, NW Black Sea, Master's Thesis, Christian-Albrechts-Universität zu Kiel, GEOMAR Helmholtz-Centre For Ocean Research Kiel, 88 pp., 2016.
Bai, C., Hu, G., Zhang, Y., and Li, Z.: Seismic wavefield propagation in 2D anisotropic media: Ray theory versus wave-equation simulation, J. Appl. Geophys., 104, 163–171, https://doi.org/10.1016/j.jappgeo.2014.02.022, 2014.
Ballas, G., Garziglia, S., Sultan, N., Pelleter, E., Toucanne, S., Marsset, T., Riboulot, V., and Ker, S.: Influence of early diagenesis on geotechnical properties of clay sediments (Romania, Black Sea), Eng. Geol., 240, 175–188, https://doi.org/10.1016/j.enggeo.2018.04.019, 2018.
Bartetzko, A. and Kopf, A. J.: The relationship of undrained shear strength and porosity with depth in shallow (<50 m) marine sediments, Sediment. Geol., 196, 235–249, https://doi.org/10.1016/j.sedgeo.2006.04.005, 2007.
Bialas, J. and Flueh, E. R.: Ocean bottom seismometers: New instrument packages demonstrates value of recording full wavefield; shows that interpretations of sediment shear wave velocities are reliable, Sea Technol., 40, 41–46, 1999.
Bialas, J. and Riedel, M.: 2D multichannel seismic profiles during Maria S. Merian cruise MSM34, Black Sea, PANGAEA [data set], https://doi.org/10.1594/PANGAEA.921576, 2020.
Bialas, J., Klaucke, I., and Haeckel, M.: FS MARIA S. MERIAN Fahrtbericht / Cruise Report MSM34/1 & 2 – SUGAR Site; Varna – Varna, 06.12.13 – 16.01.14, GEOMAR Helmholtz-Zentrum für Ozeanforschung Kiel [data set], https://doi.org/10.3289/geomar_rep_ns_15_2014, 2014.
Bialas, J., Bohlen, T., Dannowski, A., Eisenberg-Klein, G., Gassner, L., Gehrmann, R., Heeschen, K., Hölz, S., Jegen, M., Klaucke, I., Krieger, M., Mann, J., Müller, C., Prüßmann, J., Schicks, J., Schünemann, E., Schwalenberg, K., Sommer, M., Smilde, P. L., Spangenberg, E., Trappe, H., and Zander, T.: Joint interpretation of geophysical field experiments in the danube deep-sea fan, Black Sea, Mar. Petrol. Geol., 104551, https://doi.org/10.1016/j.marpetgeo.2020.104551, 2020a.
Bialas, J., Papenberg, C., and Riedel, M.: 3D P-cable seismic data during Maria S. Merian cruise MSM34, Black Sea, PANGAEA [data set], https://doi.org/10.1594/PANGAEA.921631, 2020b.
Bohrmann, G., Ahrlich, F., Bachmann, K., Bergenthal, M., Beims, M., Betzler, C., Brünjes, J., Deusner, C., Domeyer, B., Düßmann, R., Ewert, J., Gaide, S., Frank, C., Freudenthal, T., Fröhlich, S., Greindl, T., Haeckel, M., Heitmann-Bacza, C., Ion, G., Kaszemeik, K., Keil, H., Kinski, O., Klein, T., Kossel, E., Linowski, E., Malnati, J., Mau, S., Meyer, B., Pape, T., Popa, A., Renken, J., Reuter, J., Reuter, M., Riedel, M., Riemer, P., Rohleder, C., Rosiak, U., Rotaru, S.-G., Rothenwänder, T., Stachowski, A., Schmidt, W., Seiter, C., Utecht, C., Vasilev, A., Wallmann, K., Wegwert, A., Wintersteller, P., and Wunsch, D.: Short cruise report R/V Meteor cruise report M142 – Drilling Gas Hydrates in the Danube Deep-Sea Fan, Black Sea, Varna – Varna, 4 November–9 December 2017, MARUM Universität Bremen, 2018.
Boswell, R., Collett, T. S., Frye, M., Shedd, W., McConnell, D. R., and Shelander, D.: Subsurface gas hydrates in the northern Gulf of Mexico, Mar. Petrol. Geol., 34, 4–30, https://doi.org/10.1016/j.marpetgeo.2011.10.003, 2012.
Boswell, R., Shipp, C., Reichel, T., Shelander, D., Saeki, T., Frye, M., Shedd, W., Collett, T. S., and McConnell, D. R.: Prospecting for marine gas hydrate resources, Interpretation, 4, SA13–SA24, https://doi.org/10.1190/INT-2015-0036.1, 2016.
Bünz, S., Mienert, J., Vanneste, M., and Andreassen, K.: Gas hydrates at the Storegga Slide: Constraints from an analysis of multicomponent, wide-angle seismic data, Geophysics, 70, B19–B34, https://doi.org/10.1190/1.2073887, 2005.
Burwicz-Galerne, E., Haeckel, M., Hensen, C., Samant, R., and Wallmann, K.: The gas hydrate system of the western Black Sea Basin, Mar. Petrol. Geol., 168, 107026, https://doi.org/10.1016/j.marpetgeo.2024.107026, 2024.
Caress, D. W., Thomas, H., Kirkwood, W. J., McEwen, R., Henthorn, R., Clague, D. A., Paull, C. K., and Paduan, J.: High-resolution multibeam, sidescan, and subbottom surveys using the MBARI AUV D. Allan B., in: Marine Habitat Mapping Technology for Alaska, edited by: Reynolds, J. R. and Greene, H. G., Alaska Sea Grant College Program, University of Alaska Fairbanks, 47–69, https://doi.org/10.4027/mhmta.2008.04, 2008.
Chand, S. and Minshull, T. A.: Seismic constraints on the effects of gas hydrate on sediment physical properties and fluid flow: a review, Geofluids, 3, 275–289, https://doi.org/10.1046/j.1468-8123.2003.00067.x, 2003.
Chatterjee, R., Mukhopadhyay, M., and Paul, S.: Overpressure zone under the Krishna–Godavari offshore basin: geophysical implications for natural hazard in deeper-water drilling, Nat. Hazards, 57, 121–132, https://doi.org/10.1007/s11069-010-9659-6, 2011.
Cobbold, P. R., Mourgues, R., and Boyd, K.: Mechanism of thin-skinned detachment in the Amazon Fan: assessing the importance of fluid overpressure and hydrocarbon generation, Mar. Petrol. Geol., 21, 1013–1025, https://doi.org/10.1016/j.marpetgeo.2004.05.003, 2004.
Collett, T., Riedel, M., Cochran, J. R., Boswell, R., Kumar, P., and Sathe, A. V.: Indian Continental Margin Gas Hydrate Prospects: Results of the Indian National Gas Hydrate Program (NGHP) Expedition 01, in: Proceedings of the 6th International Conference on Gas Hydrates (ICGH 2008), Columbia University Academic Commons, https://doi.org/10.7916/D8-NF9W-CZ91, 2008.
Collett, T. S., Boswell, R., Cochran, J. R., Kumar, P., Lall, M., Mazumdar, A., Ramana, M. V., Ramprasad, T., Riedel, M., Sain, K., Sathe, A. V., and Vishwanath, K.: Geologic implications of gas hydrates in the offshore of India: Results of the National Gas Hydrate Program Expedition 01, Mar. Petrol. Geol., 58, 3–28, https://doi.org/10.1016/j.marpetgeo.2014.07.021, 2014.
Collett, T. S., Boswell, R., Waite, W. F., Kumar, P., Roy, S. K., Chopra, K., Singh, S. K., Yamada, Y., Tenma, N., Pohlman, J., and Zyrianova, M.: India National Gas Hydrate Program Expedition 02 Summary of Scientific Results: Gas hydrate systems along the eastern continental margin of India, Mar. Petrol. Geol., 108, 39–142, https://doi.org/10.1016/j.marpetgeo.2019.05.023, 2019.
Crutchley, G. J., Berndt, C., Geiger, S., Klaeschen, D., Papenberg, C., Klaucke, I., Hornbach, M. J., Bangs, N. L. B., and Maier, C.: Drivers of focused fluid flow and methane seepage at south Hydrate Ridge, offshore Oregon, USA, Geology, 41, 551–554, https://doi.org/10.1130/G34057.1, 2013.
Damuth, J. E. and Olson, H. C.: Latest Quaternary sedimentation in the northern Gulf of Mexico Intraslope Basin Province: I. Sediment facies and depositional processes, Geosphere, 11, 1689–1718, https://doi.org/10.1130/GES01090.1, 2015.
Dannowski, A. and Bialas, J.: Seismic processed data (Ocean Bottom Seismometer working area dataset, profiles p4102 and p4103) during RV MARIA S. MERIAN cruise MSM34/2, Black Sea, PANGAEA [data set], https://doi.org/10.1594/PANGAEA.987011, 2025.
Dannowski, A., Bialas, J., Zander, T., Klaeschen, D., and Koch, S.: High resolution shear wave modelling of OBS data in a gas hydrate environment in the Danube deep-sea fan, Black Sea, poster presented at the 41st CIESM Congress 2016, 12–16 September 2016, Kiel, Germany, 2016.
Deuser, W. G.: Evolution of Anoxic Conditions in Black Sea during Holocene, in: The Black Sea - Geology, Chemistry, and Biology, vol. 20, edited by: Degens, E. T. and Ross, D. A., American Association of Petroleum Geologists, Tulsa, Oklahoma, 133–136, 1974.
Dewangan, P., Sriram, G., Mahale, V. P., and Gaddam, V. K.: A recent catastrophic submarine slope failure in the Krishna-Godavari basin, Bay of Bengal, India, Landslides, 22, 537–550, https://doi.org/10.1007/s10346-024-02359-w, 2025.
Diehl, T.: 3-D Seismic Velocity Models of the Alpine Crust from Local Earthquake Tomography, Dissertation, ETH Zürich, Zürich, 189 pp., 2008.
Digranes, P., Mjelde, R., Kodaira, S., Shimamura, H., Kanazawa, T., Shiobara, H., and Berg, E. W.: A regional shear-wave velocity model in the central Vøring Basin, N. Norway, using three-component Ocean Bottom Seismographs, Tectonophysics, 293, 157–174, https://doi.org/10.1016/S0040-1951(98)00093-6, 1998.
Duennebier, F. K. and Sutton, G. H.: Fidelity of ocean bottom seismic observations, Mar. Geophys. Res., 17, 535–555, https://doi.org/10.1007/BF01204343, 1995.
Essing, D., Schlindwein, V., Schmidt-Aursch, M. C., Hadziioannou, C., and Stähler, S. C.: Characteristics of Current-Induced Harmonic Tremor Signals in Ocean-Bottom Seismometer Records, Seismol. Res. Lett., 92, 3100–3112, https://doi.org/10.1785/0220200397, 2021.
Exley, R. J. K., Westbrook, G. K., Haacke, R. R., and Peacock, S.: Detection of seismic anisotropy using ocean bottom seismometers: a case study from the northern headwall of the Storegga Slide: Detecting seismic anisotropy using OBS, Geophys. J. Int., 183, 188–210, https://doi.org/10.1111/j.1365-246X.2010.04730.x, 2010.
Flood, R. D., Manley, P. L., Kowsmann, R. O., Appi, C. J., and Pirmez, C.: Seismic Facies and Late Quaternary Growth of Amazon Submarine Fan, in: Seismic Facies and Sedimentary Processes of Submarine Fans and Turbidite Systems, edited by: Weimer, P. and Link, M. H., Springer New York, New York, NY, 415–433, https://doi.org/10.1007/978-1-4684-8276-8_23, 1991.
Fujie, G.: MODELING, JAMSTEC Seismic Survey Data Base, Japan Agency for Marine-Earth Science and Technology (JAMSTEC), https://www.jamstec.go.jp/obsmcs_db/e/software.html (last access: 6 April 2024), 2008a.
Fujie, G.: PASTEUP, JAMSTEC Seismic Survey Data Base, Japan Agency for Marine-Earth Science and Technology (JAMSTEC), https://www.jamstec.go.jp/obsmcs_db/e/software.html (last access: 6 April 2024), 2008b.
Fujie, G., Kasahara, J., Murase, K., Mochizuki, K., and Kaneda, Y.: Interactive analysis tools for the wide-angle seismic data for crustal structure study (Technical Report), Explor. Geophys., 39, 26–33, https://doi.org/10.1071/EG08006, 2008.
Grevemeyer, I. and Villinger, H.: Gas hydrate stability and the assessment of heat flow through continental margins, Geophys. J. Int., 145, 647–660, https://doi.org/10.1046/j.0956-540x.2001.01404.x, 2001.
Gupta, S., Deusner, C., Burwicz-Galerne, E., and Haeckel, M.: Numerical analysis of the dynamic gas hydrate system and multiple BSRs in the Danube paleo-delta, Black Sea, Mar. Geol., 469, 107221, https://doi.org/10.1016/j.margeo.2024.107221, 2024.
Haines, S. S., Hart, P. E., Collett, T. S., Shedd, W., Frye, M., Weimer, P., and Boswell, R.: High-resolution seismic characterization of the gas and gas hydrate system at Green Canyon 955, Gulf of Mexico, USA, Mar. Petrol. Geol., 82, 220–237, https://doi.org/10.1016/j.marpetgeo.2017.01.029, 2017.
Hamilton, E. L.: Sound velocity gradients in marine sediments, J. Acoust. Soc. Am., 65, 909–922, https://doi.org/10.1121/1.382594, 1979a.
Hamilton, E. L.: and Poisson's ratios in marine sediments and rocks, J. Acoust. Soc. Am., 66, 1093–1101, https://doi.org/10.1121/1.383344, 1979b.
Hillman, J. I. T., Klaucke, I., Bialas, J., Feldman, H., Drexler, T., Awwiller, D., Atgin, O., Çifçi, G., and Badhani, S.: Gas migration pathways and slope failures in the Danube Fan, Black Sea, Mar. Petrol. Geol., 92, 1069–1084, https://doi.org/10.1016/j.marpetgeo.2018.03.025, 2018.
Iemelianov, V., Ivanik, O., Kukovska, T., Fedoronchuk, N., Shuraiev, I., Petrushenko, E., and Hadiatska, K.: Modeling and forecast of gas hydrate distribution in the Black Sea: main principles and approaches, Front. Earth Sci., 13, 1518758, https://doi.org/10.3389/feart.2025.1518758, 2025.
Ivanik, O., Iemelianov, V., Kukovska, T., Fedoronchuk, N., and Hadiatska, K.: Submarine landslides and assessment of slope stability in gas hydrate zones, Black Sea region, 18th International Conference Monitoring of Geological Processes and Ecological Condition of the Environment, Kyiv, Ukraine, 1–5, https://doi.org/10.3997/2214-4609.2025510126, 2025.
Jørgensen, B. B., Böttcher, M. E., Lüschen, H., Neretin, L. N., and Volkov, I. I.: Anaerobic methane oxidation and a deep H2S sink generate isotopically heavy sulfides in Black Sea sediments, Geochim. Cosmochim. Ac., 68, 2095–2118, https://doi.org/10.1016/j.gca.2003.07.017, 2004.
Judd, A. G. and Hovland, M.: The evidence of shallow gas in marine sediments, Cont. Shelf Res., 12, 1081–1095, https://doi.org/10.1016/0278-4343(92)90070-Z, 1992.
Judd, A. G. and Hovland, M.: Seabed Fluid Flow: The Impact on Geology, Biology and the Marine Environment, Cambridge University Press, Cambridge, New York, 475 pp., https://doi.org/10.1017/CBO9780511535918, 2007.
Keller, G. H.: Organic matter and the geotechnical properties of submarine sediments, Geo-Mar. Lett., 2, 191–198, https://doi.org/10.1007/BF02462762, 1982.
Ker, S. and Riboulot, V.: GHASS cruise report, Ifremer, https://doi.org/10.17600/15000500, 2015.
Ketzer, J. M., Augustin, A., Rodrigues, L. F., Oliveira, R., Praeg, D., Pivel, M. A. G., Dos Reis, A. T., Silva, C., and Leonel, B.: Gas seeps and gas hydrates in the Amazon deep-sea fan, Geo-Mar. Lett., 38, 429–438, https://doi.org/10.1007/s00367-018-0546-6, 2018.
Kumar, P., Collett, T. S., Boswell, R., Cochran, J. R., Lall, M., Mazumdar, A., Ramana, M. V., Ramprasad, T., Riedel, M., Sain, K., Sathe, A. V., Vishwanath, K., and Yadav, U. S.: Geologic implications of gas hydrates in the offshore of India: Krishna–Godavari Basin, Mahanadi Basin, Andaman Sea, Kerala–Konkan Basin, Mar. Petrol. Geol., 58, 29–98, https://doi.org/10.1016/j.marpetgeo.2014.07.031, 2014.
Kunath, P., Crutchley, G., Chi, W., Berndt, C., Liu, C., Elger, J., Klaeschen, D., and Bohrmann, G.: Episodic Venting of a Submarine Gas Seep on Geological Time Scales: Formosa Ridge, Northern South China Sea, J. Geophys. Res.-Sol. Ea., 127, e2022JB024668, https://doi.org/10.1029/2022JB024668, 2022.
Lee, M. W.: Models for gas hydrate-bearing sediments inferred from hydraulic permeability and elastic velocities, 1st edn., U.S. Geological Survey, https://doi.org/10.3133/sir20085219, 2008.
Lee, M. W. and Collett, T. S.: Pore- and fracture-filling gas hydrate reservoirs in the Gulf of Mexico Gas Hydrate Joint Industry Project Leg II Green Canyon 955 H well, Mar. Petrol. Geol., 34, 62–71, https://doi.org/10.1016/j.marpetgeo.2011.08.002, 2012.
Lericolais, G., Bulois, C., Gillet, H., and Guichard, F.: High frequency sea level fluctuations recorded in the Black Sea since the LGM, Glob. Planet. Change, 66, 65–75, https://doi.org/10.1016/j.gloplacha.2008.03.010, 2009.
Lericolais, G., Bourget, J., Popescu, I., Jermannaud, P., Mulder, T., Jorry, S., and Panin, N.: Late Quaternary deep-sea sedimentation in the western Black Sea: New insights from recent coring and seismic data in the deep basin, Glob. Planet. Change, 103, 232–247, https://doi.org/10.1016/j.gloplacha.2012.05.002, 2013.
Løseth, H., Gading, M., and Wensaas, L.: Hydrocarbon leakage interpreted on seismic data, Mar. Petrol. Geol., 26, 1304–1319, https://doi.org/10.1016/j.marpetgeo.2008.09.008, 2009.
Madof, A. S., Baumgardner, S. E., Laugier, F. J., and Haataja, J. I.: Interpretation of Gas Hydrate Province Supported by Petrophysical Analyses: Mississippi Fan, Gulf of Mexico, Geophys. Res. Lett., 46, 13253–13261, https://doi.org/10.1029/2019GL085217, 2019.
Maercklin, N.: SUPOLAR and SUPOFILT: SU programs for polarization analysis and filtering of three-component data, https://doi.org/10.13140/2.1.1697.7926, 2001.
Maslin, M. A.: Review of the timing and causes of the Amazon-Fan mass transport and avulsion deposits during the latest Pleistocene, in: External Controls on Deep-Water Depositional Systems, edited by: Kneller, B., Martinsen, O. J. and McCaffrey, B., SEPM Special Publication, 92, 133–144, https://doi.org/10.2110/sepmsp.092.133, 2009.
Mitchell, J. K. and Soga, K.: Fundamentals of Soil Behavior, 3rd edn., John Wiley & Sons, Hoboken, NJ, USA, 577 pp., ISBN 978-0-471-46302-3, 2005.
Mulder, T. and Cochonat, P.: Classification of Offshore Mass Movements, SEPM JSR, vol. 66, https://doi.org/10.1306/D42682AC-2B26-11D7-8648000102C1865D, 1996.
Nasif, A., Özel, F. E., and Dondurer, D.: Seismic identification of gas hydrates: A case study from Sakarya Canyon, western Black Sea, Turkish J. Earth Sci., 29, https://doi.org/10.3906/yer-1909-2, 2020.
Özel, Ö., Dondurur, D., and Klaucke, I.: Seismic and geoacoustic evidence for subsurface fluid flow and seepage offshore Akçakoca, Southwestern Black Sea, Turkey, Geo-Mar. Lett., 42, 17, https://doi.org/10.1007/s00367-022-00740-z, 2022.
Özsoy, E. and Ünlüata, Ü.: Oceanography of the Black Sea: A review of some recent results, Earth-Sci. Rev., 42, 231–272, https://doi.org/10.1016/S0012-8252(97)81859-4, 1997.
Popescu, I., Lericolais, G., Panin, N., Wong, H. K., and Droz, L.: Late Quaternary channel avulsions on the Danube deep-sea fan, Black Sea, Mar. Geol., 179, 25–37, https://doi.org/10.1016/S0025-3227(01)00197-9, 2001.
Popescu, I., Lericolais, G., Panin, N., Normand, A., Dinu, C., and Le Drezen, E.: The Danube submarine canyon (Black Sea): morphology and sedimentary processes, Mar. Geol., 206, 249–265, https://doi.org/10.1016/j.margeo.2004.03.003, 2004.
Popescu, I., De Batist, M., Lericolais, G., Nouzé, H., Poort, J., Panin, N., Versteeg, W., and Gillet, H.: Multiple bottom-simulating reflections in the Black Sea: Potential proxies of past climate conditions, Mar. Geol., 227, 163–176, https://doi.org/10.1016/j.margeo.2005.12.006, 2006.
Popescu, I., Lericolais, G., Panin, N., De Batist, M., and Gillet, H.: Seismic expression of gas and gas hydrates across the western Black Sea, Geo-Mar. Lett., 27, 173–183, https://doi.org/10.1007/s00367-007-0068-0, 2007.
Praeg, D., Silva, C. G., Reis, A. T. D., Cruz, A., Ketzer, J. M., Migeon, S., and Gorini, C.: Seismic evidence of gas hydrate and seafloor fluid escape on the upper Amazon deep-sea fan, Brazilian equatorial margin, Braz. J. Geophys., 40, https://doi.org/10.22564/brjg.v40i3.2175, 2022.
Priest, J. A., Rees, E. V. L., and Clayton, C. R. I.: Influence of gas hydrate morphology on the seismic velocities of sands: VELOCITY OF HYDRATE-BEARING SANDS, J. Geophys. Res., 114, https://doi.org/10.1029/2009JB006284, 2009.
Radhakrishna, M., Twinkle, D., Nayak, S., Bastia, R., and Rao, G. S.: Crustal structure and rift architecture across the Krishna–Godavari basin in the central Eastern Continental Margin of India based on analysis of gravity and seismic data, Mar. Petrol. Geol., 37, 129–146, https://doi.org/10.1016/j.marpetgeo.2012.05.005, 2012.
Rao, G. N.: Sedimentation, stratigraphy, and petroleum potential of Krishna-Godavari basin, East Coast of India, Bulletin, 85, 1623–1643, https://doi.org/10.1306/8626CCDF-173B-11D7-8645000102C1865D, 2001.
Riedel, M., Collett, T. S., Kumar, P., Sathe, A. V., and Cook, A.: Seismic imaging of a fractured gas hydrate system in the Krishna–Godavari Basin offshore India, Mar. Petrol. Geol., 27, 1476–1493, https://doi.org/10.1016/j.marpetgeo.2010.06.002, 2010.
Riedel, M., Freudenthal, T., Bergenthal, M., Haeckel, M., Wallmann, K., Spangenberg, E., Bialas, J., and Bohrmann, G.: Physical properties and core-log seismic integration from drilling at the Danube deep-sea fan, Black Sea, Mar. Petrol. Geol., 114, 104192, https://doi.org/10.1016/j.marpetgeo.2019.104192, 2020.
Riedel, M., Hähnel, L., Bialas, J., Bachmann, A. K., Gaide, S., Wintersteller, P., Klaucke, I., and Bohrmann, G.: Controls on Gas Emission Distribution on the Continental Slope of the Western Black Sea, Front. Earth Sci., 8, 601254, https://doi.org/10.3389/feart.2020.601254, 2021.
Ross, D. A. and Degens, E. T.: Recent Sediments of the Black Sea, in: The Black Sea - Geology, Chemistry, and Biology, vol. 20, edited by: Degens, E. T. and Ross, D. A., American Association of Petroleum Geologists, Tulsa, Oklahoma, 183–199, 1974.
Ruppel, C. D. and Kessler, J. D.: The interaction of climate change and methane hydrates, Rev. Geophys., 55, 126–168, https://doi.org/10.1002/2016RG000534, 2017.
Ryan, W. B. F., Pitman, W. C., Major, C. O., Shimkus, K., Moskalenko, V., Jones, G. A., Dimitrov, P., Gorür, N., Sakinç, M., and Yüce, H.: An abrupt drowning of the Black Sea shelf, Mar. Geol., 138, 119–126, https://doi.org/10.1016/S0025-3227(97)00007-8, 1997.
Sassen, R., Sweet, S. T., DeFreitas, D. A., Morelos, J. A., and Milkov, A. V.: Gas hydrate and crude oil from the Mississippi Fan Foldbelt, downdip Gulf of Mexico Salt Basin: significance to petroleum system, Org. Geochem., 32, 999–1008, https://doi.org/10.1016/S0146-6380(01)00064-X, 2001.
Sava, D. and Hardage, B.: Rock-physics Model for Gas-hydrate Systems Associated with Unconsolidated Marine Sediments, in: Natural Gas Hydrates – Energy Resource Potential and Associated Geologic Hazards, vol. 89, edited by: Collett, T., Johnson, A., Knapp, C., and Boswell, R., American Association of Petroleum Geologists, Tulsa, Oklahoma, 505–524, 2009.
Schnellmann, M., Anselmetti, F. S., Giardini, D., and Mckenzie, J. A.: 15,000 Years of mass-movement history in Lake Lucerne: Implications for seismic and tsunami hazards, Eclogae geol. Helv., 99, 409–428, https://doi.org/10.1007/s00015-006-1196-7, 2006.
Schwalenberg, K., Gehrmann, R. A. S., Bialas, J., and Rippe, D.: Analysis of marine controlled source electromagnetic data for the assessment of gas hydrates in the Danube deep-sea fan, Black Sea, Mar. Petrol. Geol., 122, 104650, https://doi.org/10.1016/j.marpetgeo.2020.104650, 2020.
Shearer, P. M. and Orcutt, J. A.: Surface and near-surface effects on seismic waves – theory and borehole seismometer results, B. Seismol. Soc. Am., 77, 1168–1196, https://doi.org/10.1785/BSSA0770041168, 1987.
Sloan, E. D. and Koh, C. A.: Clathrate Hydrates of Natural Gases, 3rd edn., CRC Press, Boca Raton, FL, USA, https://doi.org/10.1201/9781420008494, 2008.
Souza, J. M. G., Cruz, A. M., Cubas, N., Rabe, C., Divies, R., Letouzey, J., Praeg, D. B., Granjeon, D., Silva, C. G., Tadeu Dos Reis, A., and Gorini, C.: New insights into gravitational tectonics of the Amazon deep-sea fan: A comparative study of overpressure mechanisms in the Northwest and Southeast compartments, Mar. Petrol. Geol., 182, 107568, https://doi.org/10.1016/j.marpetgeo.2025.107568, 2025.
Starostenko, V. I., Rusakov, O. M., Shnyukov, E. F., Kobolev, V. P., and Kutas, R. I.: Methane in the northern Black Sea: characterization of its geomorphological and geological environments, Geol. Soc. Lond. Special Publications, 340, 57–75, https://doi.org/10.1144/SP340.5, 2010.
Stein, S. and Wysession, M.: An Introduction to Seismology, Earthquakes, and Earth Structure, Blackwell Publishing, Malden, MA, USA, 498 pp., ISBN 978-0-86542-078-6, 2003.
Stockwell, J. W.: The CWP/SU: Seismic Un*x package, Comput. Geosci., 25, 415–419, https://doi.org/10.1016/S0098-3004(98)00145-9, 1999.
Svitoch, A. A., Selivanov, A. O., and Yanina, T. A.: Paleohydrology of the Black Sea Pleistocene Basins, Water Resour., 27, 594–603, https://doi.org/10.1023/A:1026661801941, 2000.
Twichell, D. C.: A Review of Recent Depositional Processes on the Mississippi Fan, Eastern Gulf of Mexico, in: Gulf of Mexico Origin, Waters and Biota, vol. 3, Harte Research Institute for Gulf of Mexico Studies Series, Sponsored by Harte Research Institute for Gulf of Mexico Studies, Texas A & M University – Corpus Christi, 141–154, 2009.
Urlaub, M., Talling, P. J., and Masson, D. G.: Timing and frequency of large submarine landslides: implications for understanding triggers and future geohazard, Quaternary Sci. Rev., 72, 63–82, https://doi.org/10.1016/j.quascirev.2013.04.020, 2013.
Vanneste, M., Sultan, N., Garziglia, S., Forsberg, C. F., and L'Heureux, J.-S.: Seafloor instabilities and sediment deformation processes: The need for integrated, multi-disciplinary investigations, Mar. Geol., 352, 183–214, https://doi.org/10.1016/j.margeo.2014.01.005, 2014.
Vassilev, A. and Dimitrov, L.: Spatial and Quantity Evaluation of the Black Sea Gas Hydrates, Geologiya i Geofizika, 43, 672–684, 2002.
Wang, X., Piao, S., Lei, Y., and Li, N.: In Design of an Ocean Bottom Seismometer Sensor: Minimize Vibration Experienced by Underwater Low-Frequency Noise, Sensors, 18, 3446, https://doi.org/10.3390/s18103446, 2018.
Weimer, P.: Sequence Stratigraphy, Facies Geometries, and Depositional History of the Mississippi Fan, Gulf of Mexico, Bulletin, 74, 425–453, https://doi.org/10.1306/0C9B2321-1710-11D7-8645000102C1865D, 1990.
Wessel, P., Luis, J. F., Uieda, L., Scharroo, R., Wobbe, F., Smith, W. H. F., and Tian, D.: The Generic Mapping Tools Version 6, Geochem. Geophys. Geosyst., 20, 5556–5564, https://doi.org/10.1029/2019GC008515, 2019a.
Wessel, P., Luis, J. F., Uieda, L., Scharroo, R., Wobbe, F., Smith, W. H. F., and Tian, D.: The Generic Mapping Tools version 6, Zenodo [code], https://doi.org/10.5281/ZENODO.3407866, 2019b.
Winguth, C.: Pleistozäne Meeresspiegelschwankungen und Sedimentation im nordwestlichen Schwarzen Meer, Dissertation, Institut für Biogeochemie und Meereschemie, Hamburg, 128 pp., 1998.
Winguth, C., Wong, H. K., Panin, N., Dinu, C., Georgescu, P., Ungureanu, G., Krugliakov, V. V., and Podshuveit, V.: Upper Quaternary water level history and sedimentation in the northwestern Black Sea, Mar. Geol., 167, 127–146, https://doi.org/10.1016/S0025-3227(00)00024-4, 2000.
Wintersteller, P. and Bialas, J.: Gridded bathymetry from multibeam echosounder EM122 data of the cruise MSM34/2 (2013), PANGAEA [data set], https://doi.org/10.1594/PANGAEA.860486, 2016.
Wong, H. K., Winguth, C., Panin, N., Dinu, C., Wollschläger, M., Georgescu, P., Ungureanu, G., Krugliakov, V. V., and Podshuveit, V.: The Danube and Dniepr Fans: Morphostructure and Evolution, GeoEcoMarina, 2, 77–101, 1997.
Yilmaz, Ö.: Seismic Data Analysis: Processing, Inversion, and Interpretation of Seismic Data, Society of Exploration Geophysicists, https://doi.org/10.1190/1.9781560801580, 2001.
Yip, Y. H., Jeong, H., Fu, S., and Van Nierop, E. A.: Comparison of CO2 and CH4 Recovery from a Storage Site, Energ. Proced., 37, 4843–4852, https://doi.org/10.1016/j.egypro.2013.06.394, 2013.
Yun, T. S., Francisca, F. M., Santamarina, J. C., and Ruppel, C.: Compressional and shear wave velocities in uncemented sediment containing gas hydrate, Geophys. Res. Lett., 32, L10609, https://doi.org/10.1029/2005GL022607, 2005.
Zander, T., Haeckel, M., Berndt, C., Chi, W.-C., Klaucke, I., Bialas, J., Klaeschen, D., Koch, S., and Atgın, O.: On the origin of multiple BSRs in the Danube deep-sea fan, Black Sea, Earth Planet. Sc. Lett., 462, 15–25, https://doi.org/10.1016/j.epsl.2017.01.006, 2017.
Zander, T., Choi, J. C., Vanneste, M., Berndt, C., Dannowski, A., Carlton, B., and Bialas, J.: Potential impacts of gas hydrate exploitation on slope stability in the Danube deep-sea fan, Black Sea, Mar. Petrol. Geol., 92, 1056–1068, https://doi.org/10.1016/j.marpetgeo.2017.08.010, 2018.
Zelt, C. A.: Modelling strategies and model assessment for wide-angle seismic traveltime data, Geophys. J. Int., 139, 183–204, https://doi.org/10.1046/j.1365-246X.1999.00934.x, 1999.
Zelt, C. A. and Smith, R. B.: Seismic traveltime inversion for 2-D crustal velocity structure, Geophys. J. Int., 108, 16–34, https://doi.org/10.1111/j.1365-246X.1992.tb00836.x, 1992.