
the Creative Commons Attribution 4.0 License.
the Creative Commons Attribution 4.0 License.
 | 06 Aug 2026
From strong plates to weak boundaries: strain localization in the lithospheric mantle with low- to high-temperature dislocation creep
Etienne Van Broeck
Catherine Thoraval
Diane Arcay
D. Rhodri Davies
Plate-like behavior in mantle convection models is commonly obtained using a strongly temperature-dependent viscosity together with a low yield stress that caps lithospheric strength. Yet, alternative mechanisms for limiting strength, including low-temperature plasticity, have been proposed. Here, we investigate how different rheological formulations promote lithospheric-scale strain localization, using 2-D thermo-mechanical simulations of upper mantle extension. We test a suite of olivine flow laws (diffusion creep and dislocation creep at low- and/or high-temperature), with and without a yield-stress cap, and introduce diagnostics that attribute plate weakening to either increasing strain rate (mechanical weakening) or increasing temperature (thermal weakening). Without a yield-stress cap, deformation remains distributed in all cases, indicating that weakening of the whole lithosphere is required for strain localization. In such simulations, a new extensional plate boundary develops in two stages: progressive narrowing of the deforming zone followed by rapid thinning of the weakened lithosphere. Across plate ages of 10–100 Myr, localization depends weakly on age but strongly on divergence rate, primarily through Stage-1 narrowing, and is controlled more by the stiffest lithospheric region than by the presence of a shallow weak layer. Including dislocation creep allows both mechanical and thermal weakening to operate within the deforming plate, enhancing feedbacks and accelerating localization relative to yield-stress plus diffusion creep. This implies that yield-stress/diffusion-only rheologies may overestimate break-up timescales in whole-mantle convection models. Low-temperature dislocation creep weakens the plate at 800–1000 K, providing a physically grounded mechanism for limiting strength in this temperature range. Finally, we propose that thermal weakening may in some cases promote rapid strength loss and accelerated extension during the late stages of natural rift evolution.
- Article
(9371 KB) - Full-text XML
-
Supplement
(10809 KB) - BibTeX
- EndNote


The theory of plate tectonics describes the motion of rigid lithospheric plates separated by narrow, weak boundaries (e.g. Le Pichon, 1968). Observations from seismicity and geodetic strain-rate fields show that most deformation is concentrated within these plate boundaries, while most plate interiors deform only weakly (e.g. Kreemer et al., 2014). However, broad intraplate deformation zones also exist, for example between the India and Australia plates (e.g. Iaffaldano et al., 2018). In addition, plate reconstructions indicate that the number, size, and organization of plates have changed through geological time (e.g. Morra et al., 2013), implying that plate boundaries are created, reorganized, and abandoned. Such transient boundary formation is evident in incipient continental rifts (Müller et al., 2019), back-arc basins (Sdrolias and Müller, 2006), or subduction initiation settings (Lallemand and Arcay, 2021). New plate boundaries may develop by reactivating inherited weak zones (e.g. Foley and Bercovici, 2014; Heron et al., 2016; Mazzotti and Gueydan, 2018; Chen et al., 2020; Zhou et al., 2020; Fuchs and Becker, 2022; Brune et al., 2023; Gerya, 2024) or by localizing initially distributed deformation into a narrow shear zone (e.g. Lamb and Watts, 2010; Schmalholz et al., 2014; Asti et al., 2022; Whitney et al., 2023; Zwaan et al., 2024). Understanding when and how distributed deformation localizes remains central to explaining the dynamics of plate creation and the emergence of plate-like behavior in mantle convection.
A key difficulty is that the lithospheric mantle is expected to be strong in the creeping domain under low-temperature conditions. For olivine, the dominant mineral in the lithospheric mantle, high-temperature power-law dislocation creep predicts large flow stresses in the cold lithosphere (often exceeding hundreds MPa) (Kohlstedt et al., 1995; Karato, 2008; Burov, 2011). By contrast, estimates of available tectonic driving forces, of order 2 to 50 TN m−1, suggest that plate interiors do not deform at deviatoric stresses below 200 MPa unless additional weakening processes operate (Parsons and Richter, 1980). Consistent with this, strongly temperature-dependent non-Newtonian viscosity alone is insufficient to promote lithospheric break-up (Bercovici, 1993), and instead tends to produce stagnant-lid convection (e.g. Solomatov and Moresi, 1997). Generating plate-like behavior therefore requires mechanisms that both reduce lithospheric strength and promote strain localization (e.g. Solomatov, 2004; Mulyukova and Bercovici, 2019).
Many candidate weakening processes have been explored at lithospheric scales, including shear heating (e.g. Yuen and Schubert, 1979; Brun and Cobbold, 1980; Fleitout and Froidevaux, 1980; Kaus and Podladchikov, 2006; Kiss et al., 2019), viscous anisotropy (e.g. Tommasi et al., 2009; Mameri et al., 2021; Duretz et al., 2025), strain softening or damage formulations (e.g. Frederiksen and Braun, 2001; Gueydan et al., 2014; Meyer et al., 2017; Tarayoun et al., 2019), and grain-size reduction leading to diffusion creep and/or grain-boundary sliding (e.g. Bercovici and Ricard, 2013; Gueydan and Précigout, 2014; Dannberg et al., 2017; Schierjott et al., 2020; Ruh et al., 2022). A widely used pragmatic approach in mantle convection modeling is to combine temperature-dependent creep with a yield-stress cap, which limits effective lithospheric strength and enables mobile-lid or plate-like regimes (e.g. Moresi and Solomatov, 1998; Tackley, 1998; Trompert and Hansen, 1998; Korenaga, 2010; Nakagawa and Iwamori, 2017; Coltice et al., 2019). However, the required stress limits are typically lower than ∼ 200–300 MPa (e.g. Richards et al., 2001; Crameri and Tackley, 2014; Mallard et al., 2016) and would correspond, assuming that yield stress represents brittle deformation, to effective friction coefficients (≲0.2, e.g. Moresi and Solomatov, 1998; Crameri et al., 2012; Nakagawa and Iwamori, 2017) substantially below laboratory values (∼ 0.6, e.g. Byerlee, 1978).
Low-temperature creep deformation has been proposed as an alternative route to limiting lithospheric strength without imposing an ad-hoc stress cap throughout the creeping domain (e.g. Jain et al., 2017). Experiments show that olivine can deform under high-stress, low-temperature conditions following an exponential (Peierls-type) flow law (Evans and Goetze, 1979; Frost and Ashby, 1982; Raterron et al., 2004; Mei et al., 2010; Demouchy et al., 2013; Hansen et al., 2019). Low-temperature dislocation creep has also been invoked to explain deformation of subducting slabs in the transition zone (Čížková et al., 2002; Garel et al., 2014). More recently, dislocation-dynamics models have provided a unified description of olivine dislocation creep that bridges classical high-temperature power-law creep and low-temperature Peierls creep, suggesting a continuous mechanical behavior across a wide range of temperatures and strain rates controlled by the interplay of glide and climb (Gouriet et al., 2019). This unified formulation has already been implemented in geodynamical simulations to investigate feedbacks that weaken the asthenosphere around sinking slabs (Garel et al., 2020).
Here, we evaluate the capacity of a unified low- to high-temperature (LT–HT) dislocation creep formulation (Gouriet et al., 2019; Garel et al., 2020) to promote lithospheric-scale strain localization in a controlled extensional setting. We compare its dynamical behavior with that obtained using commonly employed mantle rheologies (diffusion creep and/or high-temperature dislocation creep), with and without a yield-stress cap. Strain localization in geodynamical models is usually quantified using geometric measures such as “plateness” (Weinstein and Olson, 1992; Tackley, 2000) or relative shear-zone width “localization potential” (Montési, 2013), while bulk plate strength can be inferred from the tectonic force required to sustain imposed kinematics (Bialas et al., 2010; Brune et al., 2012). Recent studies have also introduced diagnostics of weakening to compare deformation mechanisms in subduction settings (Patočka et al., 2024), alongside theoretical analyses of weakening potentials (Montési and Zuber, 2002) or in simplified frameworks (Kaus and Podladchikov, 2006; Schmalholz and Fletcher, 2011). However, there remains a need for time-dependent diagnostics that track not only whether viscosity decreases, but also why it decreases as thermal and kinematic fields evolve self-consistently.
To address this, we introduce diagnostics that partition local viscosity change into contributions from increasing strain rate (mechanical weakening) and increasing temperature (thermal weakening) during localization. We apply these diagnostics to 2-D thermo-mechanical simulations of lithospheric extension across a range of initial plate ages and imposed extension rates. In this framework, deformation focusing and plate thinning are coupled to asthenospheric upwelling, enabling positive feedbacks that amplify strain rate and/or temperature increase depending on the rheological formulation. To isolate weakening processes within the lithospheric mantle, we model a single mantle material and intentionally neglect crustal layering and associated lithological and rheological contrasts. This simplified configuration is designed to clarify how low- to high-temperature dislocation creep, relative to yield-stress and diffusion-only parameterizations, controls the efficiency, depth distribution, and timescale of lithospheric-scale strain localization in the mantle.
In the remainder of the paper, we first describe the thermo-mechanical extension set-up, the rheological formulations tested, and the numerical implementation (Sect. 2). We then introduce post-processing diagnostics that quantify strain localization, plate thinning and bulk plate strength, and that partition viscosity change into strain-rate-driven and temperature-driven contributions (Sect. 3). We present results in four steps: (i) end-member deformation outcomes in a reference configuration, (ii) a two-stage localization trajectory and characteristic timescales in a representative localizing case, (iii) a comparison across rheological combinations to identify which dependencies control localization efficiency and the depth/temperature range of weakening, and (iv) sensitivity to initial plate age and imposed extension rate (Sect. 4). Finally, we discuss the implications for lithospheric weakening in natural rift systems, and for yield-stress-based parameterizations commonly used in whole-mantle convection models, and summarize the main conclusions (Sects. 5 and 6).
2.1 Extension Set-Up
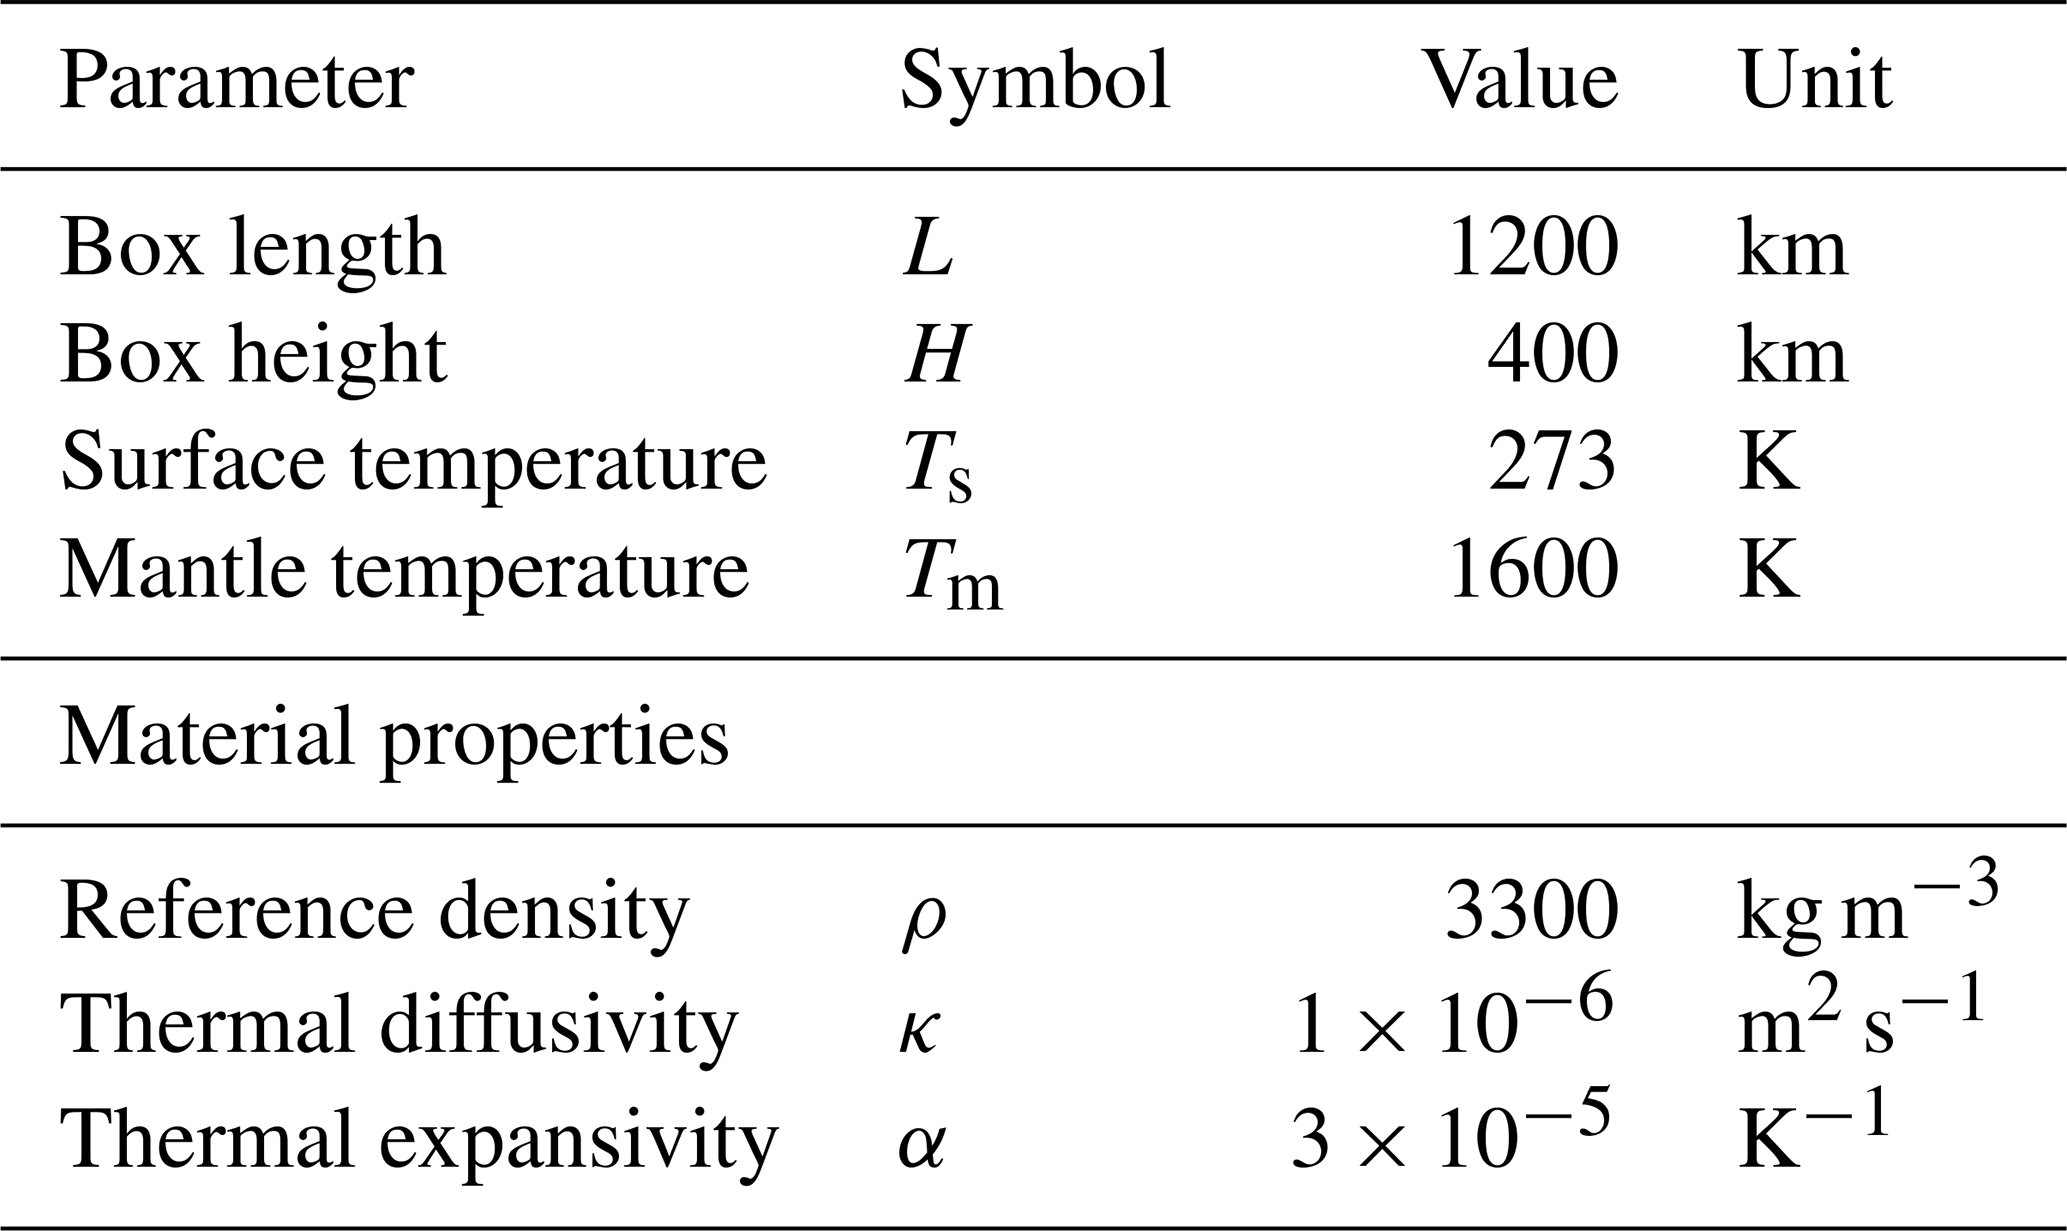
We construct a 2-D thermo-mechanical model of upper-mantle extension in which lithospheric strength (viscosity) depends on both strain rate and temperature. The model domain is a 1200 km wide by 400 km deep rectangle composed entirely of mantle material (Table 1). This mantle-only configuration is designed to isolate strain localization within the lithospheric mantle and to facilitate comparison with large-scale plate-like convection models, which commonly neglect crustal structure and employ simplified rheologies.
Accordingly, we do not model crust-mantle interactions or full continental rift mechanics. This is a deliberate simplification, as crustal layering can reduce bulk lithospheric strength and introduce rheological contrasts that enhance localization in the mantle through crust-mantle mechanical coupling (e.g. Allemand and Brun, 1991; Burov and Watts, 2006; Rosenbaum et al., 2010). In many numerical rift models, strong coupling across rheological discontinuities favors a “narrow-rift” style of deformation (e.g. Huismans and Beaumont, 2005; Gueydan et al., 2008; Chenin et al., 2018; Duclaux et al., 2020; Zwaan et al., 2021; Wang et al., 2023). In our set-up, localization is instead controlled by mantle rheology and by the imposed yield-stress parameterization (Sect. 2.2), allowing us to isolate how these ingredients influence the onset and evolution of localized extension.
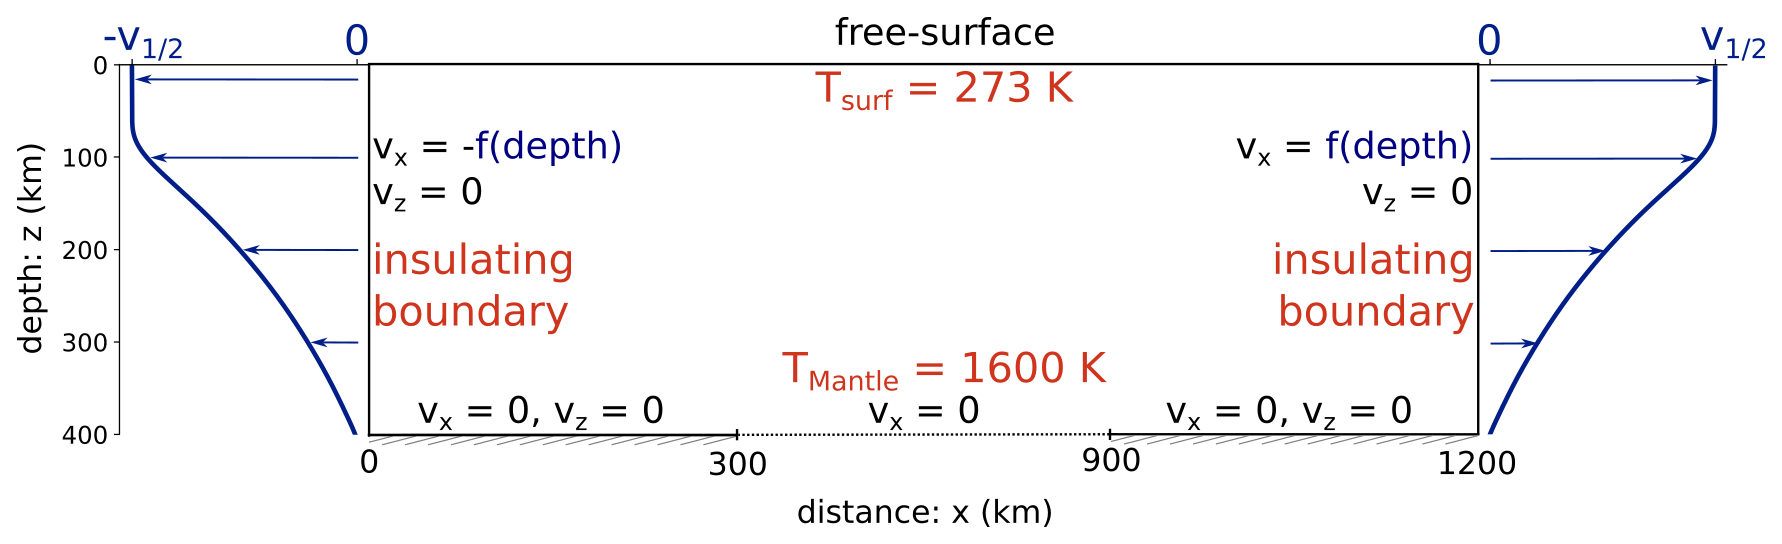
Figure 1Simulation set-up in the 400 × 1200 km 2-D domain. Mechanical boundary conditions (in blue) are a free-surface top, and depth-dependent horizontal flow on the vertical sides, where is the plate half extension rate. The bottom boundary is no-slip and closed (), except over a 600 km-wide open segment between x=300 and 900 km where purely vertical flow is allowed (vx=0). Thermal boundary conditions (in red) are constant temperatures at top (273 K) and bottom (1600 K), and insulating vertical boundaries.
The initial thermal structure is prescribed using the half-space cooling model for a laterally uniform plate age. Thermal boundary conditions are fixed temperatures of Ts=273 K at the surface and Tm=1600 K at the base, with thermally insulating vertical sides (Fig. 1). The initial deformation state is derived from a purely horizontal velocity field, producing a nearly uniform initial strain rate in the plate ( = 3.73 × 10⁻¹⁶ s−1 for = 1 cm yr−1, Fig. 2).
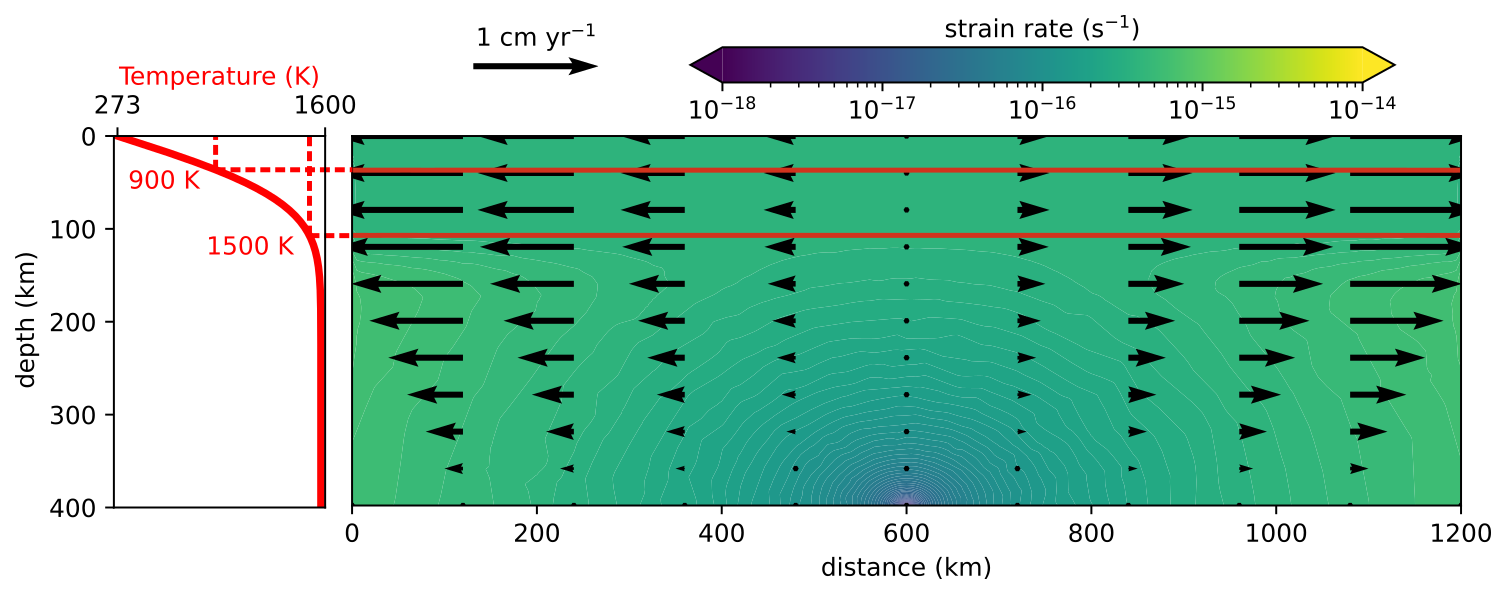
Figure 2Initial conditions showing (left) the temperature field calculated from the half-space cooling model (temperature profile T(z) for a 50 Myr-old plate) and (right) the second invariant strain rate (here ∼ 3.73 × 10⁻¹⁶ s−1 for a half extension rate = 1 cm yr−1). The imposed initial velocity field is depicted by black arrows, with red lines indicating the 900 and 1500 K isotherms. This purely horizontal velocity field (vz = 0) is calculated by assuming at each depth a linear increase of the horizontal velocity along x from the domain center () to the domain sides, where a Couette velocity is imposed as a boundary condition (cf. vx(z) calculation for x=0 or 1200 km in the Supplement, Sect. S2.1).
Extension is imposed through symmetric, depth-dependent horizontal outflow velocities on the side boundaries (Fig. 1). The vertical profile vx(z) is obtained from a 1-D Couette solution with surface velocity and zero velocity at the base, calculated using the depth- and temperature-dependent diffusion-creep viscosity of a 50 Myr-old plate (detailed in the Supplement, Sect. S2.1). This corresponds to an effective constant-velocity plate 89 km thick, defined as the depth above which horizontal velocity differs by less than 1 % from (Garel and Thoraval, 2021). Additional tests with alternative side-boundary velocity profiles produce no significant change in the results (detailed in the Supplement, Sect. S2.3). The upper boundary is treated as a free-surface (Kramer et al., 2012). At the base, no-slip and closed condition () are imposed on the lateral segments, while vertical inflow with vx=0 is allowed across a 600 km-wide central segment (see the Supplement, Sect. S2.2). This promotes localization at the domain center (see Fig. S3 in the Supplement, Sect. S2.3), while allowing basal inflow to adjust dynamically to the imposed lateral outflow (see Fig. S7 in the Supplement, Sect. S2.4) and evolving surface deformation.
We first analyze different rheological parameterizations in a reference configuration with = 1 cm yr−1 and an initial plate age of 50 Myr (Sect. 4.1, 4.2 and 4.3). We then explore the influence of initial plate age (10–100 Myr) and half-extension rate (0.2–5 cm yr−1) on localization behaviour (Sect. 4.4).
2.2 Rheological parameterization
2.2.1 Mechanisms of mantle deformation
Viscous deformation is represented by combinations of (i) olivine creep flow laws and (ii) a stress-limited viscosity (“yield stress”). The creep laws include diffusion creep and dislocation creep, based on experimental and numerical constraints on olivine deformation (e.g. Hirth and Kohlstedt, 1995a, b; Gouriet et al., 2019). We assume that multiple creep mechanisms may operate simultaneously (Sect. 2.2.2).
A yield-stress formulation is included in some simulations because such stress caps are widely used in geodynamical models to reproduce mobile-lid or plate-like behavior (e.g. Tackley, 2000; Mallard et al., 2016). Without this type of stress limitation, strongly temperature-dependent viscous rheologies typically produce stagnant-lid regimes (Solomatov, 1995). In that context, yield stress is commonly interpreted as a first-order proxy for pseudo-brittle deformation. Seismicity in oceanic lithosphere suggests that brittle failure may extend to temperatures of 600 °C (900–1000 K) (e.g. Engeln et al., 1986; Abercrombie and Ekström, 2001; McKenzie et al., 2005). We therefore test, in a subset of simulations, cases in which yielding is restricted to temperatures below 900–950 K. This prevents yielding from operating throughout the deeper creeping lithosphere while retaining a pseudo-brittle response in the shallow plate.
Elasticity is neglected in all simulations. Because our focus is on long-timescale viscous localization and plate-scale weakening, we expect this simplification to have limited influence on the localization trends examined here; we return to this point in the Discussion (Sect. 5.4).
2.2.2 Computation of mantle effective viscosity
Diffusion creep in olivine is represented by a temperature-dependent Newtonian viscosity:
where Adiff is the pre-exponential constant, corresponding to a grain size of ∼ 3 mm (Garel et al., 2020), Ediff is the activation energy, Vdiff is the activation volume, R the gas constant (Table 2), P is the lithostatic pressure (ρgz), T the temperature, and δT is a temperature correction applied only to viscosity calculations for diffusion (Eq. 1) and high-temperature dislocation creep (Eq. 2), to mimic the effect of a 0.5 K km−1 adiabatic gradient within the incompressible approximation. We compare dynamic and lithostatic pressures in the Supplement (Sect. S3.1).
Table 2Variables used in the rheological laws investigated in this study (Sect. 2.2).
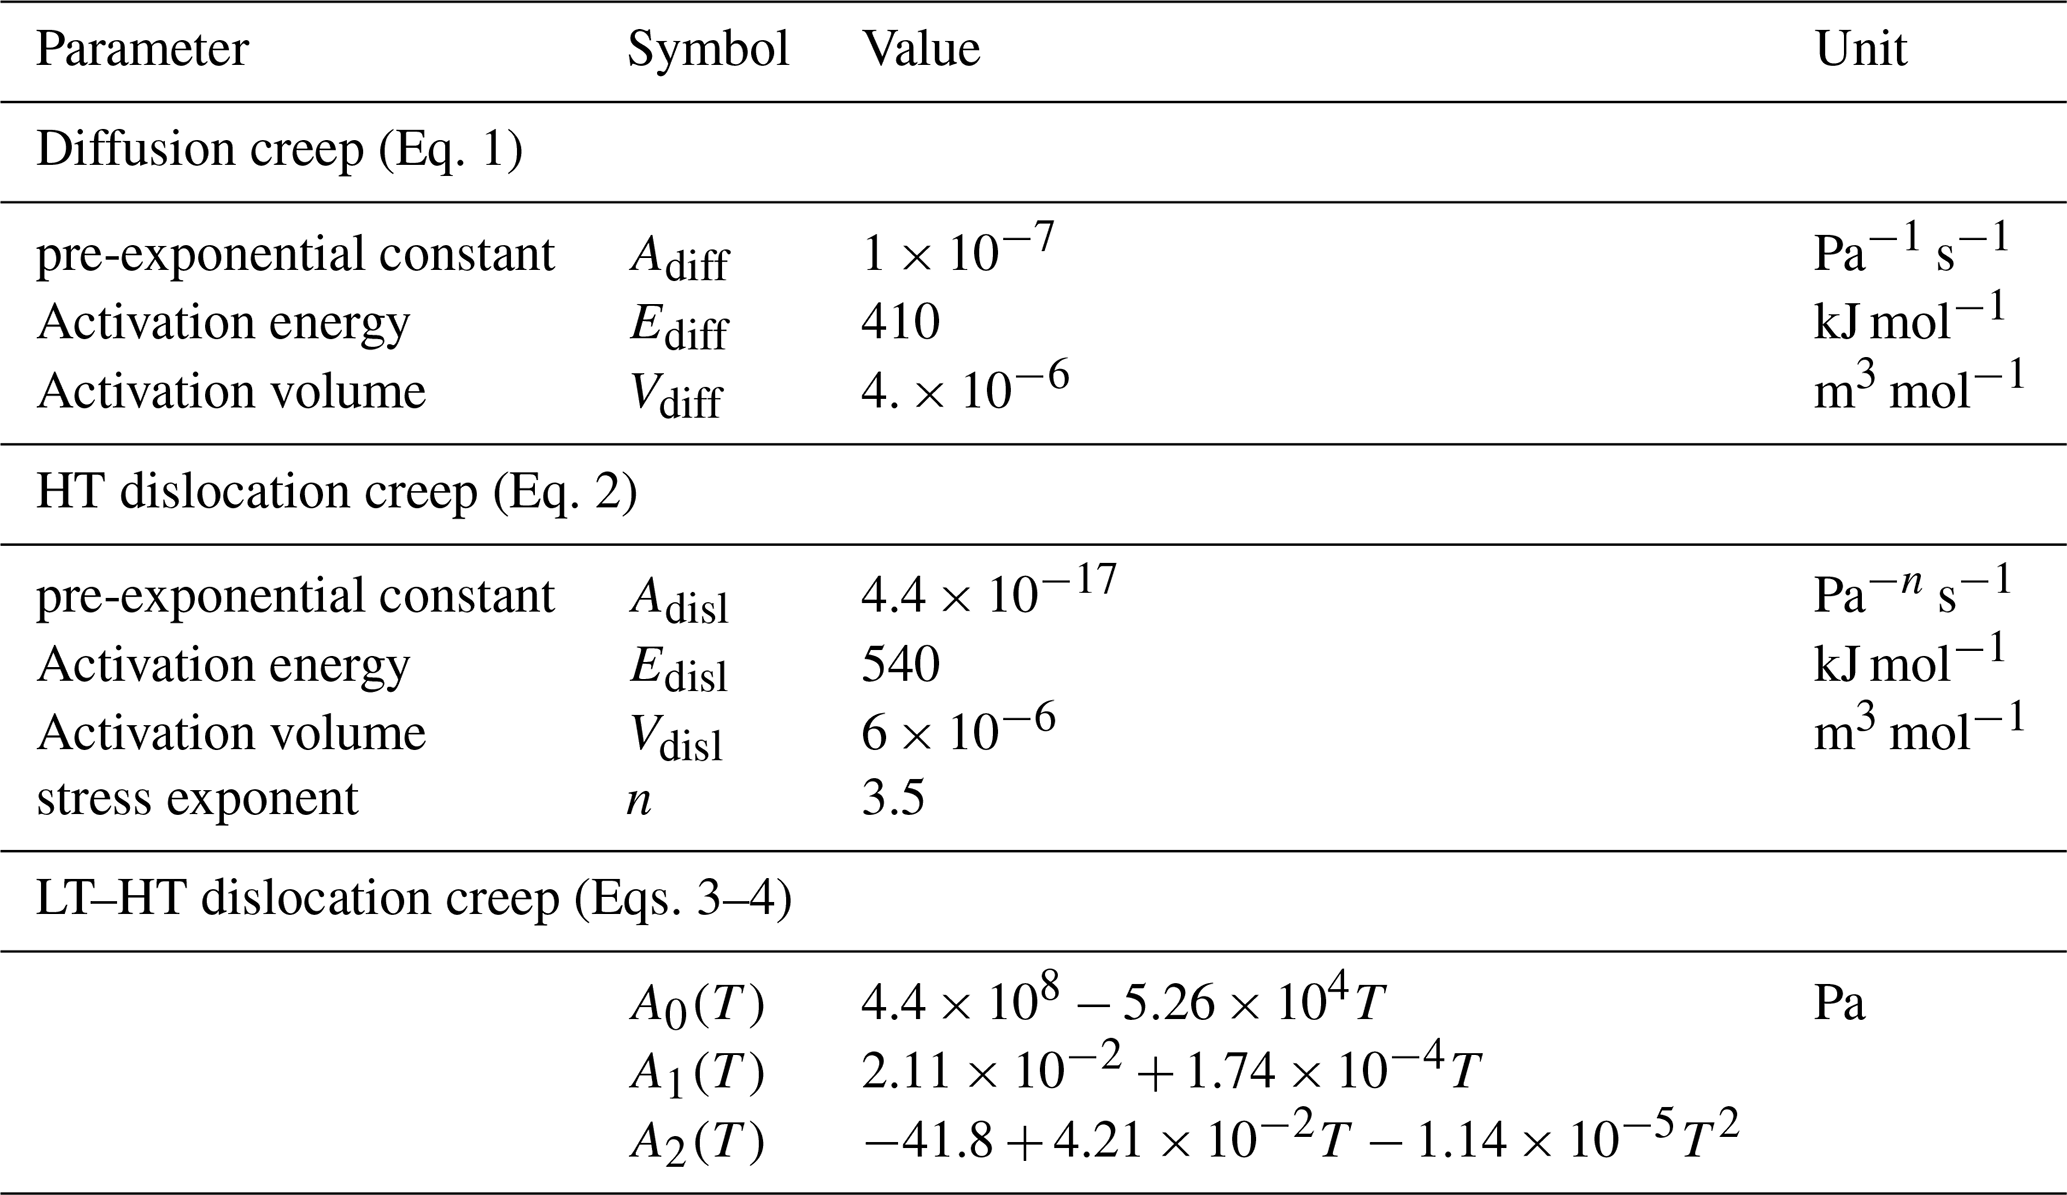
Dislocation creep is non-Newtonian and strain-rate-dependent. We consider two alternative flow laws. First, we use conventional high-temperature (HT) power-law dislocation creep (Garel et al., 2020):
where Adisl is the pre-exponential constant, Edisl is the activation energy, Vdisl the activation volume, n the stress exponent and the second invariant of the strain-rate tensor associated with the dislocation creep contribution. Second, we use a unified low- to high-temperature (LT–HT) dislocation creep law, derived from dislocation-dynamics models (Gouriet et al., 2019) and calibrated against macroscale effective mantle-viscosity constraints (Garel et al., 2020):
where A0, A1, A2 are polynomial functions of temperature (Table 2). This formulation converges to HT dislocation creep (Eq. 2) at high temperature, and predicts similar low stresses at lower temperature compared to other parameterizations (e.g. Mei et al., 2010; Demouchy et al., 2013; Jain et al., 2017; Warren and Hansen, 2023) (Fig. S12 in the Supplement, Sect. S3.3). When both diffusion and dislocation creep are present in the rheological parameterization, the bulk creep viscosity is computed assuming that the two mechanisms act in parallel:
and that the second invariant of the total strain rate tensor () is partitioned between them:
assuming a single deviatoric stress σ
An iterative scheme is used to compute ηdisl from the dislocation creep strain rate (detailed in the Supplement, Sect. S3.2) rather than the total strain rate, thereby avoiding artificial weakening. This allows us to quantify the fraction of total creep deformation accommodated by dislocation creep (Eq. S13 in the Supplement).
The pseudo-brittle contribution is represented by a non-Newtonian yield viscosity:
where σy is a constant yield stress (200–500 MPa depending on the simulation). The effective viscosity used in the momentum equation is then taken as the minimum of creep and yield viscosities:
Numerical stability is maintained by imposing viscosity cutoffs of 1018 and 1025 Pa s. At each point, we also identify the dominant deformation mechanism: yielding versus creep, and within creep, diffusion versus dislocation, based on the creep mechanism contributing ≥ 50 % of the total strain rate.
2.2.3 Strategy for investigating rheological control on lithospheric extension
We investigate a suite of rheological combinations (Table 3):
-
Diffusion creep only (D),
-
Diffusion creep combined with either HT or a LT–HT dislocation creep (D−dHT or D−dLT–HT),
-
Diffusion creep combined with a yield-stress rheology (),
-
Diffusion creep, dislocation creep, and yield-stress combined ().
The two constant yield stresses, 200 and 500 MPa, are chosen to span the range between values commonly used to generate plate-like behaviour in mantle convection models (e.g. Mallard et al., 2016), and the upper stress range over which the LT–HT dislocation creep formulation is calibrated (Gouriet et al., 2019; Garel et al., 2020). In a subset of simulations, yielding is restricted to the expected brittle domain (see Sect. 5.3), by allowing it only below 900 or 950 K ( or ).
These rheological combinations differ in both their strain-rate and temperature dependencies, and in the depth and temperature at which deformation transitions from yield-dominated to creep-dominated behaviour. They therefore provide a controlled way to test how the depth distribution of weakening influences localization, asthenospheric upwelling, and the timing of lithospheric break-up under constant extension velocity.
2.3 Numerical methods
We solve the conservation equations of mass, momentum and energy for an incompressible Stokes fluid under the Boussinesq approximation using the finite-element, control-volume code Fluidity (e.g., Davies et al., 2011). This framework has been widely used in geodynamical applications and extensively benchmarked against analytical and numerical reference solutions (e.g. Garel et al., 2014; Le Voci et al., 2014; Kramer et al., 2021b; Duvernay et al., 2022). The equations are discretized on an unstructured Eulerian mesh that is dynamically adapted throughout each simulation. Refinement criteria are applied to temperature, velocity, strain-rate, and viscosity, ensuring adequate resolution of lithospheric thermal gradients, localization zones, and strong viscosity contrasts. Triangular element sizes range from 200–1000 m in the finest regions to 50 km in the coarsest regions, with the highest resolution concentrated in the lithosphere and regions of active deformation (Supplement, Sect. S1). A typical simulation contains approximately 50 000 nodes, although this varies as simulations evolve.
For post-processing, physical fields are interpolated from the unstructured finite-element mesh onto a regular grid with 5 × 1 km2 spacing. This allows consistent calculation of spatial averages and Eulerian time derivatives.
We define the lithosphere as the region colder than 1500 K. In this single-material model, that threshold provides a first-order proxy for the lithosphere-asthenosphere transition, which is otherwise gradual in temperature, deformation and velocity (Garel and Thoraval, 2021). We also pay particular attention to the deeper lithospheric interval between 800 and 1500 K, where the yield-creep transition and the majority of the weakening occur. Some diagnostics are vertically-averaged over the lithosphere and denoted 〈X〉1500 K(x,t), using either an arithmetic or geometric mean depending on the range spanned by X. To compare simulations with different extension rates , we define a bulk extensional strain where t is time and L is the domain width. All simulations are run to ∼ 40 % bulk strain, corresponding to ∼ 500 km cumulative horizontal extension.
3.1 Strain localization in the lithospheric mantle
We first quantify strain localization within the plate using the strain-rate amplification relative to the initially uniform strain rate in the plate (Fig. 2), and its geometric mean over lithospheric thickness at each horizontal position.
To track lateral focusing through time, we define the width of the deforming zone, w(t), as the region where . From this, we compute a narrowing rate. We also quantify the lateral viscosity contrast within the plate Rvisc(t), as the ratio between the maximum vertically-averaged lithospheric viscosity along x and the minimum value in the central weak zone:
Finally, we compute the plateness P(t) (Tackley, 2000; Crameri, 2018). Details of the calculation are given in the Supplement (Sect. S4.1).
3.2 Plate thinning, weakening, and bulk stiffness
To quantify lithospheric thinning, we define the plate thickness hplate(t) as the minimum depth of the 1500 K isotherm along x. Its time evolution is used to estimate an upwelling rate. We track time-dependent weakening or hardening through the logarithmic rate of change in effective viscosity:
where Δt is chosen to be much smaller than the localization timescale (typically 0.05–1 Myr, depending on extension rate). Smaller values of Δt do not change the weakening amplitude. Positive values of W indicate weakening whereas negative values indicate hardening. We also compute the vertically averaged weakening rate 〈W〉1500 K(x,t) using a geometric mean. A 10-fold decrease in viscosity in 1 Myr corresponds to a weakening rate W of about 3 × 10⁻¹⁴ s−1.
As a bulk measure of lithospheric strength, we calculate the tectonic force TF(t) (in N m−1) required to maintain the imposed extension velocity at the side boundaries (Bialas et al., 2010; Brune et al., 2012):
with
where Sij is the stress tensor vertically averaged over the full domain height H at x=100 km, to minimize boundary effects (see the Supplement, Sect. S4.2).
3.3 Physical controls on plate weakening
To distinguish why viscosity decreases during localization, we partition weakening into contributions associated with temperature and strain-rate changes. This builds on the general idea that localization potential can be related to the sensitivity of viscosity to evolving state variables (Montési and Zuber, 2002). At each point on the interpolated grid, viscosity depends only on temperature and strain rate, so its time derivative may be written as:
We approximate this decomposition over a finite time interval Δt as:
The corresponding normalized contributions to weakening are then
where FT measures the contribution from temperature evolution (“thermal” weakening) and FSR, the contribution from strain-rate evolution (“mechanical” weakening). We use Δt≈0.25 Myr for this partitioning. Smaller values introduce short-period oscillations in FT and FSR without changing the broader trends. These diagnostics are evaluated only where the material is undergoing weakening (W>0). Mixed cases can nevertheless arise, for example when mechanical weakening due to strain-rate increase exceeds thermal hardening due to plate cooling. In such cases, FT may become negative and FSR may exceed 1 (as discussed in Sect. 4.4). For plotting purposes, the colour scale for FSR is capped between 0 and 1.
We present our results in four steps. First, we describe the range of deformation patterns obtained for a reference plate age (50 Myr) and half-extension rate ( cm yr−1), from distributed deformation to localization into a narrow extensional boundary. Second, we use a representative localizing case to define characteristic times and a two-stage evolution of localization based on the co-evolution of deforming-zone width and plate thickness. Third, we compare rheological parameterizations to explain the differences in localization efficiency and in the depth/temperature range over which weakening occurs. Fourth, we explore sensitivity to initial plate age and imposed extension rate.
4.1 Diffuse vs. localized deformation during lithospheric extension
For an initially 50 Myr-old plate extended at cm yr−1, the rheological parameterization produces three distinct deformation outcomes by 40 % bulk strain (Table 3, Figs. 3, A1).
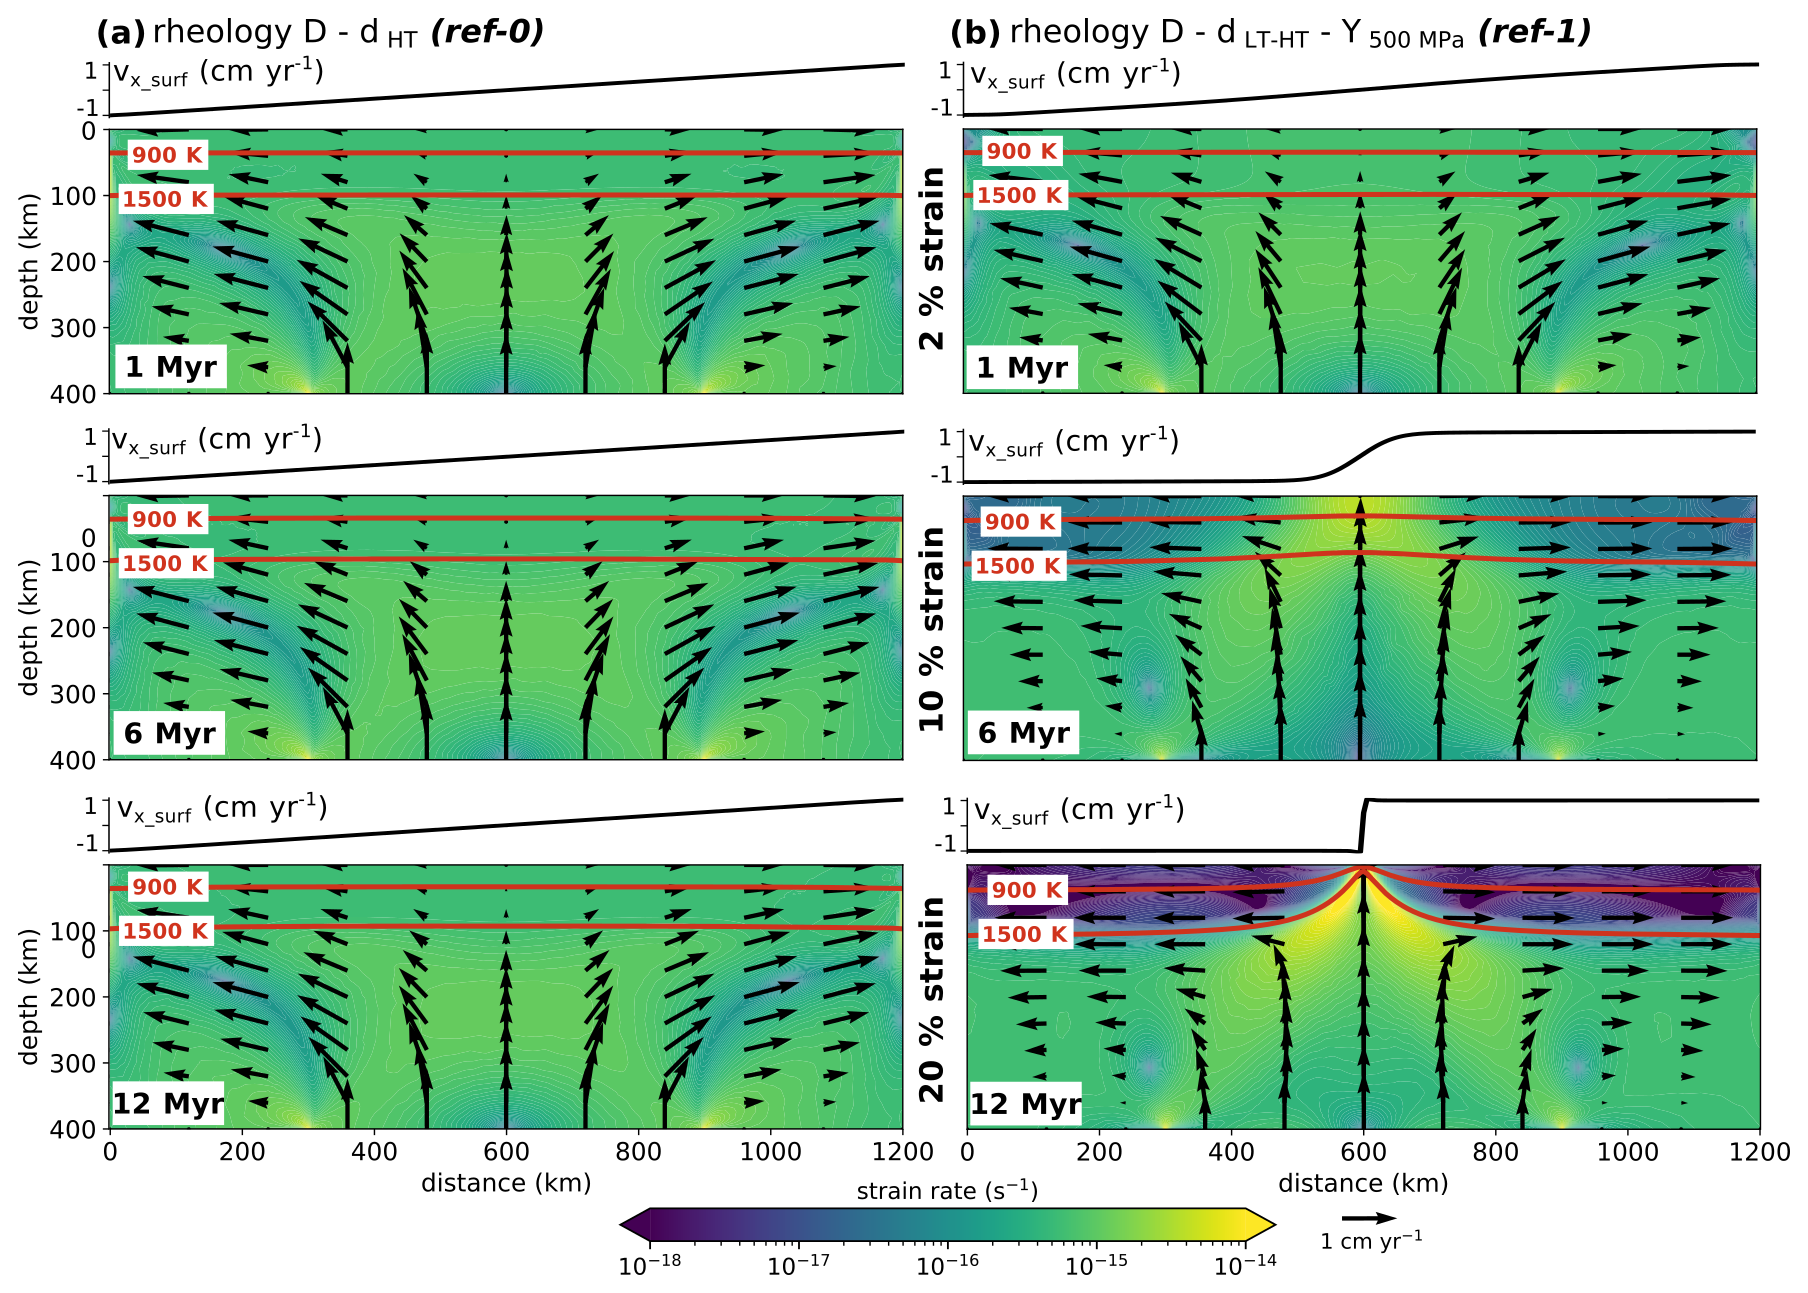
Figure 3Evolution of the strain rate field (second invariant) during two end-member simulations, shown after 1, 6 and 12 Myr of extension: (a) Simulation D−dHT (ref-0), with diffusion creep and high-temperature dislocation creep, Table 3 characterized by uniform and diffuse lithospheric thinning; (b) simulation (ref-1), combining diffusion creep, low- and high-temperature dislocation creep, and a yield-stress set to 500 MPa, which successfully localizes plate deformation. For each snapshot, the horizontal velocity at the surface is plotted above. Velocity field is depicted by black arrows, and the 900 and 1500 K isotherms are indicated in red.
First, Simulation ref-1 serves as a reference for the strain localization scenario (Table 3, and Fig. 3b). Its rheology, labeled , accounts for diffusion creep, low- and high-temperature dislocation creep (Eq. 3) and a yield stress of 500 MPa (Eq. 8). This simulation shows a progressive narrowing of the deformed domain around the box center, where most of the deformation is accommodated as shown by the significant increase in the horizontal velocity gradient at the surface (Fig. 3b, 1–6 Myr). In a second stage, significant asthenospheric upwelling develops beneath the most stretched lithosphere portion, resulting in a boundary separating two divergent plates that behaves as a horizontal velocity discontinuity (Fig. 3b, 12 Myr). Hence, in localizing cases, a narrow extensional plate boundary develops at the domain center, separating two rigid plates (Simulation ref-1 in Fig. 3b). These runs exhibit high plateness (P>0.95), a large lateral viscosity contrast (Rvisc>100), and a deformed-zone width w<100 km, while plate thickness hplate approaches a quasi-steady value after localization. The localized zone is underlain by focused asthenospheric upwelling.
Second, the non-localizing simulation ref-0 (rheology D−dHT, Table 2 and Fig. 3a) exhibits a long-lasting and steady plate deformation. This diffuse deformation mode corresponds to a slow plate thinning (∼ 0.05 cm yr−1), arising from the competition between thickening by diffusive cooling and lithosphere extension. In such cases where deformation is always distributed, the plate deforms broadly and remains laterally uniform, without any increase in the horizontal velocity gradient at the surface (e.g., Simulation ref-0 in Fig. 3a). These runs show low plateness (P<0.3) and weak lateral viscosity contrast (Rvisc<10). Strain-rate amplification remains modest across the plate and deformation is expressed primarily as gradual, laterally uniform thinning.
Third, an intermediate regime occurs in which the deformation localization is very slow (Appendix A). Strain begins to focus but the area where deformation is enhanced remains relatively wide at 40 % strain (incomplete localization). These runs still exhibit narrowing of the deformed zone and plate thinning, with w≳150 km at the end of the simulations, comparable to the early-to-intermediate state of Simulation ref-1 (e.g., Fig. 3b at 6 Myr).
In the remainder of the Results, we use a representative localizing simulation (ref-1) to define a reference localization trajectory and characteristic timescales, and then compare rheological combinations and forcing parameters against that trajectory.
4.2 A two-stage scenario of strain localization and lithosphere weakening
We quantify the localization trajectory in Simulation ref-1 using the co-evolution of deformed-zone width w, the minimum plate thickness hplate, and the weakening rate W (Sect. 3). The deforming region (defined by 〈ASR〉1500 K>1, Sect. 3.1) progressively narrows toward the domain center (Fig. 4a), while weakening intensifies within the lithosphere beneath the developing boundary (Fig. 4b and d).
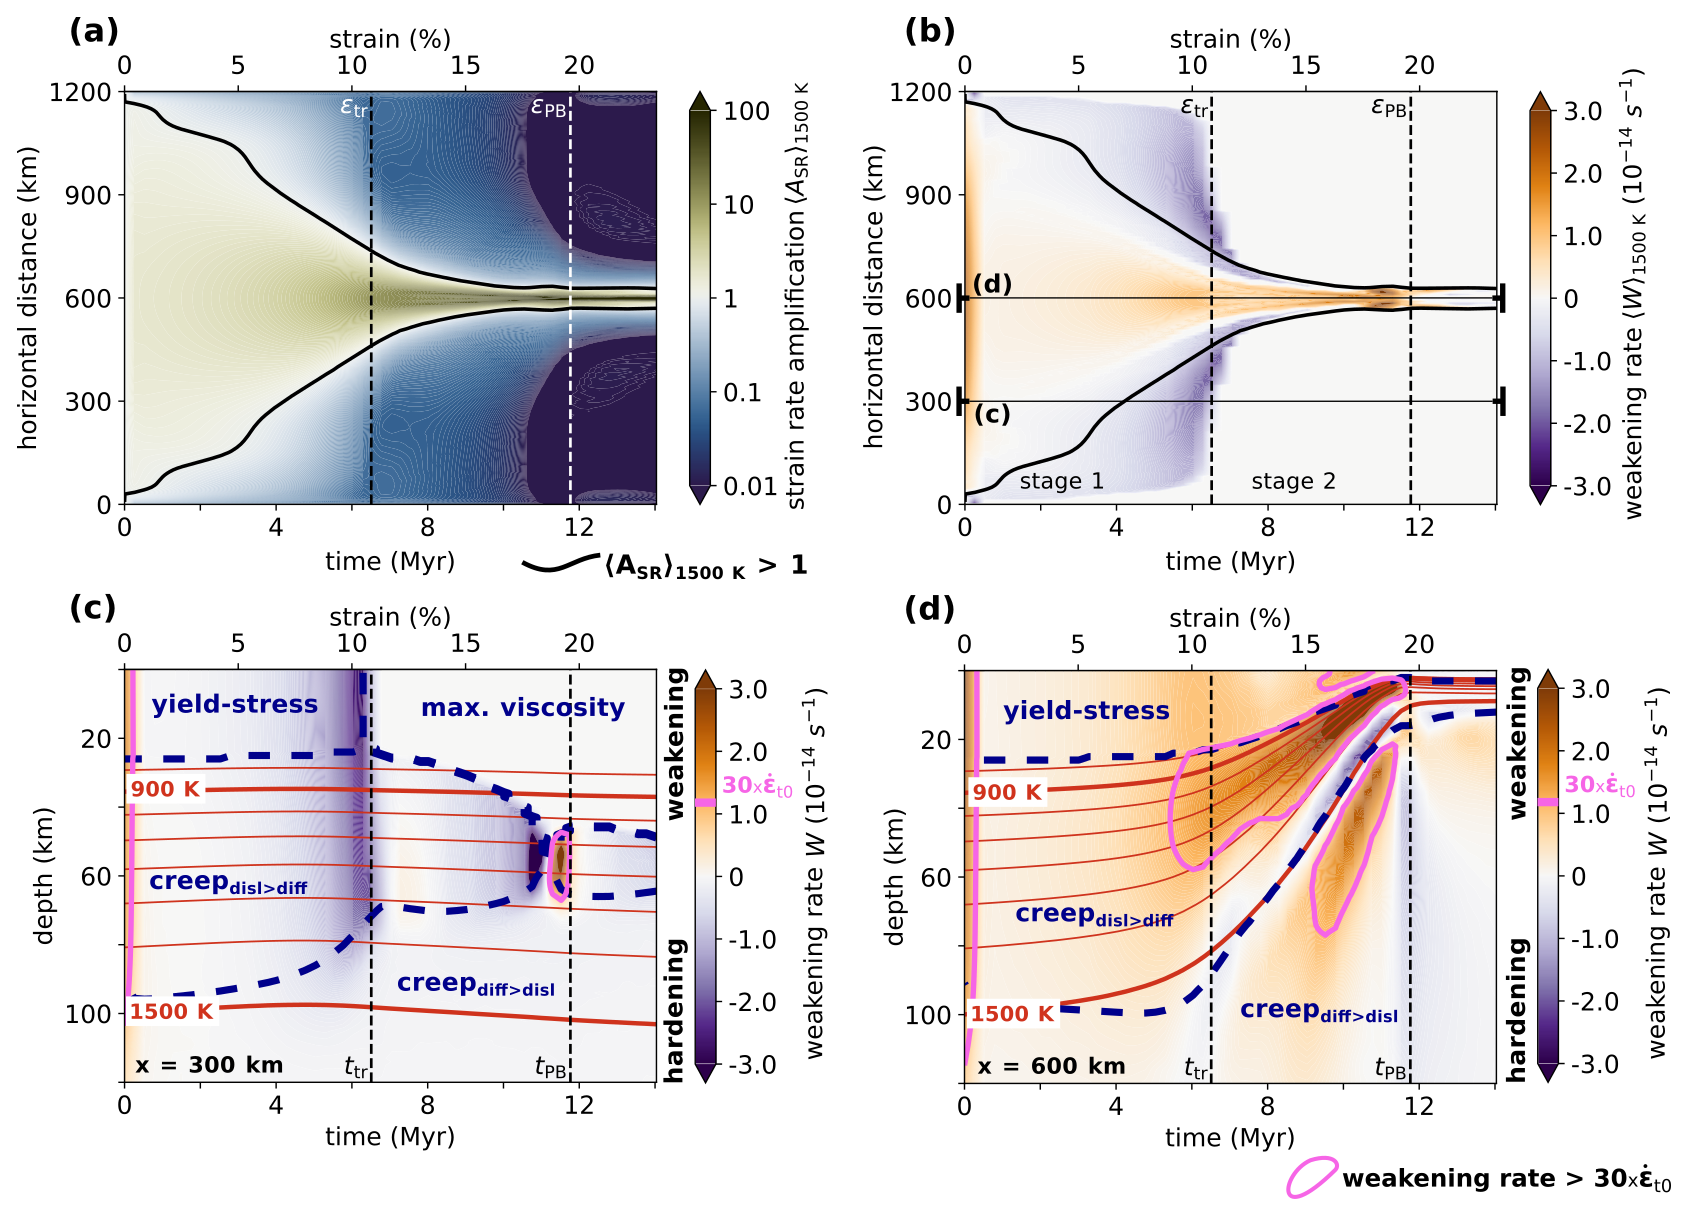
Figure 4Localization of lithospheric deformation and weakening in Simulation (ref-1, Table 3). (a) Time-distance evolution of strain-rate amplification 〈ASR〉1500 K(x,t), calculated as the vertically-averaged ratio relative to the initial uniform strain rate in the plate (here × 10−16 s−1, see Sect. 3.1). The thick black line features the isocontour 1 of this ratio. (b) Time-distance plot of the geometric mean of the vertically-averaged weakening rate 〈W〉1500 K(x,t) (Sect. 3.2). Orange shades indicate where weakening (W>0) affects more than 60 % of lithospheric thickness, with plotted values representing the geometric mean 〈WSR〉1500 K(x,t) for depths where . On the other hand, purple-blue shades indicate where weakening affects less than 40 % of lithospheric thickness, plotting the vertical geometric mean for depths where W≤0 (hardening or neutral). Areas where weakening affects between 40 % and 60 % of the lithospheric thickness are left white. (c, d) Depth-time evolution of the weakening rate W at x=300 km (c) and 600 km (d). The pink outline highlights zones of high weakening rate where , and the red lines indicate isotherms from 800 to 1500 K. Regions with different dominant deformation mechanisms are delineated by dashed dark-blue contours. In all panels, vertical dashed lines indicate the transition time, ttr and the plate boundary time, tPB.
The localization trajectory is well described by two stages (Fig. 5a). Stage 1 is dominated by lateral focusing of deformation: w decreases rapidly whereas hplate decreases only modestly. Stage 2 is dominated by rapid plate thinning driven by asthenospheric upwelling: hplate decreases rapidly while the narrowing of w slows down. Stages 1 and 2 are detailed below. We define two characteristic times. The transition time ttr marks a shift in trajectory in hplate(t) : w(t) space (Appendix B); it coincides with the end of the approximately steady tectonic force plateau TF (Fig. 5c). The plate-boundary time tPB marks the onset of a quasi-steady geometry, when both hplate and w become approximately stationary and the tectonic force has dropped to its post-localization value (Fig. 5c).
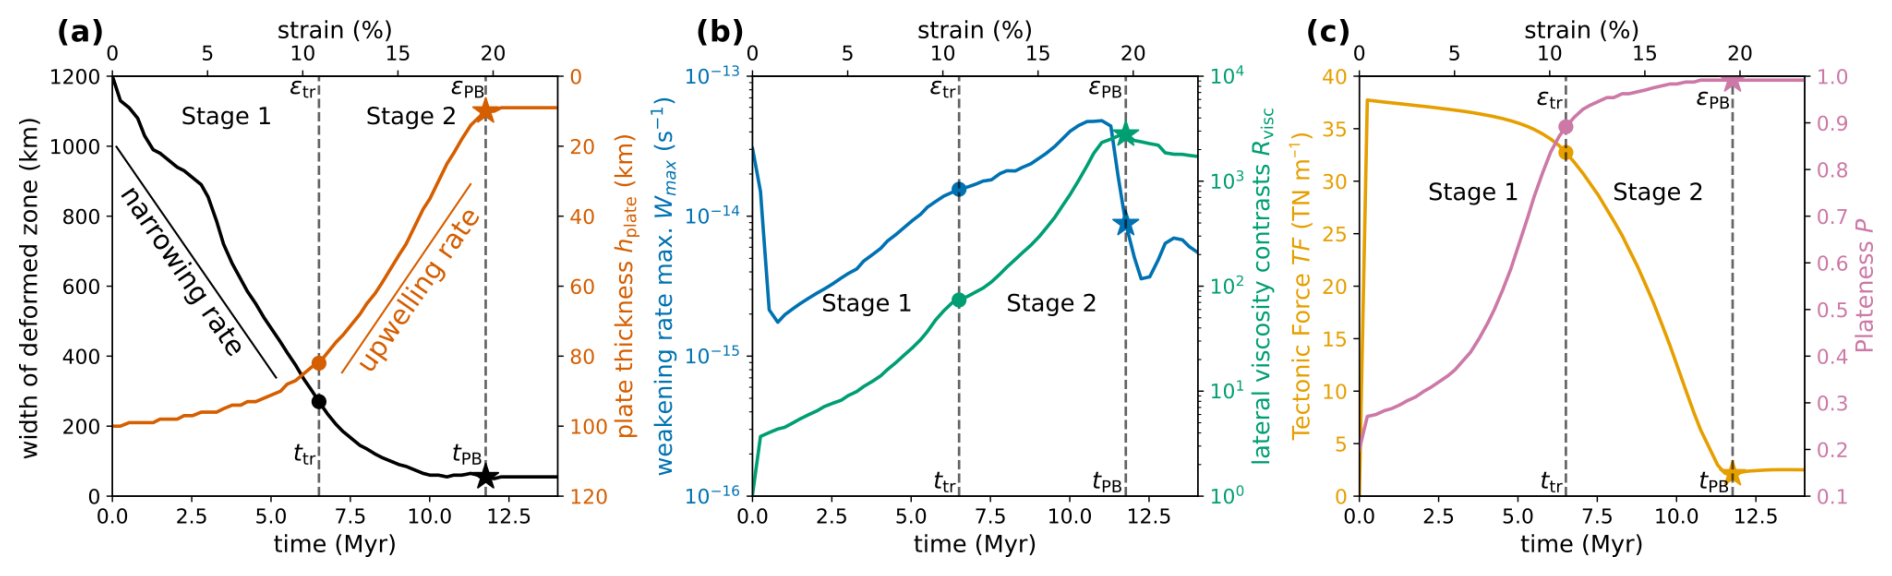
Figure 5Results for Simulation , ref-1. (a) Temporal evolution (and corresponding cumulative strain in %) of the width of deformed zone w (black) and minimum lithosphere thickness (orange) as defined in Sect. 3.1. Average narrowing and upwelling rates are calculated for Stage 1 and Stage 2, respectively. Rates can be expressed in km Myr−1 or in cm yr−1 (where 1 cm yr−1 = 10 km Myr−1). Temporal evolution (and corresponding cumulative strain in %) of (b) the maximum weakening rate (blue) within the lithosphere, defined as the region between the 273 and 1500 K isotherms at x=600 km (Eq. 11), and plate lateral viscosity contrast (green) Rvisc (Eq. 10), and (c) tectonic force (yellow) and plateness (pink). In all panels, vertical dashed lines indicate the transition time, ttr and the plate boundary time, tPB, also displayed on the curves by dots (for ttr) and stars (for tPB).
Table 3List of numerical simulations with a half-extension rate of 1 cm yr−1 and an initial plate age of 50 Myr. Reference simulations for scenarios of distributed deformation “distr. def.” (ref-0) or localized plate-boundary “loc. PB” (ref-1) are shown in Fig. 3a and b, respectively. The intermediate regime of incomplete localization “inc. loc.” is shown in Fig. D2c and f. The characteristic times of transition ttr and plate-boundary formation tPB are defined in Sect. 4.2.
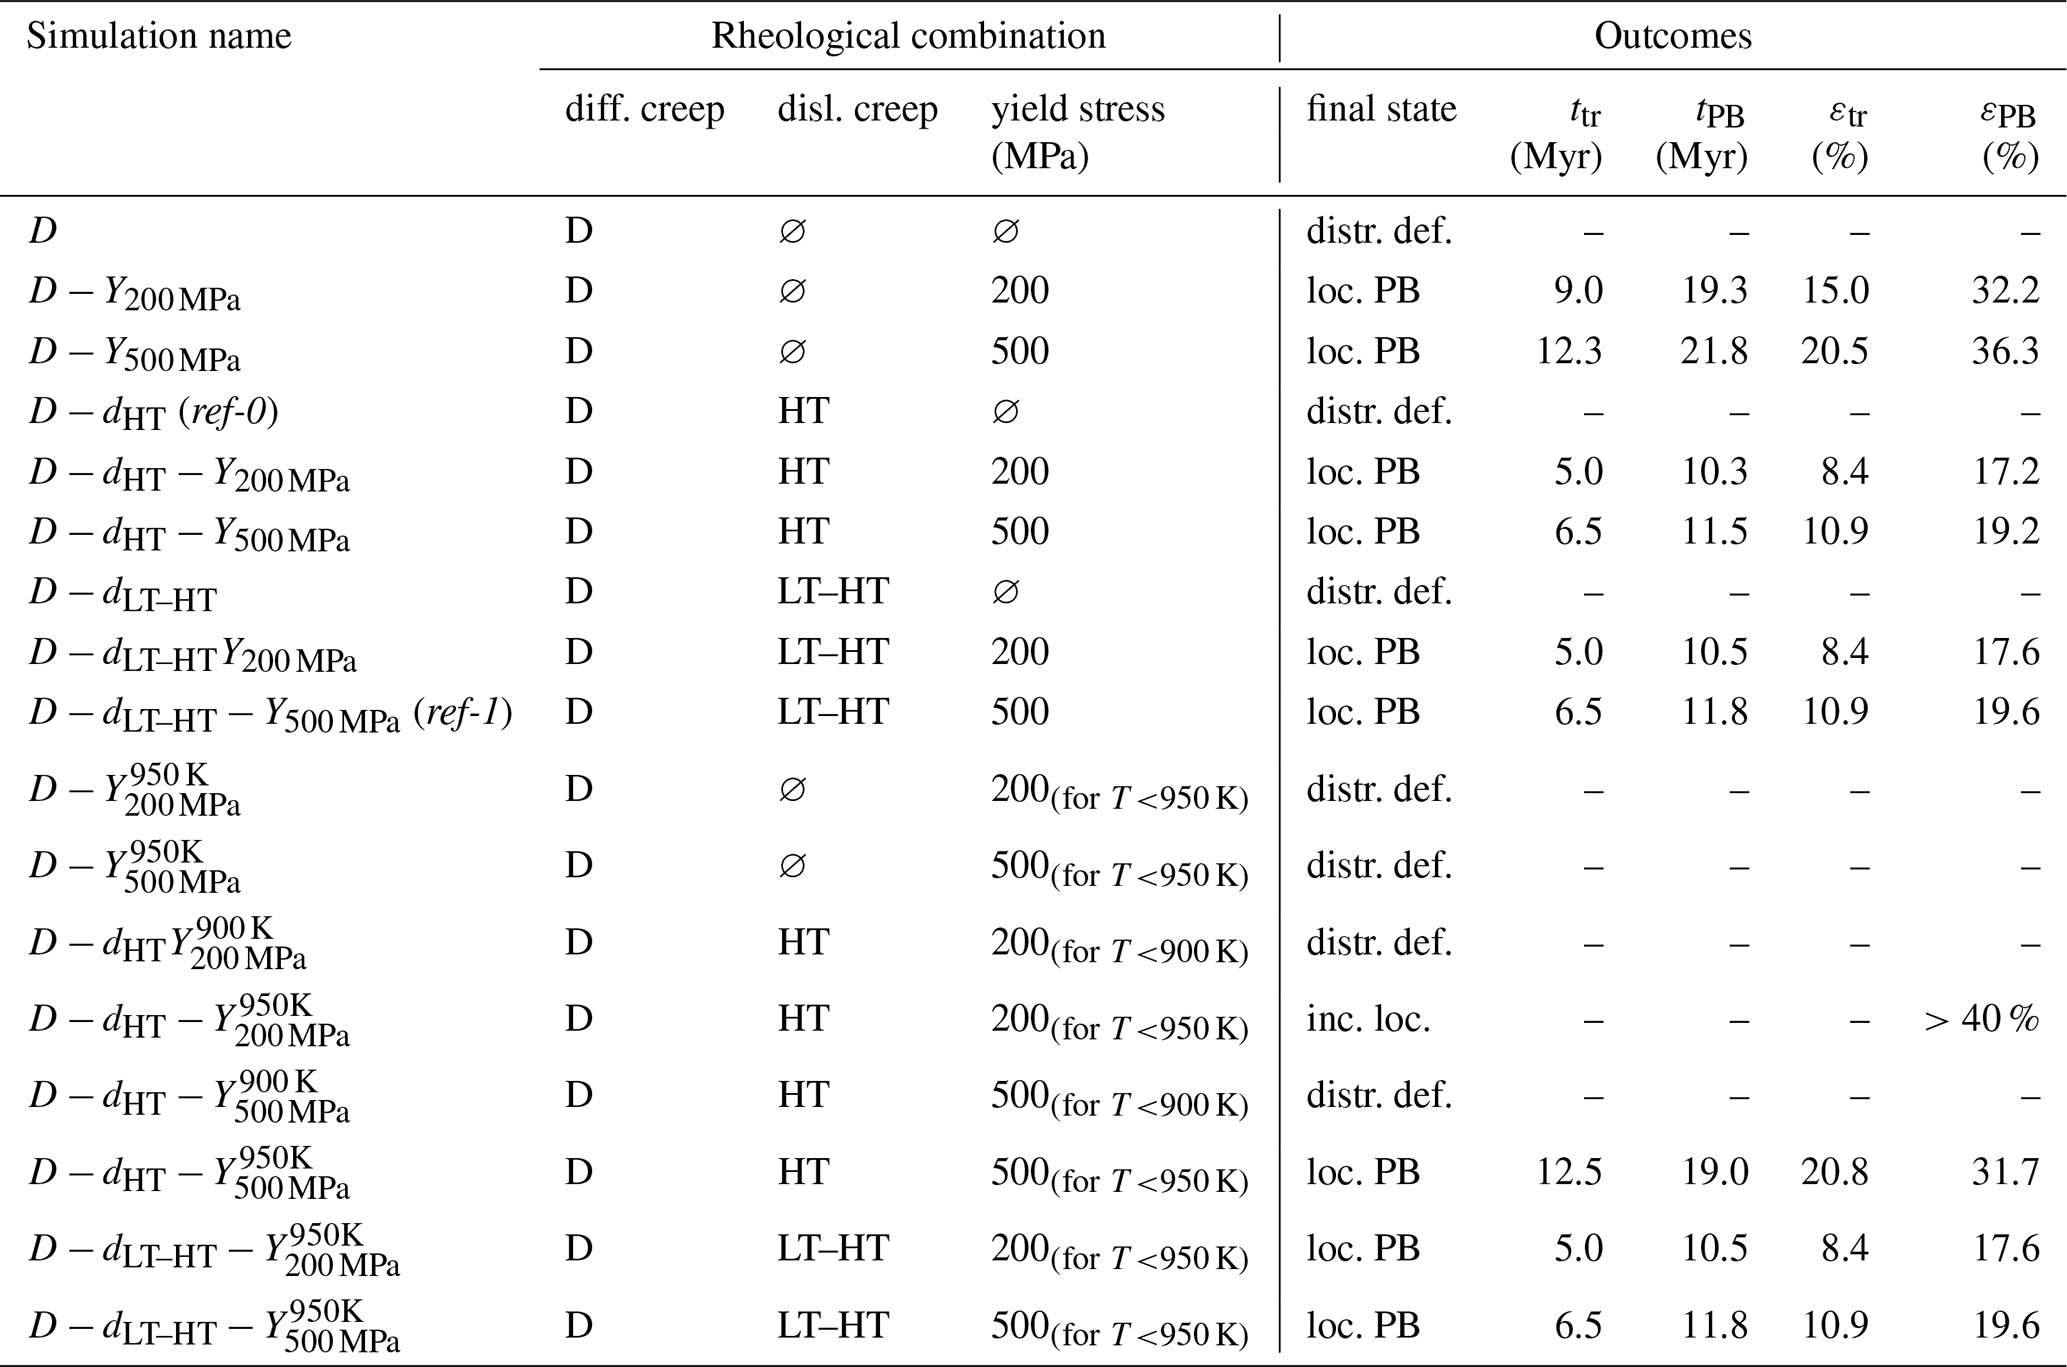
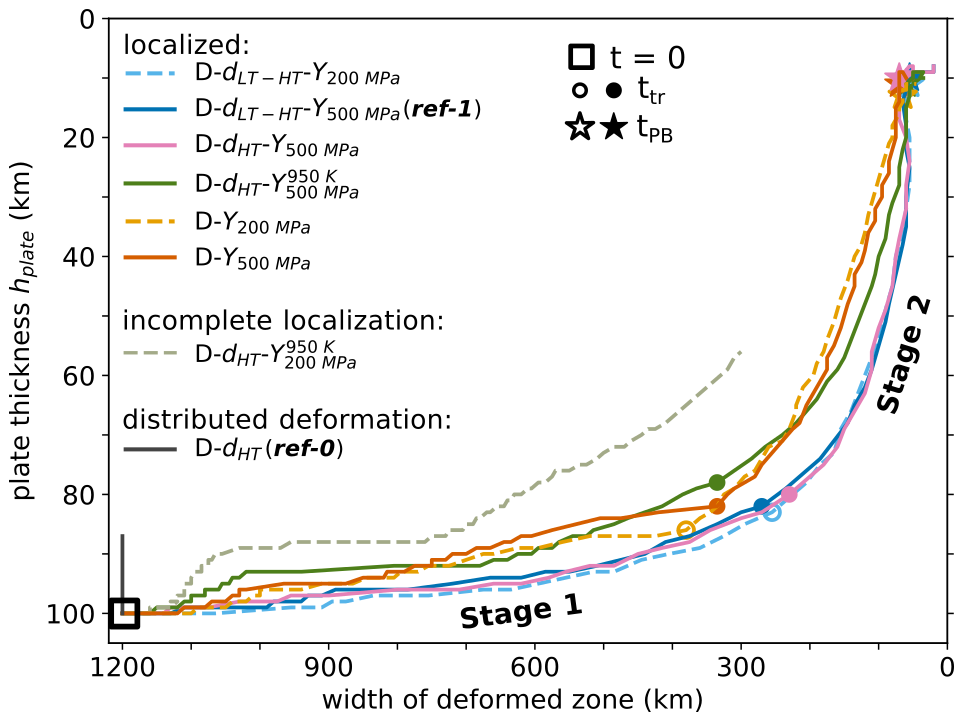
Figure 6Co-evolution of the minimum plate thickness hplate(t) as a function of the width w(t) of the deformed zone (see Sect. 3.2) for experiments with the same initial age (50 Myr) and extension velocity = 1 cm yr−1 for 8 different rheological combinations. The transition time ttr between Stages 1 and 2 is indicated by a circle symbol and the localization time tPB by a star symbol. Open and filled symbols correspond to rheologies with a yield stress set to 200 and 500 MPa, respectively. The square represent the initial time.
For Simulation ref-1, Stage 1 lasts 6.5 Myr and is characterized by rapid narrowing (mean 14 cm yr−1) with limited thinning (100 to 82 km in Fig. 5a). During this stage, weakening at the domain center is distributed through much of the lithosphere thickness (Fig. 4d) and exceeds off-center weakening (Fig. 4c), producing a growing but moderate viscosity contrast (Rvisc<50; Fig. 5b). In the plate interior outside the deforming zone, viscosity increases (hardening), particularly toward the end of Stage 1 (Fig. 4b).
Stage 2 lasts 5.5 Myr (from 6.5 to 12 Myr) and is characterized by rapid thinning (82 to 10 km) and a sharp reduction in tectonic force, whereas narrowing is slower (mean ∼ 4 cm yr−1; Fig. 5a). Weakening peaks shortly before tPB (Fig. 5b), while the lateral viscosity contrast continues to increase and reaches its maximum near tPB (Fig. 5b). After tPB, the system evolves toward a steady thermal structure around the mature boundary and the weakening rate in the narrow boundary region approaches zero (Fig. 4b).
4.3 Influence of rheological parameterization on localization scenario
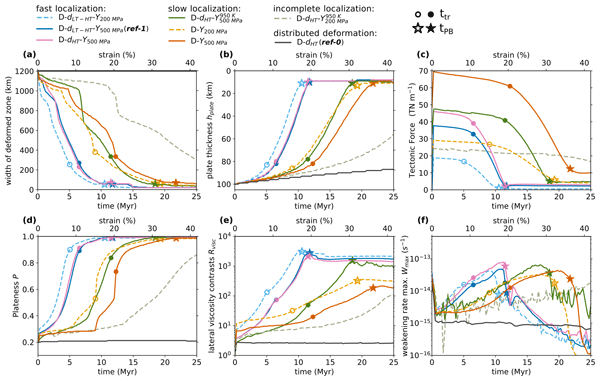
Across all rheological combinations, simulations that localize deformation follow the same two-stage trajectory defined in Sect. 4.2 (Fig. 6). Stage 1 is dominated by progressive narrowing of the deforming zone with only modest thinning, whereas Stage 2 is dominated by rapid plate thinning associated with focused asthenospheric upwelling and only limited additional narrowing (Fig. 7a–b). The major rheological control is therefore whether deformation localization occurs and how quickly the system progresses through the two stages, rather than the geometrical trajectory or the maximum weakening rate (10−13 s−1 for all simulations in Fig. 7f).
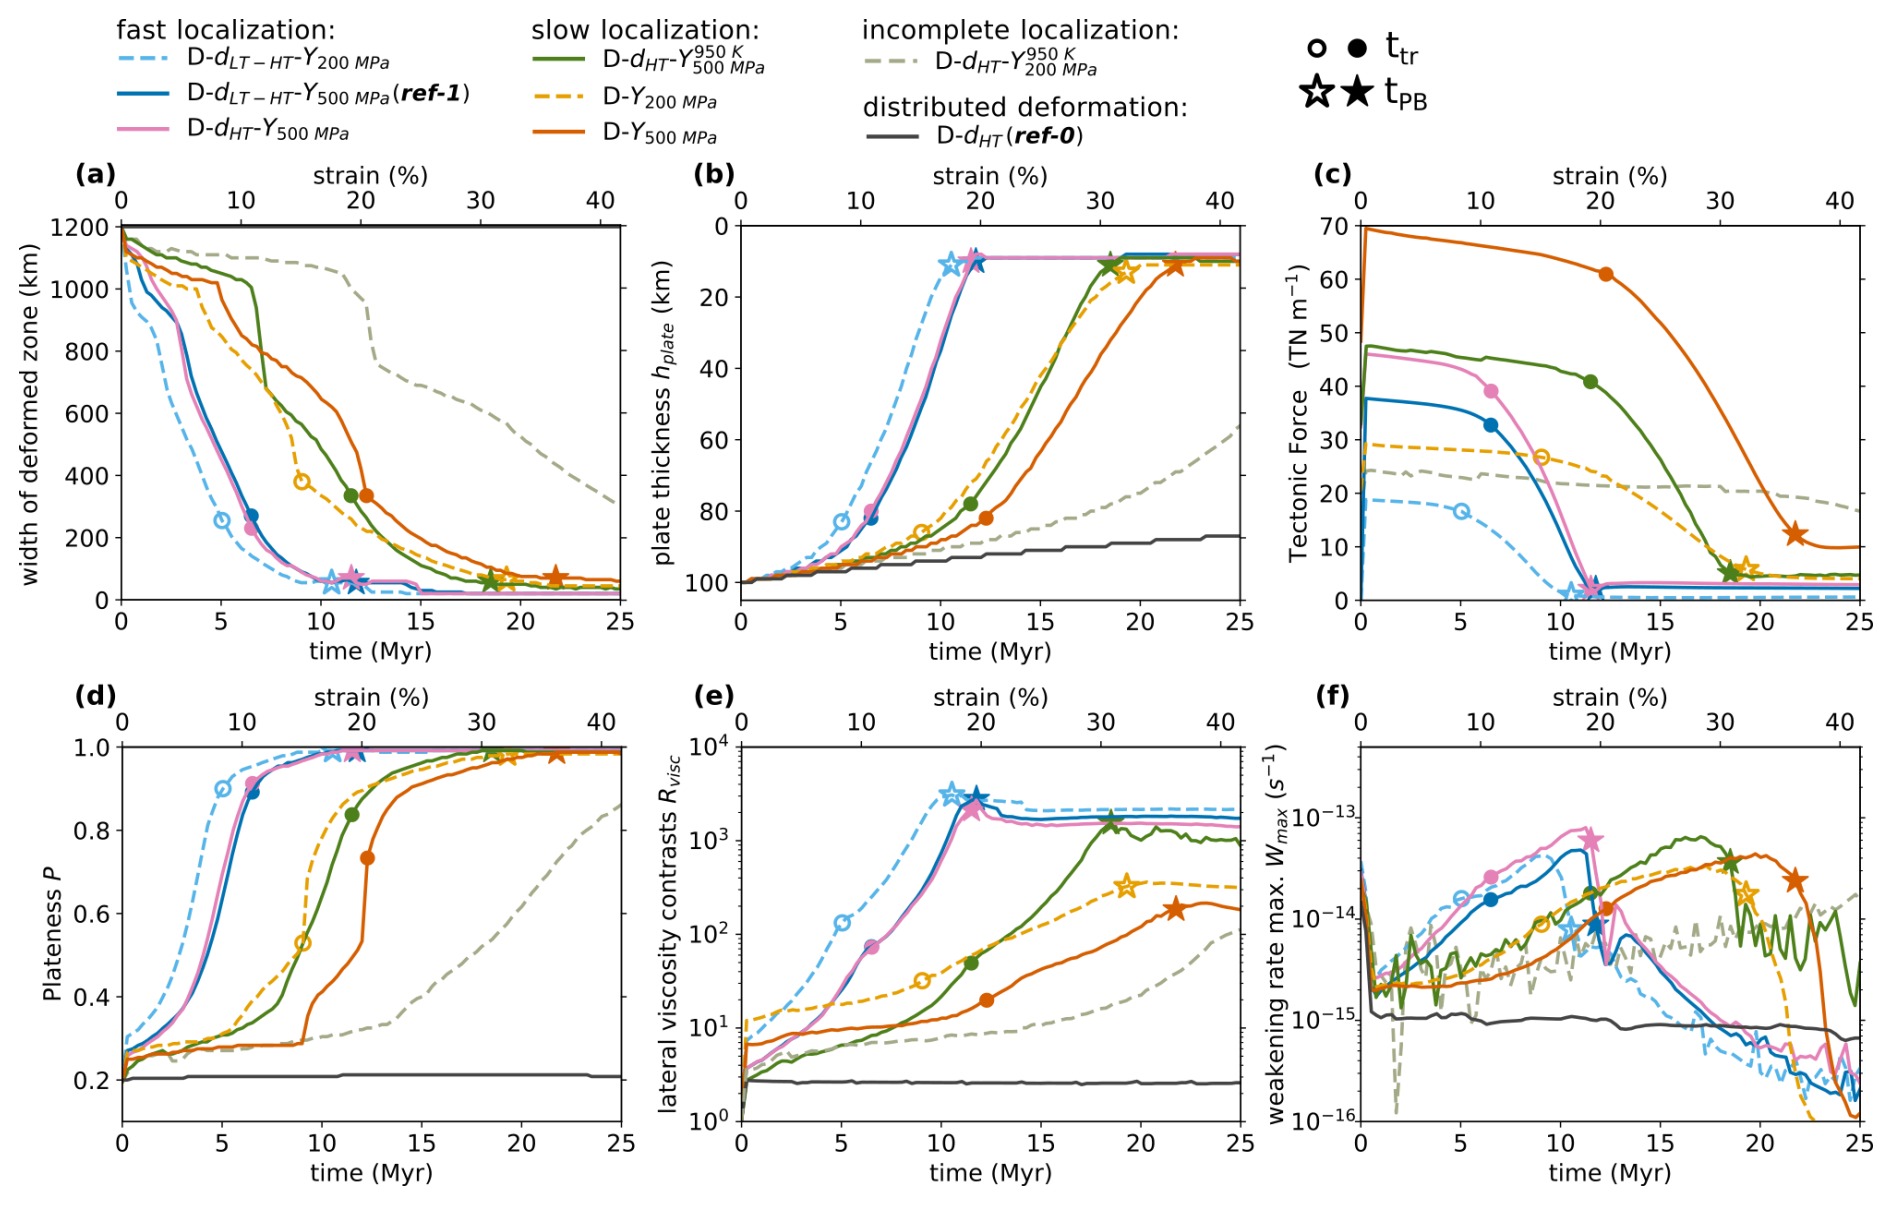
Figure 7Temporal evolution (and corresponding cumulative strain in %) of diagnostics for simulations with 8 different rheological combinations, and the same initial plate age (50 Myr) and extension velocity ( = 1 cm yr−1). (a) Width of deformed zone w, (b) hplate, minimum plate thickness along x, (c) tectonic force TF, (d) plateness P, (e) lateral viscosity contrast Rvisc, and (f) maximum weakening rate Wmax over the whole lithosphere thickness (T < 1500 K) at x = 600 km. In all panels, characteristic times are indicated by dots (ttr) and stars (tPB).
In simulations without a yield-stress cap, deformation remains distributed regardless of whether diffusion creep is combined with high-temperature dislocation creep or with low- to high-temperature dislocation creep (e.g., Simulation ref-0; Fig. 3a). Thus, in this lithospheric extension setup, dislocation and diffusion creep alone are insufficient to generate lithospheric-scale localization; additional weakening of the cold upper lithosphere (here provided by a yield-stress cap) is required.
Among simulations that do localize strain, the characteristic times vary substantially between rheologies (Table 3). Localization takes about twice as long for diffusion creep plus yield stress (e.g., D−Y200 MPa and D−Y500 MPa) and for cases in which yielding is restricted to temperatures below 950 K (e.g., ), than for rheologies that combine diffusion creep, dislocation creep, and yield stress (e.g., and ; Fig. 7a–b). Consistently, the tectonic force required to maintain the imposed extension velocity during Stage 1 is the largest for D−Y500 MPa (Fig. 7c), indicating a stronger deforming zone at the plate center, as also suggested by the low lateral viscosity contrast Rvisc (Fig. 7e).
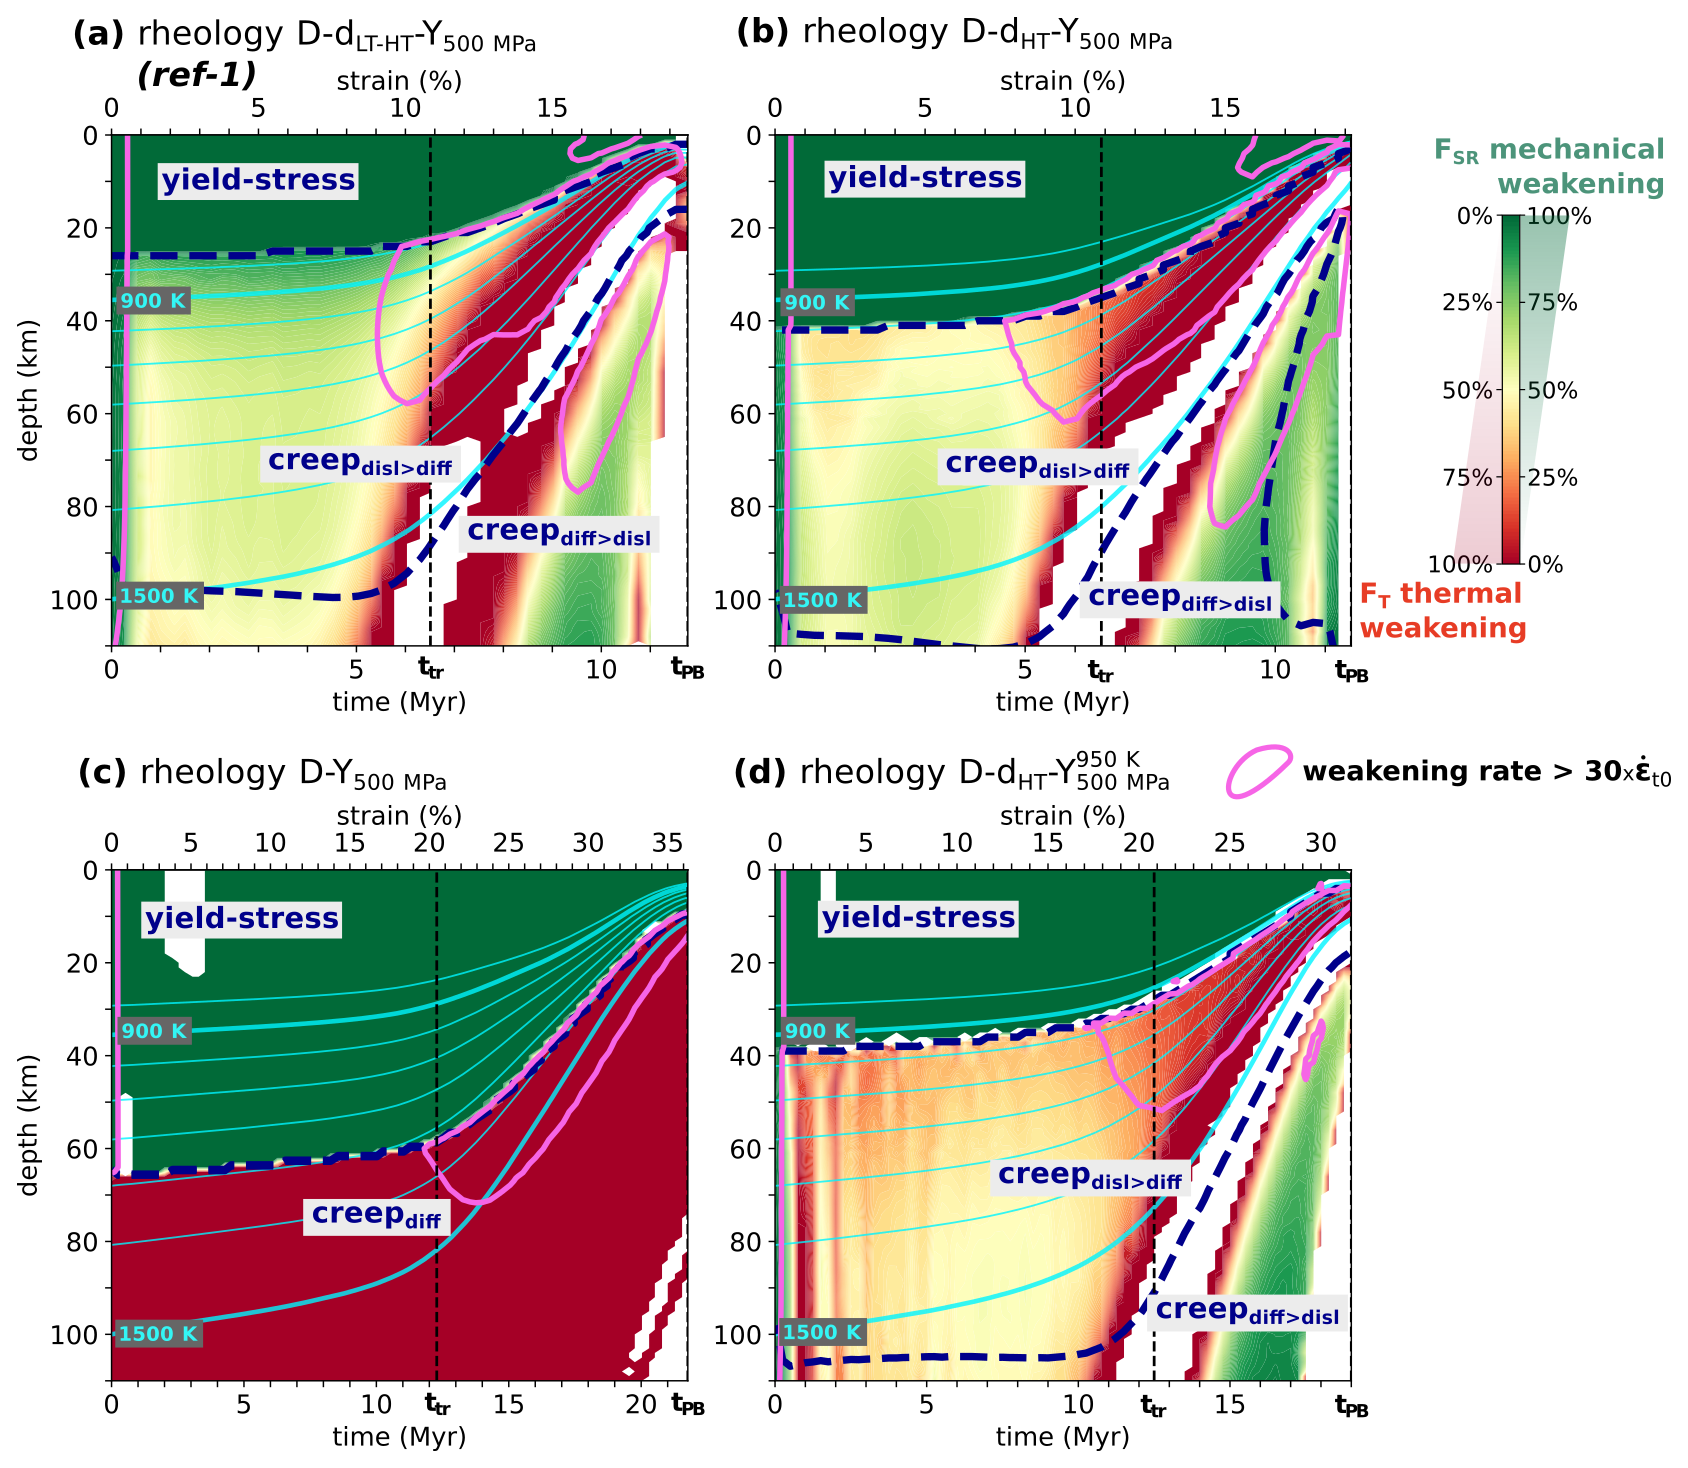
Figure 8Depth-time evolution of the relative contributions to weakening from strain rate (FSR) and temperature (FT), computed at box center x=600 km, for simulations (a) (Ref-1); (b) ; (c) D−Y500 MPa; and (d) . The diagnostics are calculated only in regions in weakening (W>0), with hardening or stable regions (W≤0) shown in white. The color scale is capped between 0 and 1. Areas of intense weakening, where the weakening rate normalized by the initial strain rate in the plate exceeds 30, are highlighted by pink contours. Boundaries between dominant deformation mechanisms are marked by dashed dark-blue lines, and isotherms from 800 to 1500 K are displayed in light blue.
We interpret these differences using the weakening-partition diagnostics (Sect. 3.3), which quantify the relative contributions of strain-rate increase (FSR) and temperature increase (FT) to viscosity reduction (Fig. 8). In all simulations, the shallow lithosphere is yield-dominated and weakening is purely strain-rate driven there (FSR=1). Differences emerge in the deeper lithosphere, where deformation transitions to creep and where maximum weakening occurs. The temperature of the yield-to-creep transition depends strongly on the creep rheology: it is highest for diffusion creep alone (about 1300 K in D−Y500 MPa), lower when high-temperature dislocation creep is included (about 1000 K in ), and the lowest when low- to high-temperature dislocation creep is included (about 800 K in ; Fig. 8). These shifts imply that a thicker portion of the lithosphere deforms in the creep regime when dislocation creep is included, extending thermo-mechanical weakening to lower temperatures.
The weakening-partition diagnostics further show that dislocation creep enables both mechanical and thermal weakening within the creeping lithosphere. In rheologies that include dislocation creep, weakening is predominantly strain-rate driven during Stage 1 (typically FSR>60 % in the main weakening zone), while weakening becomes almost purely temperature-driven during Stage 2 (typically FT>0.9; Fig. 8a, b). In contrast, for diffusion creep plus yield stress, weakening in the creeping domain is entirely temperature-driven (FT≥1; Fig. 8c), limiting mechanical weakening during Stage 1 and delaying the onset of rapid thinning.
This interpretation is illustrated by Fig. 9, which shows theoretical viscosity profiles for two idealized end-member evolutions: a 10-fold increase in strain rate at constant plate age, used as a proxy for Stage 1, and plate thinning at constant strain rate, used as a proxy for Stage 2. For a given creep law, the effect of a Stage-1-type strain-rate increase can be estimated from the viscosity contrast between the yield-creep transition and the warm sub-lithospheric layer at about 75 km depth (Fig. 9b). By this measure, the mechanical weakening associated with LT–HT dislocation creep (6-fold) is intermediate between that associated with HT dislocation creep (5-fold) and that associated with the yield-stress-plus-diffusion-creep rheology (10 or 1-fold). However, the 10-fold strain rate increase during Stage 1 produces the lowest absolute viscosities below the yield-creep transition. The same approach can be used to estimate the amplitude of Stage-2-type thermal weakening from the viscosity change accompanying lithospheric thinning and warming (Fig. 9d). Although the viscosity reduction associated with lithospheric warming is largest for diffusion creep (>100) and smallest for LT–HT dislocation creep (<40), the absolute viscosity reached after a given amount of warming and thermal rejuvenation remains lower when dislocation creep is included (Fig. 9c).
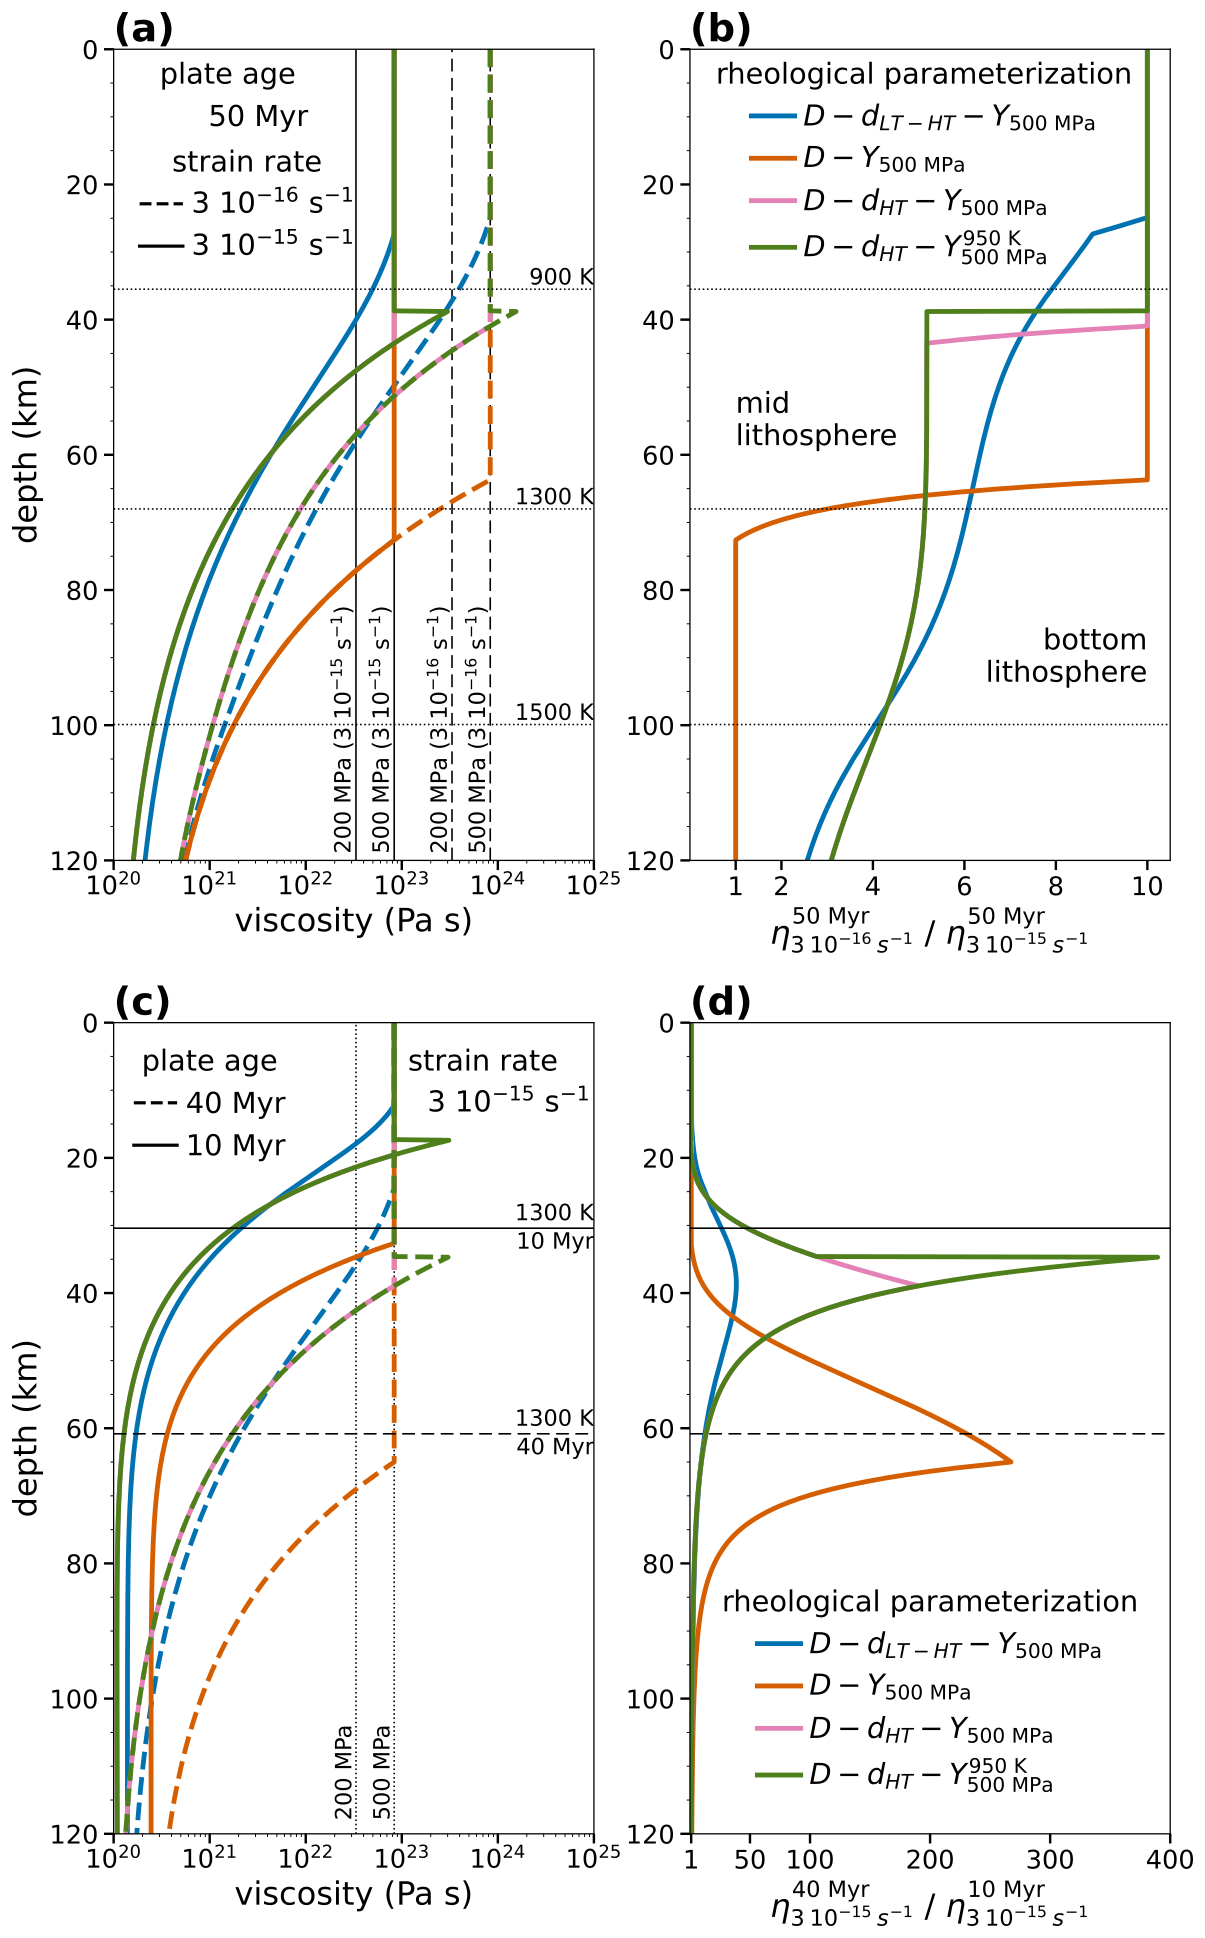
Figure 9Theoretical (a, c) viscosity profiles, and (b, d) viscosity ratio illustrating (a–b) the effect of a 10-fold increase in strain rate with constant plate age of 50 Myr (proxy of Stage 1 evolution if temperature increase is neglected), and (c–d) the effect of thermal-structure variations associated with decreasing plate age from 40 to 10 Myr at a constant strain rate of 3 × 10⁻¹⁵ s−1 (proxy of plate thinning in Stage 2 assuming no mechanical contribution). Profiles are computed for 4 rheologies, with vertical black lines in panels (a) and (c) indicating yield viscosities corresponding to 200 or 500 MPa (Eq. 8).
Finally, in a subset of simulations, yielding is restricted to low temperature to disable pseudo-brittle mechanism above 950 K, leaving only creep mechanisms at higher temperatures (Sect. 2.2.1). This produces a marked delay even when dislocation creep is present (compare and ; Table 3). Vertical profiles for the case show that imposing a thermal cutoff on the yield rheology creates a stiff layer less than 4 km thick at the base of the shallow yielding domain, between the colder lithosphere above and the warmer creeping mantle below (Appendix C). Although thin, this layer remains mechanically important because it forms a local viscosity peak that slows the overall decrease in viscosity throughout the whole lithosphere, which in turns delays deformation focusing. This highlights the importance of capping the lithosphere strength in the creep domain within the mid-lithosphere temperature range (roughly 800–1300 K in these setups): even a thin stiff layer at these depths (Fig. 9) is sufficient to impede Stage 1 narrowing and to delay both ttr and tPB (Figs. 6, 7; Table 3). This explains why lowering the yielding cutoff to 900 K inhibits localization within the simulated strain window (Table 3). Additional resolution tests show that, despite its striking sharpness, the presence of this high-stiffness layer is well resolved, and is thus a robust result (Sect. S1 in the Supplement).
4.4 Influence of initial plate age and imposed extension rate
We test the robustness of the two-stage localization pathway and its sensitivity to: (i) the initial thermo-mechanical state of the lithospheric mantle and (ii) the magnitude of far-field forcing. We vary initial plate age (from 10 to 100 Myr), and the imposed half-extension rate (from 0.2 to 5 cm yr−1). We focus on two rheological combinations that exhibit markedly different rates of strain localization in the reference setup (Fig. 7): diffusion creep plus yield stress (D−Y500 MPa), and diffusion creep plus low-to-high-temperature dislocation creep plus yield stress () (Table 4).
Across most age-velocity combinations, the localization trajectory remains fundamentally characterized by a two-stage scenario: Stage 1 is characterized by progressive narrowing of the deforming zone, while plate thickness changes only modestly; Stage 2 is characterized by rapid plate thinning associated with asthenospheric upwelling, with comparatively minor additional narrowing (Appendix D). The basic control on characteristic times is the extension rate, whereas initial plate age exerts only a weak influence (Fig. 10a, b). This set of experiments further underlines that dislocation creep accelerates deformation localization relative to diffusion creep plus yield stress. For a given extension rate, the dislocation-creep rheology produces lower effective viscosity in the central deforming zone (typically by a factor of 5 to 10 at ttr), which increases the lateral viscosity contrast between the weak zone and the plate interior and reduces the tectonic force required to maintain the imposed velocity (Fig. 10e, g). This enhanced strength contrast is expressed primarily through Stage 1: for all tested ages and velocities, the Stage 1 duration (measured by strain at ttr) is shorter when using dislocation creep, while the differences in Stage 2 timing are smaller and diminish further as extension rate increases.
Table 4List of simulations investigating different lithospheric ages at spreading onset and half-spreading rates . Three rheological combinations are tested (first column). The last two columns list the average strain obtained at the characteristic times of transition ttr and plate-boundary tPB, respectively (Sect. 3). The initial strain rate in the plate () is spatially uniform and equal to: 7.47 × 10⁻¹⁷, 1.87 × 10⁻¹⁶, 3.73 × 10⁻¹⁶, 7.47 × 10⁻¹⁶ and 1.87 × 10⁻¹⁵ s−1 respectively for = 0.2, 0.5, 1, 2 and 5 cm yr−1.
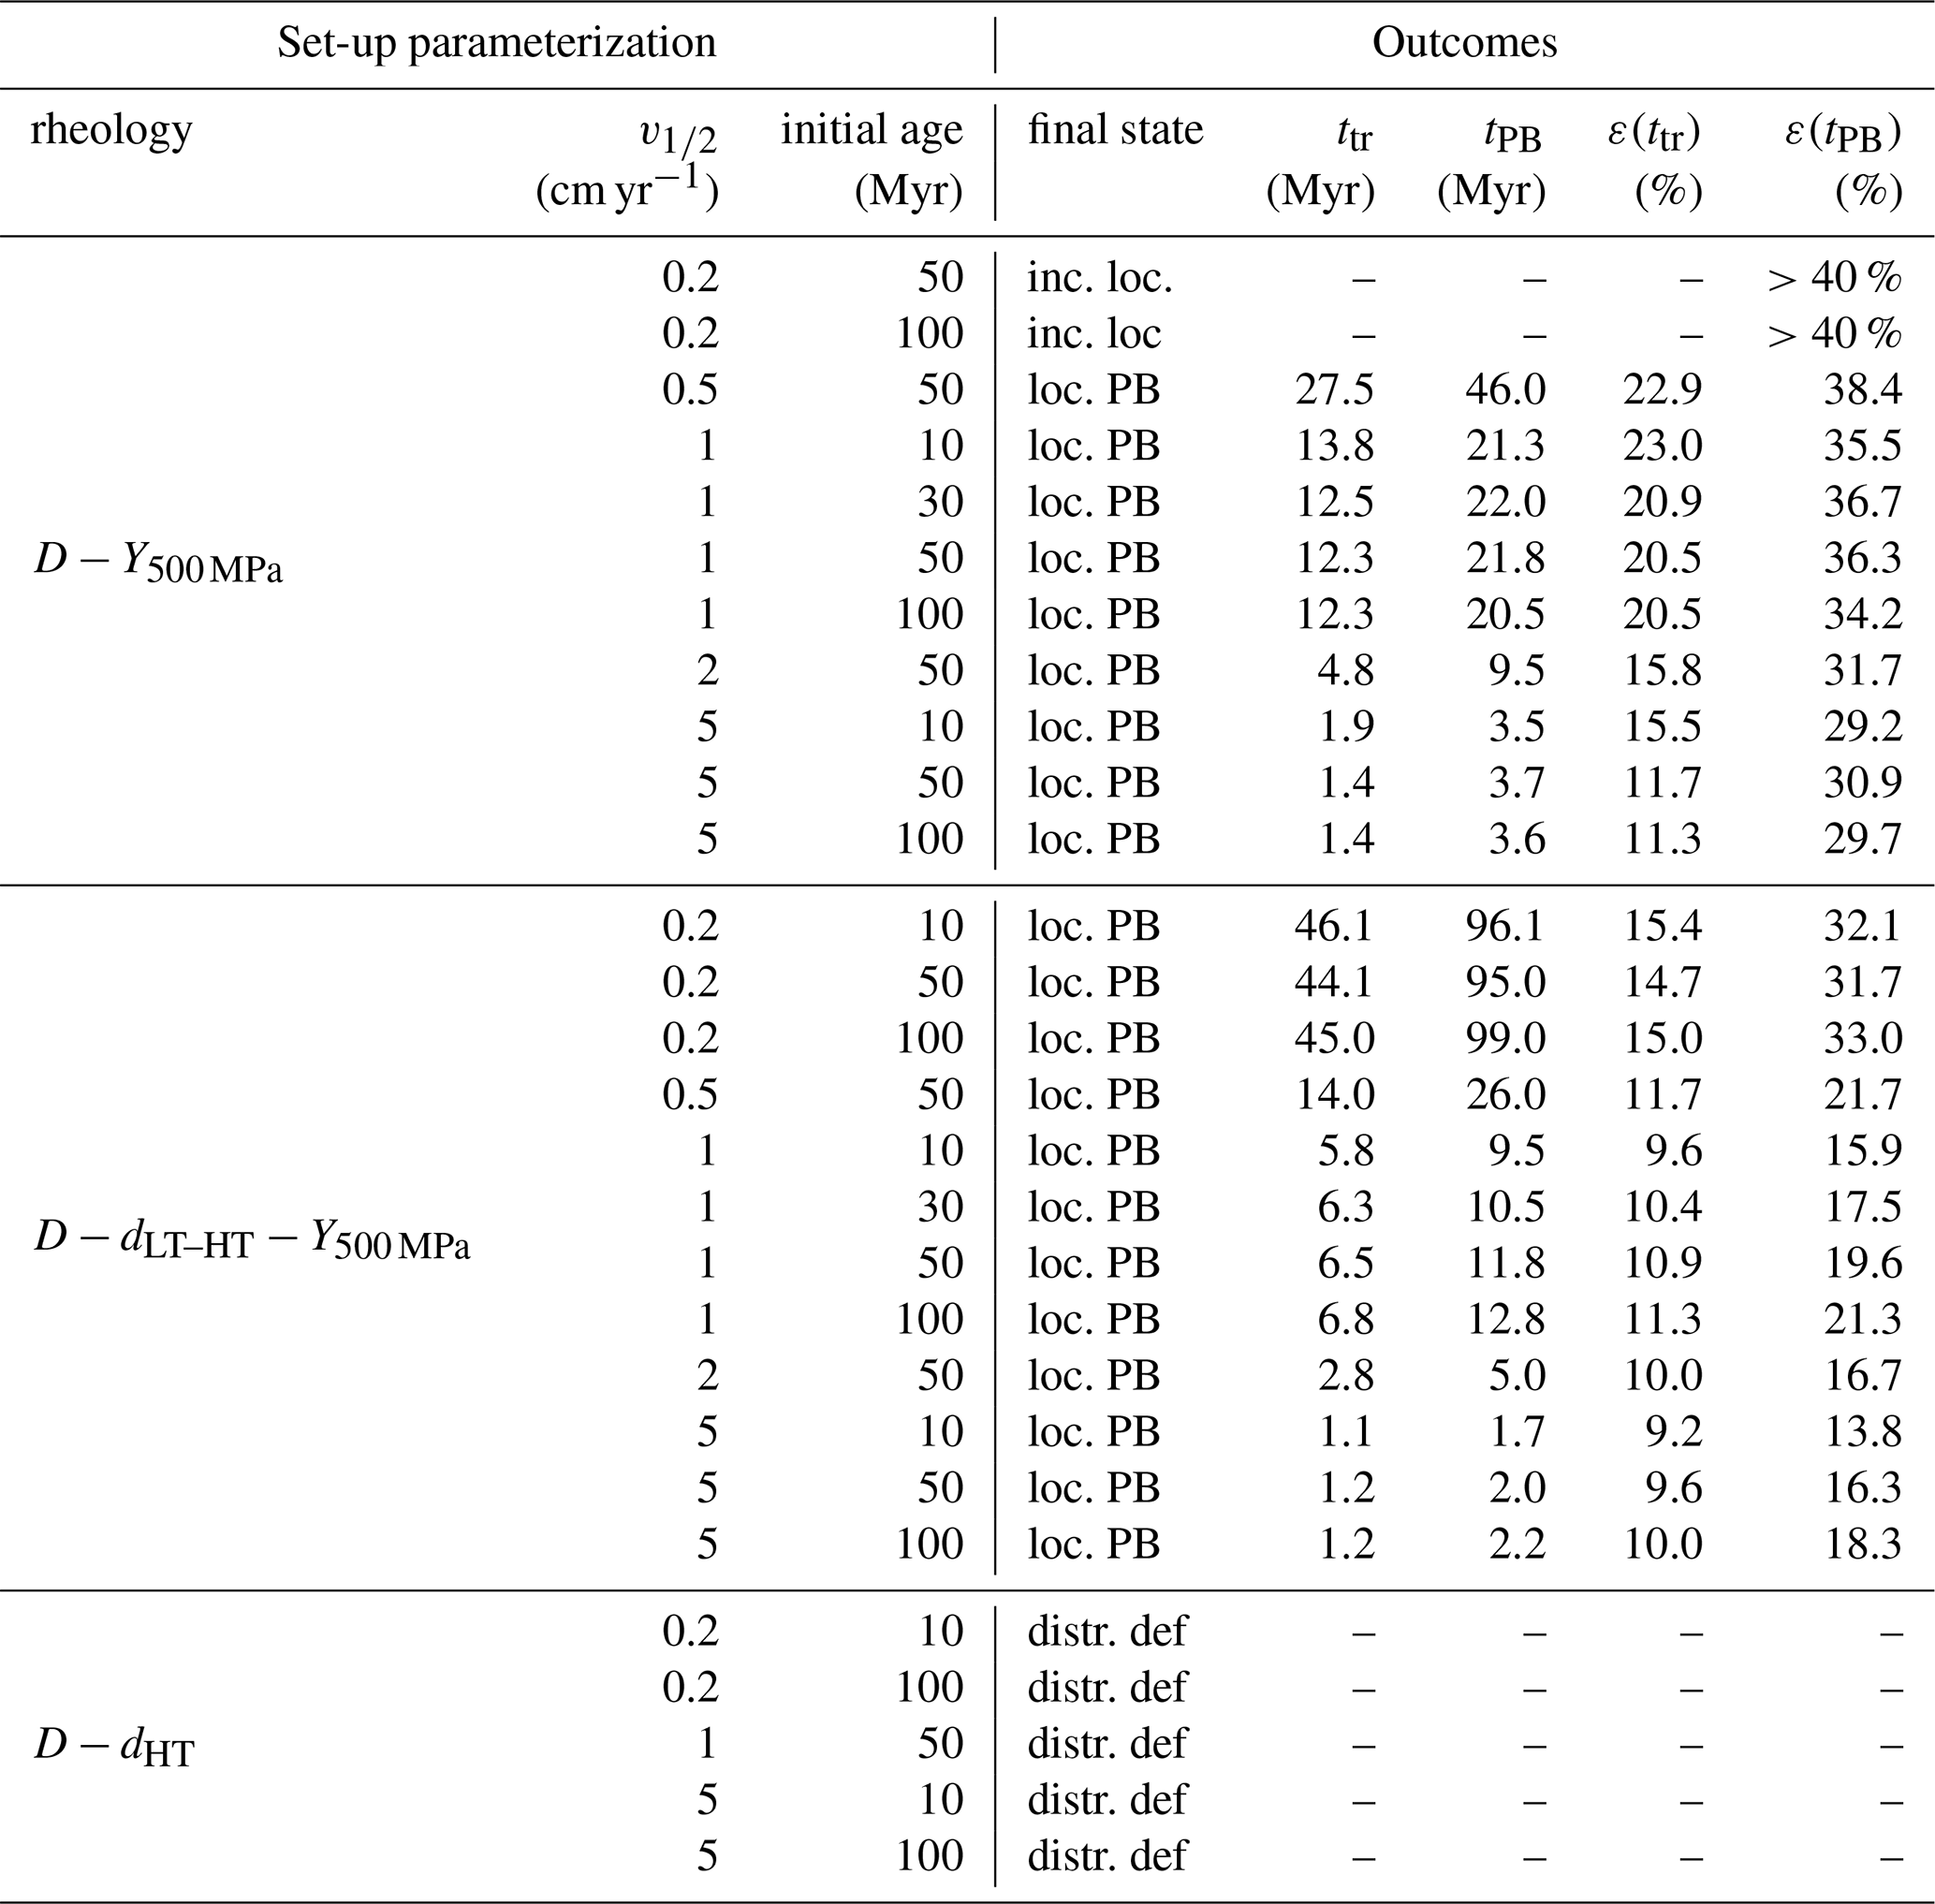
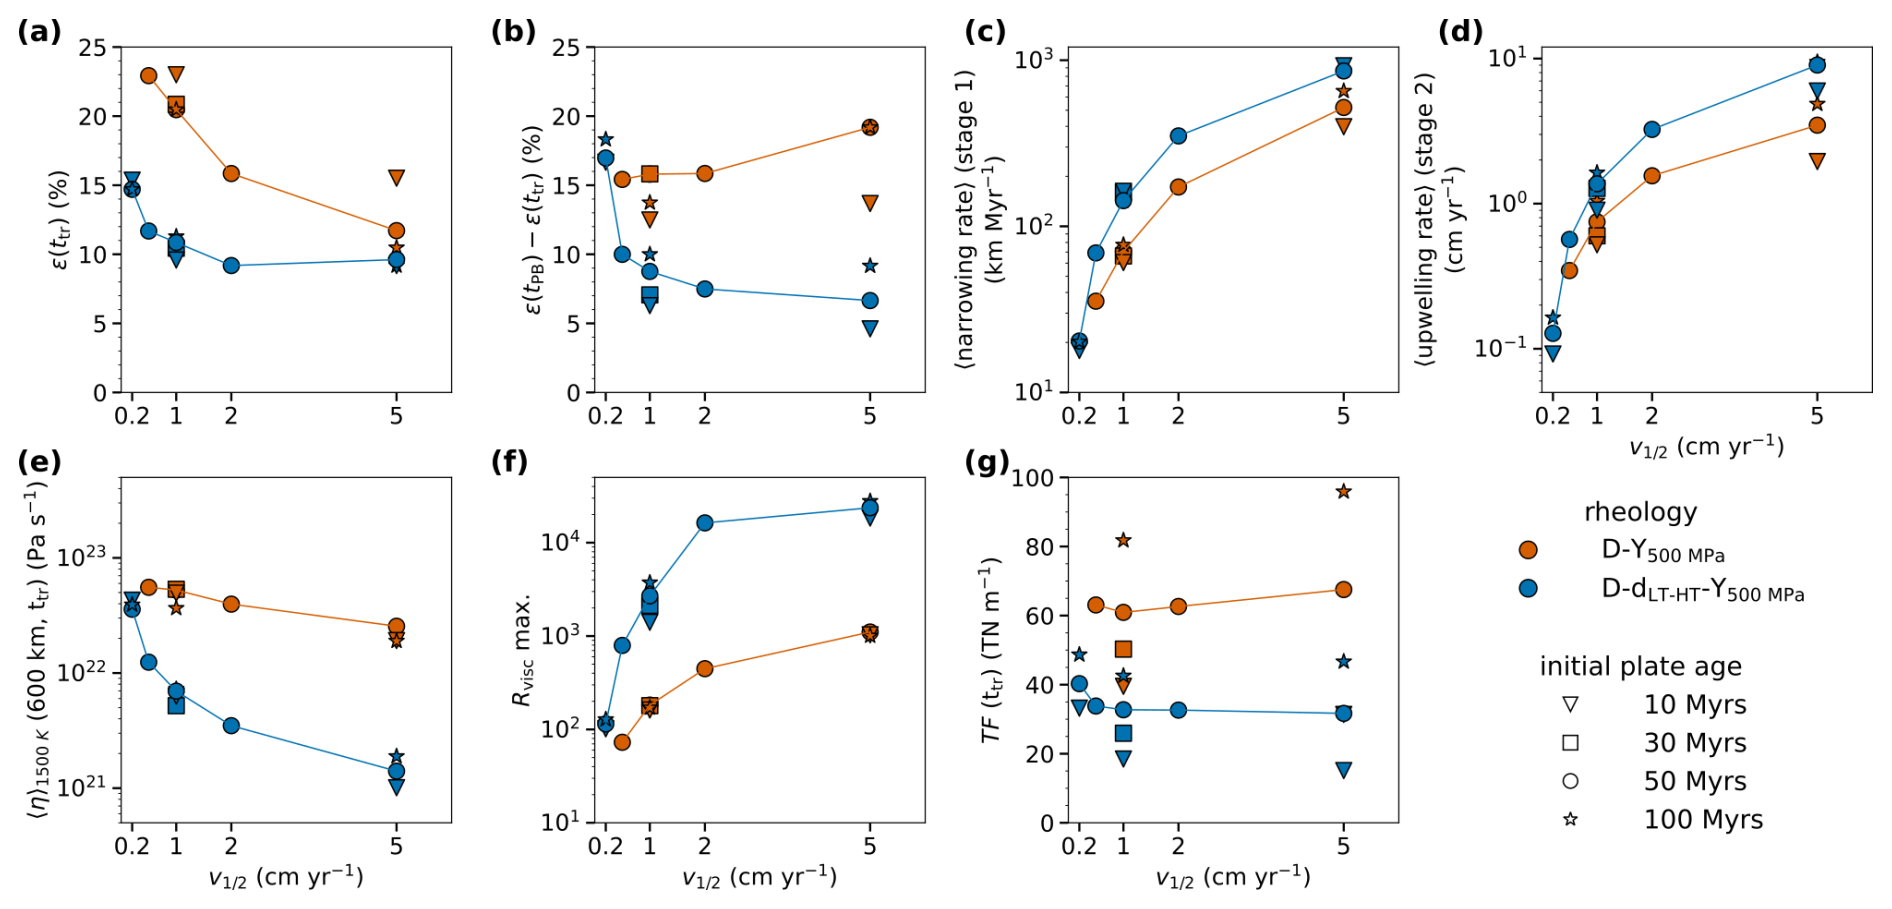
Figure 10Diagnostics as a function of half-extension velocity for two different rheologies, D−Y500 MPa (red) and (blue). Symbols represent initial plate ages ranging from 10 to 100 Myr. (a) Strain ε(ttr), used as a proxy for the duration of Stage 1. (b) Difference ε(tPB)−ε(ttr) used as a proxy for duration of Stage 2. (c) Mean narrowing rate during Stage 1. (d) Mean upwelling rate during Stage 2. (e) Effective viscosity vertically-averaged over the lithosphere thickness (T < 1500 K) at ttr and at horizontal position x=600 km. (f) Maximum lateral viscosity contrast (Rvisc max.) during the two stages, with a maximum reached around tPB. (g) Tectonic force TF at time ttr. In all panels, solid lines connect the markers corresponding to the initial lithospheric age of 50 Myr, used as a reference age.
Extension rate strongly modulates Stage 1 duration. Faster extension increases strain rate within the deforming zone, lowering effective viscosity via both yielding and (where active) dislocation creep, thereby increasing the narrowing rate (Fig. 10c, e). As a result, the total strain required to reach the transition from Stage 1 to Stage 2 decreases systematically with extension rate for both rheologies (Fig. 10a). In contrast, the Stage 2 duration is comparatively insensitive to extension rate for cm yr−1 (Fig. 10b), even though upwelling rates increase with extension rate (Fig. 10d). The maximum lateral viscosity contrast increases with extension rate up to ∼ 2 cm yr−1 and then saturates (Fig. 10f), suggesting that once a sufficiently weak plate boundary is formed, it cannot weaken much further at higher extension rates.
Only the slowest forcing conditions fail to localize within the simulated strain window, and this occurs exclusively for the diffusion-plus-yield rheology. For old plates (50–100 Myr) extended at cm yr−1, localization remains incomplete by 40 % strain (Table 4). In these cases, thermal diffusion can outweigh extensional thinning during early deformation, leading to net lithosphere thickening and delayed weakening (Appendix D; Figs. D1 and D2). Even in cases that eventually localize at low velocities or for initially young plates, the resulting plate boundary remains relatively wide and thick, and the maximum viscosity contrast remains modest (Rvisc≲200 at tPB; Fig. 10f), indicating a weaker degree of focusing than in faster-extension cases.
The weakening-partition diagnostics clarify how forcing modulates feedbacks. At low extension rates (and in some young-plate cases, early in Stage 1), thermal hardening associated with cooling competes with mechanical weakening, such that net weakening in the creeping lithosphere is dominated by strain-rate effects (note that FSR can exceed 1 where temperature decreases while strain rate increases, Sect. 3.3). For the dislocation-creep rheology, this strain-rate-driven weakening extends to higher temperatures within the creeping lithosphere (up to ∼ 1300 K), supporting continued narrowing despite thermal hardening. By contrast, for diffusion creep plus yield stress, weakening below the yielding layer remains predominantly thermal; when cooling dominates early, the system remains in a thick yielding-dominated configuration that inhibits rapid focusing, contributing to incomplete localization under the slowest forcing.
Taken together, our results show that lithospheric-scale strain localization in this extensional setting is not controlled solely by the integrated strength of the plate. It also depends on where weakening develops within the lithosphere and on how rheology promotes deformation focusing. Indeed, rheology modulates the positive feedbacks linking strain narrowing, lithosphere thinning and asthenosphere upwelling, leading to further weakening and an increase in lateral viscosity contrasts, thereby driving the dynamics of plate boundary formation. Three main conclusions emerge. First, simulations showing deformation localization follow a robust two-stage evolution, with progressive narrowing followed by rapid plate thinning. Second, dislocation creep accelerates localization by extending thermo-mechanical weakening into a broader portion of the creeping lithosphere. Third, even a thin stiff layer in the mid-lithosphere can markedly delay plate-boundary formation, implying that simplified weak-plate parameterizations may miss an important control on localization efficiency. In the following, we discuss these points in turn and consider their implications for natural rifting and for large-scale geodynamical models.
5.1 A two-stage pathway to plate-boundary formation
A robust result of this study is that all simulations that successfully localize strain follow the same two-stage pathway to plate-boundary formation, irrespective of the rheological parameterization (Fig. 6). In Stage 1, deformation mainly focuses laterally: the width of the deforming zone decreases rapidly, whereas plate thickness changes only modestly. In Stage 2, the localization pattern shifts to rapid plate thinning driven by focused asthenospheric upwelling, while additional narrowing becomes limited. The transition between these two stages therefore marks the point at which a progressively focused deforming region evolves into a rapidly thinning lithosphere, at the end of which a mature plate boundary is achieved.
This two-stage behavior provides a simple physical framework for interpreting the localization process. Stage 1 is primarily a focusing problem, in which viscosity reduction within the deforming zone, allowed by non-Newtonian rheology, progressively increases the contrast with the surrounding plate interior. Stage 2 is primarily a thinning process, in which upwelling and heating beneath the localized zone further reduce temperature-dependent viscosity and accelerate lithospheric thinning. In that sense, the transition time ttr represents a dynamical tipping point: beyond it, thermal weakening associated with asthenospheric upwelling becomes dominant and plate-boundary development proceeds rapidly.
A broadly comparable two-stage evolution has been inferred for some natural rift systems: the Atlantic and Australia-Antarctica rifts have probably undergone an early stage of deformation, at (total) extension rates slower than 1 cm yr−1, lasting ∼ 25–50 Myr, followed by an abrupt acceleration of extension over only 2–10 Myr (Brune et al., 2016). This acceleration is interpreted as the consequence of “the rapid decrease of rift strength” in constant-force rifting models (Brune et al., 2016), and of “a positive feedback loop between extension velocity and rift strength loss” in whole-mantle convection models (Ulvrova et al., 2019). Our models do not reproduce such settings directly, particularly because extension is imposed kinematically rather than through a self-consistent far-field force balance.
We performed additional simulations with either an abrupt or a linear temporal increase of extension velocity imposed at side boundaries (Supplement, Sect. S5.1), in which the tectonic force TF remains quasi-constant during Stage 1 before abruptly dropping during Stage 2. As in the constant-extension velocity models, Stage-1 narrowing is dominated by mechanical weakening, while Stage 2 is associated with thermal weakening with rapid TF decrease and fast plate thinning (Figs. 7, 8). We speculate that imposing forces or stresses at side boundaries, instead of imposing velocities, would result in a decrease in plate strength at time ttr, and an increase in extension velocity, as predicted by rifting models and reconstructed in the natural rifting cases (Brune et al., 2016). Thus, we propose that rifting acceleration in nature may correspond to a geodynamic tipping point with thermal weakening of the lithospheric mantle enhancing plate strength drop, thus further promoting plate extension.
5.2 Importance of enabling thermo-mechanical weakening through dislocation creep
The clearest rheological result of this study is that simulations including dislocation creep localize deformation substantially faster than those with yield stress plus diffusion creep alone (Table 3; Fig. 7a, b). This difference does not arise simply because the plate is weaker in some bulk sense. Rather, dislocation creep changes where and how weakening operates within the lithosphere and enhances the feedbacks leading to deformation localization: faster narrowing or thinning increases mechanical or thermal weakening, causing the decrease in viscosity at the domain center (associated with efficient focusing of deformation in Stage 1 and with rapid central upwelling in Stage 2), thereby increasing the lateral viscosity contrast, which in turn further enhances narrowing or thinning, and so on.
When dislocation creep is included, the transition from yield-dominated to creep-dominated deformation occurs at lower temperatures, so a larger fraction of the lithosphere participates in creep deformation (Fig. 8). In practice, this extends weakening into colder parts of the deforming plate, particularly through the approximate 800–1300 K interval. As a result, dislocation creep broadens the part of the lithosphere that can respond dynamically to both increasing strain rate and increasing temperature, thereby enabling positive feedbacks over a thicker region.
The weakening-partition diagnostics show that this has two important consequences. First, during Stage 1, dislocation creep allows significant strain-rate-driven weakening within the creeping lithosphere, which promotes faster narrowing of the deforming zone. Second, during Stage 2, it permits stronger temperature-driven weakening over a thicker part of the lithosphere, which accelerates plate thinning once focused asthenospheric upwelling is established. In contrast, in diffusion-creep-plus-yield-stress simulations, weakening below the shallow yielding layer is almost entirely thermal, limiting mechanical weakening during Stage 1 and delaying the onset of rapid thinning (Fig. 8).
This difference is also consistent with the analysis of the theoretical viscosity profiles shown in Fig. 9 (Sect. 4.3). Relative to diffusion creep plus yield stress, rheologies including dislocation creep produce the lowest viscosity associated with both mechanical weakening during a Stage 1-type strain-rate increase and stronger thermal weakening during a Stage 2-type thinning trajectory. In addition, dislocation creep extends both effects to lower temperatures and shallower depths. The main consequence is therefore not simply a lower viscosity, but a stronger coupling between deformation focusing, asthenospheric upwelling, and further weakening.
Our results further suggest that, if deformation is driven by far-field kinematics, as in our modeling conditions, overall lithospheric strength exerts only a second-order control on localization efficiency. For example, Simulation D−Y200 MPa localizes more slowly than simulations and , even though the former has a lower tectonic force during Stage 1 (Fig. 7c). Extra simulations are performed with depth-dependent yield stress, keeping the peak strength of 500 MPa at the same depth as in the constant σY simulations (Appendix E). These complementary simulations exhibit comparable localization characteristic times despite the lower strength at the plate surface, which supports the previous conclusion: reducing near-surface strength does not substantially change localization times if a deeper mechanically important layer remains. Localization is therefore not controlled solely by average plate weakness, but by rheology-dependent feedbacks and by the depth distribution of strength within the lithosphere. Nevertheless, we acknowledge that the situation would be different if lithospheric deformation were instead driven by far-field constant stresses or forces, especially in case of a low to moderate tectonic rate. In such a setting, imposing a yield stress of 500 MPa instead of 200 MPa might significantly modify the evolution of lithospheric spreading.
The aforementioned feedbacks between the temperature and strain rate fields enabled by the activation of dislocation creep are modeled in our experiments while shear heating is not included. Shear heating has been proposed to enhance shear localization by thermal runaway (e.g. Fleitout and Froidevaux, 1980; Kaus and Podladchikov, 2006; Thielmann and Kaus, 2012; Kiss et al., 2019). Using a posteriori calculations, we estimate a maximum heat dissipation rate for Simulation ref-1 () larger than ∼ 10−6 W m−3 in a ∼ 15 km thick layer directly below the yield-creep transition (Supplement, Sect. S5.3). Considering that a heat dissipation rate of order 10−5 W m−3 can lead to a temperature increase close to ∼ 50 K (Kiss et al., 2020; Arcay et al., 2023), we therefore expect that the temperature rise due to shear heating would remain lower than 50 K in our simulations. Therefore, including shear heating could foster thermal weakening in our experiments, further enhancing plate weakening and strain localization, but to a low-to-moderate extent. This effect is predicted to be especially emphasized when using (LT-)dislocation creep for which the temperature-dependent creep layer is the thickest (Supplement, Sect. S5.3).
Taken together, these results show why yield-stress rheologies are not dynamically equivalent to rheologies that include dislocation creep at moderate to high temperatures. Dislocation creep accelerates localization because it expands the depth and temperature range over which both mechanical and thermal weakening can operate, thereby strengthening the feedbacks required to transform distributed extension into a localized plate boundary.
5.3 Implementing yield-stress or LT-dislocation creep as ductile strength-limiters
In these simulations, yield stress plays two distinct roles. First, it acts as a proxy for shallow pseudo-brittle weakening, enabling deformation of the very cold upper lithosphere. That role is essential in the present extension setting: without weakening of the shallow plate, deformation remains distributed and of low amplitude, even when dislocation creep is included. Some mechanism that weakens the cold upper lithosphere is therefore required in addition to any deeper strength-limiter.
Second, in rheologies that do not include low-temperature dislocation creep, yield stress also limits the effective strength in a part of the deeper lithosphere. This is evident from the comparison between simulations with and without an imposed thermal cutoff for yielding. When LT–HT dislocation creep is present, restricting yielding to temperatures below 950 K has no effect on localization timescales. By contrast, when only HT-dislocation creep is included, the same restriction markedly delays localization or prevents it within the simulated strain window (Table 3). In that sense, when low-temperature dislocation creep is absent, the yield stress partly substitutes for a strength-limiter within the approximate 800–1100 K interval, that is, across the temperature range over which deformation transitions from dislocation creep to yielding (Fig. 8). This interval overlaps at least partly with the ductile domain inferred for olivine at temperatures greater than about 800–900 K from laboratory and theoretical studies on melting and homologous temperatures (Hirschmann, 2000; Wang, 2016; Demouchy et al., 2023). It also overlaps with the mantle brittle-ductile transition expected up to approximately 600 °C (900–1000 K), as inferred from seismicity in the oceanic lithosphere (e.g. Engeln et al., 1986; Abercrombie and Ekström, 2001; McKenzie et al., 2005), and may extend to 900 °C (1200–1300 K) under hydrous mantle conditions (Kohli et al., 2021), making the physical interpretation of such stress caps intrinsically ambiguous because deformation around the brittle-ductile transition is likely governed by multiple poorly constrained processes (Kohlstedt et al., 1995; Meyer et al., 2019).
Our simulations further show that lowering stresses of the shallowest part of the lithosphere does neither accelerate nor modify the breakup process (Appendix E), whereas even a stiff layer less than 5 km thick within the mid-lithosphere can strongly delay Stage-1 narrowing and therefore delay plate-boundary formation (Sect. 4.3, Fig. C1; Appendix C). This layer forms a thin but mechanically important bottleneck between the shallow yielding domain and the warmer, weaker creeping mantle. As long as this bottleneck remains strong, it dampens the feedbacks between deformation focusing, plate thinning, and further weakening, with strain rate increase lessened in the whole lithospheric section, hence milder ensuing viscosity reduction (Fig. Cb, c). In that sense, the relevant control on localization is not simply the weakness of the shallowest lithosphere, but the peak strength of the lithosphere, and whether the stiff layer can itself weaken. This underlines the need to cap the lithosphere strength beyond the brittle realm, in a temperature range corresponding approximately to 800–1000 K, i.e. the thermal range within the mid-lithosphere where the activation of HT-dislocation creep would otherwise lead to very high viscosities.
Our results therefore support the view that yield stress in geodynamical models should not be interpreted only as a shallow brittle proxy. In practice, it may also act as a first-order proxy for deeper ductile strength limitation when low-temperature plasticity is not represented explicitly. Following Tackley (2000) and Van Heck and Tackley (2008), we therefore suggest distinguishing between a shallow pseudo-brittle stress cap and a deeper parameterization representing low-temperature ductile strength limitation, even if the latter is not dynamically equivalent to LT-dislocation creep itself (Sect. 5.2).
Simulations with (LT-)-HT dislocation creep exhibit significantly lower tectonic forces TF than simulations with only yielding and diffusion creep. In addition, using lower yield stress values also reduce the tectonic forces needed to maintain extension (Fig. 7c). Nevertheless, initial TF values of approximately 20–40 TN m−1 remain on the high side compared to estimates proposed for natural rifting (∼ 1 TN m−1, Brune et al., 2023), ridge push (∼ 2–3 TN m−1, Parsons and Richter, 1980), but would be in agreement with estimation of slab pull (∼ 10–50 TN m−1, e.g., Toth and Gurnis, 1998; Conrad and Lithgow-Bertelloni, 2002; Schellart, 2004; Wu et al., 2008). In large-scale mantle convection models, chosen yield stresses are low (≲ 200–300 MPa, e.g. Richards et al., 2001; Crameri and Tackley, 2014; Mallard et al., 2016; Coltice et al., 2019), or with a low yield-stress increase with pressure (often ≲ 0.2, e.g. Moresi and Solomatov, 1998; Korenaga, 2010; Crameri et al., 2012; Nakagawa and Iwamori, 2017) compared to values derived from friction coefficients inferred from laboratory experiments (∼ 0.6, e.g. Byerlee, 1978). These choices generally result in lithospheric strengths lower than laboratory-based estimates (> 500 MPa, e.g. Kohlstedt et al., 1995; Karato, 2008; Burov, 2011), but they allow models to reproduce plate-like behavior and reorganizations (Janin et al., 2025). Our results suggest that including low-(to high-)temperature dislocation creep provides an alternative mechanism to act as a strength-limiter in the lithospheric mantle, allowing a somewhat higher stress-cap, more consistent with deformation experiments, while still enabling plate weakening and strain localization. Other plausible mechanisms have also been proposed to generate plate-like behavior compatible with higher yield stress values, such as lateral strength heterogeneities associated with cratonic continental blocks (Rolf et al., 2012).
5.4 Implications for geodynamical models and limitations of the present study
A central implication of this study is that rheologies combining diffusion creep with a simple yield-stress cap (e.g. Moresi and Solomatov, 1998; Trompert and Hansen, 1998; Coltice et al., 2019) may overestimate the time required to localize strain and form new plate boundaries. In our simulations, adding dislocation creep substantially accelerates localization relative to rheology D−Y because it extends the thermal range of weakening in the creeping lithosphere and strengthens the feedbacks that link strain-rate increase, asthenospheric upwelling, and further viscosity reduction. This suggests that large-scale geodynamical models may localize too slowly if they omit this rheological contribution. Yet, including dislocation creep in whole-mantle convection simulations will have other dynamical consequences, such as a sub-plate asthenosphere weakening scaling with surface plate velocities (e.g. Patočka et al., 2024), or an increased mechanical decoupling at lithosphere-asthenosphere boundary that alters mantle flow and surface deformation pattern (Semple and Lenardic, 2021; Arnould et al., 2023).
More broadly, our results highlight a limitation of vertically-uniform stress-limiters. A low and constant yield-stress is not dynamically equivalent to a rheological structure in which shallow pseudo-brittle weakening coexists with a deeper creeping layer, since the latter can undergo strong thermo-mechanical weakening. The distinction matters because localization is sensitive not only to the integrated plate strength, but also to the depth distribution of strength and weakening. In particular, a thin stiff mid-lithosphere layer can act as a bottleneck that delays localization even when the plate is weak in a vertically averaged sense. Models developed to accurately estimate the absolute timescale of localization should distinguish a pseudo-brittle yield cap from a ductile strength limiter, either self-consistently arising from low-temperature dislocation creep (e.g. Mei et al., 2010; Jain et al., 2017; Gouriet et al., 2019; Demouchy et al., 2023; Warren and Hansen, 2023), or implemented with a so-called “ductile yield stress” as in Tackley (2000) and Van Heck and Tackley (2008).
A second important aspect of our study is the introduction of weakening-partition diagnostics, that provide a general framework for analyzing the rheological control on deformation localization. By separating strain-rate-driven and temperature-driven contributions to viscosity reduction, they allow for identifying when localization is controlled primarily either by mechanical weakening or by thermal feedbacks. This weakening-partition diagnostics should be transferable to other geodynamic settings, including subduction initiation (e.g. Gurnis et al., 2004; Billen and Hirth, 2005; Ueda et al., 2008; Zhong and Li, 2019; Zhang et al., 2021; Arcay et al., 2023) or plume-lithosphere interaction (e.g. Brune et al., 2013; Agrusta et al., 2015). It can also be extended to rheologies with additional state dependencies such as grain size, damage, or composition (e.g. Bercovici and Ricard, 2013; Fuchs and Becker, 2021; Dannberg et al., 2025).
The main limitation of the present study is the mantle-only configuration. By excluding crustal layering, we isolate mantle rheological controls but do not attempt to reproduce the full mechanical complexity of natural rift systems. Crust-mantle coupling, lithological discontinuities, and additional weakening processes such as strain softening, grain-size evolution, and damage are all expected to promote a more rapid localization in a “narrow-rift” setting featuring a strong lower crust (e.g. Allemand and Brun, 1991; Buck, 1991; Huismans and Beaumont, 2003; Gueydan et al., 2008; Gueydan and Précigout, 2014; Tetreault and Buiter, 2018; Heckenbach et al., 2021). Indeed, for rifting models under total extension around 1 cm yr−1 (e.g. Brune et al., 2014; Gueydan and Précigout, 2014; Chenin et al., 2018) the corresponding transition time ( ttr) and break-up time (tPB) are approximately 5 and 9–16 Myr, respectively, compared to 14 and 26 Myr in our fastest model (rheology ). In that sense, the absolute times reported in this study are best interpreted as end-member values for a simplified mantle system, rather than as direct predictions for crust-bearing rifts. The interplay between low-temperature dislocation creep and additional weakening mechanisms will depend on the details of the rheological parameterizations and their evolution laws, but is beyond the scope of the present study (e.g. Precigout et al., 2007; Bercovici et al., 2015; Li and Gurnis, 2024). The presence of a crust also questions the existence of a brittle mantle (Burov and Watts, 2006), since the transition between pseudo-brittle yield-stress and LT-dislocation creep is expected around 800 K for a background strain rate of 10−16–10−15 s−1 (Fig. 8), which corresponds to 27 km depth for a 50 Myr old plate, i.e. shallower than a continental Moho (∼ 30 km deep), but deeper than an oceanic one (∼ 4–10 km depth).
Neglecting elasticity is another limitation. This assumption may first lead to an overestimation (up to a factor of three) of shallow stresses in our models (Patočka et al., 2019). In our visco-plastic experiments (“plastic” being here a synonym for “brittle”), the central peak in shallow stresses (at 5 km depth, Supplement, Sect. S5.2) is located in the area where strain localizes, and where free-surface elevation is noticeable. If reducing shallow stresses by a factor 4 (as shown by additional tests with depth-dependent yield stress) indeed leads to smaller central depression (factor ∼ 3), it does not modify the two-stage weakening scenario or the timing of incipient plate-boundary formation (see Appendix E). This supports the conclusion that the localization mechanisms identified in our study are controlled primarily by the rheological structure of the mid- and lower lithosphere, rather than by shallow stress alone.
Neglecting elasticity by assuming a viscoplastic rheology also affects the prediction of brittle deformation and fault development. Previous studies comparing viscoplastic and visco-elasto-plastic formulations have shown that, although first-order stress patterns may be comparable, elasticity implementation will change fault geometry, spatial distribution, interaction and rotation, as well as the rift-topography evolution (e.g. Olive et al., 2016). In particular, our yield-stress formulation produces distributed viscoplastic flow over a finite volume rather than localized planar faulting, and therefore does not capture the detailed geometry of brittle shear-band development. Viscoplastic formulations may exhibit mesh sensitivity and numerical convergence issues (Duretz et al., 2020, 2021). Simulating a constant yield stress prevents the formation of shear bands in the pseudo-brittle layer (Watremez et al., 2013). For a moderately fast extension, the pseudo-brittle layer deforms by pure shear in a layered lithosphere if the viscosity underneath the upper brittle layer is high (∼ 1023 Pa s, Huismans and Beaumont, 2005), which may explain the absence of shear bands in our models with a moderate yield stress increase with depth (viscosity ∼ 1023 Pa s at the yield-creep transition for a 500 MPa yield stress at s−1, Figs. 9a, c and C1). More physically grounded approaches, including damage-based rheologies and visco-elasto-plastic formulations accounting for weakening by microcracks growth, may therefore improve the representation of shallow deformation (Petit et al., 2024), but remain computationnaly demanding. We acknowledge that treating the shallow brittle layer more realistically could significantly modify the deformation pattern at shallow depths, but expect the large-scale feedbacks of lithospheric weakening documented in this study to remain broadly relevant.
Our 2-D thermo-mechanical extension experiments show that lithospheric-scale strain localization is controlled by the interplay between rheology and self-reinforcing thermo-mechanical feedbacks. In all simulations that successfully localize deformation, plate-boundary formation follows a robust two-stage pathway: an initial stage of progressive narrowing of the deforming zone, followed by a second stage of rapid plate thinning driven by focused asthenospheric upwelling. This two-stage evolution provides a simple physical framework for understanding how distributed extension evolves into a localized plate boundary.
A central result is that dislocation creep substantially accelerates localization relative to yield stress plus diffusion creep alone. This effect arises not simply because viscosity is lower overall, but because dislocation creep extends weakening into a broader and colder part of the creeping lithosphere. In doing so, it enables both strain-rate-dominated weakening during Stage 1 and stronger temperature-driven weakening during Stage 2, thereby enhancing the feedbacks that promote localization. By contrast, rheologies based only on diffusion creep plus a yield-stress cap localize more slowly because weakening in the deeper lithosphere is more restricted.
Our results also show that localization depends on the depth distribution of weakening and strength. In particular, even a thin stiff layer within the mid-lithosphere can markedly delay Stage-1 narrowing and hence delay plate-boundary formation. This suggests that low-temperature dislocation creep acts as a ductile stress-limiter at temperatures of about 800–1100 K, similarly to the effect of common yield-stress parameterizations.
More broadly, this study introduces diagnostics that partition viscosity reduction into temperature-driven and strain-rate-driven contributions. These diagnostics directly link weakening to the evolving thermal and kinematic state of the system, clarifying why some rheological combinations localize efficiently whereas others do not. They also provide a transferable framework for analysing weakening processes in other geodynamic settings (e.g. subduction initiation and plume-lithosphere interaction) and in rheologies with additional state dependencies.
Taken together, these results identify dislocation creep as a key ingredient for efficient plate-boundary formation, and show that what matters most is not simply overall plate strength, but the spatial extent of thermo-mechanical weakening within the lithospheric mantle.
The two end-member modes of lithospheric spreading, namely, distributed deformation and localized deformation, described in Sect. 4.1, are assigned at simulation end (40 % of strain, corresponding to 500 km total surface extension) based on two main distinct diagnostics: plateness and lateral viscosity contrasts (Fig. A1). In some cases we observe an intermediate case, that is, incomplete localization, for which the deformation pattern has not reached any quasi-steady state at 40 % of strain. For instance, the plate thickness hplate has not reached any plateau after 40 % of strain (see Fig. 7b).
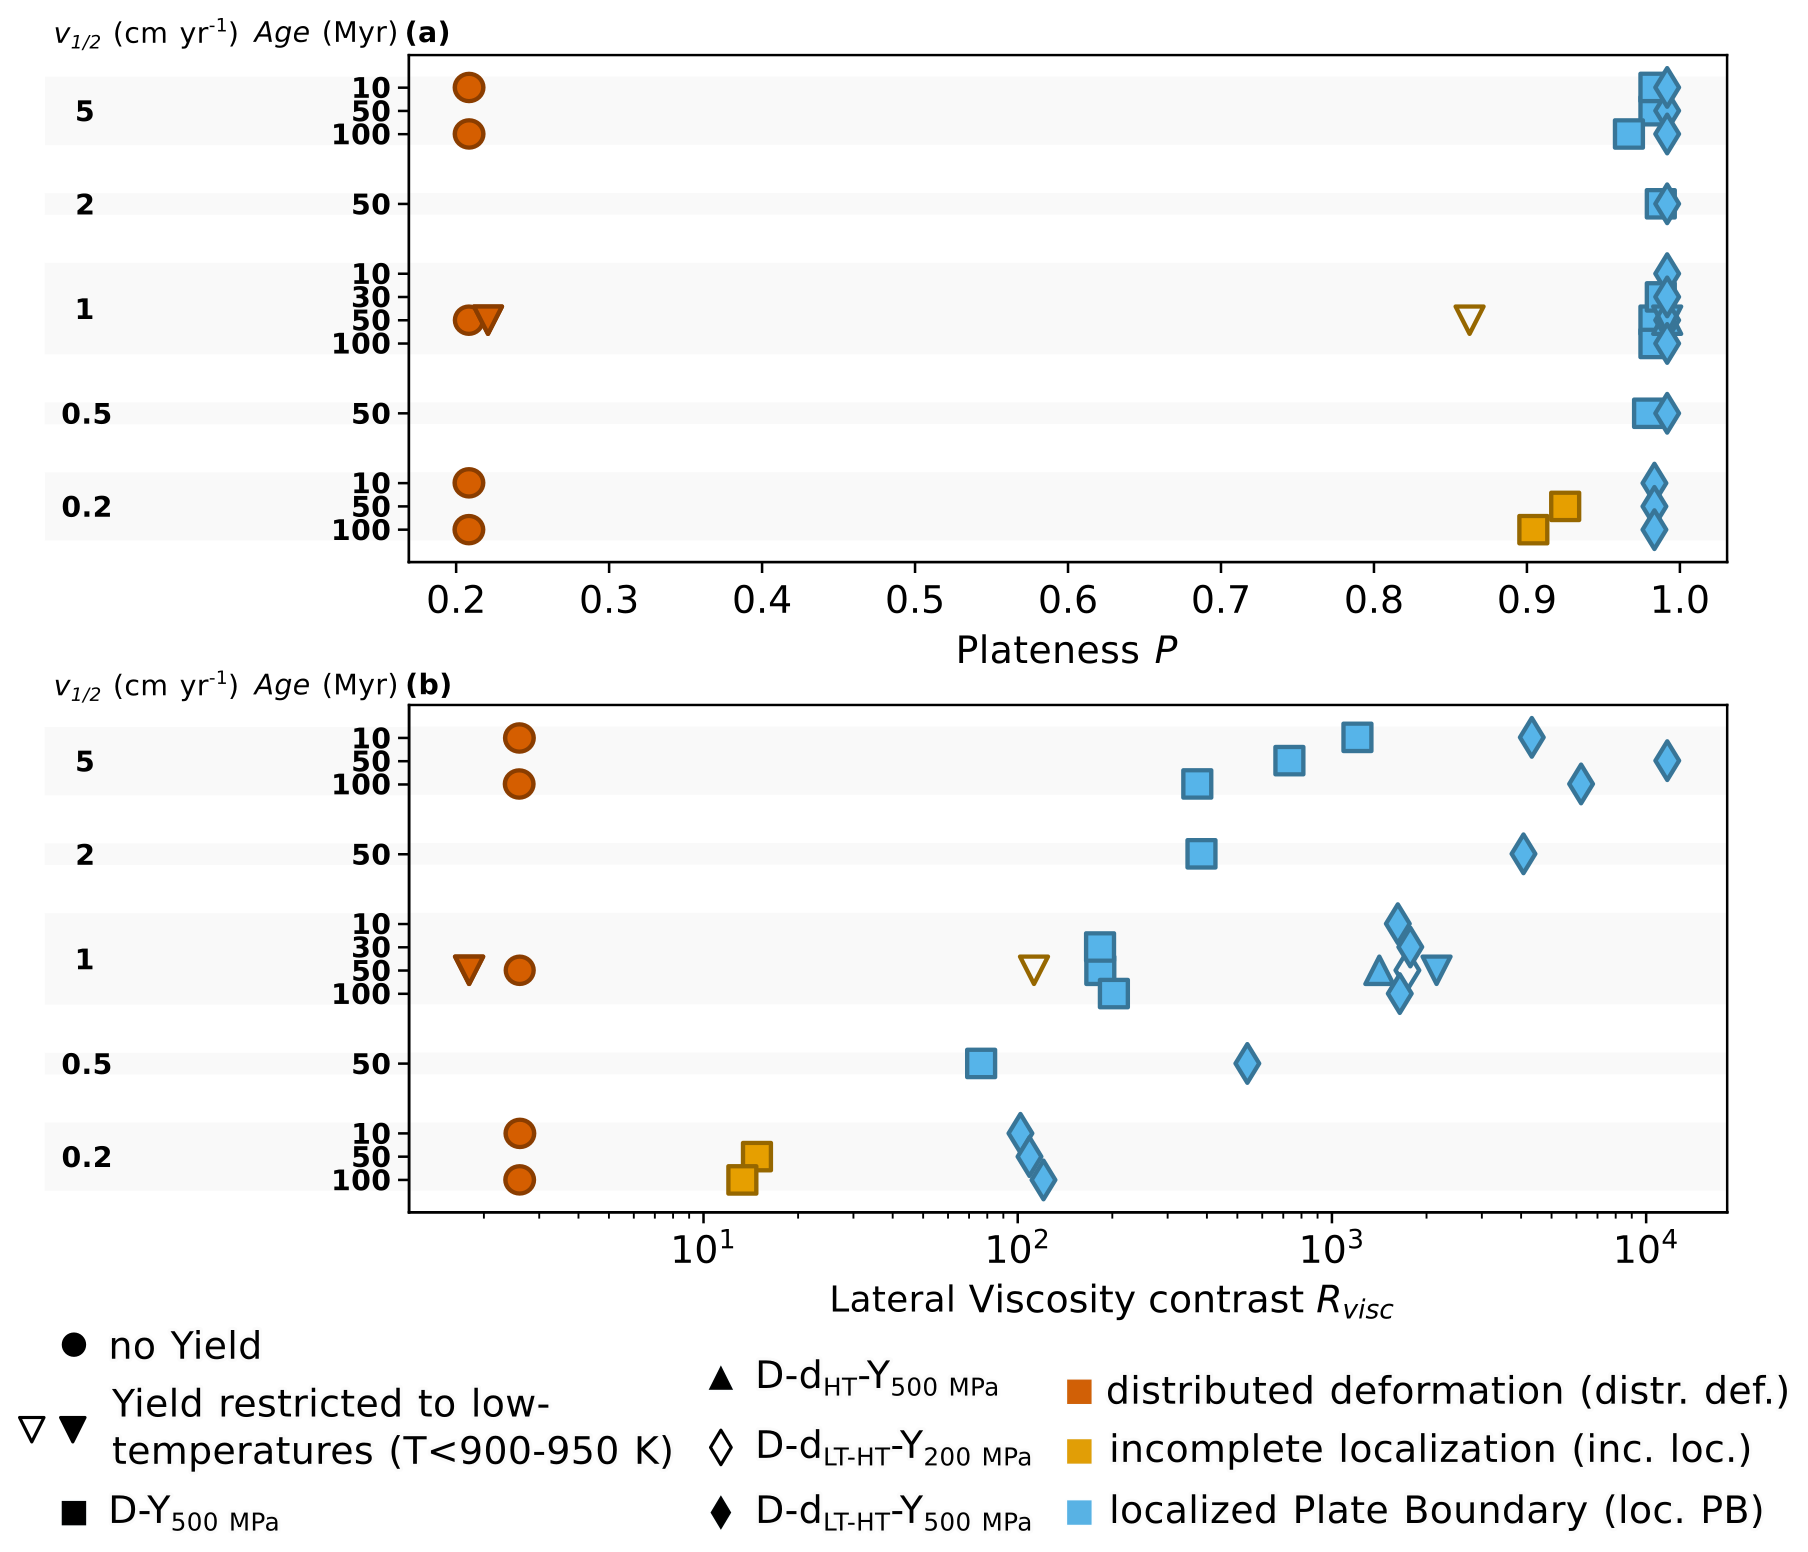
Figure A1(a) Plateness P and (b) lateral viscosity contrast Rvisc obtained after 40 % strain for various extension rates, initial plate age, and rheologies. The end-member simulations (distributed deformation, localized plate boundary) are depicted in red and blue, respectively. The incomplete localization case in yellow is intermediate between the two end-members.
For all “localized” simulations (loc. PB, Tables 3, 4), we estimate the transition time ttr from the co-evolution of plate thickness hplate(t) and width of the enhanced deformed zone w(t). The transition time ttr is defined as the point furthest from the line connecting the lithospheric structures at t0 and tPB, to the evolution curve hplate(t)−w(t) (Fig. B1). This point corresponds to the knee in the curve, i.e. a transition between the first stage of extension during which deformation narrowing dominates (strong decrease in w while hplate only slightly lessens) and the second stage, in which the asthenospheric upwelling dominates (moderate w reduction but strong lithospheric thinning and hplate reduction). Defining a transition with such a methodology was for example used to estimate the threshold in grain orientation spread to discriminate between recrystallized and relict grains of quartz from a given distribution of intracrystalline lattice orientation in a natural sample (e.g. Cross et al., 2017).
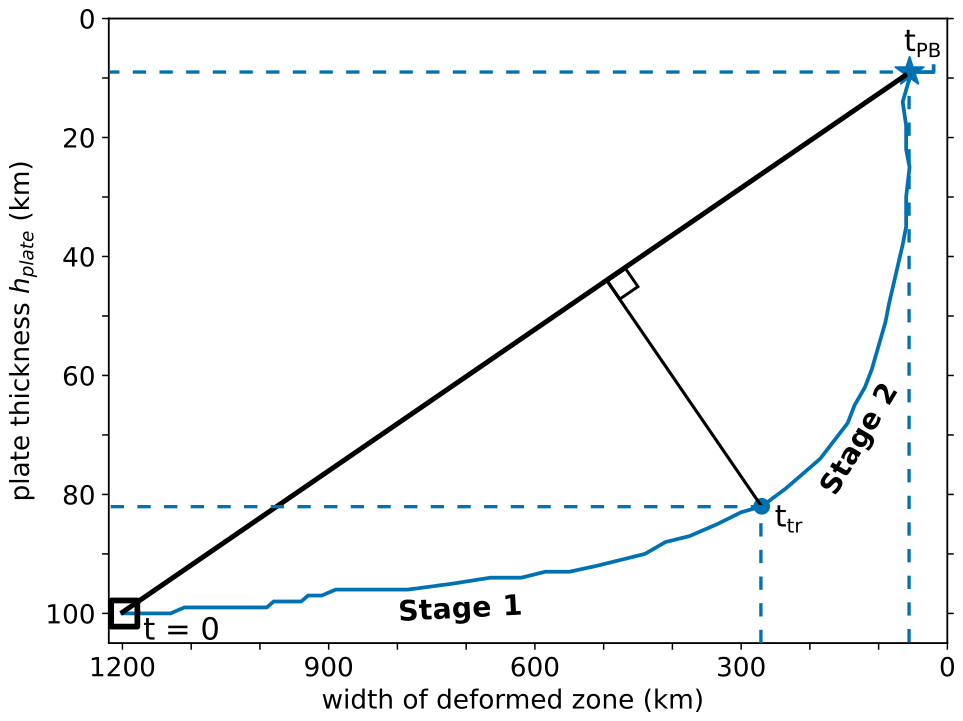
Figure B1Definition of the transition time ttr illustrated using the reference experiment, Simulation ref-1 (rheology ). The transition time ttr is determined as the time at which the distance between the co-evolution of the deformed-zone width w and the plate thickness hplate (blue line), and the straight line between the end-member states at t=0 and t=tPB (black line) is maximum.
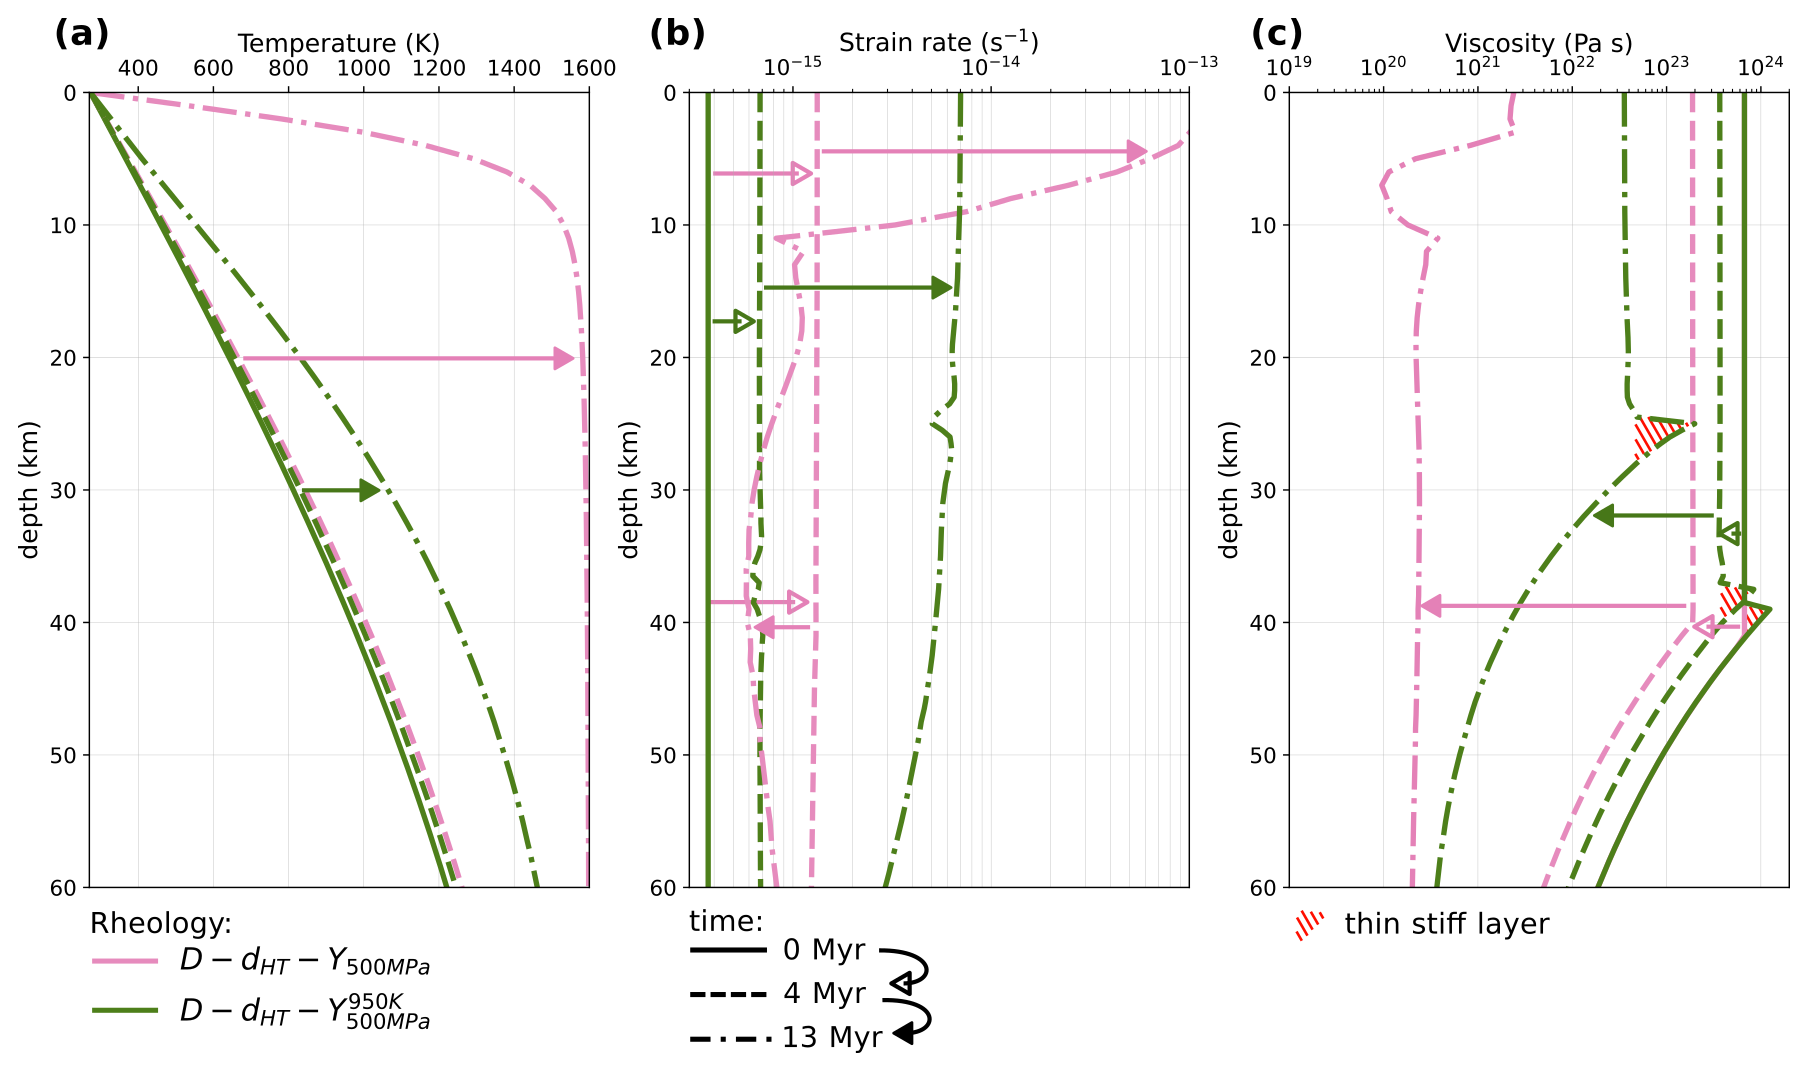
Figure C1Vertical profiles of (a) temperature, (b) strain rate and (c) effective viscosity at x = 600 km at three different times (0, 4 and 13 Myr) for two rheologies (pink) and (green) differing only by the temperature cut-off imposed for the yielding rheology. The thin stiff layer forming for rheology is highlighted by the red hatched area Arrows depict the time evolution.
Simulation investigates the effect of a thermal limitation imposed on the yielding realm. In this experiment, the yield stress rheology is restricted to temperatures lower than 950 K (see Sect. 2.2.3) and is compared to Simulation in which no thermal limitation is imposed (Table 3). Since brittle deformation in the lithospheric mantle has been argued to end at a temperature close to 900 K (e.g. Engeln et al., 1986; Abercrombie and Ekström, 2001; McKenzie et al., 2005), limiting yielding to a temperature around 950 K allows for modeling the lithosphere behavior if the brittle-ductile transition was controlled by a maximum temperature. Simulations performed without and with a temperature-capped yield rheology are compared using vertical profiles of temperature, strain rate and viscosity sampled at the center of the simulation box and computed at three different times (0, 4 and 13 Myr) at different stages of localization (Fig. C1).
At the start of simulations, the temperature of the yield-creep transition is close to 1000 K in Simulation (Sect. 4.3) and is located at ∼ 41 km depth, while the 950 K isotherm is at 38 km depth. As a consequence, if the yield stress is thermally-capped, dislocation creep is activated in a 3 km-thick layer below the yield boundary (38–41 km depth). In this layer, viscosities reach the highest values, locally exceeding 1024 Pa s. After 4 Myr of lithospheric extension (end of Stage 1 in Simulation , the strain rate has increased with respect to the initial state by a factor of ∼ 2.3 for the thermally-capped yield rheology, while this increase is doubled in Simulation . As a result, the viscosity in the yielding realm is decreased by a factor 2 for the temperature-capped yield, instead of 3 without the thermal limitation in yield.
The difference between the two simulations in the average lithospheric strain rate at the box center is amplified through time. As Stage 2 proceeds for Simulation , a strong lithospheric thinning at 13 Myr (1200 K increase at 5 km depth relative to the initial state) adds thermal weakening to mechanical weakening (200-fold increase in strain rate), which reduces viscosity by a factor ∼ 2400 with respect to the initial state. The corresponding viscosity weakening is limited to a ∼ 170-fold decrease for the thermally capped yield rheology.
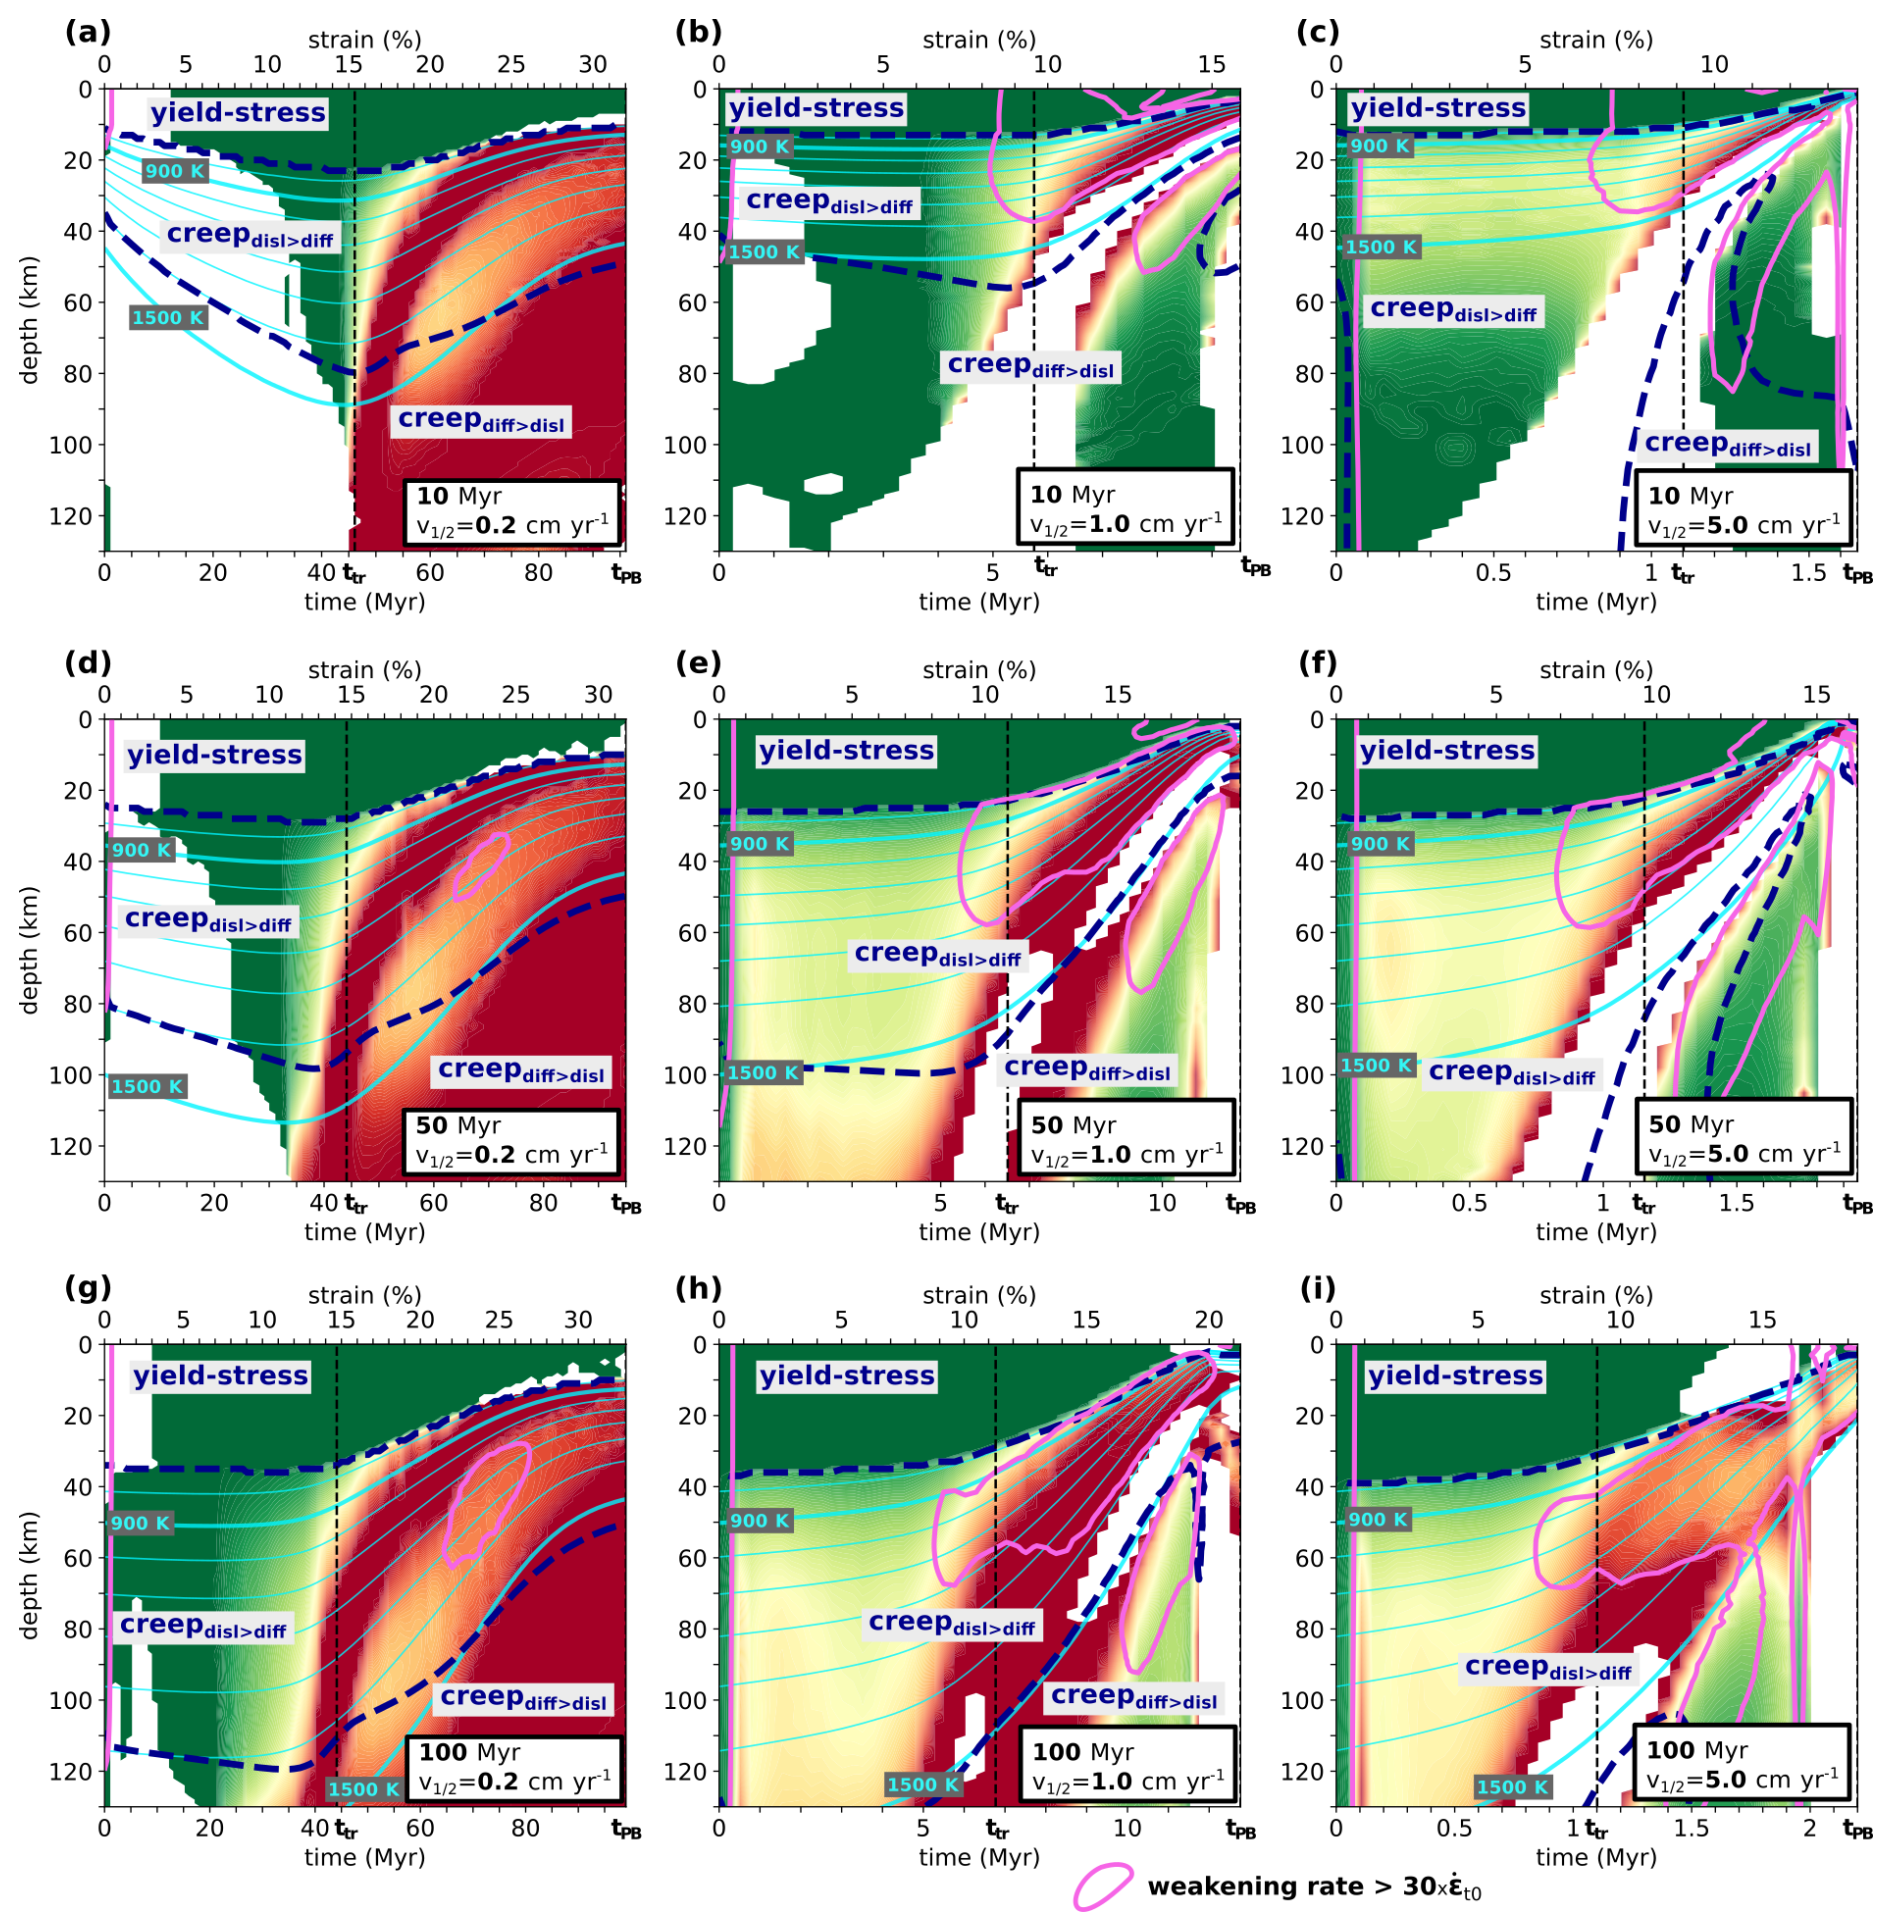
Figure D1(This figure uses the same representation as Fig. 8 in the main text.) Depth-time evolution of the relative contributions to weakening FT and FSR calculated at box center x = 600 km with rheology . Rows correspond to varying initial plate age and columns to varying half-extension velocity . The central panel represents the reference setup (initial plate age of 50 Myr, half-extension rate of 1 cm yr−1). In each panel, time varies from 0 to tPB (which differs from one panel to another), and the transition time ttr is indicated by a vertical dashed line. The diagnostics are calculated only in regions experiencing weakening (W>0), hardening or stable regions (W≤0) being displayed in white. The color-scale is saturated between 0 and 1. Zones of intense weakening, where the weakening rate normalized by the initial strain rate in the plate exceeds 30, are outlined in pink. Boundaries between dominant deformation mechanisms are outlined with dashed dark-blue lines as in Fig. 4, and isotherms from 800 to 1500 K are displayed in light blue.
Figures D1 and D2 display the thermomechanical evolution modeled at the box center obtained for rheologies and D−Y500 MPa, respectively, when the initial plate age and half-extension rate are varied (Sect. 4.4). At low velocity, the early extension stage is characterized by the cooling of the lithosphere (thermal hardening). As a consequence, the material weakening results from mechanical weakening only even in the creeping part of the lithosphere (dark green, Fig. D1a, b, d, g). In particular, Fig. D2c and f illustrate a scenario of incomplete localization (Sect. 4.1, Table 4), where complete localization of deformation is not achieved at the end of the simulation when strain reaches 40 %.
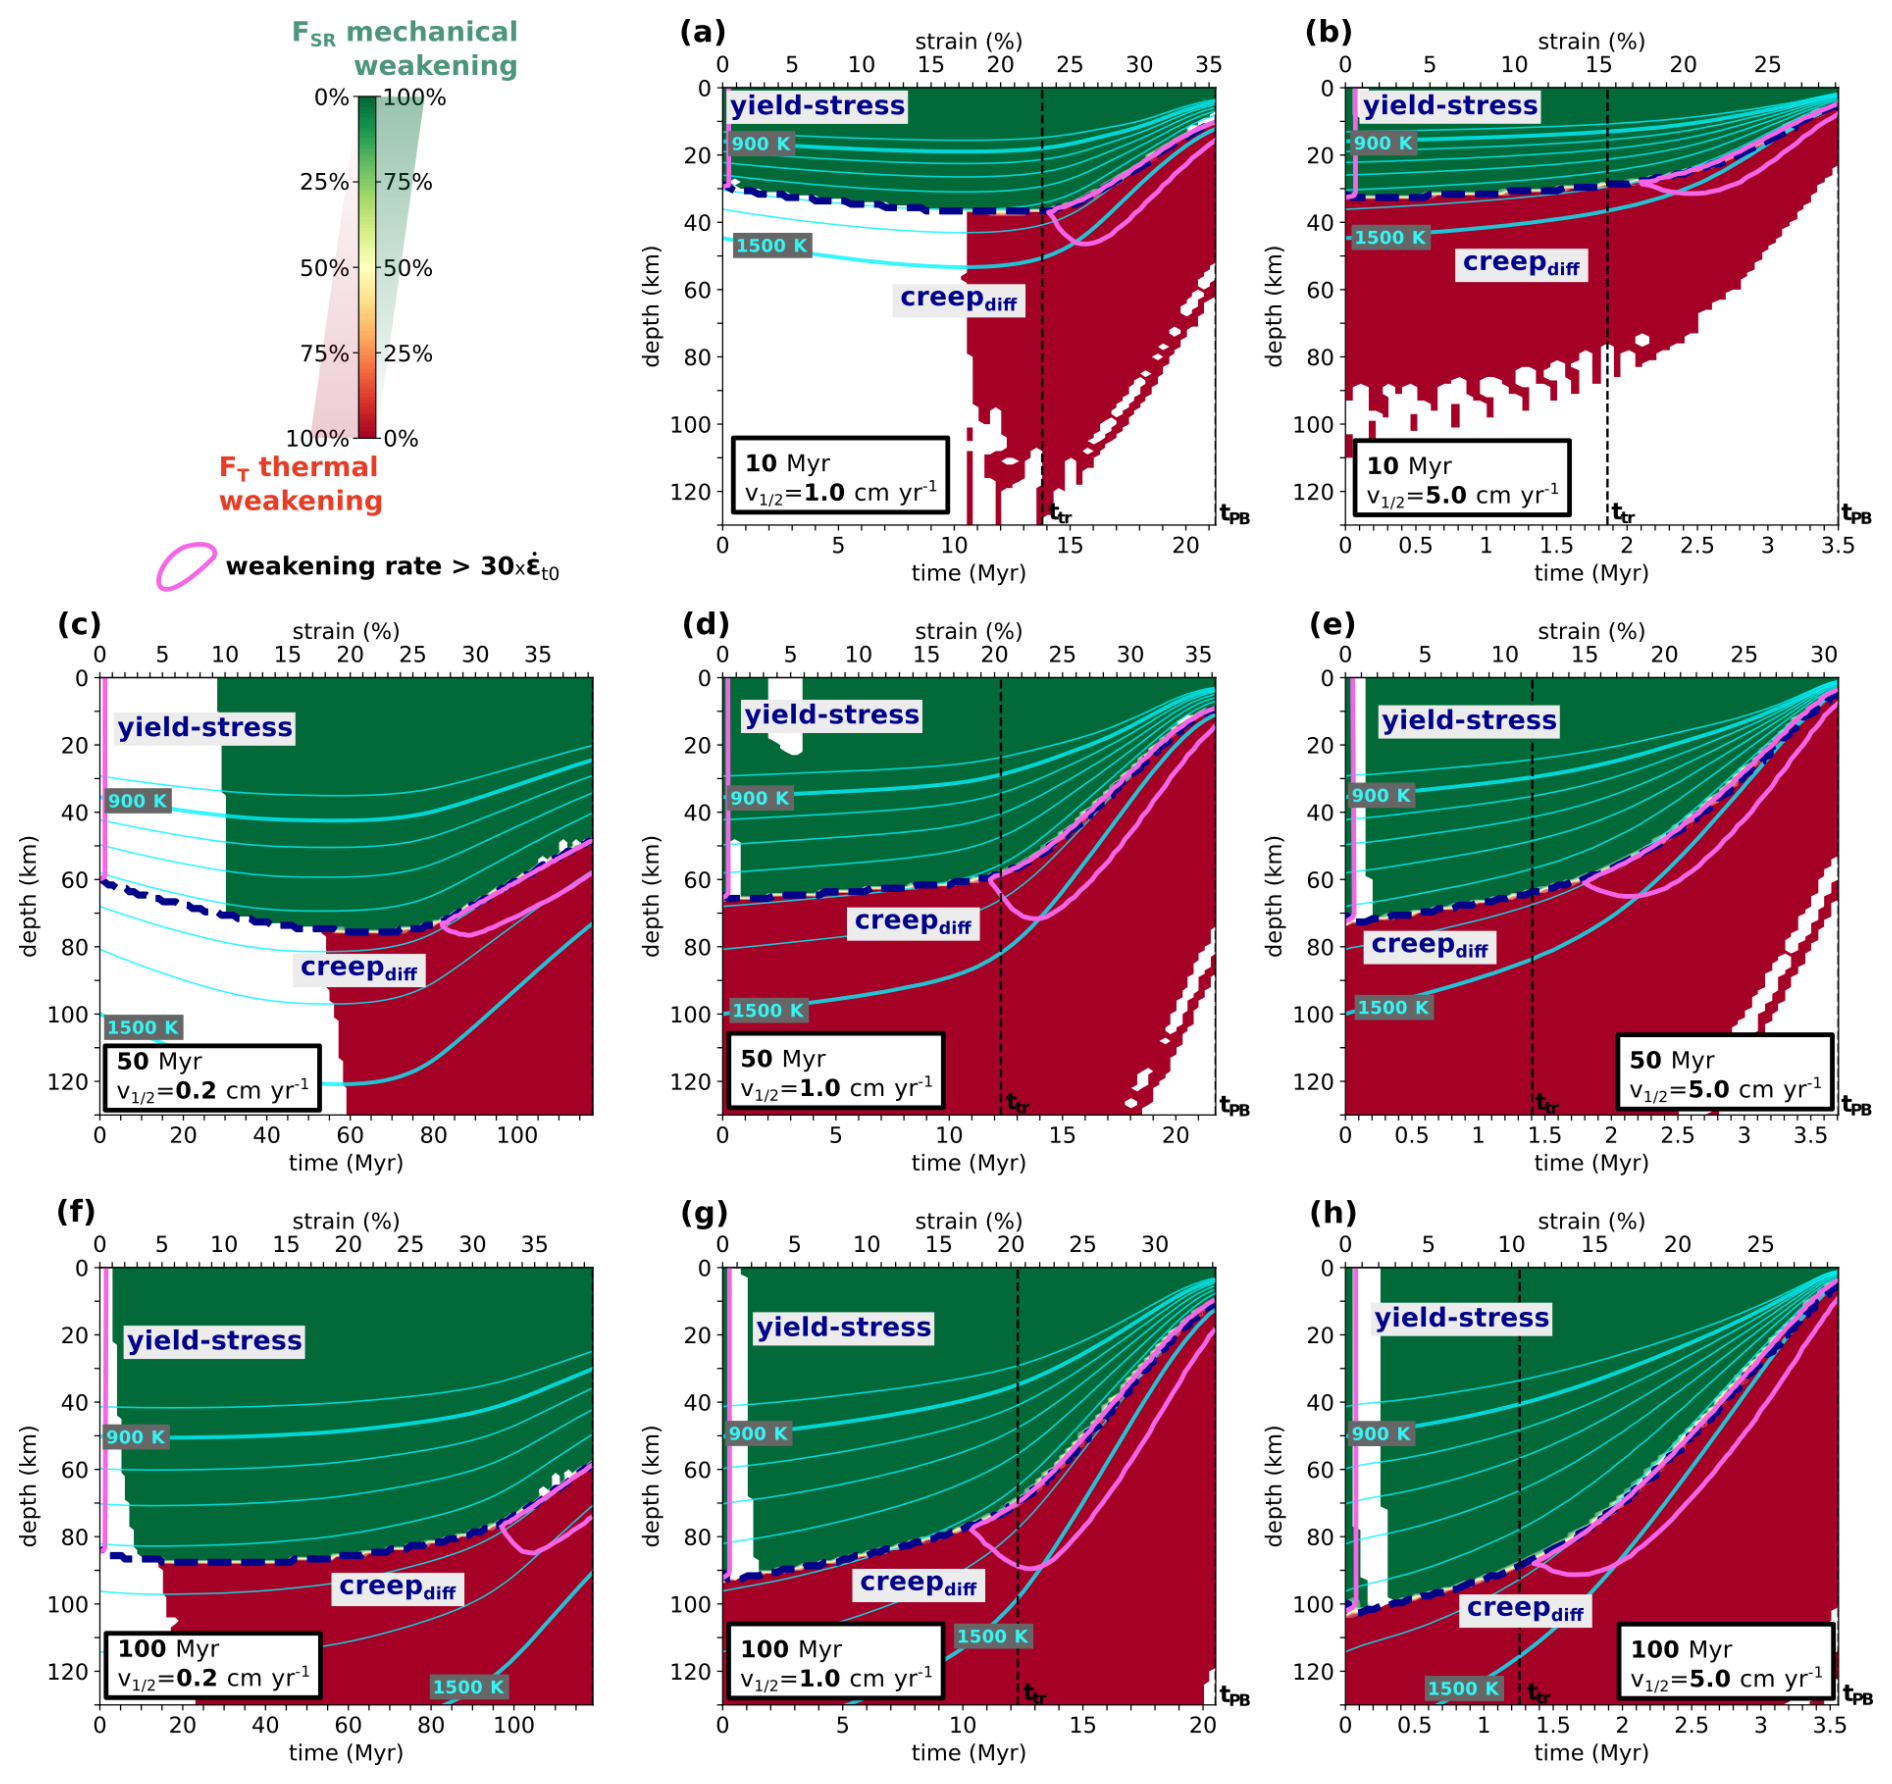
Figure D2(This figure uses the same representation as Fig. 8 in the main text.) Depth-time evolution of the relative contributions to weakening FT and FSR calculated at box center x = 600 km with rheology D−Y500 MPa. Panels are organized with rows corresponding to varying initial plate age and columns corresponding to varying half-extension velocity . The central panel represents the reference setup (initial plate age of 50 Myr, half-extension rate of 1 cm yr−1). In each panel, time varies from 0 to tPB (which differs between panels), and the transition time ttr is indicated by a vertical dashed line, except in panels (c)–(f) where localization is not achieved and the results are shown for the total duration of the simulation. The diagnostics are calculated only in regions in weakening (W>0), with hardening or stable regions (W≤0) shown in white. The colorscale is capped between 0 and 1. Zones of intense weakening, where the weakening rate normalized by the initial strain rate in the plate exceeds 30, are highlighted in pink. Boundaries between dominant deformation mechanisms are marked by dashed dark-blue lines as in Fig. 4, and isotherms from 800 to 1500 K are displayed in light blue.
Figure D3 provides a global illustration of the two-stage evolution in simulations for various initial plate ages and half-extension velocities (Sect. 4.4). The curves for the same initial plate age are almost superimposed, except for low velocity cm yr−1 which exhibits thickening during the early Stage 1. The “incomplete localization” scenario of the simulation with rheology D−Y500 MPa for an initial 50 Myr-old plate and = 0.2 cm yr−1 (Sect. 4.1, Table 4) is illustrated by the pink curve in Fig. D3b: at the end of the simulation (strain of 40 %), the plate is still thicker than 700 km and the deformed zone wider than 150 km.
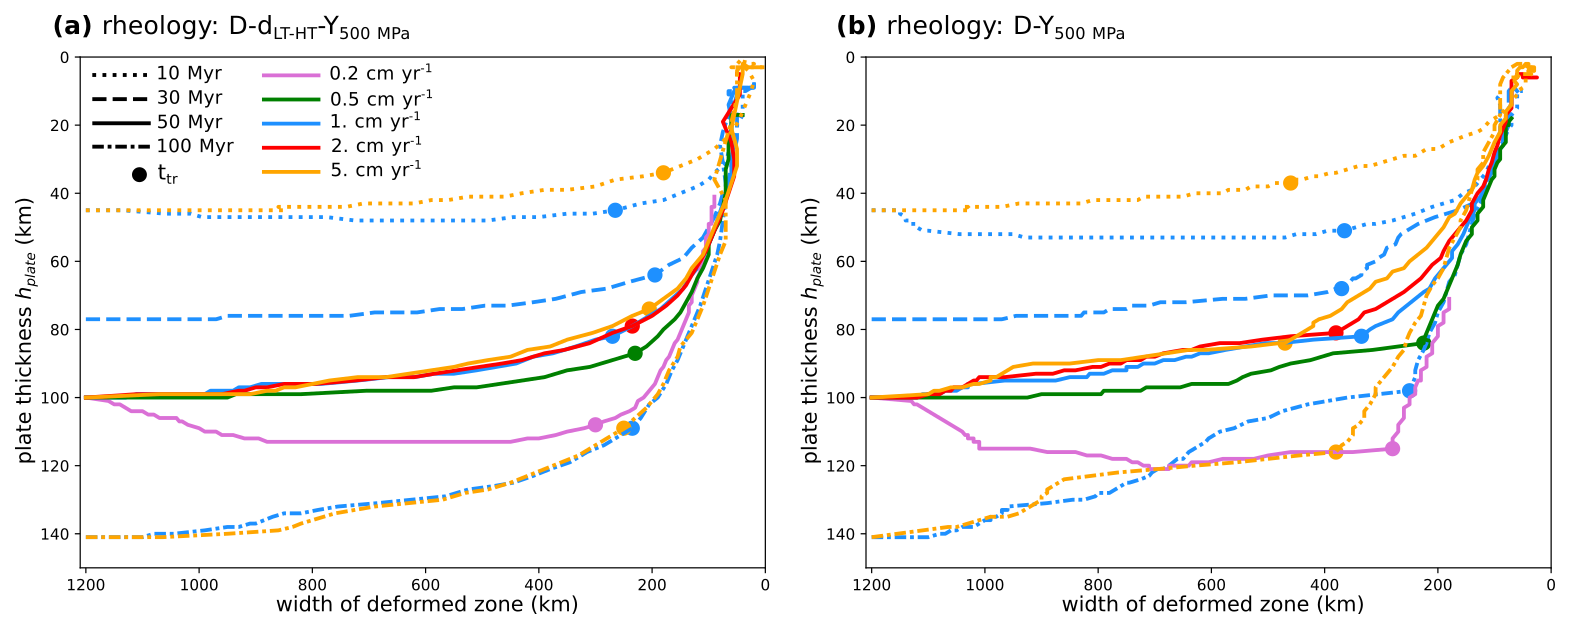
Figure D3Co-evolution of the minimum plate thickness hplate(t) as a function of the width of the most deformed zone for two rheological combinations: (a) . (b) D−Y500 MPa. Curves are shown for varying initial plate age (indicated by line-styles and half-spreading velocity (indicated by colors). The transition times ttr between Stages 1 and 2 are marked by dots.
We perform two simulations with a depth-dependent yield stress for the following two creep rheologies: (i) diffusion creep (D), (ii) diffusion creep plus low- and high-temperature dislocation creep (D−dLT–HT). We define a depth-dependent yield stress:
with
where z is depth, σ0 = 50 MPa is the yield stress at the surface (cohesion), Δσz (Pa m−1) is the yield stress gradient and μ is the yield stress increase with pressure related to the friction coefficient, fs. The parameter μ corresponds to the ratio between the horizontal tectonic deviatoric stress and the lithostatic pressure (neglecting pore fluid pressure), while the friction coefficient fs is the ratio between the shear stress and the normal stress acting on a plane fault (e.g., Doin and Henry, 2001; Turcotte and Schubert, 2002). The yield stress gradients are chosen to ensure that the transition of deformation mechanism from yield to creep corresponds to a stress of approximately 500 MPa and occurs at the same depth as in the case of a constant yield stress with depth. This transition depth depends on the creep law considered. Consequently, for the following creep rheologies: diffusion creep (D) and diffusion creep plus low- to high-temperature dislocation creep (D−dLT–HT), one may get: Δσz(D) = 6.181 MPa km−1, μ(D) ≈ 0.19 and Δσz(D−dLT–HT) = 16.423 MPa km−1, μ(D−dLT–HT) ≈ 0.51, respectively (Fig. E1), keeping unchanged the depth of the yield-creep transition with respect to a constant yield stress ensures to maintain the rheological structure of the underneath creeping layer in the lithosphere.
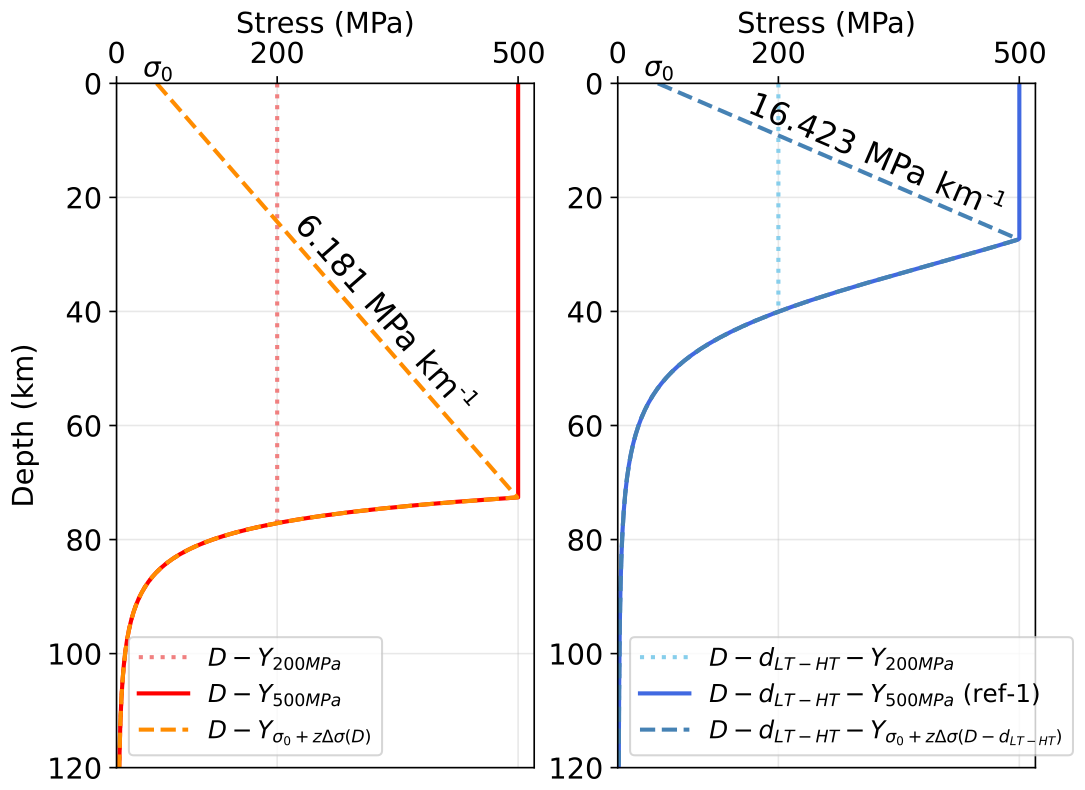
Figure E1Strength profile computed for a uniform strain rate = 3 × 10⁻¹⁵ s−1 and a temperature profile corresponding to a 50 Myr-old lithosphere. The red and dark blue curves are respectively: diffusion, and diffusion plus low- and high-temperature dislocation creep rheologies, in combination with a depth-dependent yield stress (dashed lines), or with a constant yield stress of 200 or 500 MPa (orange dotted and light blue solid lines, respectively). The yield-creep transition for the depth-dependent yield stress is reached at a maximum strength of 500 MPa, which is consistent to the yield-creep transition depth for constant yield stress of 500 MPa combinations.
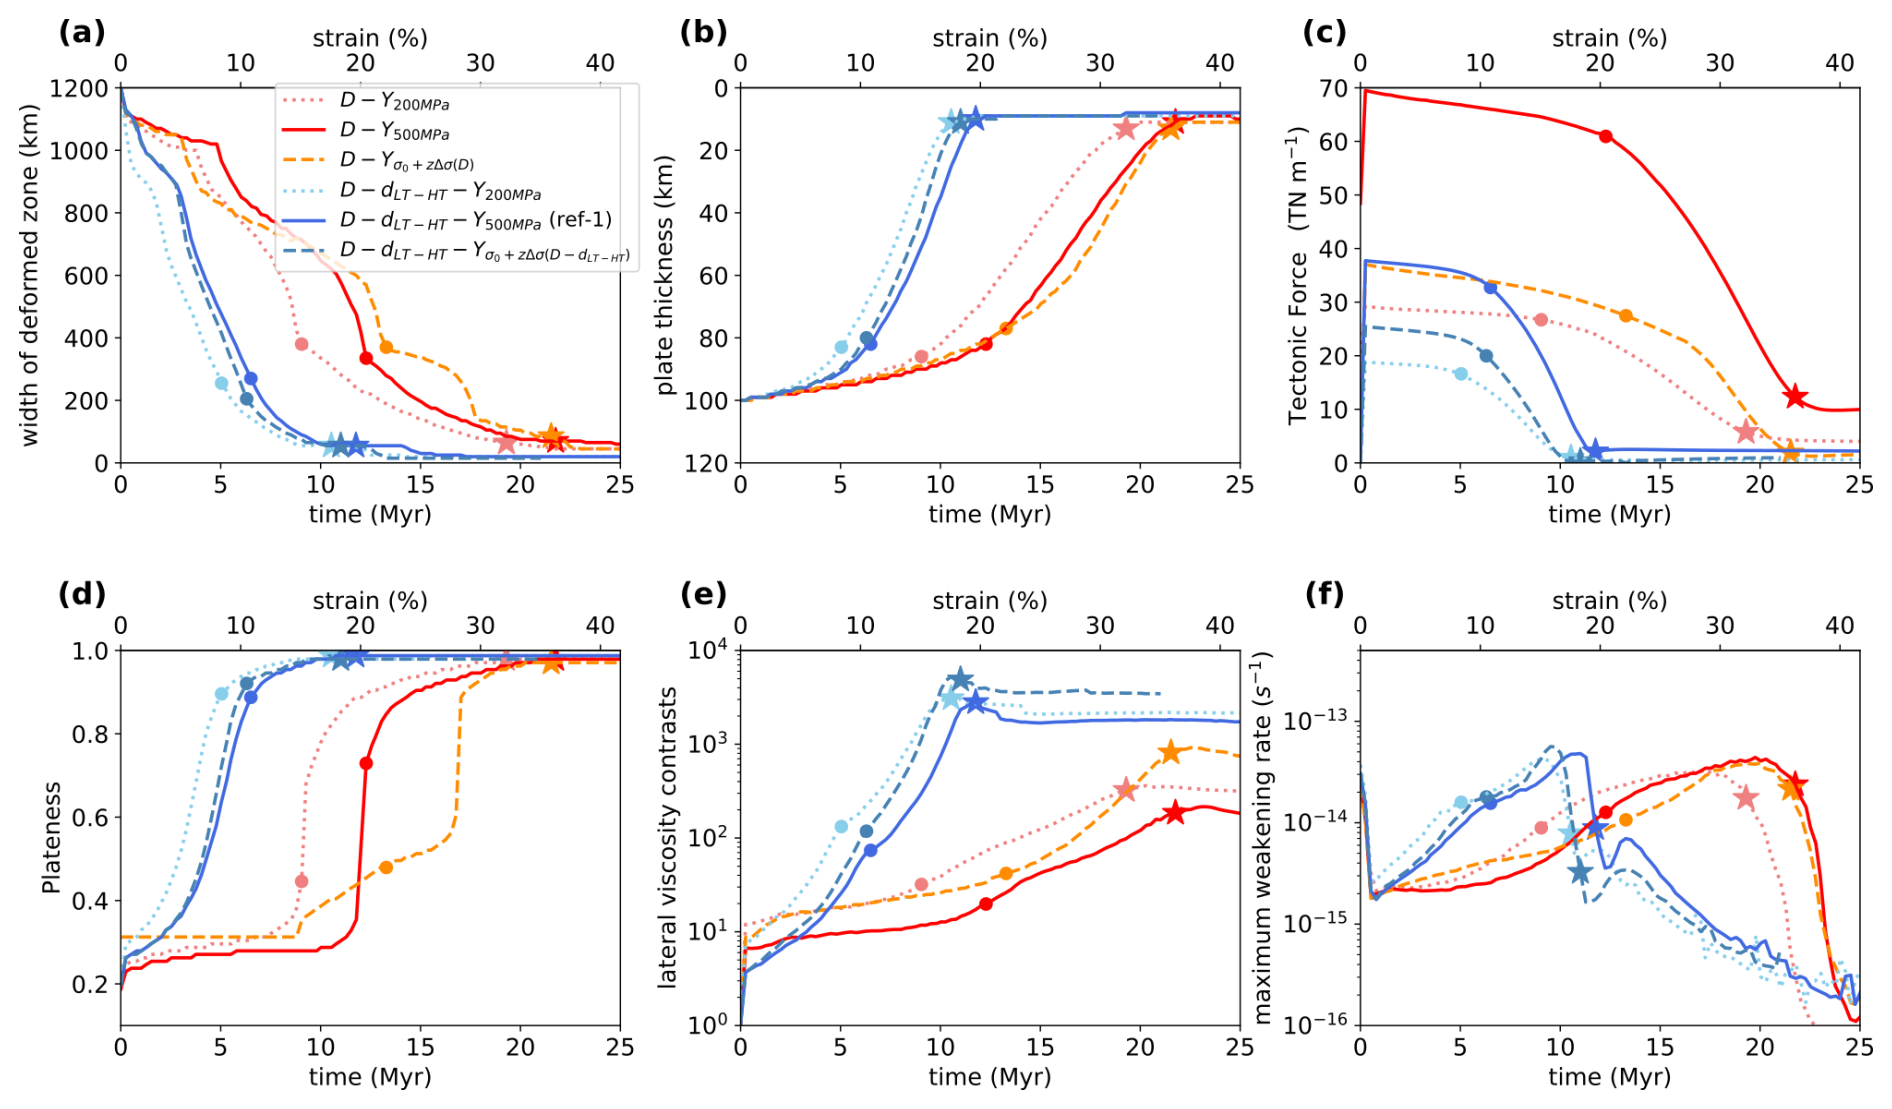
Figure E2Temporal evolution (and corresponding cumulative strain in %) of diagnostics for two sets of simulations corresponding to two creep viscosities (diffusion creep and diffusion creep with LT–HT dislocation creep). In each set, the yield stress is either constant, and set to 200 or 500 MPa, or increasing with depth. The color and style coding used to caption simulations is the same as in Fig. E1. Note that this figure is a similar representation of diagnostics as Fig. 7) in the main text. Simulations have the same initial plate age (50 Myr) and extension velocity ( = 1 cm yr−1). (a) Width of the enhanced deformed zone w, (b) plate thickness hplate at x = 600 km, (c) tectonic force TF, (d) plateness P, (e) lateral viscosity contrast Rvisc, and (f) maximum weakening rate Wmax over the whole lithosphere thickness (T < 1500 K) at x = 600 km.
The two chosen stress-increase with depth are higher than in commonly used depth-dependent yield stress formulations in large mantle convection simulations (usually lower than 1.1 MPa km−1, e.g. Rolf and Tackley, 2011; Coltice et al., 2019; Arnould et al., 2023), and corresponds to relatively high friction coefficients (typically lower than 0.2 in convection experiments, e.g. Moresi and Solomatov, 1998; Korenaga, 2010; Crameri et al., 2012; Nakagawa and Iwamori, 2017) and closer to experiment values (∼ 0.6, e.g. Byerlee, 1978).
Figure E2 shows that the transition time ttr, the plate boundary time tPB and the overall scenario of localization obtained for a depth-dependent yield stress are very close to the reference cases performed with a constant yield stress, for the two investigated creep rheologies. Tectonic force and the lateral viscosity contrasts are lower and higher, respectively, when comparing a depth-dependent yield stress to a constant yield stress (Fig. E2c and e, at initial state and at time ttr, respectively). Moreover, the free-surface topography is not significantly modified when the yield stress is depth-dependent instead of being constant, except in the noticeable narrow area where the plate boundary forms at the very end of the simulation (Supplement, Sect. S5.2).
The version 4.1.19 of the Fluidity computational modeling framework used here is archived at https://zenodo.org/records/5221157 (Kramer et al., 2021a). Post-processing codes were developed using Python (3.11.11) and are available upon request from the corresponding author, with few figures using scientific color maps of https://doi.org/10.5281/zenodo.8409685 (Crameri, 2023). Simulation data supporting the findings of this study are available at https://doi.org/10.5281/zenodo.17606932 (Van Broeck, 2025), including raw files necessary to reproduce the main numerical experiments. Additional simulation outputs not included in the repository are available upon request from the corresponding author.
The supplement related to this article is available online at https://doi.org/10.5194/se-17-947-2026-supplement.
EVB, FG, and RD designed the numerical experiments; EVB, FG, CT, and DA developed new post-processing diagnostics; EVB developed the codes for simulation analysis; EVB and CT produced the figures; all authors discussed the results and contributed to the writing of the paper; FG supervised the project and coordinated the research.
The contact author has declared that none of the authors has any competing interests.
Publisher's note: Copernicus Publications remains neutral with regard to jurisdictional claims made in the text, published maps, institutional affiliations, or any other geographical representation in this paper. The authors bear the ultimate responsibility for providing appropriate place names. Views expressed in the text are those of the authors and do not necessarily reflect the views of the publisher.
The authors warmly thank Antonio Manjón-Cabeza Córdoba and Vojtěch Patočka for their constructive reviews, which greatly helped designing additional simulations and strengthen the paper's core messages, as well as M. Arnould, T. Rolf, S. Demouchy, A. Tommasi, N. Coltice, for fruitful discussions. The numerical simulations were performed using the finite-element control-volume code Fluidity code (https://fluidityproject.github.io/), developed and maintained with the support of a large community. This work has been realized with the support of the HPC Platform MESO@LR, funded by the Occitanie/Pyrénées-Méditerranée Region, Montpellier Mediterranean Metropole and the University of Montpellier, then with the support of ISDM-MESO-Platform at the University of Montpellier.
This research has been supported by French National Research Agency (ANR) through the RheoBreak project (grant no. ANR-21-CE49-0009) led by Fanny Garel.
This paper was edited by Philip Heron and reviewed by Antonio Manjon Cabeza Cordoba and Vojtěch Patočka.
Abercrombie, R. E. and Ekström, G.: Earthquake slip on oceanic transform faults, Nature, 410, 74–77, https://doi.org/10.1038/35065064, 2001. a, b, c
Agrusta, R., Tommasi, A., Arcay, D., Gonzalez, A., and Gerya, T.: How partial melting affects small-scale convection in a plume-fed sublithospheric layer beneath fast-moving plates, Geochem. Geophy. Geosy., 16, 3924–3945, https://doi.org/10.1002/2015GC005967, 2015. a
Allemand, P. and Brun, J.-P.: Width of continental rifts and rheological layering of the lithosphere, Tectonophysics, 188, 63–69, https://doi.org/10.1016/0040-1951(91)90314-I, 1991. a, b
Arcay, D., Abecassis, S., and Lallemand, S.: Subduction initiation at an oceanic transform fault experiencing compression: Role of the fault structure and of the brittle-ductile transition depth, Earth Planet. Sc. Lett., 618, 118272, https://doi.org/10.1016/j.epsl.2023.118272, 2023. a, b
Arnould, M., Rolf, T., and Manjón-Cabeza Córdoba, A.: Effects of Composite Rheology on Plate-Like Behavior in Global-Scale Mantle Convection, Geophys. Res. Lett., 50, e2023GL104146, https://doi.org/10.1029/2023GL104146, 2023. a, b
Asti, R., Saspiturry, N., and Angrand, P.: The Mesozoic Iberia-Eurasia diffuse plate boundary: A wide domain of distributed transtensional deformation progressively focusing along the North Pyrenean Zone, Earth-Sci. Rev., 230, 104040, https://doi.org/10.1016/j.earscirev.2022.104040, 2022. a
Bercovici, D.: A simple model of plate generation from mantle flow, Geophys. J. Int., 114, 635–650, https://doi.org/10.1111/j.1365-246X.1993.tb06993.x, 1993. a
Bercovici, D. and Ricard, Y.: Generation of plate tectonics with two-phase grain-damage and pinning: Source–sink model and toroidal flow, Earth Planet. Sc. Lett., 365, 275–288, https://doi.org/10.1016/j.epsl.2013.02.002, 2013. a, b
Bercovici, D., Tackley, P., and Ricard, Y.: 7.07-the generation of plate tectonics from mantle dynamics, Treatise on Geophysics. Elsevier, Oxford, 271–318, https://doi.org/10.1016/B978-0-444-53802-4.00135-4, 2015. a
Bialas, R. W., Buck, W. R., and Qin, R.: How much magma is required to rift a continent?, Earth Planet. Sc. Lett., 292, 68–78, https://doi.org/10.1016/j.epsl.2010.01.021, 2010. a, b
Billen, M. I. and Hirth, G.: Newtonian versus non-Newtonian upper mantle viscosity: Implications for subduction initiation, Geophys. Res. Lett. 32, L19304, https://doi.org/10.1029/2005GL023457, 2005. a
Brun, J. and Cobbold, P.: Strain heating and thermal softening in continental shear zones: a review, J. Struct. Geol., 2, 149–158, https://doi.org/10.1016/0191-8141(80)90045-0, 1980. a
Brune, S., Popov, A. A., and Sobolev, S. V.: Modeling suggests that oblique extension facilitates rifting and continental break-up, J. Geophys. Res.-Sol. Ea., 117, https://doi.org/10.1029/2011JB008860, 2012. a, b
Brune, S., Popov, A. A., and Sobolev, S. V.: Quantifying the thermo-mechanical impact of plume arrival on continental break-up, Tectonophysics, 604, 51–59, https://doi.org/10.1016/j.tecto.2013.02.009, 2013. a
Brune, S., Heine, C., Pérez-Gussinyé, M., and Sobolev, S. V.: Rift migration explains continental margin asymmetry and crustal hyper-extension, Nat. Commun., 5, 4014, https://doi.org/10.1038/ncomms5014, 2014. a
Brune, S., Williams, S. E., Butterworth, N. P., and Müller, R. D.: Abrupt plate accelerations shape rifted continental margins, Nature, 536, 201–204, https://doi.org/10.1038/nature18319, 2016. a, b, c
Brune, S., Kolawole, F., Olive, J.-A., Stamps, D. S., Buck, W. R., Buiter, S. J. H., Furman, T., and Shillington, D. J.: Geodynamics of continental rift initiation and evolution, Nat. Rev. Earth Environ., 4, 235–253, https://doi.org/10.1038/s43017-023-00391-3, 2023. a, b
Buck, W. R.: Modes of continental lithospheric extension, J. Geophys. Res.-Sol. Ea., 96, 20161–20178, https://doi.org/10.1029/91JB01485, 1991. a
Burov, E. and Watts, A.: The long-term strength of continental lithosphere: “jelly sandwich” or “crème brûlée”?, GSA Today, 16, 4 pp., https://doi.org/10.1130/1052-5173(2006)016<4:TLTSOC>2.0.CO;2, 2006. a, b
Burov, E. B.: Rheology and strength of the lithosphere, Mar. Petrol. Geol., 28, 1402–1443, https://doi.org/10.1016/j.marpetgeo.2011.05.008, 2011. a, b
Byerlee, J.: Friction of rocks, Pure Appl. Geophys., 116, 615–626, https://doi.org/10.1007/BF00876528, 1978. a, b, c
Chen, L., Liu, L., Capitanio, F. A., Gerya, T. V., and Li, Y.: The role of pre-existing weak zones in the formation of the Himalaya and Tibetan plateau: 3-D thermomechanical modelling, Geophys. J. Int., 221, 1971–1983, https://doi.org/10.1093/gji/ggaa125, 2020. a
Chenin, P., Schmalholz, S. M., Manatschal, G., and Karner, G. D.: Necking of the Lithosphere: A Reappraisal of Basic Concepts With Thermo-Mechanical Numerical Modeling, J. Geophys. Res.-Sol. Ea., 123, 5279–5299, https://doi.org/10.1029/2017JB014155, 2018. a, b
Čížková, H., van Hunen, J., van den Berg, A. P., and Vlaar, N. J.: The influence of rheological weakening and yield stress on the interaction of slabs with the 670 km discontinuity, Earth Planet. Sc. Lett., 199, 447–457, https://doi.org/10.1016/S0012-821X(02)00586-1, 2002. a
Coltice, N., Husson, L., Faccenna, C., and Arnould, M.: What drives tectonic plates?, Sci. Adv., 5, eaax4295, https://doi.org/10.1126/sciadv.aax4295, 2019. a, b, c, d
Conrad, C. P. and Lithgow-Bertelloni, C.: How Mantle Slabs Drive Plate Tectonics, Science, 298, 207–209, https://doi.org/10.1126/science.1074161, 2002. a
Crameri, F.: Geodynamic diagnostics, scientific visualisation and StagLab 3.0, Geosci. Model Dev., 11, 2541–2562, https://doi.org/10.5194/gmd-11-2541-2018, 2018. a
Crameri, F.: Scientific colour maps (8.0.1), Zenodo [code], https://doi.org/10.5281/zenodo.8409685, 2023. a
Crameri, F. and Tackley, P. J.: Spontaneous development of arcuate single-sided subduction in global 3-D mantle convection models with a free surface, J. Geophys. Res.-Sol. Ea., 119, 5921–5942, https://doi.org/10.1002/2014JB010939, 2014. a, b
Crameri, F., Tackley, P., Meilick, I., Gerya, T., and Kaus, B.: A free plate surface and weak oceanic crust produce single-sided subduction on Earth, Geophys. Res. Lett., 39, L03306, https://doi.org/10.1029/2011GL050046, 2012. a, b, c
Cross, A. J., Prior, D. J., Stipp, M., and Kidder, S.: The recrystallized grain size piezometer for quartz: An EBSD-based calibration, Geophys. Res. Lett., 44, 6667–6674, https://doi.org/10.1002/2017GL073836, 2017. a
Dannberg, J., Eilon, Z., Faul, U., Gassmöller, R., Moulik, P., and Myhill, R.: The importance of grain size to mantle dynamics and seismological observations, Geochem. Geophy. Geosy., 18, 3034–3061, https://doi.org/10.1002/2017GC006944, 2017. a
Dannberg, J., Eilon, Z., Russell, J. B., and Gassmöller, R.: Understanding Sub-Lithospheric Small-Scale Convection by Linking Models of Grain Size Evolution, Mantle Convection, and Seismic Tomography, Geochem. Geophy. Geosy., 26, e2025GC012289, https://doi.org/10.1029/2025GC012289, 2025. a
Davies, D. R., Wilson, C. R., and Kramer, S. C.: Fluidity: A fully unstructured anisotropic adaptive mesh computational modeling framework for geodynamics, Geochem. Geophy. Geosy., 12, https://doi.org/10.1029/2011GC003551, 2011. a
Demouchy, S., Tommasi, A., Ballaran, T. B., and Cordier, P.: Low strength of Earth's uppermost mantle inferred from tri-axial deformation experiments on dry olivine crystals, Phys. Earth Planet. In., 220, 37–49, https://doi.org/10.1016/j.pepi.2013.04.008, 2013. a, b
Demouchy, S., Wang, Q., and Tommasi, A.: Deforming the Upper Mantle – Olivine Mechanical Properties and Anisotropy, Elements, 19, 151–157, https://doi.org/10.2138/gselements.19.3.151, 2023. a, b
Doin, M.-P. and Henry, P.: Subduction initiation and continental crust recycling: the roles of rheology and eclogitization, Tectonophysics, 342, 163–191, https://doi.org/10.1016/S0040-1951(01)00161-5, 2001. a
Duclaux, G., Huismans, R. S., and May, D. A.: Rotation, narrowing, and preferential reactivation of brittle structures during oblique rifting, Earth Planet. Sc. Lett., 531, 115952, https://doi.org/10.1016/S0040-1951(01)00161-5, 2020. a
Duretz, T., de Borst, R., Yamato, P., and Le Pourhiet, L.: Toward robust and predictive geodynamic modeling: The way forward in frictional plasticity, Geophys. Res. Lett., 47, e2019GL086027, https://doi.org/10.1029/2019GL086027, 2020. a
Duretz, T., de Borst, R., and Yamato, P.: Modeling lithospheric deformation using a compressible visco-elasto-viscoplastic rheology and the effective viscosity approach, Geochem. Geophy. Geosy., 22, e2021GC009675, https://doi.org/10.1029/2021GC009675, 2021. a
Duretz, T., Schmalholz, S. M., Kulakov, R., Mohn, G., Tugend, J., Halter, W., and Bardroff, A.: Lithospheric deformation with mechanical anisotropy: A numerical model and application to continental rifting, Geochem. Geophy. Geosy., 26, e2025GC012409, https://doi.org/10.1029/2025GC012409, 2025. a
Duvernay, T., Davies, D. R., Mathews, C. R., Gibson, A. H., and Kramer, S. C.: Continental Magmatism: The Surface Manifestation of Dynamic Interactions Between Cratonic Lithosphere, Mantle Plumes and Edge-Driven Convection, Geochem. Geophy. Geosy., 23, e2022GC010363, https://doi.org/10.1029/2022GC010363, 2022. a
Engeln, J. F., Wiens, D. A., and Stein, S.: Mechanisms and depths of Atlantic transform earthquakes, J. Geophys. Res.-Sol. Ea., 91, 548–577, https://doi.org/10.1029/JB091iB01p00548, 1986. a, b, c
Evans, B. and Goetze, C.: The temperature variation of hardness of olivine and its implication for polycrystalline yield stress, J. Geophys. Res.-Sol. Ea., 84, 5505–5524, https://doi.org/10.1029/JB084iB10p05505, 1979. a
Fleitout, L. and Froidevaux, C.: Thermal and mechanical evolution of shear zones, J. Struct. Geol., 2, 159–164, https://doi.org/10.1016/0191-8141(80)90046-2, 1980. a, b
Foley, B. J. and Bercovici, D.: Scaling laws for convection with temperature-dependent viscosity and grain-damage, Geophys. J. Int., 199, 580–603, https://doi.org/10.1093/gji/ggu275, 2014. a
Frederiksen, S. and Braun, J.: Numerical modelling of strain localisation during extension of the continental lithosphere, Earth Planet. Sc. Lett., 188, 241–251, https://doi.org/10.1016/S0012-821X(01)00323-5, 2001. a
Frost, H. J. and Ashby, M. F.: Deformation mechanism maps: the plasticity and creep of metals and ceramics, Pergamon press, ISBN 0080293387, 1982. a
Fuchs, L. and Becker, T. W.: Deformation memory in the lithosphere: A comparison of damage-dependent weakening and grain-size sensitive rheologies, J. Geophys. Res.-Sol. Ea., 126, e2020JB020335, https://doi.org/10.1029/2020JB020335, 2021. a
Fuchs, L. and Becker, T. W.: On the Role of Rheological Memory for Convection-Driven Plate Reorganizations, Geophys. Res. Lett., 49, e2022GL099574, https://doi.org/10.1029/2022GL099574, 2022. a
Garel, F. and Thoraval, C.: Lithosphere as a constant-velocity plate: Chasing a dynamical LAB in a homogeneous mantle material, Phys. Earth Planet. In., 106710, https://doi.org/10.1016/j.pepi.2021.106710, 2021. a, b
Garel, F., Goes, S., Davies, D. R., Davies, J. H., Kramer, S. C., and Wilson, C. R.: Interaction of subducted slabs with the mantle transition-zone: A regime diagram from 2-D thermo-mechanical models with a mobile trench and an overriding plate, Geochem. Geophy. Geosy., 15, 1739–1765, https://doi.org/10.1002/2014GC005257, 2014. a, b
Garel, F., Thoraval, C., Tommasi, A., Demouchy, S., and Davies, D. R.: Using thermo-mechanical models of subduction to constrain effective mantle viscosity, Earth Planet. Sc. Lett., 539, 116243, https://doi.org/10.1016/j.epsl.2020.116243, 2020. a, b, c, d, e, f
Gerya, T.: Large-scale-long-term Strength of the Lithosphere: New Theory and Applications, Petrology, 32, 128–141, https://doi.org/10.1134/S086959112401003X, 2024. a
Gouriet, K., Cordier, P., Garel, F., Thoraval, C., Demouchy, S., Tommasi, A., and Carrez, P.: Dislocation dynamics modelling of the power-law breakdown in olivine single crystals: Toward a unified creep law for the upper mantle, Earth Planet. Sc. Lett., 506, 282–291, https://doi.org/10.1016/j.epsl.2018.10.049, 2019. a, b, c, d, e, f
Gueydan, F. and Précigout, J.: Modes of continental rifting as a function of ductile strain localization in the lithospheric mantle, Tectonophysics, 612–613, 18–25, https://doi.org/10.1016/j.tecto.2013.11.029, 2014. a, b, c
Gueydan, F., Morency, C., and Brun, J.-P.: Continental rifting as a function of lithosphere mantle strength, Tectonophysics, 460, 83–93, https://doi.org/10.1016/j.tecto.2008.08.012, 2008. a, b
Gueydan, F., Précigout, J., and Montesi, L. G.: Strain weakening enables continental plate tectonics, Tectonophysics, 631, 189–196, https://doi.org/10.1016/j.tecto.2014.02.005, 2014. a
Gurnis, M., Hall, C., and Lavier, L.: Evolving force balance during incipient subduction, Geochem. Geophy. Geosy., 5, https://doi.org/10.1029/2003GC000681, 2004. a
Hansen, L. N., Kumamoto, K. M., Thom, C. A., Wallis, D., Durham, W. B., Goldsby, D. L., Breithaupt, T., Meyers, C. D., and Kohlstedt, D. L.: Low-temperature plasticity in olivine: Grain size, strain hardening, and the strength of the lithosphere, J. Geophys. Res.-Sol. Ea., 124, 5427–5449, https://doi.org/10.1029/2018JB016736, 2019. a
Heckenbach, E. L., Brune, S., Glerum, A. C., and Bott, J.: Is There a Speed Limit for the Thermal Steady-State Assumption in Continental Rifts?, Geochem. Geophy. Geosy., 22, e2020GC009577, https://doi.org/10.1029/2020GC009577, 2021. a
Heron, P. J., Pysklywec, R. N., and Stephenson, R.: Identifying mantle lithosphere inheritance in controlling intraplate orogenesis, J. Geophys. Res.-Sol. Ea., 121, 6966–6987, https://doi.org/10.1002/2016JB013460, 2016. a
Hirschmann, M. M.: Mantle solidus: Experimental constraints and the effects of peridotite composition, Geochem. Geophy. Geosy., 1, https://doi.org/10.1029/2000GC000070, 2000. a
Hirth, G. and Kohlstedt, D. L.: Experimental constraints on the dynamics of the partially molten upper mantle: Deformation in the diffusion creep regime, J. Geophys. Res.-Sol. Ea., 100, 1981–2001, https://doi.org/10.1029/94JB02128, 1995a. a
Hirth, G. and Kohlstedt, D. L.: Experimental constraints on the dynamics of the partially molten upper mantle: 2. Deformation in the dislocation creep regime, J. Geophys. Res.-Sol. Ea., 100, 15441–15449, https://doi.org/10.1029/95JB01292, 1995b. a
Huismans, R. S. and Beaumont, C.: Symmetric and asymmetric lithospheric extension: Relative effects of frictional-plastic and viscous strain softening, J. Geophys. Res.-Sol. Ea., 108, https://doi.org/10.1029/2002JB002026, 2003. a
Huismans, R. S. and Beaumont, C.: Effect of lithospheric stratification on extensional styles and rift basin geometry, in: Petroleum systems of divergent margin basins (vol. 25), edited by: the Society for Sedimentary Geology, https://doi.org/10.5724/gcs.05.25.0012, 2005. a, b
Iaffaldano, G., Davies, D. R., and DeMets, C.: Indian Ocean floor deformation induced by the Reunion plume rather than the Tibetan Plateau, Nat. Geosci., 11, 362–366, https://doi.org/10.1038/s41561-018-0110-z, 2018. a
Jain, C., Korenaga, J., and Karato, S.-i.: On the Yield Strength of Oceanic Lithosphere, Geophys. Res. Lett., 44, 9716–9722, https://doi.org/10.1002/2017GL075043, 2017. a, b, c
Janin, A., Coltice, N., Chamot-Rooke, N., and Tierny, J.: Geodynamics of a global plate reorganization from topological data analysis, Nat. Geosci., pp. 1–7, https://doi.org/10.1038/s41561-025-01772-7, 2025. a
Karato, S.-I.: Deformation of earth materials: an introduction to the rheology of solid earth, Cambridge University Press, https://doi.org/10.1017/S0016756809006323, 2008. a, b
Kaus, B. J. and Podladchikov, Y. Y.: Initiation of localized shear zones in viscoelastoplastic rocks, J. Geophys. Res.-Sol. Ea., 111, https://doi.org/10.1029/2005JB003652, 2006. a, b, c
Kiss, D., Podladchikov, Y., Duretz, T., and Schmalholz, S. M.: Spontaneous generation of ductile shear zones by thermal softening: Localization criterion, 1D to 3D modelling and application to the lithosphere, Earth Planet. Sc. Lett., 519, 284–296, https://doi.org/10.1016/j.epsl.2019.05.026, 2019. a, b
Kiss, D., Candioti, L. G., Duretz, T., and Schmalholz, S. M.: Thermal softening induced subduction initiation at a passive margin, Geophys. J. Int., 220, 2068–2073, https://doi.org/10.1093/gji/ggz572, 2020. a
Kohli, A., Wolfson-Schwehr, M., Prigent, C., and Warren, J. M.: Oceanic transform fault seismicity and slip mode influenced by seawater infiltration, Nat. Geosci., 14, 606–611, https://doi.org/10.1038/s41561-021-00778-1, 2021. a
Kohlstedt, D. L., Evans, B., and Mackwell, S. J.: Strength of the lithosphere: Constraints imposed by laboratory experiments, J. Geophys. Res.-Sol. Ea., 100, 17587–17602, https://doi.org/10.1029/95JB01460, 1995. a, b, c
Korenaga, J.: Scaling of plate tectonic convection with pseudoplastic rheology, J. Geophys. Res.-Sol. Ea., 115, https://doi.org/10.1029/2010JB007670, 2010. a, b, c
Kramer, S., Greaves, T., Funke, S. W., Wilson, C., Avdis, A., Davies, R., Lange, M., Chris, Candy, A., Cotter, C. J., Percival, J., Mouradian, S., Bhutani, G., Gibson, A., Gorman, G., Duvernay, T., Guo, X., Maddison, J. R., Rathgeber, F., Weiland, M., Nikiteas, I., Robinson, D., Goffin, M., Piggott, M., applet199, Dargaville, S., Everett, A., Jacobs, C. T., Cavendish, A. B., and Ham, D. A.: FluidityProject/fluidity: Zenodo Release, https://zenodo.org/records/5221157 (last access: 20 July 2026), 2021a. a
Kramer, S. C., Wilson, C. R., and Davies, D. R.: An implicit free surface algorithm for geodynamical simulations, Phys. Earth Planet. In., 194–195, 25–37, https://doi.org/10.1016/j.pepi.2012.01.001, 2012. a
Kramer, S. C., Davies, D. R., and Wilson, C. R.: Analytical solutions for mantle flow in cylindrical and spherical shells, Geosci. Model Dev., 14, 1899–1919, https://doi.org/10.5194/gmd-14-1899-2021, 2021b. a
Kreemer, C., Blewitt, G., and Klein, E. C.: A geodetic plate motion and Global Strain Rate Model, Geochem. Geophy. Geosy., 15, 3849–3889, https://doi.org/10.1002/2014GC005407, 2014. a
Lallemand, S. and Arcay, D.: Subduction initiation from the earliest stages to self-sustained subduction: Insights from the analysis of 70 Cenozoic sites, Earth-Sci. Rev., 221, 103779, https://doi.org/10.1016/j.earscirev.2021.103779, 2021. a
Lamb, S. and Watts, A.: The origin of mountains–implications for the behaviour of Earth's lithosphere, Curr. Sci., 1699–1718, http://www.jstor.org/stable/24073494 (last access: 21 July 2026), 2010. a
Le Pichon, X.: Sea-floor spreading and continental drift, J. Geophys. Res., 73, 3661–3697, https://doi.org/10.1029/JB073i012p03661, 1968. a
Le Voci, G., Davies, D. R., Goes, S., Kramer, S. C., and Wilson, C. R.: A systematic 2-D investigation into the mantle wedge's transient flow regime and thermal structure: complexities arising from buoyancy and a hydrated rheology, Geochem. Geophys. Geosys., 15.1, https://doi.org/10.1002/2013GC005022, 2014. a
Li, Y. and Gurnis, M.: Rapid shear zone weakening during subduction initiation, P. Natl. Acad. Sci. USA, 121, e2404939121, https://doi.org/10.1073/pnas.2404939121, 2024. a
Mallard, C., Coltice, N., Seton, M., Müller, R. D., and Tackley, P. J.: Subduction controls the distribution and fragmentation of Earth's tectonic plates, Nature, 535, 140–143, https://doi.org/10.1038/nature17992, 2016. a, b, c, d
Mameri, L., Tommasi, A., Signorelli, J., and Hassani, R.: Olivine-induced viscous anisotropy in fossil strike-slip mantle shear zones and associated strain localization in the crust, Geophys. J. Int., 224, 608–625, https://doi.org/10.1093/gji/ggaa400, 2021. a
Mazzotti, S. and Gueydan, F.: Control of tectonic inheritance on continental intraplate strain rate and seismicity, Tectonophysics, 746, 602–610, https://doi.org/10.1016/j.tecto.2017.12.014, 2018. a
McKenzie, D., Jackson, J., and Priestley, K.: Thermal structure of oceanic and continental lithosphere, Earth Planet. Sc. Lett., 233, 337–349, https://doi.org/10.1016/j.epsl.2005.02.005, 2005. a, b, c
Mei, S., Suzuki, A., Kohlstedt, D., Dixon, N., and Durham, W.: Experimental constraints on the strength of the lithospheric mantle, J. Geosphy. Res., 115, B08204, https://doi.org/10.1029/2009JB006873, 2010. a, b, c
Meyer, G. G., Brantut, N., Mitchell, T. M., and Meredith, P. G.: Fault reactivation and strain partitioning across the brittle-ductile transition, Geology, 47, 1127–1130, https://doi.org/10.1130/G46516.1, 2019. a
Meyer, S. E., Kaus, B. J. P., and Passchier, C.: Development of branching brittle and ductile shear zones: A numerical study, Geochem. Geophy. Geosy., 18, 2054–2075, https://doi.org/10.1002/2016GC006793, 2017. a
Montési, L. G.: Fabric development as the key for forming ductile shear zones and enabling plate tectonics, J. Struct. Geol., 50, 254–266, https://doi.org/10.1016/j.jsg.2012.12.011, 2013. a
Montési, L. G. J. and Zuber, M. T.: A unified description of localization for application to large-scale tectonics, J. Geophys. Res.-Sol. Ea., 107, ECV 1-1–ECV 1-21, https://doi.org/10.1029/2001JB000465, 2002. a, b
Moresi, L. and Solomatov, V.: Mantle convection with a brittle lithosphere: thoughts on the global tectonic styles of the Earth and Venus, Geophys. J. Int., 133, 669–682, https://doi.org/10.1046/j.1365-246X.1998.00521.x, 1998. a, b, c, d, e
Morra, G., Seton, M., Quevedo, L., and Müller, R. D.: Organization of the tectonic plates in the last 200 Myr, Earth Planet. Sc. Lett., 373, 93–101, https://doi.org/10.1016/j.epsl.2013.04.020, 2013. a
Müller, R. D., Zahirovic, S., Williams, S. E., Cannon, J., Seton, M., Bower, D. J., Tetley, M. G., Heine, C., Le Breton, E., Liu, S., Russell, S. H. J., Yang, T., Leonard, J., and Gurnis, M.: A Global Plate Model Including Lithospheric Deformation Along Major Rifts and Orogens Since the Triassic, Tectonics, 38, 1884–1907, https://doi.org/10.1029/2018TC005462, 2019. a
Mulyukova, E. and Bercovici, D.: The generation of plate tectonics from grains to global scales: A brief review, Tectonics, 38, 4058–4076, https://doi.org/10.1029/2018TC005447, 2019. a
Nakagawa, T. and Iwamori, H.: Long-Term Stability of Plate-Like Behavior Caused by Hydrous Mantle Convection and Water Absorption in the Deep Mantle, J. Geophys. Res., 122, 8431–8445, https://doi.org/10.1002/2017JB014052, 2017. a, b, c, d
Olive, J.-A., Behn, M. D., Mittelstaedt, E., Ito, G., and Klein, B. Z.: The role of elasticity in simulating long-term tectonic extension, Geophys. J. Int., 205, 728–743, https://doi.org/10.1093/gji/ggw044, 2016. a
Parsons, B. and Richter, F. M.: A relation between the driving force and geoid anomaly associated with mid-ocean ridges, Earth Planet. Sc. Lett., 51, 445–450, https://doi.org/10.1016/0012-821X(80)90223-X, 1980. a, b
Patočka, V., Čížková, H., and Tackley, P.: Do elasticity and a free surface affect lithospheric stresses caused by upper-mantle convection?, Geophys. J. Int., 216, 1740–1760, https://doi.org/10.1093/gji/ggy513, 2019. a
Patočka, V., Čížková, H., and Pokorný, J.: Dynamic Component of the Asthenosphere: Lateral Viscosity Variations Due To Dislocation Creep at the Base of Oceanic Plates, Geophys. Res. Lett., 51, e2024GL109116, https://doi.org/10.1029/2024GL109116, 2024. a, b
Petit, L., Olive, J.-A., Schubnel, A., Le Pourhiet, L., and Bhat, H. S.: A brittle constitutive law for long-term tectonic modeling based on sub-critical crack growth, Geochem. Geophy. Geosy., 25, e2023GC011229, https://doi.org/10.1029/2023GC011229, 2024. a
Precigout, J., Gueydan, F., Gapais, D., Garrido, C. J., and Essaifi, A.: Strain localisation in the subcontinental mantle – a ductile alternative to the brittle mantle, Tectonophysics, 445, 318–336, https://doi.org/10.1016/j.tecto.2007.09.002, 2007. a
Raterron, P., Wu, Y., Weidner, D. J., and Chen, J.: Low-temperature olivine rheology at high pressure, Phys. Earth Planet. In., 145, 149–159, https://doi.org/10.1016/j.pepi.2004.03.007, 2004. a
Richards, M. A., Yang, W.-S., Baumgardner, J. R., and Bunge, H.-P.: Role of a low-viscosity zone in stabilizing plate tectonics: Implications for comparative terrestrial planetology, Geochem. Geophy. Geosy., 2, https://doi.org/10.1029/2000GC000115, 2001. a, b
Rolf, T. and Tackley, P. J.: Focussing of stress by continents in 3D spherical mantle convection with self-consistent plate tectonics, Geophys. Res. Lett., 38, https://doi.org/10.1029/2011GL048677, 2011. a
Rolf, T., Coltice, N., and Tackley, P. J.: Linking continental drift, plate tectonics and the thermal state of the Earth's mantle, Earth Planet. Sc. Lett., 351–352, 134–146, https://doi.org/10.1016/j.epsl.2012.07.011, 2012. a
Rosenbaum, G., Regenauer-Lieb, K., and Weinberg, R. F.: Interaction between mantle and crustal detachments: A nonlinear system controlling lithospheric extension, J. Geophys. Res.-Sol. Ea., 115, https://doi.org/10.1029/2009JB006696, 2010. a
Ruh, J. B., Tokle, L., and Behr, W. M.: Grain-size-evolution controls on lithospheric weakening during continental rifting, Nat. Geosci., 15, 585–590, https://doi.org/10.1038/s41561-022-00964-9, 2022. a
Schellart, W. P.: Quantifying the net slab pull force as a driving mechanism for plate tectonics, Geophys. Res. Lett., 31, https://doi.org/10.1029/2004GL019528, 2004. a
Schierjott, J. C., Thielmann, M., Rozel, A. B., Golabek, G. J., and Gerya, T. V.: Can grain size reduction initiate transform faults? – insights from a 3-D numerical study, Tectonics, 39, e2019TC005793, https://doi.org/10.1029/2019TC005793, 2020. a
Schmalholz, S. M. and Fletcher, R. C.: The exponential flow law applied to necking and folding of a ductile layer, Geophys. J. Int., 184, 83–89, https://doi.org/10.1111/j.1365-246X.2010.04846.x, 2011. a
Schmalholz, S. M., Medvedev, S., Lechmann, S. M., and Podladchikov, Y.: Relationship between tectonic overpressure, deviatoric stress, driving force, isostasy and gravitational potential energy, Geophys. J. Int., 197, 680–696, https://doi.org/10.1093/gji/ggu040, 2014. a
Sdrolias, M. and Müller, R. D.: Controls on back-arc basin formation, Geochem. Geophy. Geosy., 7, https://doi.org/10.1029/2005GC001090, 2006. a
Semple, A. G. and Lenardic, A.: Feedbacks between a non-Newtonian upper mantle, mantle viscosity structure and mantle dynamics, Geophys. J. Int., 224, 961–972, https://doi.org/10.1093/gji/ggaa495, 2021. a
Solomatov, V.: Scaling of temperature-and stress-dependent viscosity convection, Phys. Fluids, 7, 266–274, https://doi.org/10.1063/1.868624, 1995. a
Solomatov, V. S.: Initiation of subduction by small-scale convection, J. Geophys. Res.-Sol. Ea., 109, https://doi.org/10.1029/2003JB002628, 2004. a
Solomatov, V. S. and Moresi, L.-N.: Three regimes of mantle convection with non-Newtonian viscosity and stagnant lid convection on the terrestrial planets, Geophys. Res. Lett., 24, 1907–1910, https://doi.org/10.1029/97GL01682, 1997. a
Tackley, P. J.: Self-consistent generation of tectonic plates in three-dimensional mantle convection, Earth Planet. Sc. Lett., 157, 9–22, https://doi.org/10.1016/S0012-821X(98)00029-6, 1998. a
Tackley, P. J.: Self-consistent generation of tectonic plates in time-dependent, three-dimensional mantle convection simulations 1 Pseudoplastic yielding, Geochem. Geophy. Geosy., 1, https://doi.org/10.1029/2000GC000036, 2000. a, b, c, d, e
Tarayoun, A., Mazzotti, S., and Gueydan, F.: Quantitative impact of structural inheritance on present-day deformation and seismicity concentration in intraplate deformation zones, Earth Planet. Sc. Lett., 518, 160–171, https://doi.org/10.1016/j.epsl.2019.04.043, 2019. a
Tetreault, J. L. and Buiter, S. J. H.: The influence of extension rate and crustal rheology on the evolution of passive margins from rifting to break-up, Tectonophysics, 746, 155–172, https://doi.org/10.1016/j.tecto.2017.08.029, 2018. a
Thielmann, M. and Kaus, B. J.: Shear heating induced lithospheric-scale localization: Does it result in subduction?, Earth Planet. Sc. Lett., 359, 1–13, https://doi.org/10.1016/j.epsl.2012.10.002, 2012. a
Tommasi, A., Knoll, M., Vauchez, A., Signorelli, J. W., Thoraval, C., and Logé, R.: Structural reactivation in plate tectonics controlled by olivine crystal anisotropy, Nat. Geosci., 2, 423–427, https://doi.org/10.1038/ngeo528, 2009. a
Toth, J. and Gurnis, M.: Dynamics of subduction initiation at preexisting fault zones, J. Geophys. Res.-Sol. Ea., 103, 18053–18067, https://doi.org/10.1029/98JB01076, 1998. a
Trompert, R. and Hansen, U.: Mantle convection simulations with rheologies that generate plate-like behaviour, Nature, 395, 686–689, https://doi.org/10.1038/27185, 1998. a, b
Turcotte, D. L. and Schubert, G.: Geodynamics, 3rd edn., Cambridge University Press, New York, https://doi.org/10.1017/CBO9780511843877, 2002. a
Ueda, K., Gerya, T., and Sobolev, S. V.: Subduction initiation by thermal–chemical plumes: Numerical studies, Phys. Earth Planet. In., 171, 296–312, https://doi.org/10.1016/j.pepi.2008.06.032, 2008. a
Ulvrova, M. M., Brune, S., and Williams, S.: Breakup Without Borders: How Continents Speed Up and Slow Down During Rifting, Geophys. Res. Lett., 46, 1338–1347, https://doi.org/10.1029/2018GL080387, 2019. a
Van Broeck, E.: Data for the manuscript “From Strong Plates to Weak Boundaries: Strain Localization in the Lithospheric Mantle with Low- to High-Temperature Dislocation Creep” submitted to Solid Earth (2025) – by Van Broeck, Garel, Thoraval, Arcay and Davies, Zenodo [data set], https://doi.org/10.5281/zenodo.17606932, 2025. a
Van Heck, H. and Tackley, P.: Planforms of self-consistently generated plates in 3D spherical geometry, Geophys. Res. Lett., 35, https://doi.org/10.1029/2008GL035190, 2008. a, b
Wang, Q.: Homologous temperature of olivine: Implications for creep of the upper mantle and fabric transitions in olivine, Sci. China Earth Scie., 59, 1138–1156, https://doi.org/10.1007/s11430-016-5310-z, 2016. a
Wang, Z., Li, J., Feng, Z., Wang, L., and Liu, C.: Mechanism of Structure Variations at Rifted Margins in the Central Segment of South Atlantic: Insights from Numerical Modeling, Acta Geol. Sin.-Engl., 97, 1229–1242, https://doi.org/10.1111/1755-6724.15067, 2023. a
Warren, J. M. and Hansen, L. N.: Ductile deformation of the lithospheric mantle, Annu. Rev. Earth Pl. Sc., 51, 581–609, https://doi.org/10.1146/annurev-earth-031621-063756, 2023. a, b
Watremez, L., Burov, E., d'Acremont, E., Leroy, S., Huet, B., Le Pourhiet, L., and Bellahsen, N.: Buoyancy and localizing properties of continental mantle lithosphere: Insights from thermomechanical models of the eastern Gulf of Aden, Geochem. Geophy. Geosy., 14, 2800–2817, https://doi.org/10.1002/ggge.20179, 2013. a
Weinstein, S. A. and Olson, P. L.: Thermal convection with non-Newtonian plates, Geophys. J. Int., 111, 515–530, https://doi.org/10.1111/j.1365-246X.1992.tb02109.x, 1992. a
Whitney, D. L., Delph, J. R., Thomson, S. N., Beck, S. L., Brocard, G. Y., Cosca, M. A., Darin, M. H., Kaymakci, N., Meijers, M. J., Okay, A. I., Rojay, B., Teyssier, C. and Umhoefer, P. J.: Breaking plates: Creation of the East Anatolian fault, the Anatolian plate, and a tectonic escape system, Geology, 51, 673–677, https://doi.org/10.1130/G51211.1, 2023. a
Wu, B., Conrad, C. P., Heuret, A., Lithgow-Bertelloni, C., and Lallemand, S.: Reconciling strong slab pull and weak plate bending: The plate motion constraint on the strength of mantle slabs, Earth Planet. Sc. Lett., 272, 412–421, https://doi.org/10.1016/j.epsl.2008.05.009, 2008. a
Yuen, D. A. and Schubert, G.: On the stability of frictionally heated shear flows in the asthenosphere, Geophys. J. Int., 57, 189–207, https://doi.org/10.1111/j.1365-246X.1979.tb03780.x, 1979. a
Zhang, L., Zlotnik, S., and Li, C.-F.: Anomalous Subduction Initiation Young Under Old Oceanic Lithosphere, Geochem. Geophy. Geosy., 22, e2020GC009549, https://doi.org/10.1029/2020GC009549, 2021. a
Zhong, X. and Li, Z.-H.: Forced Subduction Initiation at Passive Continental Margins: Velocity-Driven Versus Stress-Driven, Geophys. Res. Lett., 46, 11054–11064, https://doi.org/10.1029/2019GL084022, 2019. a
Zhou, X., Li, Z.-H., Gerya, T. V., and Stern, R. J.: Lateral propagation–induced subduction initiation at passive continental margins controlled by preexisting lithospheric weakness, Sci. Adv., 6, eaaz1048, https://doi.org/10.1126/sciadv.aaz1048, 2020. a
Zwaan, F., Chenin, P., Erratt, D., Manatschal, G., and Schreurs, G.: Complex rift patterns, a result of interacting crustal and mantle weaknesses, or multiphase rifting? Insights from analogue models, Solid Earth, 12, 1473–1495, https://doi.org/10.5194/se-12-1473-2021, 2021. a
Zwaan, F., Erratt, D., Manatschal, G., Chenin, P., and Schreurs, G.: On the delayed expression of mantle inheritance–controlled strain localization during rifting, Geology, 52, 764–768, https://doi.org/10.1130/G52309.1, 2024. a
- Abstract
- Introduction
- Methods: thermo-mechanical model
- Post-processing diagnostics
- Results
- Discussion
- Conclusions
- Appendix A: End-members of deformation pattern (distributed vs. localized)
- Appendix B: Transition time ttr calculation
- Appendix C: Rheological feedbacks in the presence of a stiff mid-lithosphere layer
- Appendix D: Varying the extension rate and initial thermal plate age
- Appendix E: Simulations with a depth-dependent yield stress
- Code and data availability
- Author contributions
- Competing interests
- Disclaimer
- Acknowledgements
- Financial support
- Review statement
- References
- Supplement
- Abstract
- Introduction
- Methods: thermo-mechanical model
- Post-processing diagnostics
- Results
- Discussion
- Conclusions
- Appendix A: End-members of deformation pattern (distributed vs. localized)
- Appendix B: Transition time ttr calculation
- Appendix C: Rheological feedbacks in the presence of a stiff mid-lithosphere layer
- Appendix D: Varying the extension rate and initial thermal plate age
- Appendix E: Simulations with a depth-dependent yield stress
- Code and data availability
- Author contributions
- Competing interests
- Disclaimer
- Acknowledgements
- Financial support
- Review statement
- References
- Supplement