the Creative Commons Attribution 4.0 License.
the Creative Commons Attribution 4.0 License.
 | 10 Oct 2019
Topological analysis in Monte Carlo simulation for uncertainty propagation
Evren Pakyuz-Charrier
Mark Jessell
Jérémie Giraud
Mark Lindsay
Vitaliy Ogarko
This paper proposes and demonstrates improvements for the Monte Carlo simulation for uncertainty propagation (MCUP) method. MCUP is a type of Bayesian Monte Carlo method aimed at input data uncertainty propagation in implicit 3-D geological modeling. In the Monte Carlo process, a series of statistically plausible models is built from the input dataset of which uncertainty is to be propagated to a final probabilistic geological model or uncertainty index model.
Significant differences in terms of topology are observed in the plausible model suite that is generated as an intermediary step in MCUP. These differences are interpreted as analogous to population heterogeneity. The source of this heterogeneity is traced to be the non-linear relationship between plausible datasets' variability and plausible model's variability. Non-linearity is shown to mainly arise from the effect of the geometrical rule set on model building which transforms lithological continuous interfaces into discontinuous piecewise ones. Plausible model heterogeneity induces topological heterogeneity and challenges the underlying assumption of homogeneity which global uncertainty estimates rely on. To address this issue, a method for topological analysis applied to the plausible model suite in MCUP is introduced. Boolean topological signatures recording lithological unit adjacency are used as n-dimensional points to be considered individually or clustered using the density-based spatial clustering of applications with noise (DBSCAN) algorithm. The proposed method is tested on two challenging synthetic examples with varying levels of confidence in the structural input data.
Results indicate that topological signatures constitute a powerful
discriminant to address plausible model heterogeneity. Basic topological
signatures appear to be a reliable indicator of the structural behavior of
the plausible models and provide useful geological insights. Moreover,
ignoring heterogeneity was found to be detrimental to the accuracy and
relevance of the probabilistic geological models and uncertainty index
models.
Highlights.
-
Monte Carlo uncertainty propagation (MCUP) methods often produce topologically distinct plausible models.
-
Plausible models can be differentiated using topological signatures.
-
Topologically similar probabilistic geological models may be obtained through topological signature clustering.
- Article
(9443 KB) - Full-text XML
- BibTeX
- EndNote


Input data uncertainty propagation is an essential part of risk-aware 3-D geological modeling (Schweizer et al., 2017; Wang et al., 2017; Nearing et al., 2016; Aguilar et al., 2018; Mery et al., 2017; Dang et al., 2017; Lark et al., 2013; Carter et al., 2006). Accurate quantification of geometrical uncertainty is indeed key to determine the degree of confidence one can put into a model. How reliable a 3-D geological model is and how this reliability varies in space are indispensable data to seek improvement of said model. Monte Carlo uncertainty propagation (MCUP) algorithms have recently been proposed to tackle this issue (de la Varga and Wellmann, 2016; Pakyuz-Charrier et al., 2018a). MCUP methods (Fig. 1) aim to propagate the measurement uncertainty of structural input data (interface points, foliations, fold axes) through implicit 3-D geological modeling engines to produce probabilistic geological models and uncertainty index models. To do so, each structural input datum is replaced by a probability distribution (thought to best represent its measurement uncertainty) called a disturbance distribution (Pakyuz-Charrier et al., 2018a). Disturbance distributions are then sampled using Markov-chain Monte Carlo (Cherpeau et al., 2010) or random methods to generate alternative statistically plausible datasets. Plausible datasets can then be used to build a suite of plausible 3-D geological models which may be merged into probabilistic geological models or uncertainty index models. A probabilistic geological model quantifies the observed lithological frequencies in each cell in the form of a categorical distribution. An uncertainty index model expresses the dispersion of these categorical distributions. Recent works (Thiele et al., 2016a, b; Pellerin et al., 2015) have demonstrated that the plausible 3-D geological model suite may display great geometrical variability to the point of making some plausible models topologically distinct from one another. Plausible model heterogeneity is damaging to the relevance of MCUP because the probabilistic geological models and uncertainty index models implicitly assume plausible model homogeneity.

In this paper, the standard MCUP procedure is described, the source of plausible model incompatibility is discussed, and a topological analysis method is proposed to address the issue and improve the relevance of probabilistic geological models and uncertainty index models to real world problems. The method relies on the extraction of adjacency matrices for each plausible model. Adjacency matrices qualify which geological units are in contact using Boolean logic. These matrices are then converted to binary signals called topological signatures that are then clustered using DBSCAN. The goal is to provide MCUP practitioners with a procedure to ensure that probabilistic geological models and uncertainty index models are made of topologically similar plausible models. Lastly, the method is tried and tested on two synthetic case studies to demonstrate its applicability.
MCUP is an uncertainty propagation method focusing on input structural data (interface points, foliations, fold axes, drill-hole data). It is usually applied to implicit 3-D geological modeling (Giraud et al., 2017; Lindsay et al., 2012) MCUP. MCUP aims to provide probabilistic models and estimate model uncertainty by producing a range of alternate plausible 3-D geological models and performing comparative analysis on them (Pakyuz-Charrier et al., 2018c; Wellmann, 2013; Lindsay et al., 2013; Julio et al., 2015; Abrahamsen et al., 1991). The 3-D geological model suites are built from a series of plausible datasets that are generated through input data perturbation (Fig. 1), which is a process in which alternative input datasets are stochastically generated from the original data inputs by sampling from probability distribution functions known as disturbance distributions (Pakyuz-Charrier et al., 2018a).
2.1 Disturbance distribution parameterization
Disturbance distributions are probability distribution functions that are used to generate plausible datasets in MCUP. They are designed to simulate the effect of the inherent uncertainty of each observation separately. In principle, an individual disturbance distribution is associated with each observation (Fig. 1, preprocessing). Disturbance distributions are expected to be chosen and parameterized based on thorough metrological analysis of the original dataset, since disturbance distributions are expected to aggregate as many sources of input data uncertainty as possible. These sources of uncertainty relate to measurement error, rounding error, user error, local variability, miscalibration or projection issues (Bardossy and Fodor, 2001). Generally, Gaussian-like distributions make for appropriate disturbance distributions (Pakyuz-Charrier et al., 2018a). Disturbance distribution selection and parameterization is a complex topic and is outside the scope of this paper. It can be noted, however, that particular care must be taken that spherical distributions (see Appendices) should be used when handling spherical data such as orientation measurements. However, practitioners may seek guidance from recent practical metrological work on foliations (Novakova and Pavlis, 2017; Stigsson, 2016; Cawood et al., 2017) and more theoretical work on disturbance distribution selection/parameterization for MCUP (de la Varga and Wellmann, 2016; Pakyuz-Charrier et al., 2018a).
2.2 Plausible datasets' generation
Plausible datasets are obtained by sampling from the numerous disturbance distributions that have been defined for each input observation. The sampling step is often referred to as the “perturbation” of the input data (Cherpeau et al., 2010). In this study, errors are assumed to not show any spatial dependency and the sampling is therefore performed independently. Such assumption is mostly valid when measurements can be considered to be physically independent (Pakyuz-Charrier et al., 2018a). However, spatial correlation of errors can be observed even in this case. This is especially true for cyclical datasets such as foliations in folding scenarios. Evidently, structural data that are derived from sources that naturally exhibit spatial dependency, such as seismic horizon picks, should not be perturbed in this way. The sampling step may be followed by a range of statistical checks to ensure stationarity, reject outliers or perform variographic analysis.
2.3 Plausible model building
Plausible dataset generation is an important part of the MCUP method because it heavily predetermines its outcomes. However, plausible datasets are only as relevant as the plausible model they correspond to. MCUP is then largely dependent on the particulars of the chosen modeling engine (Fig. 1, building). Any modeling engine relies on the conceptualization of the phenomenon it is supposed to model. Conceptualization relies mainly on abstraction and simplification to make the modeling problem accessible to our minds and technology. Therefore, any workflow or method that relies on a modeling engine subsequently relies on these abstractions and simplifications which, by definition, are incomplete and uncertain. Consequently, MCUP is sensitive to this kind of “conceptual uncertainty” and care should be taken when selecting or parameterizing the modeling engine. Given that the aim of MCUP is to propagate input uncertainty through the modeling engine to the final model, several indispensable properties of the modeling engine may be identified: (i) the ability to estimate and propagate its own uncertainty, (ii) the ability to handle multiple plausible datasets without having to be reconfigured manually and (iii) the ability to function without extensive expert input. These properties are generally met by implicit modeling engines (Chilès et al., 2004; Aug et al., 2005; Calcagno et al., 2008; Chilès and Delfiner, 2009) by the virtue of them being reliant on potential field interpolation to estimate the geological surfaces from the input structural data. The interpolator is normally parameterized using variographic analysis and a geometrical rule set to solve geometrical ambiguities (Jessell, 2001). The geometrical rule set consists of a series of geometrical constraints such as the intersection priority of faults and geological units that are used to determine which interface stops on which. Conceptually, the geometrical rule set enforces the age relationships between the faults and/or geological units in the model. In this paper, the modeling engine is the GeoModeller software which uses a stochastic co-kriging interpolator and constrains surfaces using a predefined stratigraphic pile and fault relationship matrices as geometrical rule set (Guillen et al., 2008; Calcagno et al., 2008).
2.4 Comparative analysis
In implicit 3-D geological modeling, a model is essentially a set of spatial functions that describe the geometry of stratigraphic and intrusive interfaces and fault planes. In this form, it is difficult to apply common comparative analysis methods. Therefore, plausible models are either discretized to 3-D grids (voxets) or converted to triangulated interfaces (Fig. 1, Postprocessing). Note that in all three cases, these operations are further simplifications of the models and add more uncertainty to the final outcome. Each of these transformations allow for different comparative analyses to be run: (i) voxets are used to build probabilistic geological models and uncertainty index models such as entropy or stratigraphic variability (Wellmann and Regenauer-Lieb, 2012; Lindsay et al., 2012); (ii) the shape of triangulated surfaces may be used to estimate the variability of curvature (Lindsay et al., 2013). Furthermore, the results of these analyses can be fed to external validation systems to reduce geological uncertainty and improve understanding of the modeled volume. Examples of external validation systems include geophysical inversion (Giraud et al., 2019), concurrent geophysical forward modeling (Bijani et al., 2017; Lipari et al., 2017), 3-D restoration, fluid flow simulations or ground truthing. Lastly, the results obtained from the external validation systems may be reutilized by MCUP to further refine the models.
As stated in the previous section, comparative analysis in MCUP aims to study the variability of the plausible models and extract meaning from them. To this end, plausible models are transformed to a more manageable form that fits our analysis tools (Fig. 1). The most common comparative analysis tools used in MCUP are uncertainty index models such as information entropy and stratigraphic variability. These indices are computed from a relative frequency voxet that is obtained by merging the voxets from all of the plausible models together.
The uncertainty index models used in MCUP are scalar proxies for categorical uncertainty, and one of the critical conditions for a single scalar to be representative of the uncertainty of a variable is that it has to be distributed unimodally. To assume unimodality is risky because it restrains the relevance of the uncertainty index model to single population cases only. In the case of a heterogeneous population or a mixture of populations, this procedure will fail to represent accurately the behavior of the variable in the same way a bimodal distribution cannot be fully described by its mean and variance (Fig. 2). In the case of MCUP, perturbation is usually performed using unimodal Gaussian disturbance distributions (Pakyuz-Charrier et al., 2018a, b) and at first sight it may seem that model building should result in a single population of plausible models. However, it has been demonstrated on simple synthetic cases that plausible models with strikingly different structural geological features may arise from perturbing the same original dataset (Thiele et al., 2016a, b) using unimodal disturbance distributions. These differences indicate that standard perturbation may lead to plausible model topological heterogeneity. This effect stems from the fact that the relationship between the variability of the plausible datasets and that of their corresponding plausible models is non-linear (Fig. 3). The non-linearity of the plausible model suites can be explained by the interactions between the interpolator and the geometrical rule set. The interpolators used in implicit 3-D geological modeling are usually linear and it is the geometrical rule set that introduces non-linearity by adding a discrete component to model realization. For example, a plausible model suite may display the same fault in various scenarios (normal, reverse, décollement) or open/close potential traps for fluids (Fig. 3). In the latter example (Fig. 4), non-linearity is observed because of the geometrical rule set that gives intersection priority to the top impermeable unit (green) over the lower units. If not for this rule set, interfaces would vary linearly, and no unit would stop on any other unit. Consequently, very small changes in a plausible dataset may induce large changes in the subsequent plausible. Therefore, standard statistical filters applied to plausible datasets are unlikely to prevent or warn of potential plausible model topological heterogeneity. Special sampling methods such as Gibbs sampling may decrease model variability by forcing internal spatial correlation in plausible datasets (Wang et al., 2017), although, as stated above, this is not guaranteed. Moreover, these methods work best if errors are spatially dependent. This is normally not the case for sparse geological structural measurements taken individually. Actually, there is no logical reason to consider that the measurement errors related to, for example, two foliations measured with a compass in different areas are dependent on one another.
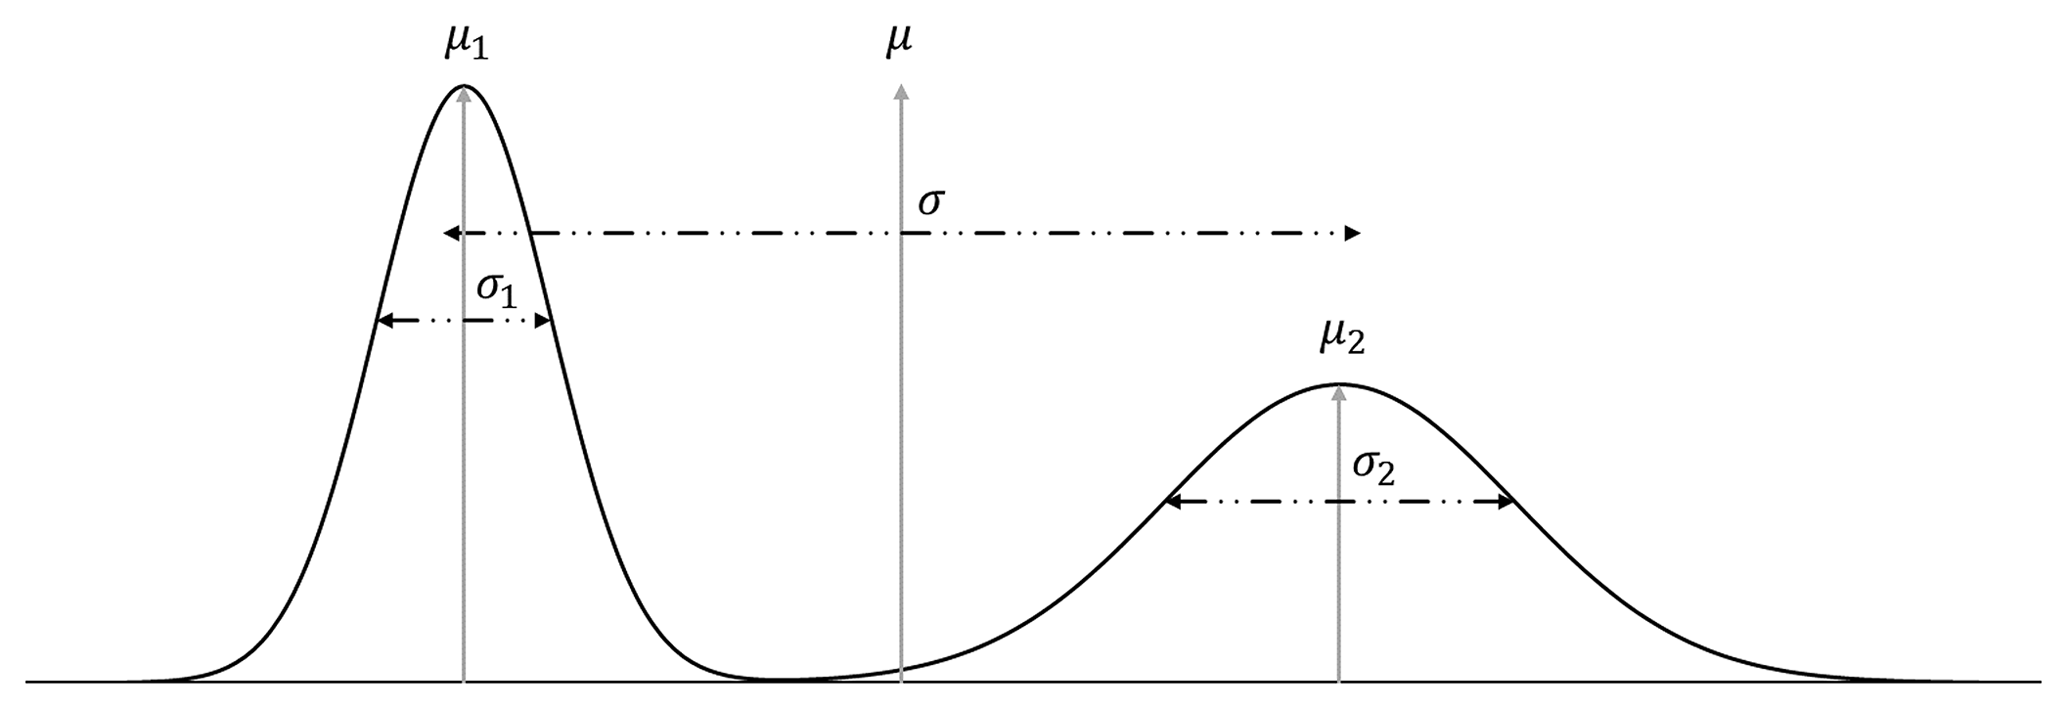
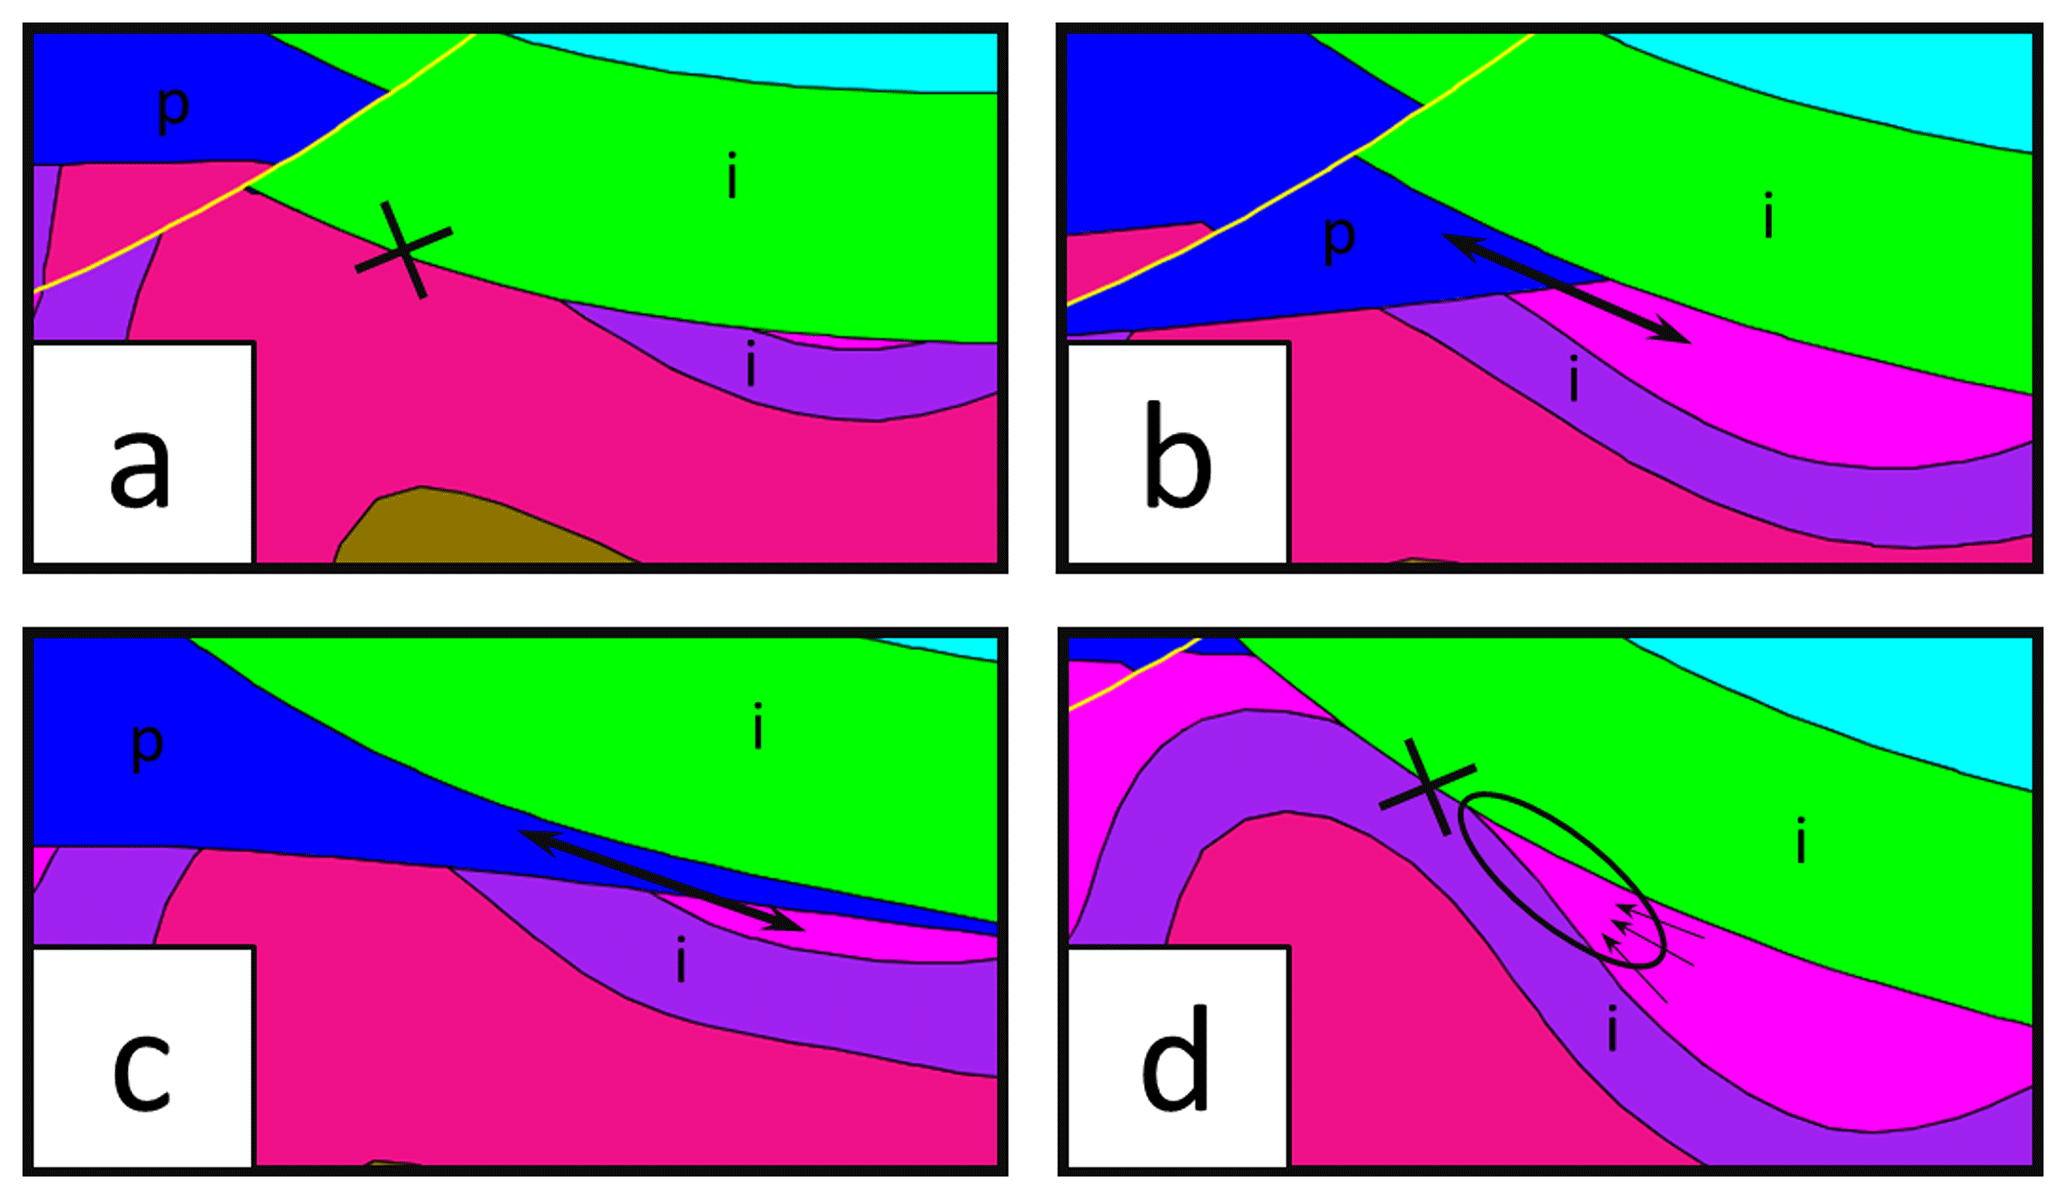
Figure 3The open or closed status of an ore deposit sedimentary trap varies with the topology of surrounding impermeable (i) units.
As ignoring plausible model suite topological heterogeneity may lead to an unknown amount of knowledge degradation, the need to distinguish and classify plausible models that express distinct topologies becomes apparent. By doing so, it becomes possible to design a scenario-based comparative analysis step in MCUP. In principle, this approach has multiple advantages, a geological scenario-based procedure can be expected to (i) allow rejection of physically absurd models, (ii) reduce uncertainty on a per-scenario basis and (iii) enable targeted improvement of the model by comparing data leverage between scenarios. A common way to distinguish groups or trends in complex datasets is via the use of clustering algorithms or machine learning. In MCUP, clustering is preferable because machine learning relies on training and validation datasets to function properly. Unfortunately, MCUP does not provide a reliable way to determine the adequacy of a plausible model-training dataset for machine learning beforehand. In contrast, and given a certain number of assumptions, clustering algorithms are expected to work with the raw data. In this paper, the density-based spatial clustering of applications with noise (DBSCAN) method (Ester et al., 1996) was selected for its simplicity, speed, robustness and overall reliability (Chakraborty et al., 2014; Schubert et al., 2017). However, all clustering algorithms require a relevant discriminatory variable to build clusters efficiently. In this instance, the discriminatory variable has to be logically linked with plausible model topological heterogeneity. A potential candidate that meets this criterion is lithological topology, which expresses geological unit adjacency throughout the model in a single categorical matrix. Lithological topology was recently demonstrated to be an efficient tool to recognize highly discriminating features from plausible models in MCUP (Wellmann et al., 2016; Thiele et al., 2016a; Pellerin et al., 2015). As stated in the previous sections, the non-linearity and non-uniqueness in 3-D geological modeling is the main cause of plausible model topological heterogeneity. In addition, non-linearity and non-uniqueness result from the topological constraints imposed by the geometrical rule set. Therefore, the geometrical rule set is at least partially responsible for the heterogeneity. It is then reasonable to assume that the topology of the plausible models can be used as a discriminatory variable to combat topological heterogeneity.
4.1 Lithological topology
Topology describes the properties of special mathematical spaces that are unaltered under continuous deformation. The 3-D geological modeling mostly concerns itself with the topic of geospatial topology that focuses on spatial relationships such as adjacency, overlap or separation of geometrical objects such as points, lines, polygons and polyhedrons (Thiele et al., 2016a). Essentially, the use of topological relationships to characterize 3-D geological models allows a compact expression of a subset of their geometry (Burns, 1988). Combined with the knowledge of the intrinsic physical properties of the rock types that compose geological units, these relationships constrain the downstream predictions resulting from 3-D geological models in terms of physical processes such as fluid, heat flow and electrical flow, as well as mechanical stresses. The most common relationships between 3-D objects encountered in 3-D geological models are adjacency and separation of lithological units. In their simplest form, these relationships can be expressed using an adjacency matrix. Each element of the adjacency matrix is a Boolean, where 0 encodes separation and 1 encodes adjacency (Fig. 4). However, an adjacency matrix contains both redundant and irrelevant information. Indeed, the adjacency matrix A of a model M comprised of n geological units is symmetric and hollow. A is then of size n2, with its diagonal comprised solely of 1, while both sides are transpose of one another; it is then useful to half-vectorize A and remove unit elements from the diagonal following the triangular number sequence. For example, the 4×4 adjacency matrix,
is half-vectorized:

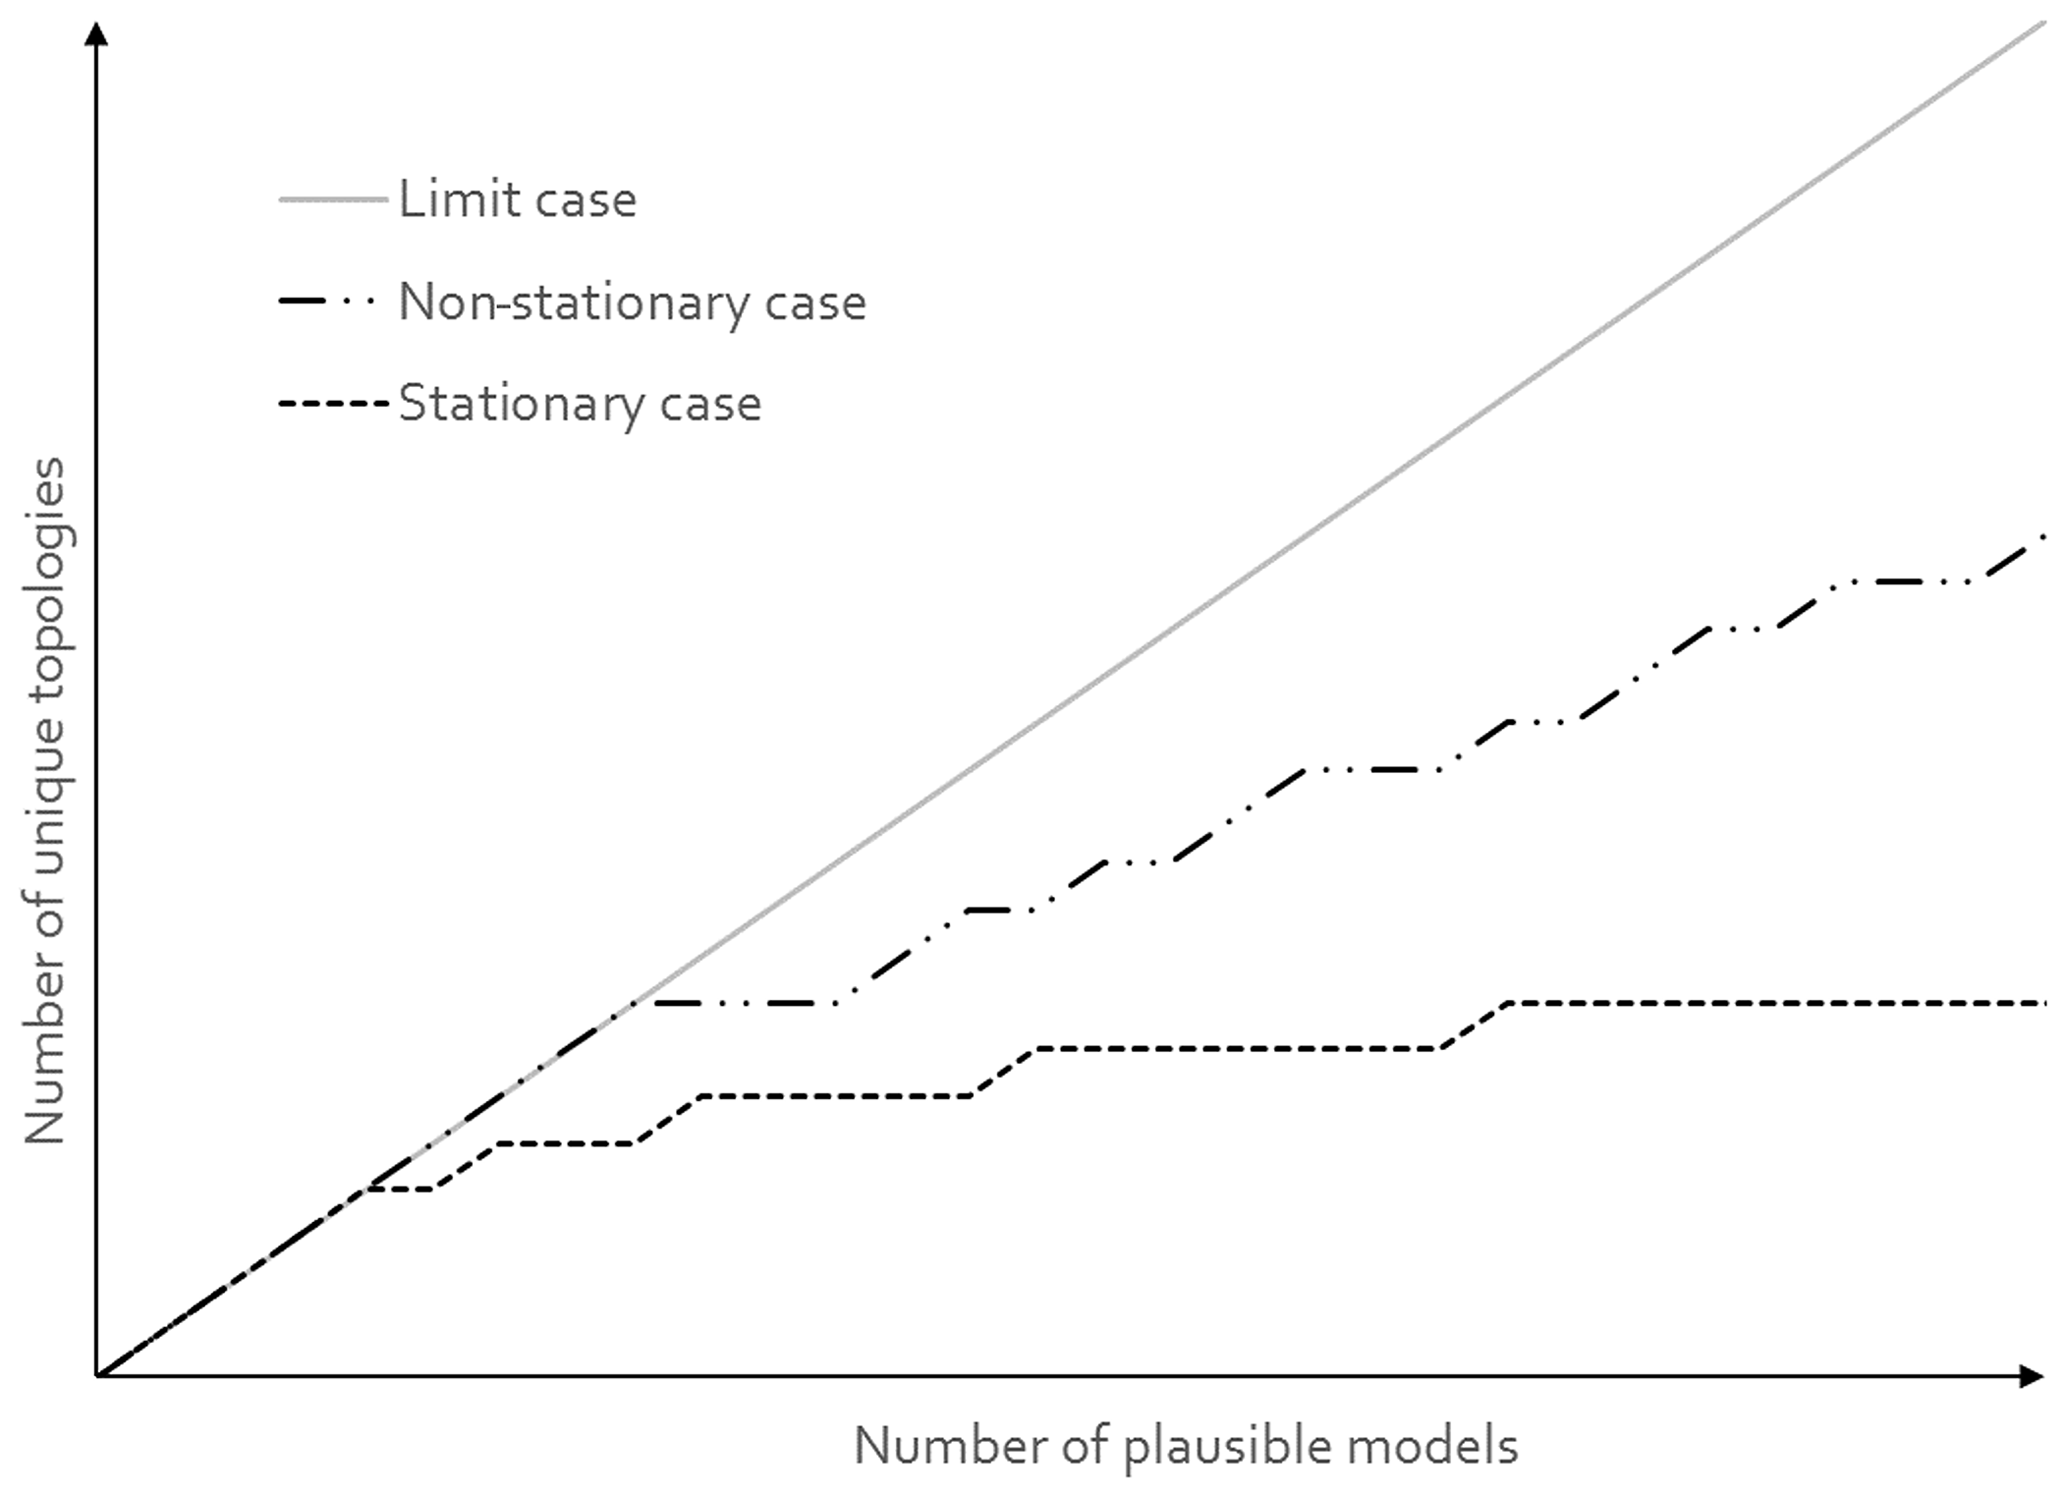
Note that vech(A) is of size and contains all the necessary information to fully describe the adjacency of lithological units in a 3-D geological model with n distinct lithological units. vech(A) can be also considered as a bit binary sequence called a basic topological signature. Although the diagonal of unit entries may seem redundant, it actually encodes the presence of a unit in the model. This is useful in MCUP because a plausible model may miss a unit as a result of the perturbation process. The total number of possible topological signatures is . However, it is unlikely that all possible signatures are present in the plausible model suite given that the geometrical rule set constrains their topology. Consequently, the issue of the representativity of the plausible model suite in terms of the variability of its topological signatures comes into question. At a minimum, the variability of topological signatures should be qualitatively representative of the plausible model space to allow the clustering algorithm to delineate the right number of clusters. Cumulative observed topological signature graphs are a practical and efficient way to determine the topological representativity of the plausible model suite in real time (Thiele et al., 2016b). As the modeling engine produces new plausible models, these graphs plot the number of distinct topological signatures observed versus the number of plausible models generated so far. When the number of distinct topological signatures observed reaches a plateau, it is safe to consider that most topologies have been observed and qualitative topological stationarity may then be assumed reasonably (Fig. 5).
4.2 Topological clustering using DBSCAN
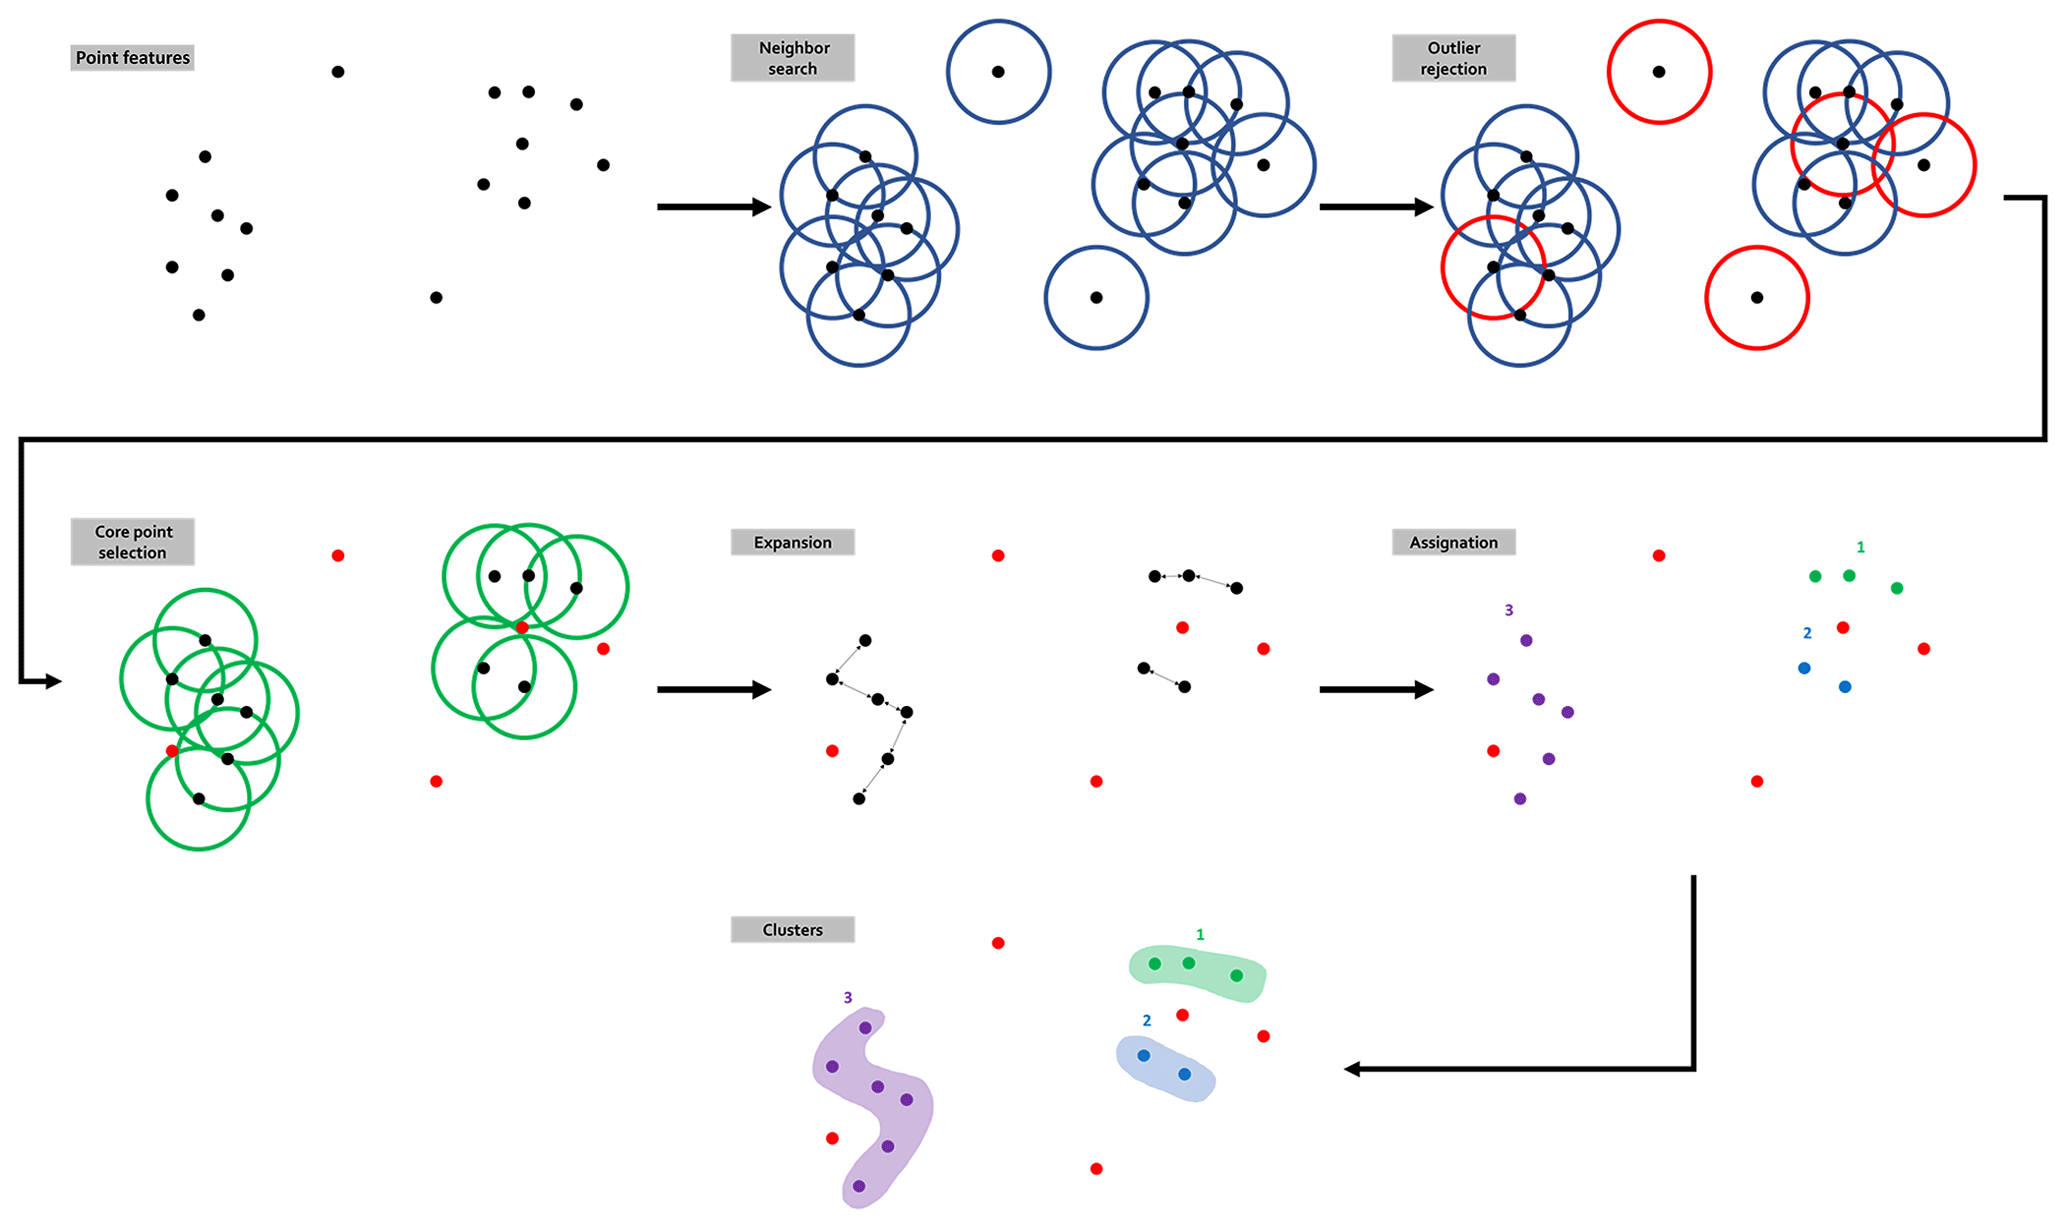
DBSCAN is a point-density-reliant flat data clustering algorithm (Schubert et al., 2017; Ester et al., 1996). DBSCAN is based on the notion of the reachability of border points from core points (Fig. 6). The algorithm only needs two parameters: (i) the minimum number of points Pmin that are required to form a cluster and (ii) the maximum distance ε allowed for two points to still be considered to be neighbors. On this basis, the algorithm builds a distance matrix between all points and uses that matrix to determine the neighbors of each point based on ε. Each point that has at least Pmin neighbors is a core point that forms a cluster seed to which all directly reachable points are attached. In order to build the distance matrix, DBSCAN requires each point to be characterized by a metric variable. Therefore, the variable would allow distances to be computed using regular norms such as the Euclidean distance. However, topological signatures form a series of Boolean variables that cannot provide appropriate measures for they are not additive. An alternative is to consider the whole topological signatures as a binary word and use the Hamming distance (Hamming, 1950) as the metric. The Hamming distance counts the number of individual bit switches required to match two binary words of equal lengths, effectively quantifying their disagreement. Implementation-wise, a simple XOR over two topological signatures gives the Hamming distance that separates them. As a special case, when ε=0 and Pmin=1, DBSCAN will distinguish every distinct topological signature into a separate cluster and the size of each cluster will count their occurrences.
4.3 Post-clustering analysis
Once the plausible model suite has been segregated into clusters based on their topology, a range of statistical methods may be applied to the results to (i) evaluate the quality and relevance of the clusters, (ii) determine data leverage in relation to the clusters, (iii) perform standard MCUP comparative analysis on the clusters and (iv) feed the clusters to an external rejection system. Cluster quality may be evaluated by computing the internal binary information entropy matrix E for each cluster:
where A(k) is the kth adjacency matrix of the cluster, c is the cardinality of the cluster, and ij are standard matrix indices. For a given cluster, E informs the user about the internal variability of the binary topological relationships between each lithological couple. Note that writing implies, for convenience, that each matrix entry is considered like a real number instead of a bit. Most entries are expected to be null, thus indicating no variations. Non-null entries indicate topological “switches” inside the cluster itself. That is, E highlights topological changes that the clustering algorithm considered not to be significant enough to warrant a split in the cluster. Importantly, this is directly translatable into geological insights: “these two models are different because in only one of them is the sandstone unit found adjacent to the shale unit”. Naturally, Eq. (3) may be applied to the whole suite of adjacency matrices as a practical reference to compare the internal information entropy matrices of each cluster to a global information entropy matrix. Standard MCUP comparative analysis tools may be applied to the individual clusters concurrently to, for example, obtain per-cluster/scenario uncertainty indices and sub-probabilistic geological models. Given that common MCUP uncertainty index models are sums of matching positive elements, per-cluster uncertainty index model voxets are guaranteed to yield equal or lower values compared to their global equivalent. Moreover, per-cluster uncertainty index models are expected to be better structured as a common effect of all clustering algorithms is to reduces intra-class variance. Clustered plausible models may be traced back to their plausible input datasets (structural measurements) to conduct cluster leverage analysis. The aim of cluster leverage analysis is to determine which parts of the datasets are responsible for the topological switches that induce the formation of new clusters. A straightforward way to achieve this aim would be to compute a central statistic such as the mean or the median for every individual datum input in every cluster.
where is the vector of central statistics, is the central statistic for the plausible input observation l, and t is the cardinality of the input data. The next step is to compare every matching individual input datum central statistic between all cluster pairs:
where a,b identifies a cluster pair and “∘” stands for the Hadamard product. The results of this procedure should be ranked to find the highest leverage plausible input data differences between clusters.
To serve as proof of concept, the plausible model clustering procedure that is proposed in the previous section is tested on a synthetic case of medium complexity called CarloTopo. The aim is to assess how plausible model clustering may improve the accuracy, practicability and tractability of MCUP in a comprehensible yet relevant environment. The procedure follows standard MCUP (Fig. 1) with topological clustering being added to the last step of comparative analysis. Results are expressed in three complementary modes: (i) differences between topological clusters are visualized using information entropy as a proxy for uncertainty estimation; (ii) intra-cluster variability is assessed using internal entropy matrices; (iii) the initial and individual plausible models are characterized by their topological signatures and lithological cross sections.
5.1 Model description and MCUP parameters
The CarloTopo 3-D geological model features eight lithological units distributed into five series and two faults (Fig. 7). All of the 25 foliations and 46 interface (Table 1) points for all units and faults are placed onto a single N–S vertical median cross section. This design decision was made to ensure that the cross sections discussed in the subsequent sections are representative of the models. CarloTopo simulates a normally faulted basin (cyan and green) placed on top of a mafic formation (blue) that sits on an erosional surface. Below the erosional surface is a metamorphic folded series (pink) comprised of three individual formations. The metamorphic series rests onto the basement and both are intruded by a pluton (red). The mafic and metamorphic units were both interpolated with an assumption of strong anisotropy over the x axis while other units were left to be isotropic. This design decision was made to prevent excessive variations within the plausible model suite and ease interpretation. The geometries for each unit were designed to manifest as many common geological features as possible without compromising its relevance for practical issues such as mining/oil and gas exploration. More specifically, several potential traps for sedimentary-hosted deposits were included in the original model along with a network of faults that serve as theoretical channels or barriers (Fig. 8). The case study was split into two separate MCUP experiments with different disturbance distribution parameterization with over a thousand perturbations each. The first run aims to simulate a high-input data confidence scenario applicable to well-surveyed areas. Conversely, the second run simulates a low-confidence scenario applicable to legacy data or early stages of exploration. Disturbance distributions in the high-input data confidence scenario were chosen to be of the Gaussian type with relatively low dispersion, whereas uniform-type distribution parameterized with large ranges were used for the low-input data confidence scenario (Table 2).

Figure 7CarloTopo 3-D geological model with original input foliations (disks) and interfaces (points), geometrical rule sets for units and faults, and adjacency matrix. The model box size is m, and all structural data are located on the x median vertical cross section.
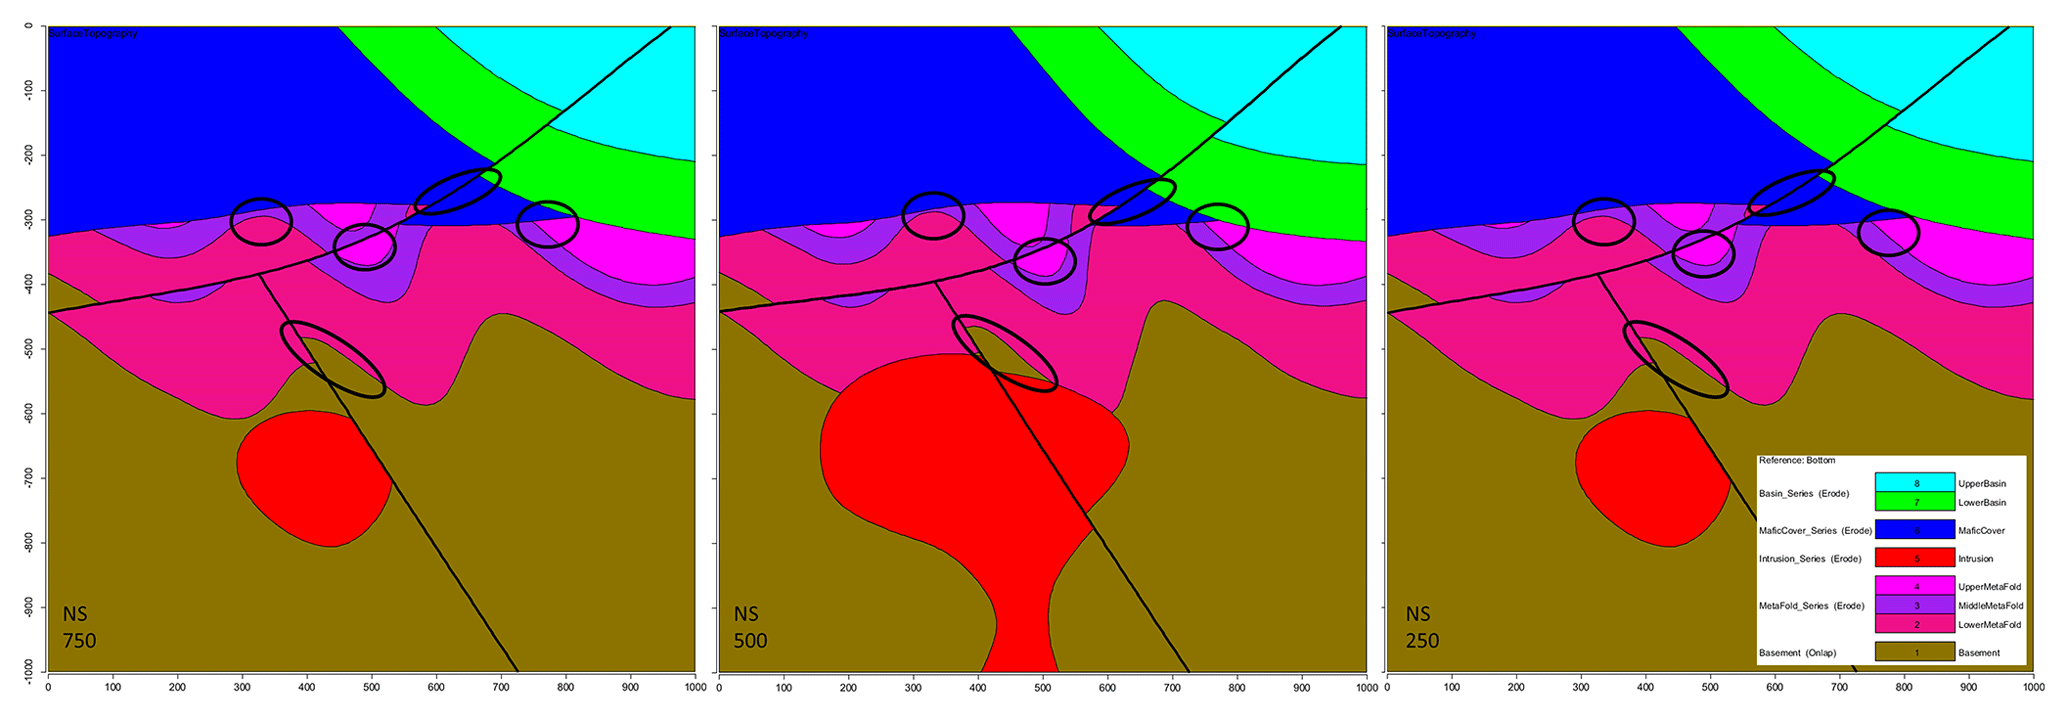
Figure 8Original CarloTopo vertical cross sections at x=250, 500 and 750 m, with potential ore deposit traps or channels circled.
Table 1Original input structural data description for the CarloTopo 3-D geological model. N/a: not applicable.
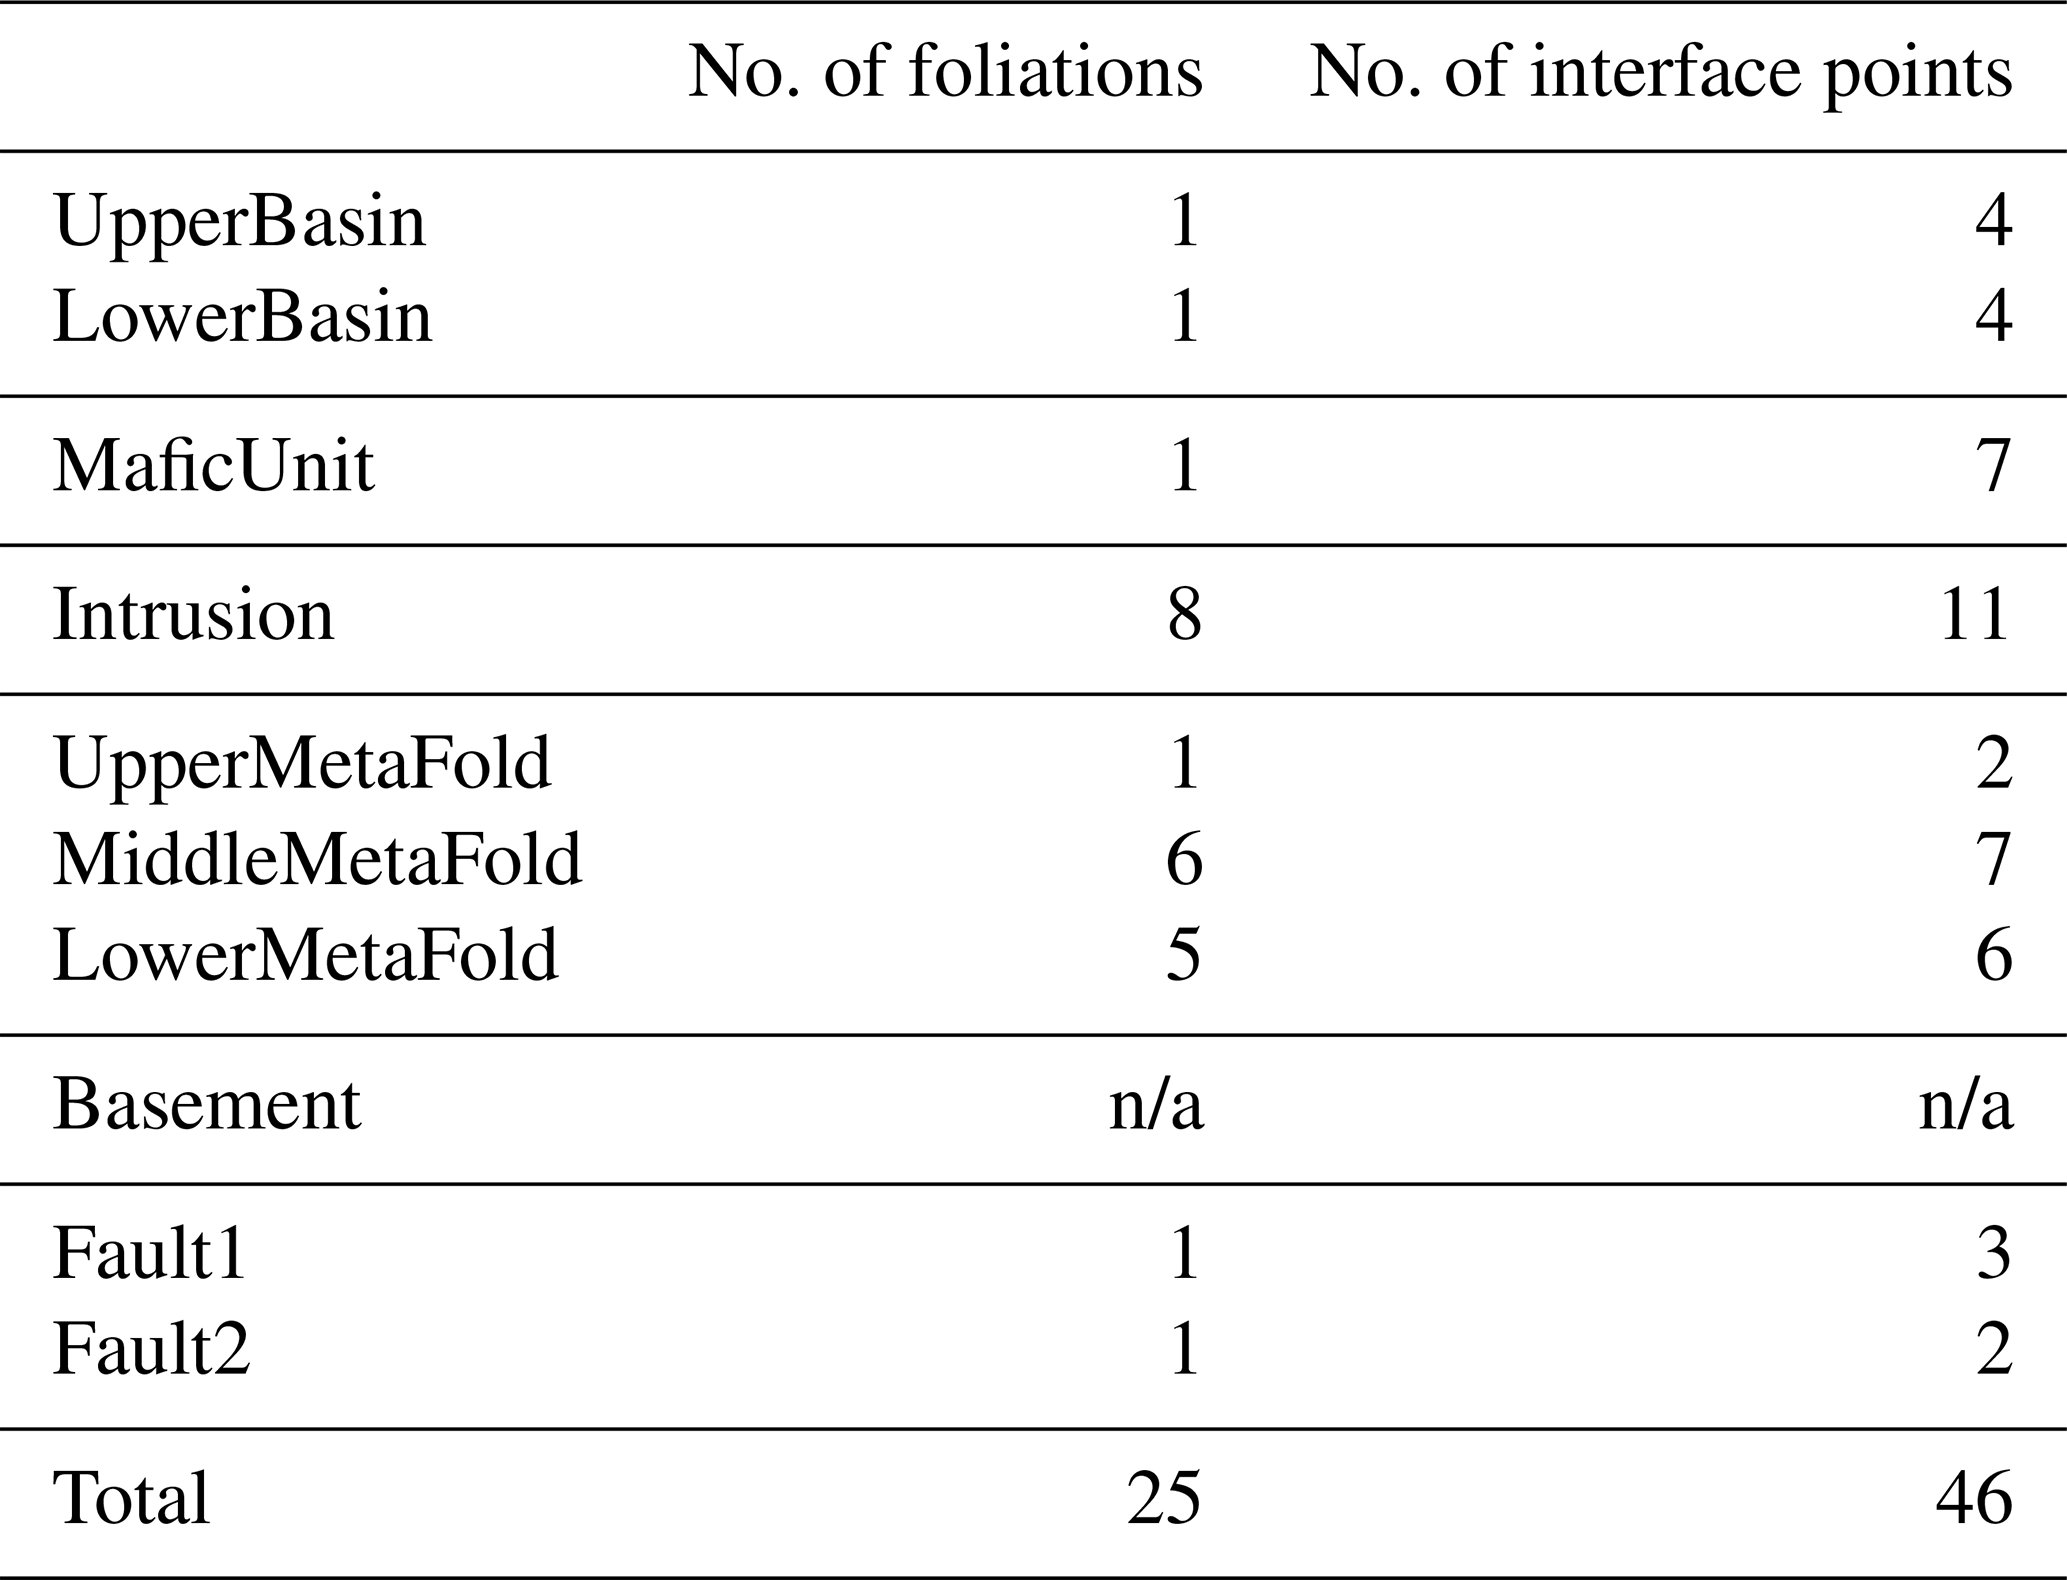
Table 2Summary of all MCUP parameters used in this study.
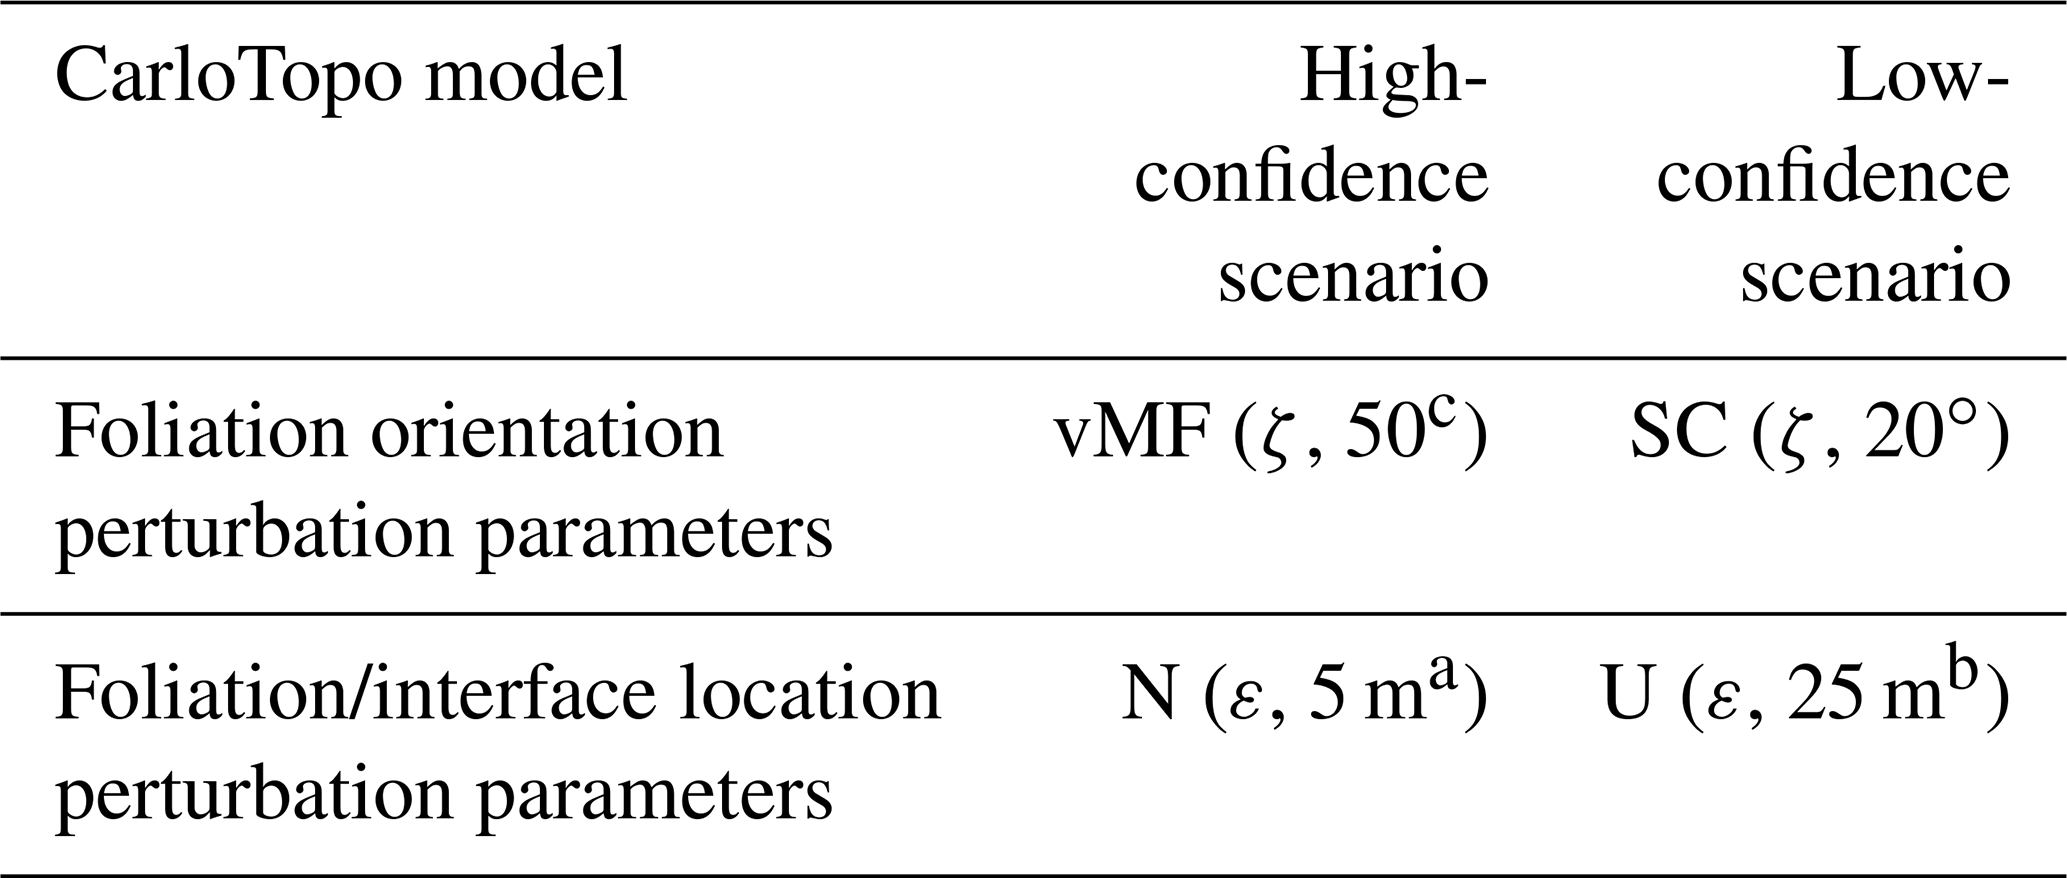
a 0.5 % of model box extent. b 2.5 % of model box extent. c 16∘ 95 % confidence interval. SC: spherical distribution. vMF: von Mises–Fisher distribution. U: continuous uniform distribution. N: normal distribution. ζ: original foliation. ε: original interface point.
5.2 High-input data confidence run
For this run, a global information entropy uncertainty index model voxet was produced to serve as a reference against matching topology-based estimates. Three vertical N–S cross sections were extracted from the voxet at 250, 500 and 750 m easting (Fig. 9). The 250 and 750 m information entropy cross sections are almost identical because the original model is symmetrical about the N–S median cross section where all structural data are located. Both sections display low-to-medium levels of entropy (0.20 to 0.40) distributed around the original interfaces' trace and forming entropy halos of about 70 m apparent thickness for non-triple-point areas. Conversely, triple points and areas of potential geometrical ambiguities display medium-to-high levels of entropy (0.50 to 0.70) and thicker halos (∼100 m). The 500 m information entropy cross section exhibits lower levels of entropy and much thinner halos (∼20 m) because of its extreme proximity to the structural data inputs.
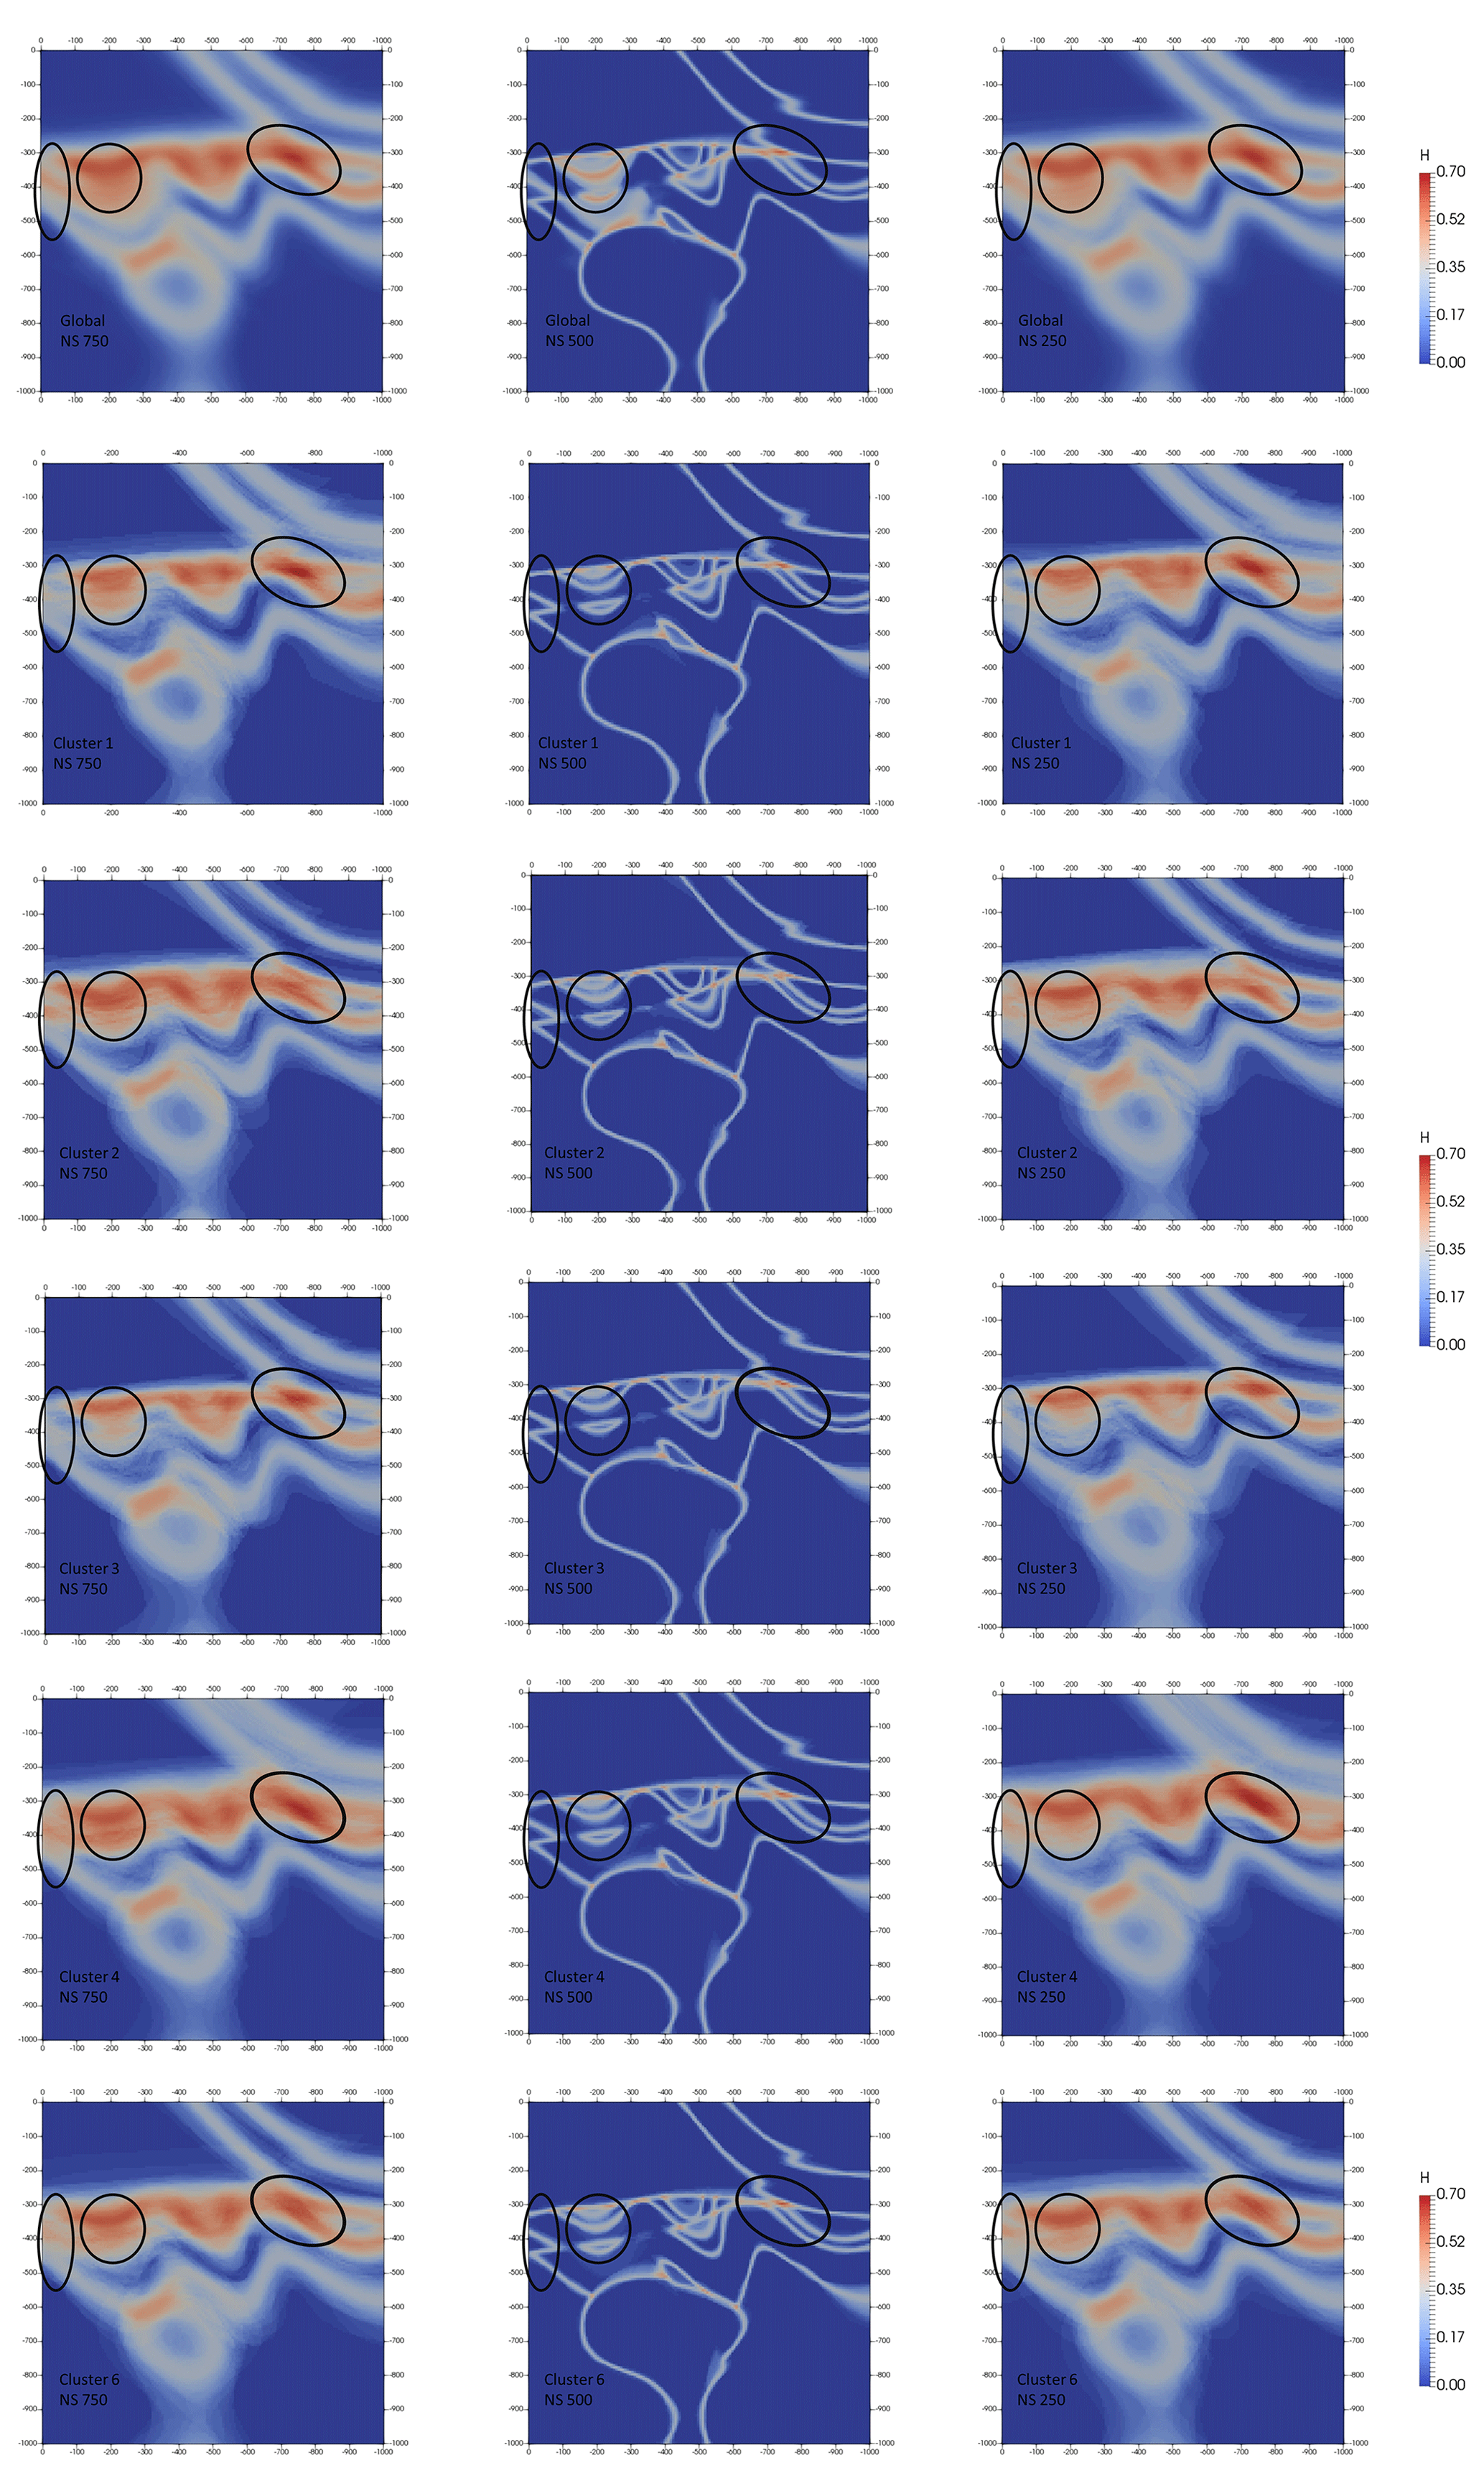
Figure 9Global (top row) and top five most significant topological signatures vertical cross sections of information entropy uncertainty index models for the low-input data confidence run.
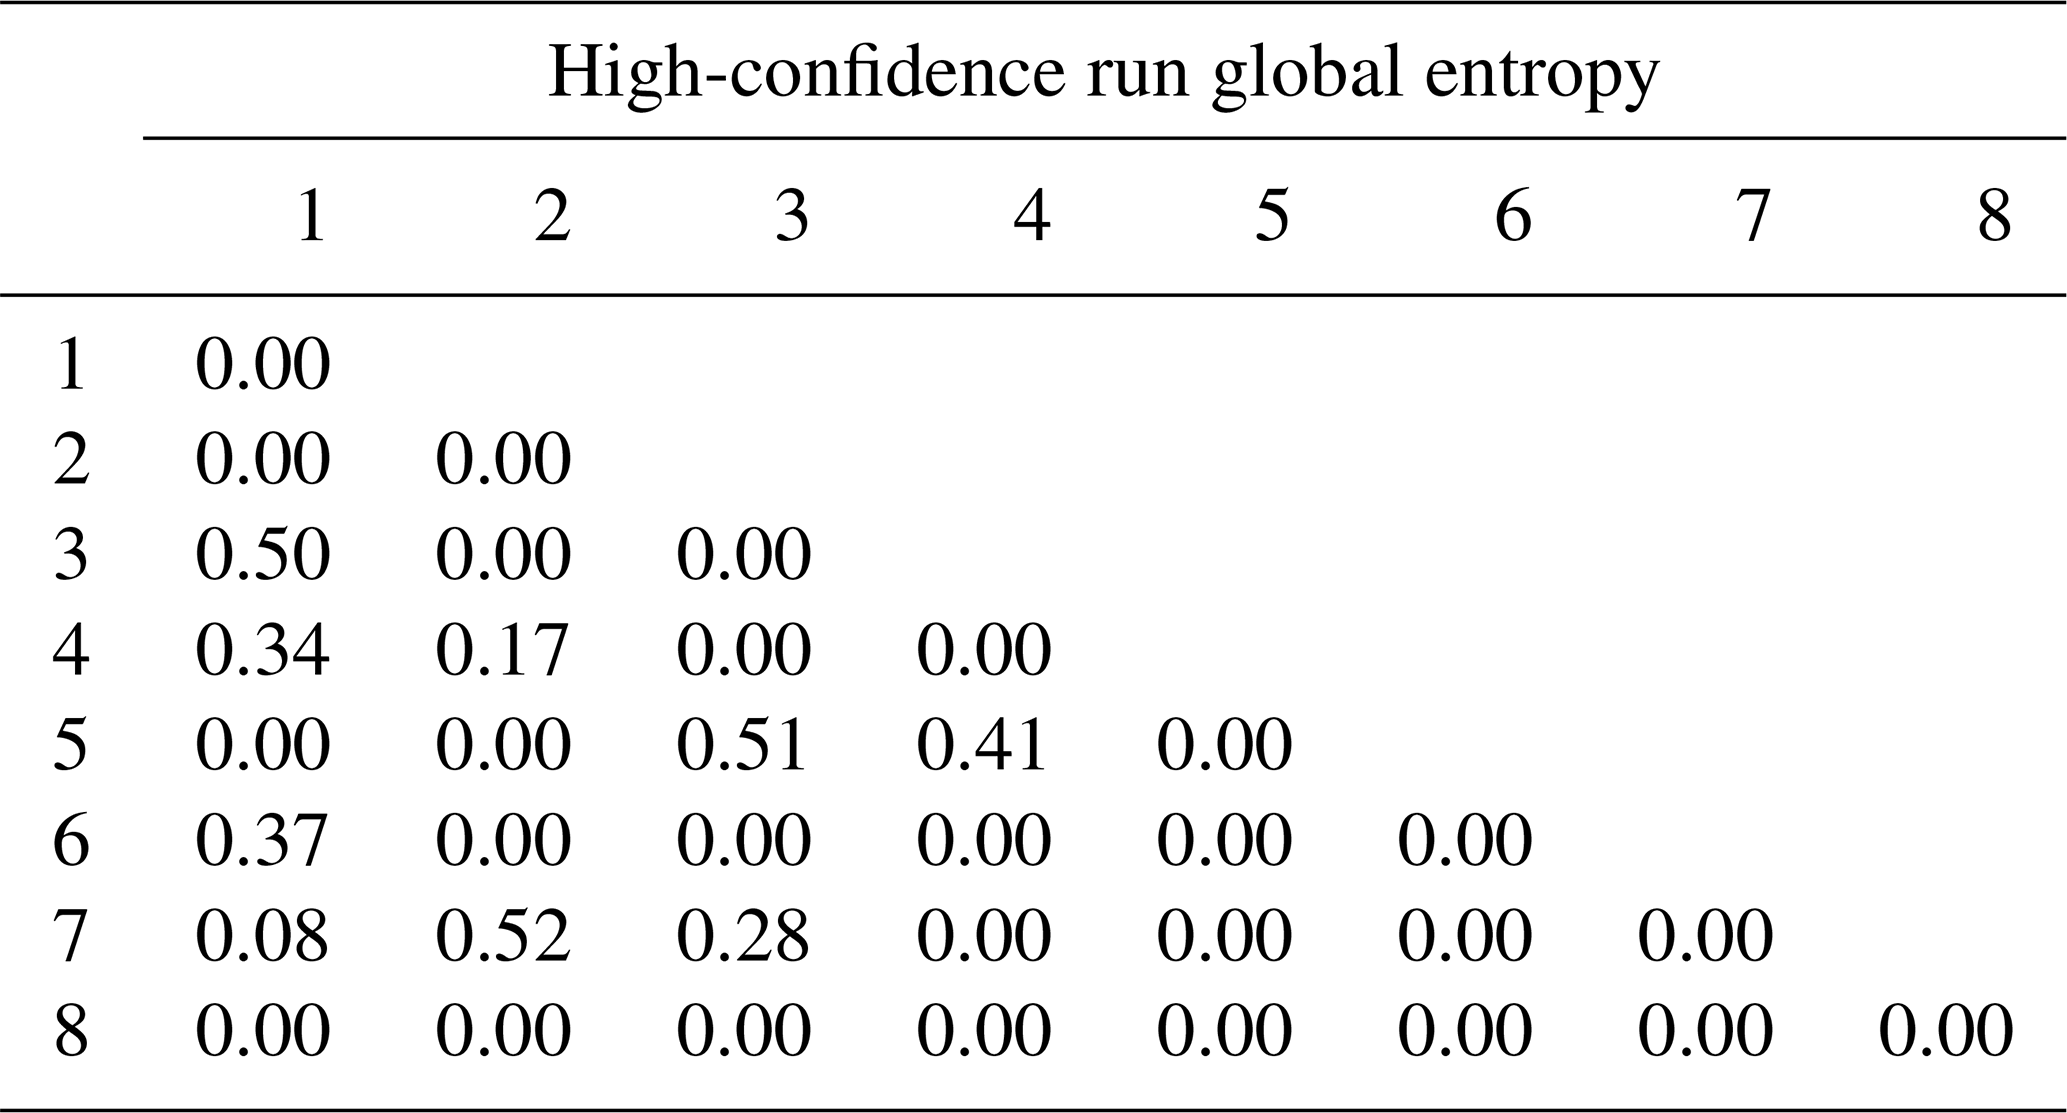
To verify topological stationarity, each plausible model was exported to a voxet that was used to build its corresponding adjacency matrix (Fig. 5). Every “new” topology was placed into a standard topological stationarity graph (Fig. 10). The number of distinct topologies observed over the process of generating plausible models appears to follow a logarithmic pattern. That is, the greater part of possible topologies is “discovered” quickly and further plausible model generation yields diminishing returns. In this instance, a third of topologies are discovered in a mere 3 % of the total number of perturbations and the next third is completed in under 25 % of said number. The total number of observed distinct topologies represents about 5 % of the total number of plausible models. Note that these finds are in accordance with previous work on topological stationarity in 3-D geological modeling (Thiele et al., 2016b). Based on these observations, it is safe to assume topological stationarity for this run. Several parameter sets for DBSCAN were tested and it appeared that the only working set for this case is ε=0 and Pmin=1. Otherwise, DBSCAN returns a single cluster along with a small number of unclustered topological signature. That is, each distinct topological signature has to be considered as a cluster in itself in order to obtain more than one cluster. Such behavior is not entirely unexpected because of the low dispersion parameters set for the disturbance distributions. Indeed, low dispersion of disturbance distributions is partially and non-linearly correlated to low plausible model topological variability. This is confirmed by the low number (nine) of non-null elements in the global internal information entropy matrix (Table 3), which indicates that few topological relationships were affected by the perturbation process. With the aforementioned settings, DBSCAN returned 55 clusters that correspond to the 55 distinct topological signatures present in the plausible model suite. For practical purposes, a significance threshold of 60 occurrences was applied (Fig. 11) to retain only the six most significant topological signatures and make subsequent steps more manageable, and such operation is only justified on the basis that topological stationarity is adequately met.
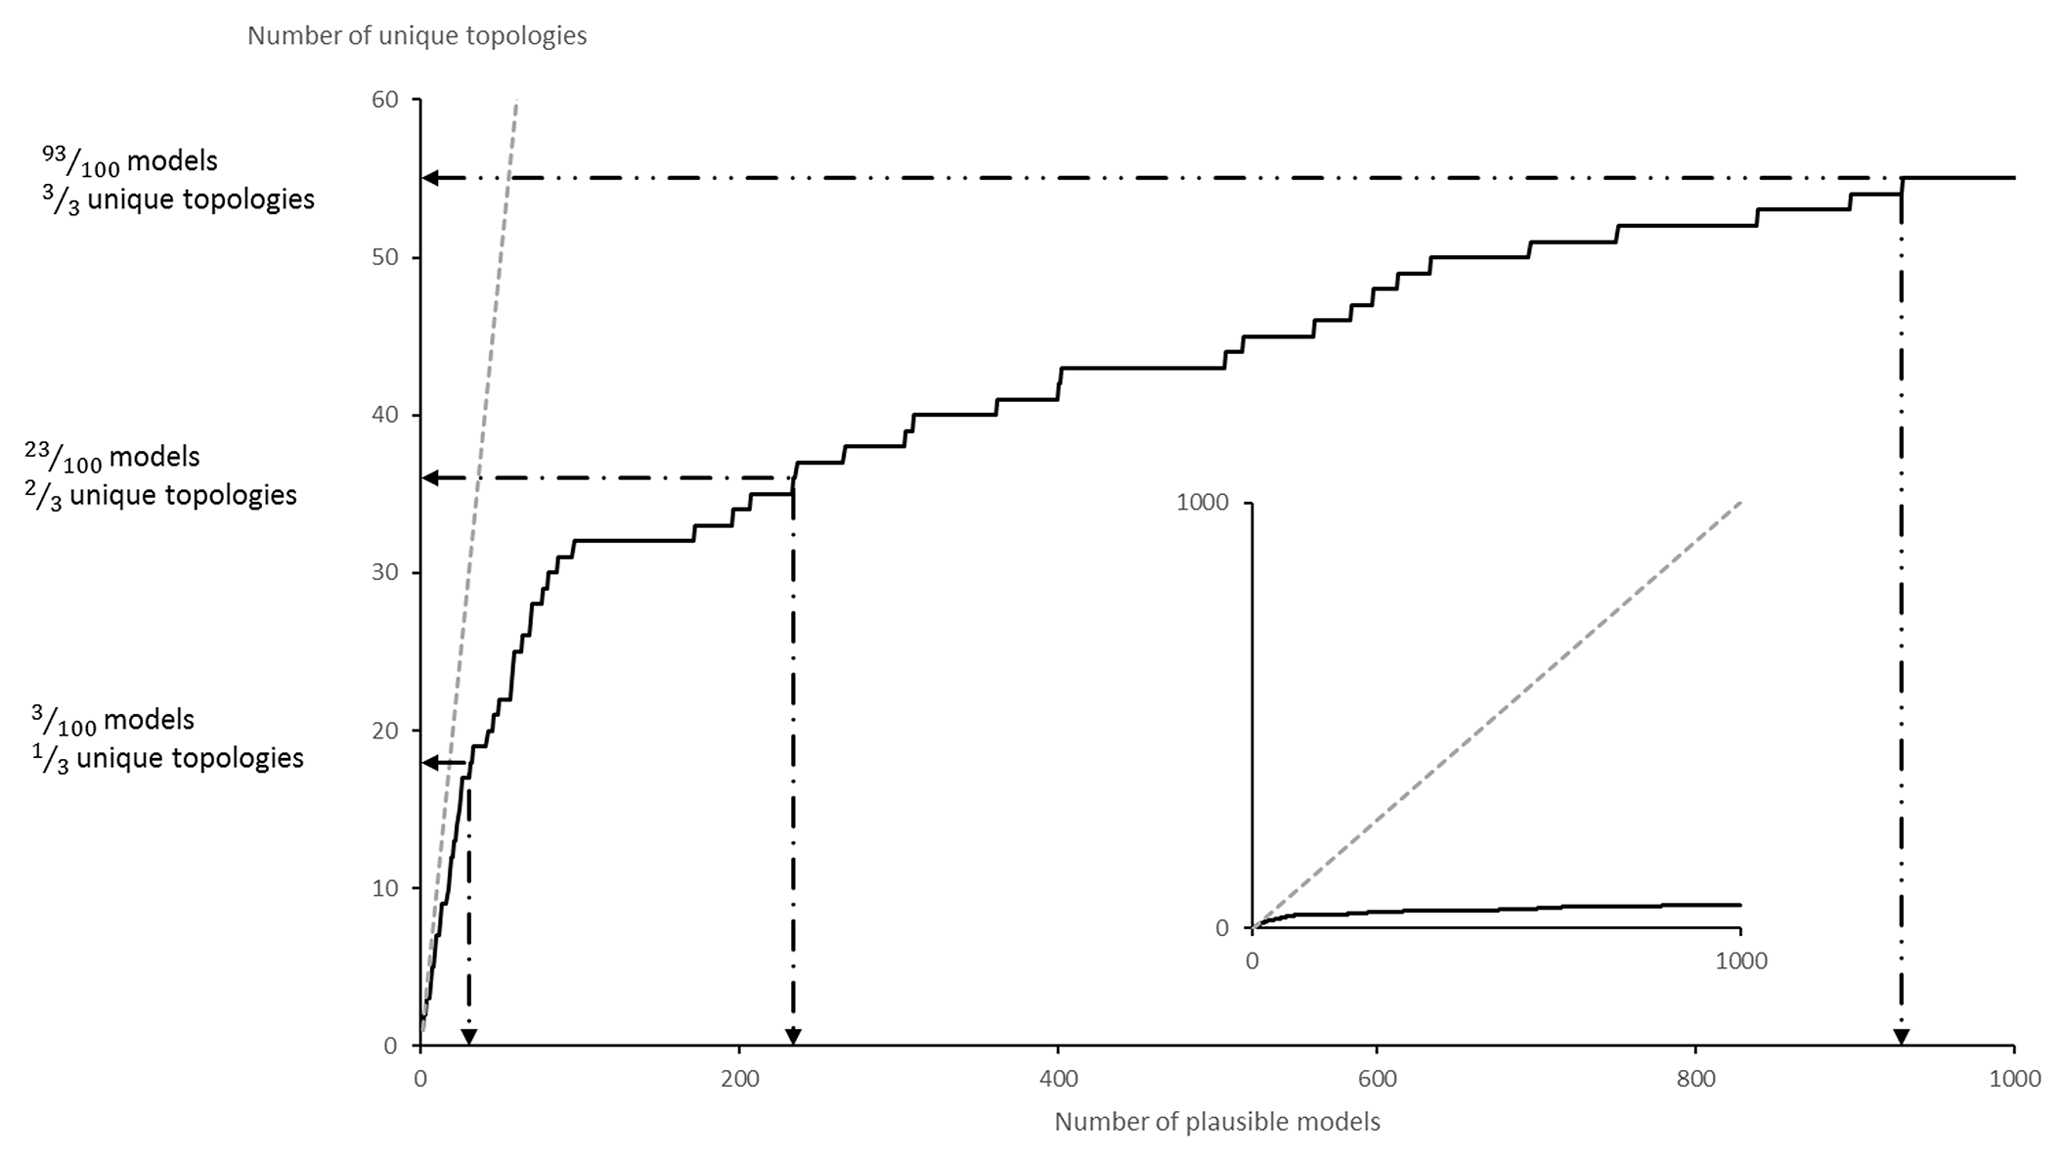
Figure 10Topological stationarity graph for the CarloTopo high-input data confidence run. The 1:1 graph in the background is used as reference.
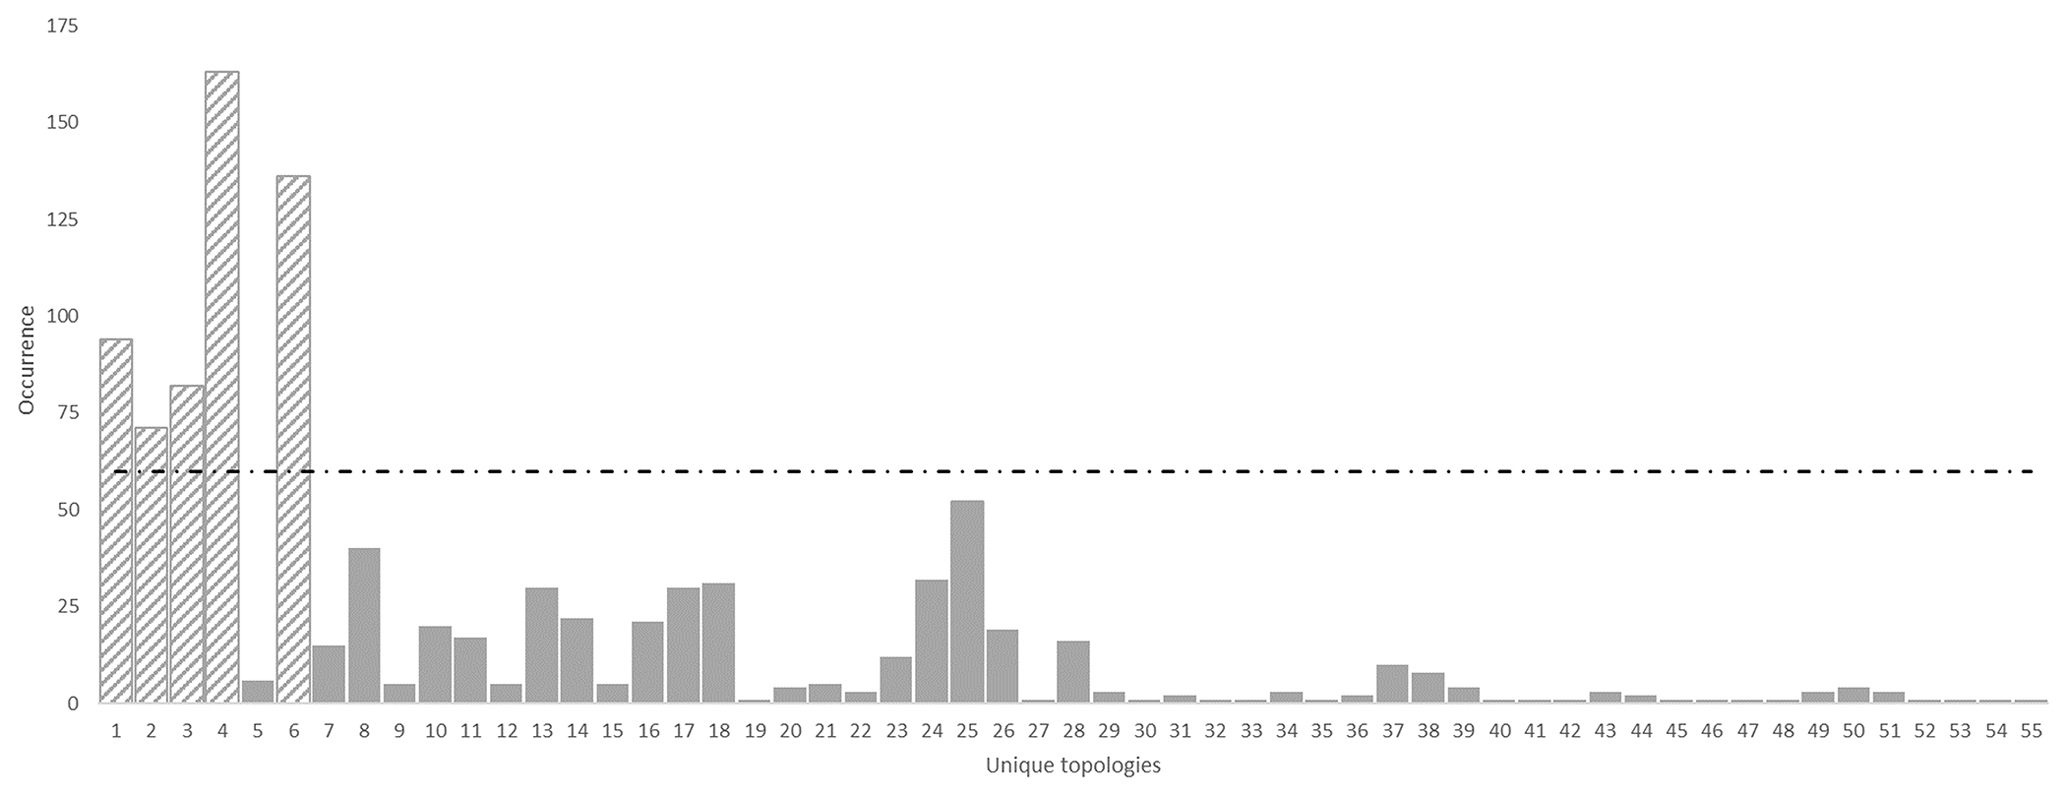
Figure 11Unique topologies occurrences for the high-input data confidence run with significance threshold of 60. Note that, in this instance, the clustering algorithm returned every topological signature as a distinct cluster.
Table 3Global internal information entropy matrix for the high-input data confidence run. Matrix indices refer to geological formation ranking in the stratigraphic pile. Refer to text for detail.
A representative plausible model was selected from each significant topological signature cluster and three vertical N–S cross sections were taken (Fig. 12) to obtain a qualitative view of the topological and geometrical differences between them. The 500 m easting median cross section is mostly invariant throughout the cluster as pointed out by the low value observed on the global information entropy uncertainty index model voxet (Fig. 9). The 250 and 750 m easting cross sections appear to be significantly more variable throughout the clusters in terms of distinct topological features and geometrical variations. Evident differences in section view include (i) the basin lower unit (Fig. 12, green) gaining or losing contact with the metamorphic folded series (Fig. 12, pink shades) with the mafic cover separating the two series (Fig. 12, blue), (ii) the basement (Fig. 12, brown) coming into contact with the mafic cover and (iii) the upper metamorphic folded unit (Fig. 12, light pink) being in direct contact with the lower metamorphic unit (Fig. 12, dark pink). Additionally, the potential traps highlighted in the original model are seen to change size and shape, to close and open throughout the clusters. These results indicate that topological signatures may help differentiate favorable scenarios in ore reservoir or oil and gas modeling applications.
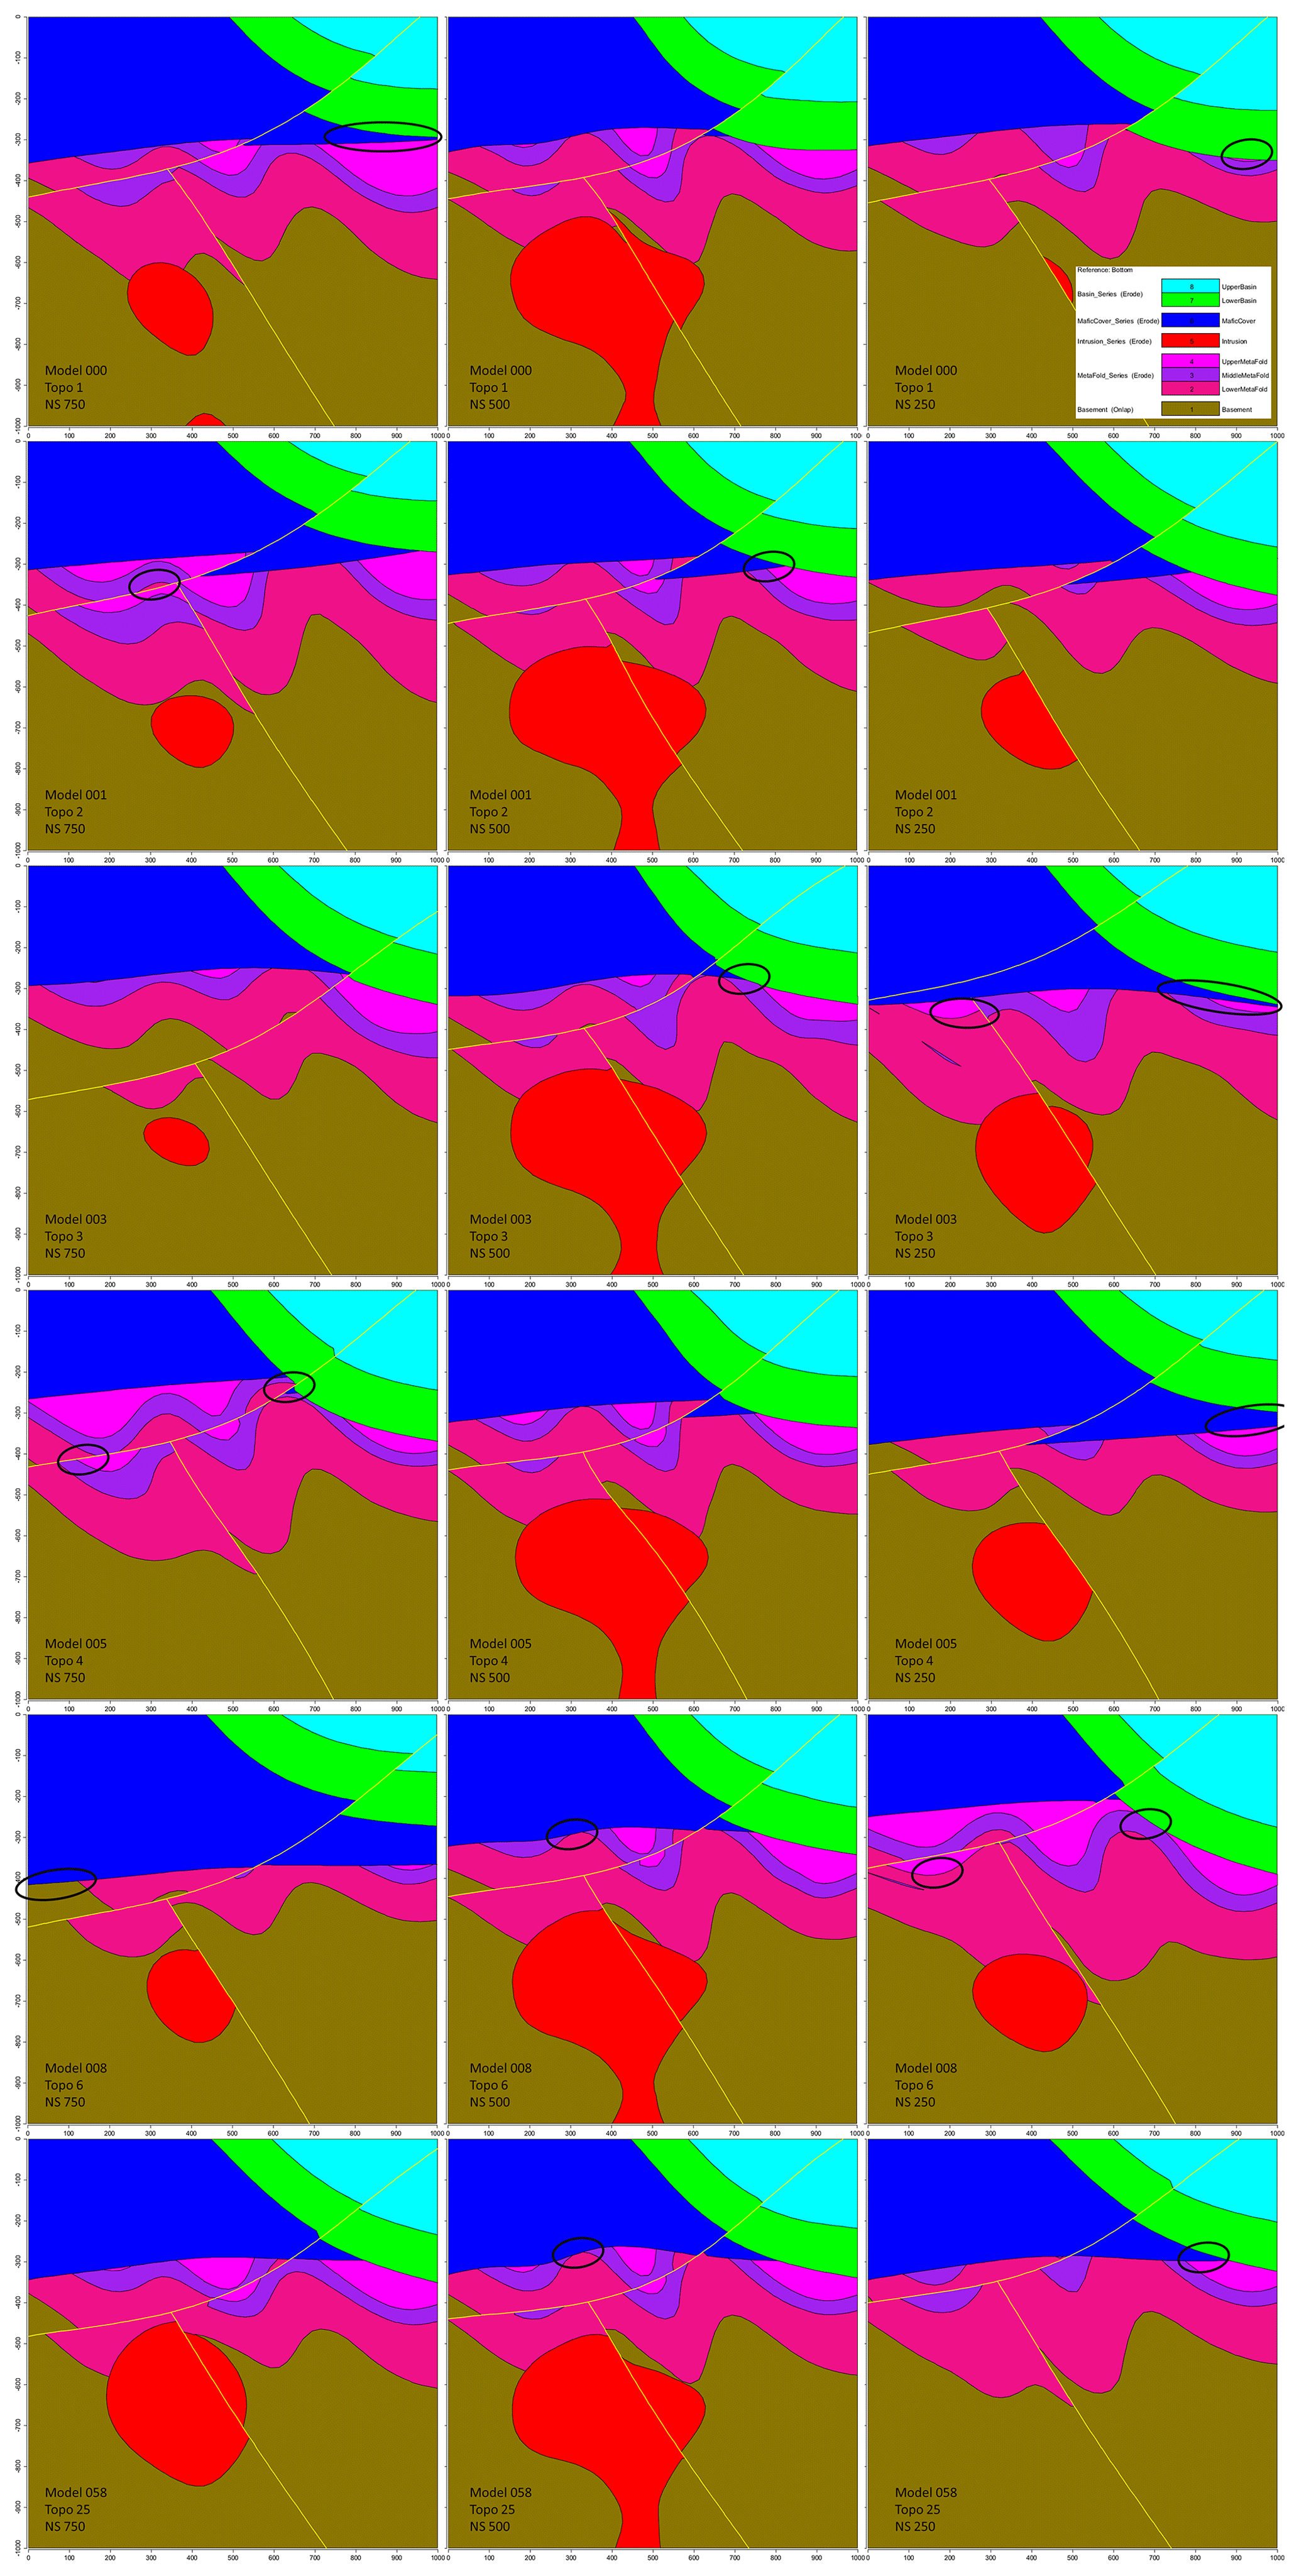
Figure 12Vertical cross sections of example plausible models for the top five most significant topological signatures in the high-input data confidence run. Major topological changes are circled.
Information entropy cross sections were extracted from the uncertainty index model voxets (Fig. 9) that were generated for each significant topological signature. Although the information entropy values look similar throughout the clusters, there are noticeable differences in terms of sharpness and triple-point differentiation. Predictably, the 500 m easting section shows very little extra-cluster variability and is very similar to its global counterpart. This is most likely because of its relative proximity to the original structural data inputs. In contrast, the 250 and 750 m easting sections display significant extra-cluster variability in terms of entropy halos thickness (from 150 to 50 m), triple-point differentiation (right ellipses) and sequence repetition in the metamorphic folded series (middle and left ellipses). As expected, cluster-based information entropy cross sections are all sharper than their non-clustered counterpart. This constitutes a strong indication that topological clusters are geometrically consistent and supports the thesis that topology is an efficient determinant for geological coherence. Additionally, sharper information entropy cross sections imply sharper probabilistic geological models which allows for an increased external applicability of MCUP results. In general, these results underline the plausible model-discriminating efficiency of topological signatures even when they are considered individually.
5.3 Low-input data confidence run
As with the previous run, a global information entropy uncertainty index model voxet was produced to serve as a reference against matching topology-based estimates. Equivalent cross sections were taken (Fig. 13) and exhibit very similar features to the high-input data confidence run. However, attention is brought to the increased fuzziness of the information entropy halos. These patterns can be explained by the disturbance distribution selection and parameter selection for this run. The uniform distributions that were selected in this instance always have a higher innate entropy compared to Gaussian distributions. Furthermore, the ranges selected largely exceed those of the previous run. Although at a lesser degree, the topological stationarity graph (Fig. 14) expresses the same diminishing return effect as the high-input data confidence run. More specifically, a third of topologies were in the first 13 % of plausible models, another third in the next 20 % of plausible models and the final third in the last 70 % of plausible models. In this instance, DBSCAN was parameterized with ε=2 and Pmin=2 and returned two topological signature clusters of size 953 and 39, respectively, along with eight outliers. Lower or higher values for ε and Pmin returned either a single cluster of size 1000 or a thousand clusters of size 1.
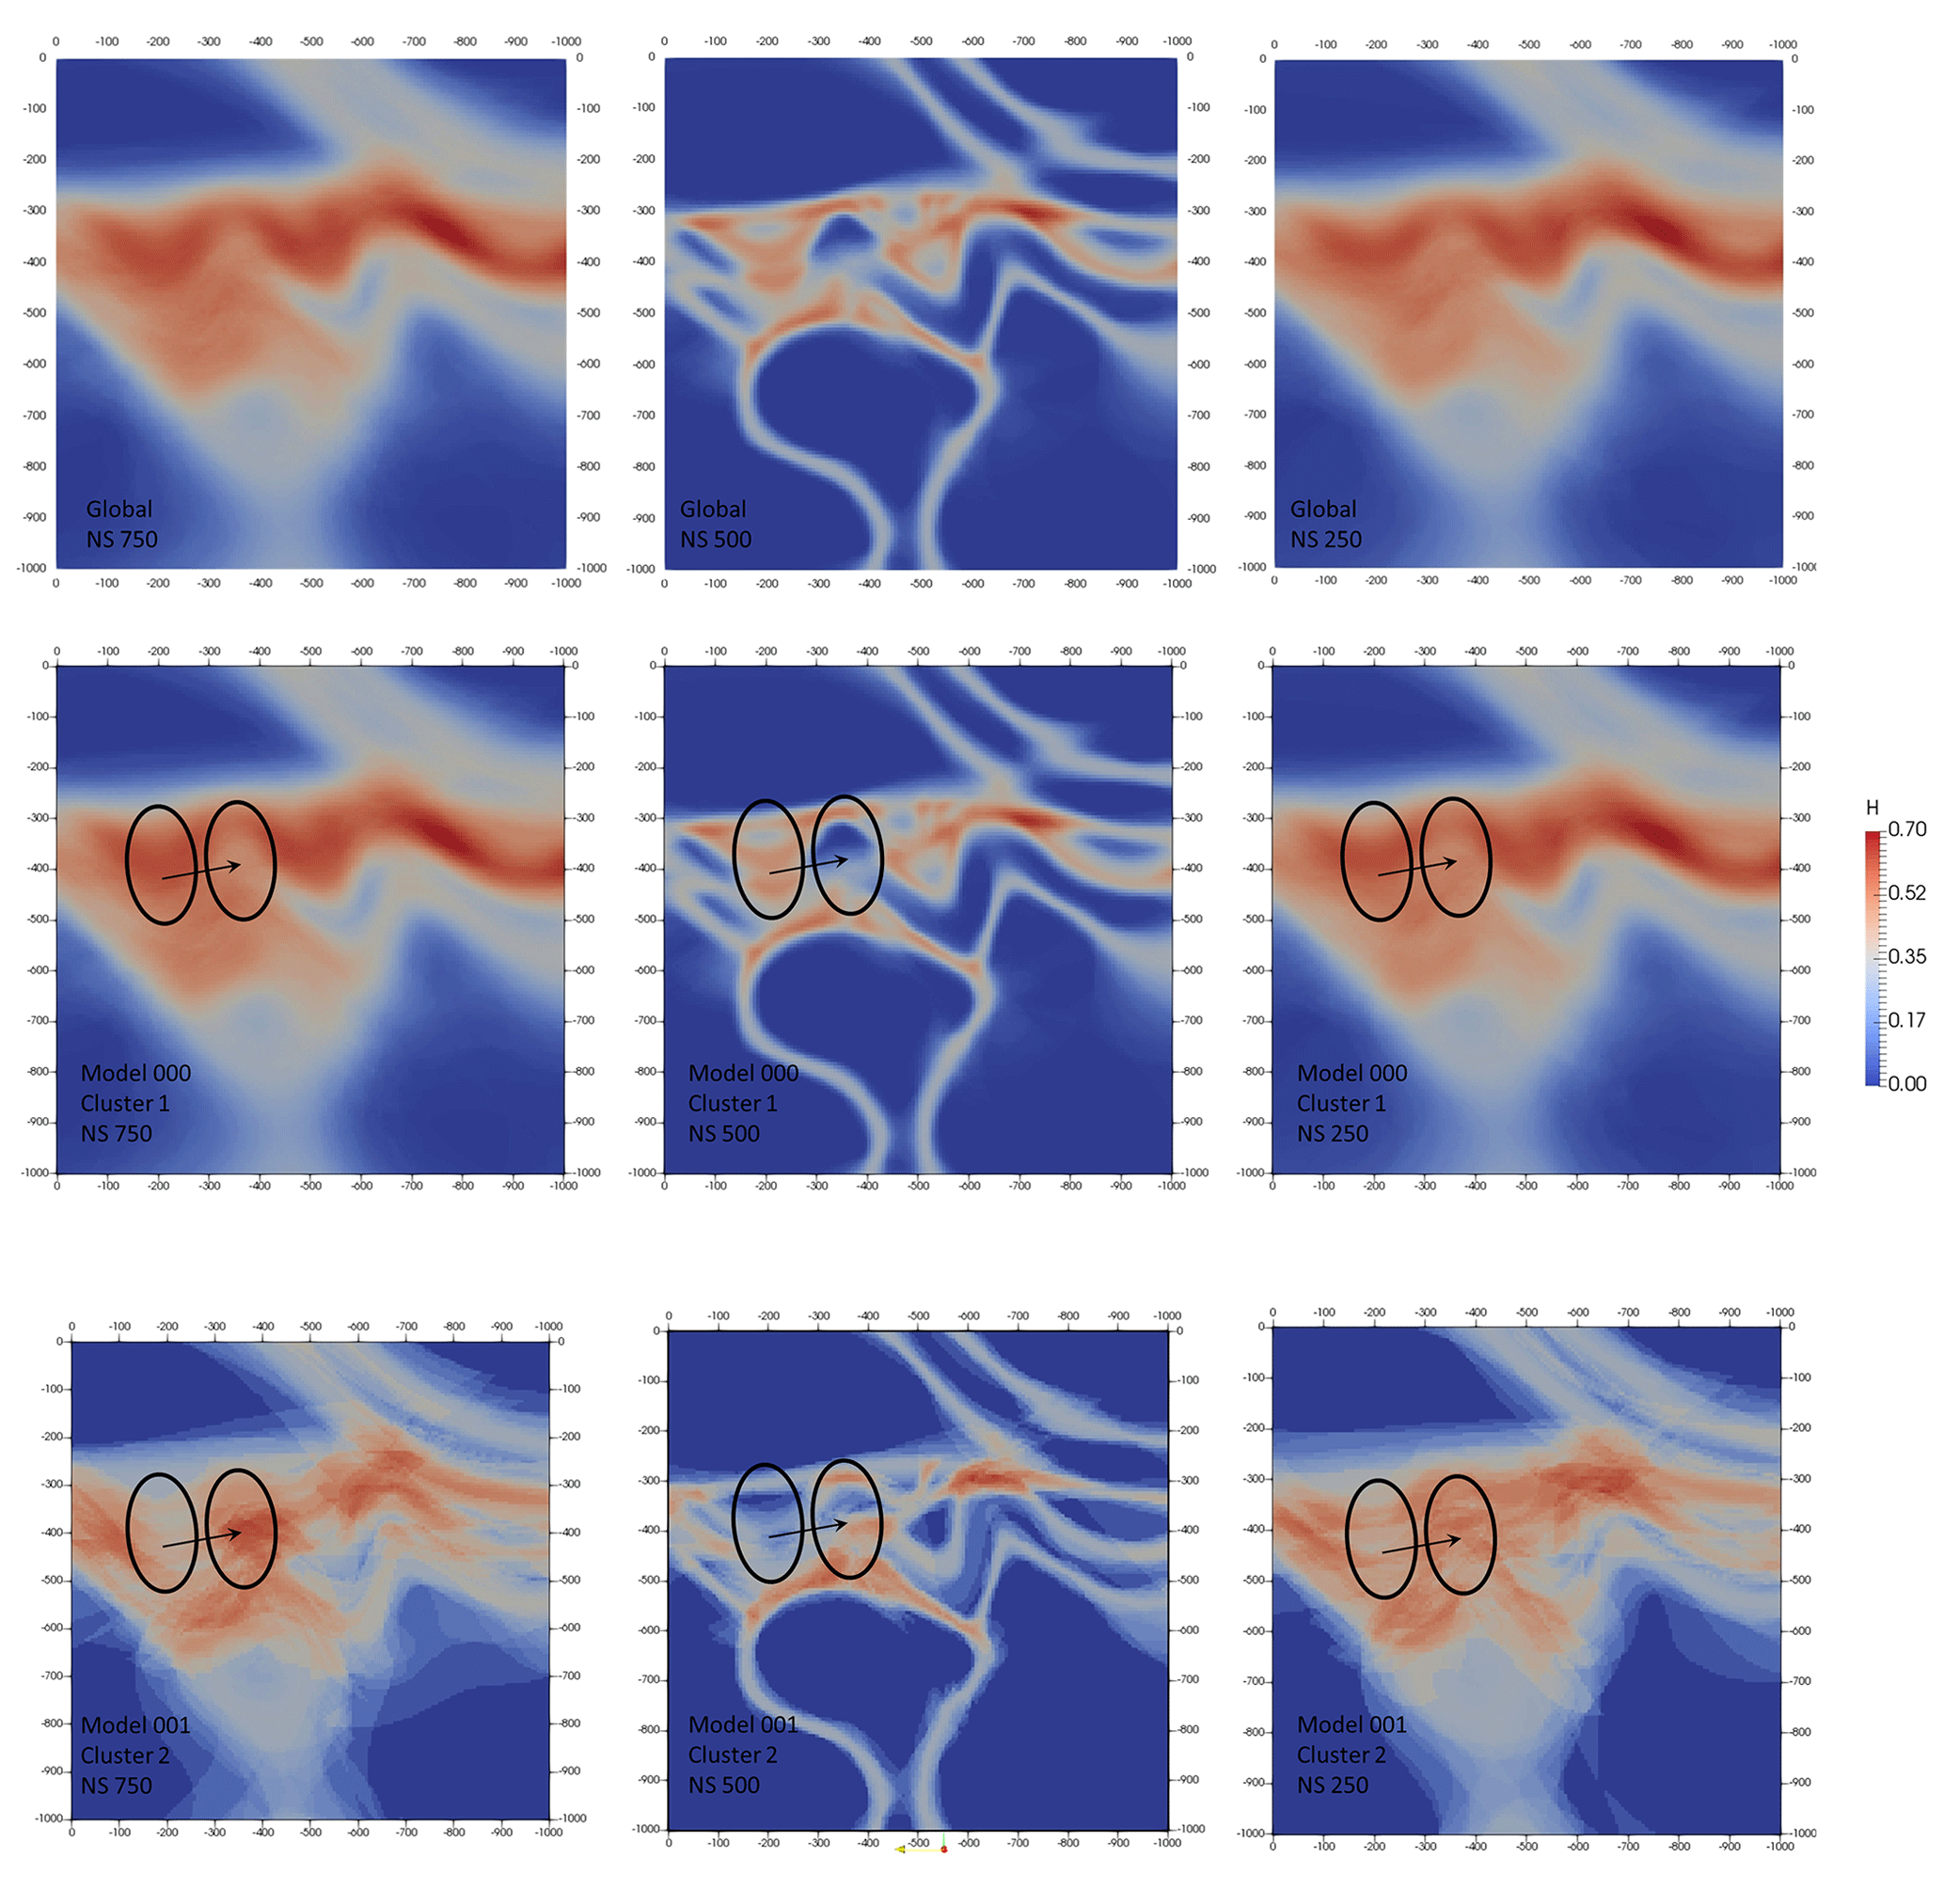
Figure 13Global (top row) and per-cluster vertical cross sections of information entropy uncertainty index models for the low-input data confidence run.
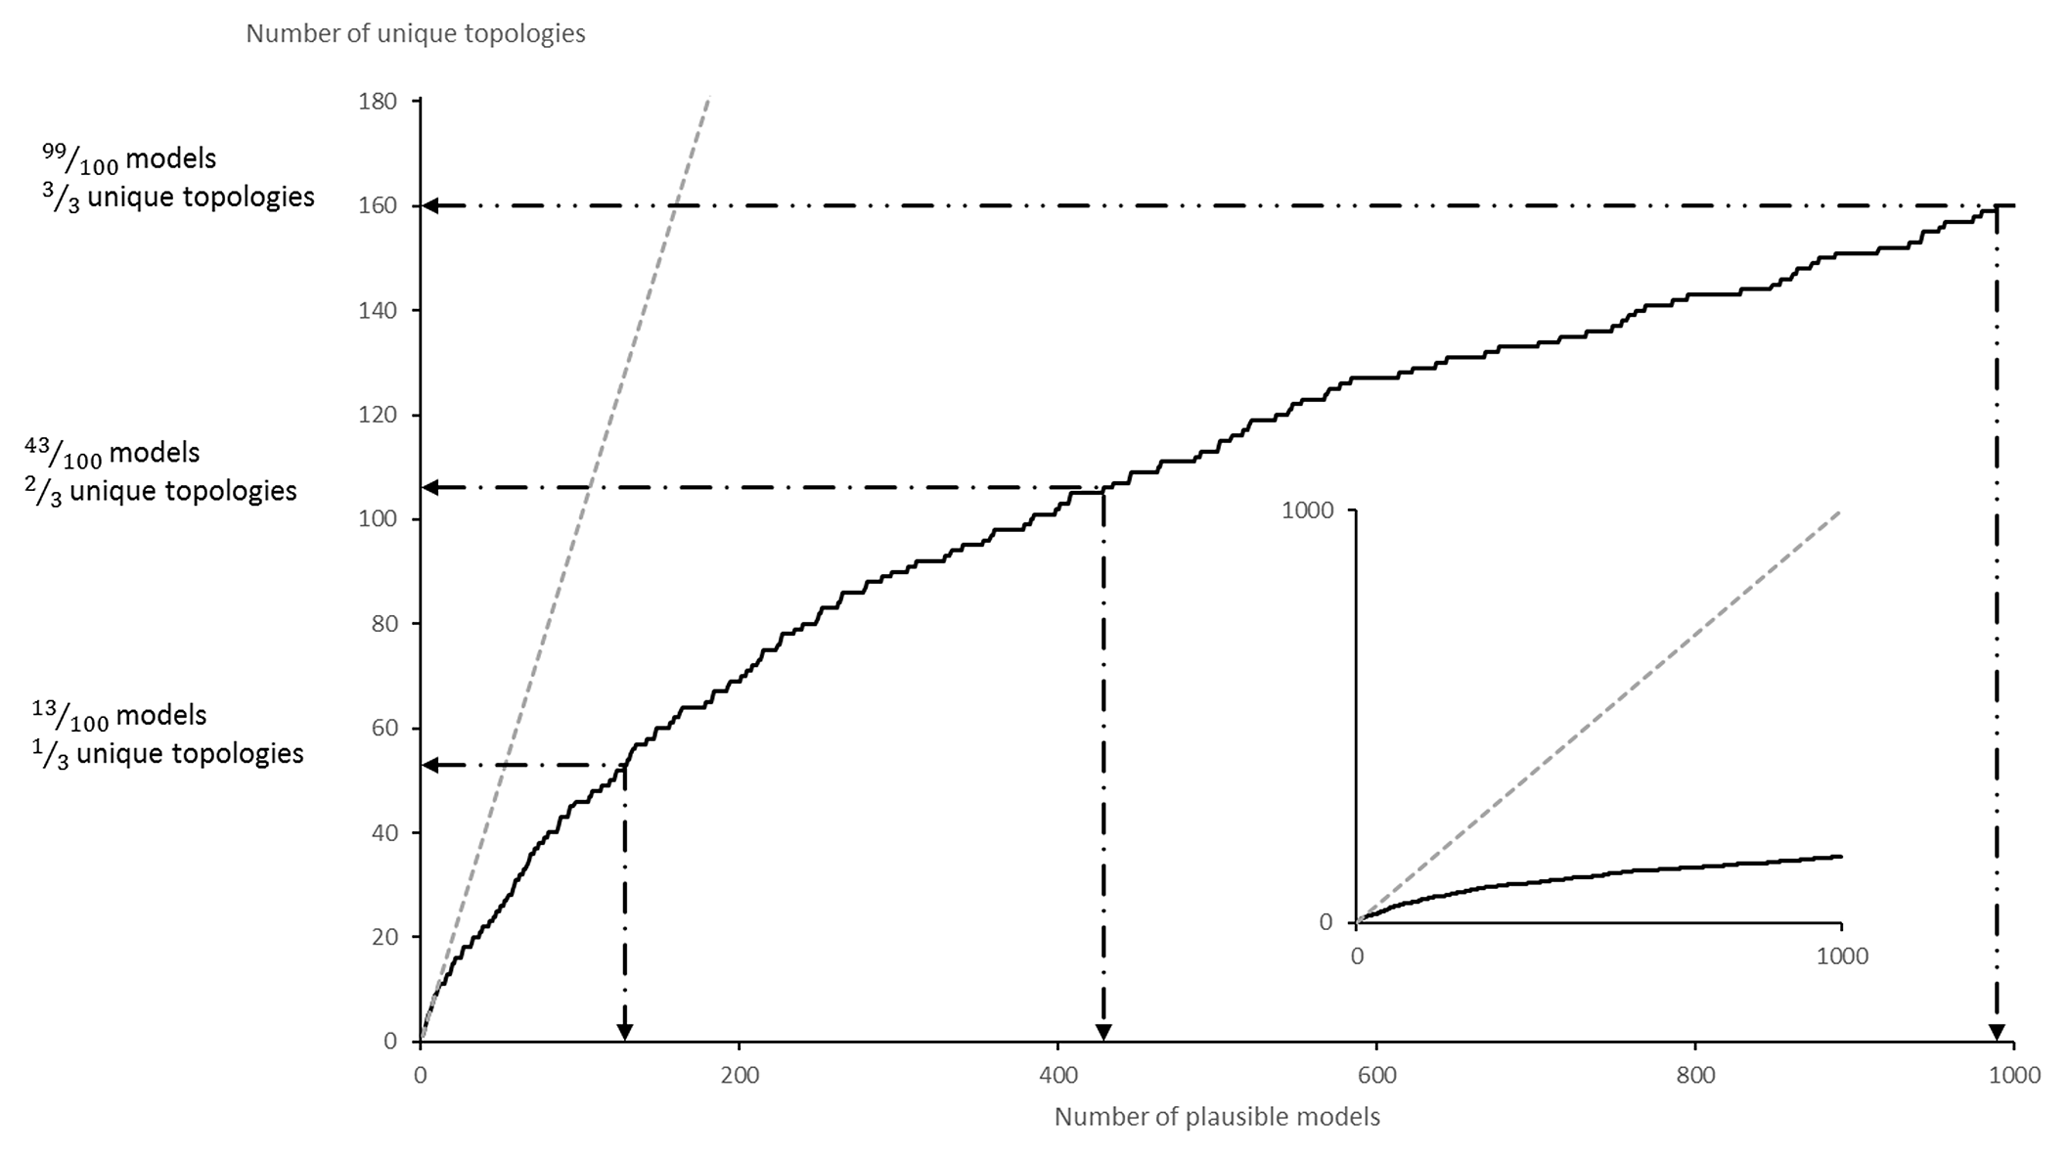
Figure 14Topological stationarity graph for the CarloTopo low-input data confidence run. The 1:1 graph is used in the background as reference.
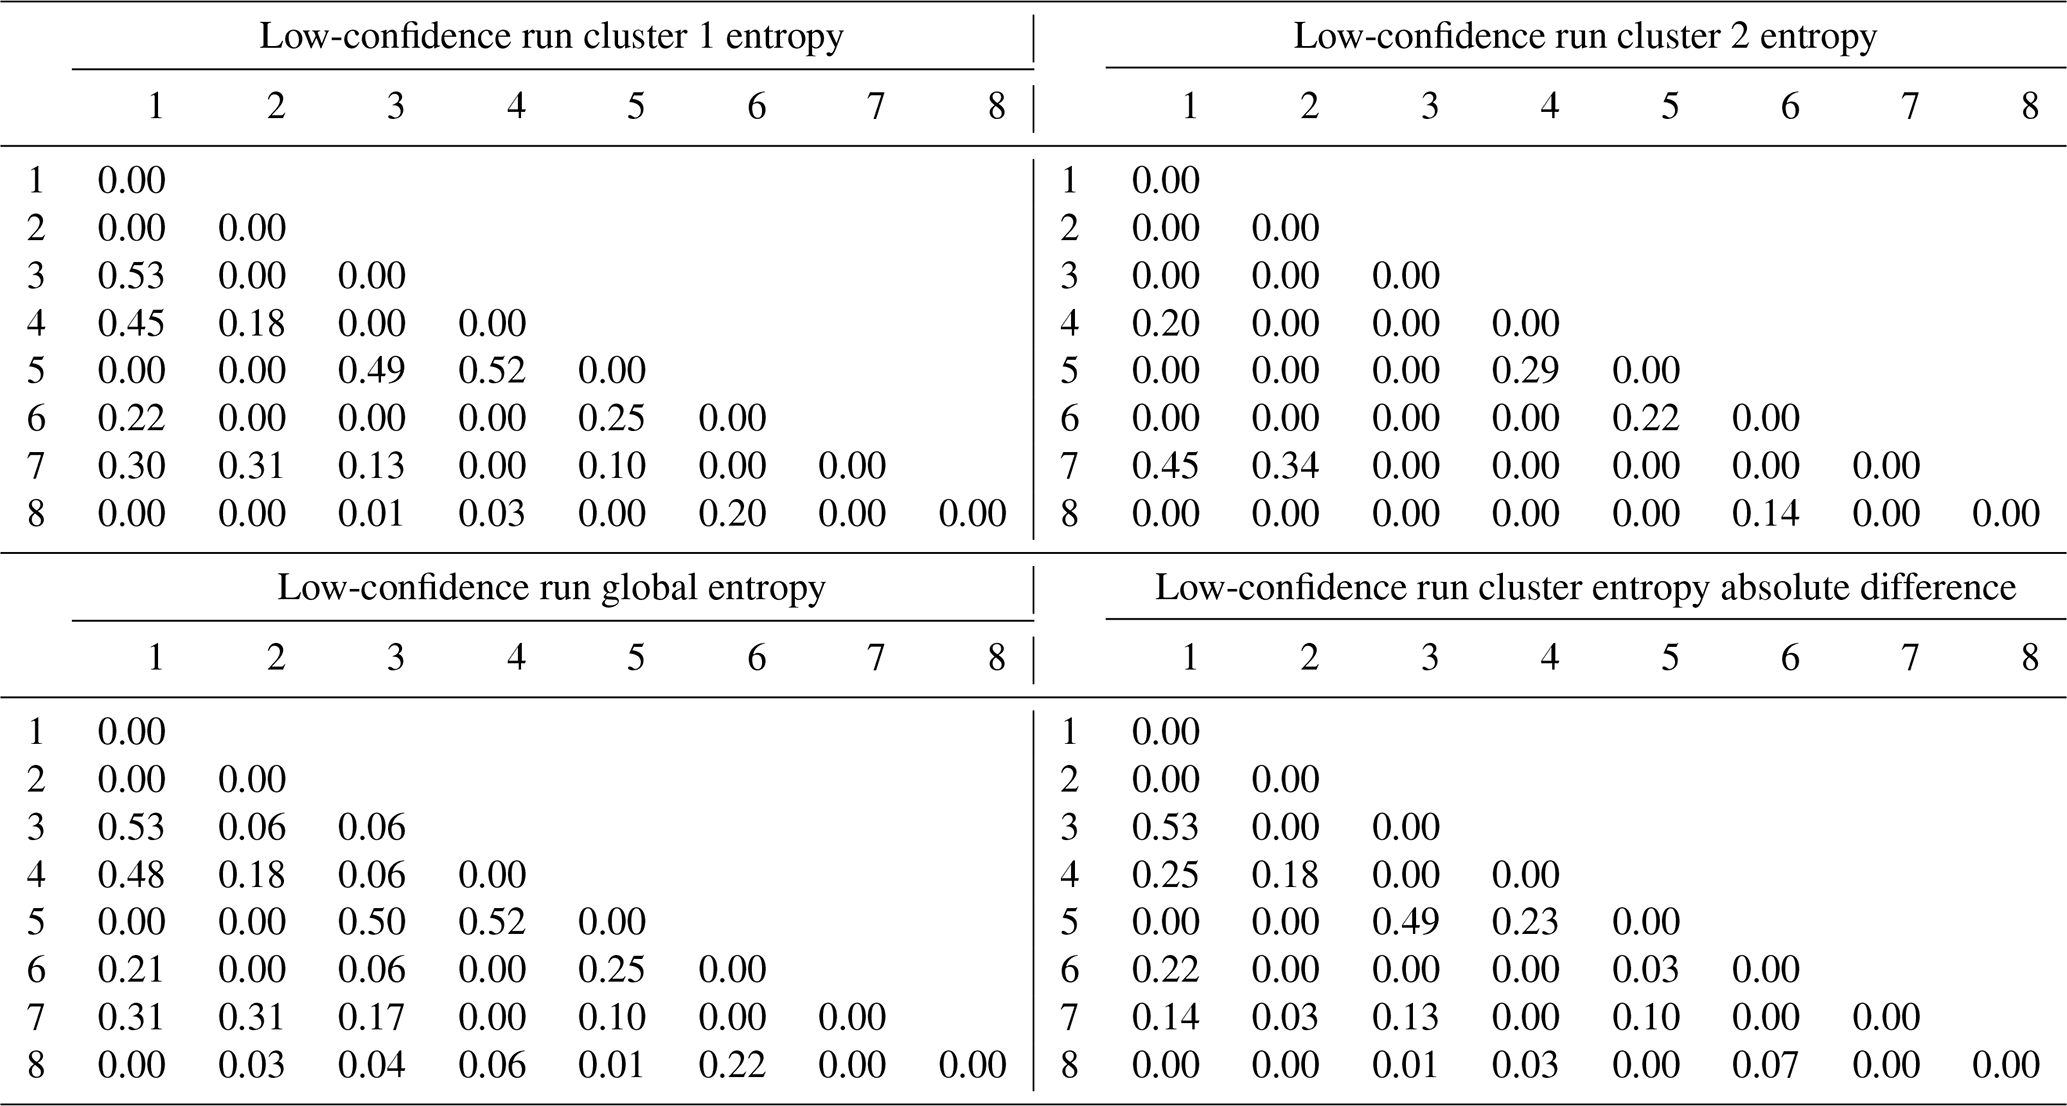
Cross sections extracted from representative models of both clusters (Fig. 15) display stark differences at the geometrical and topological levels. Significant topological changes between the two clusters include the disappearance of the middle the metamorphic folded unit (purple) from cluster 2, the emergence of the lower metamorphic folded unit (dark pink) against the lower basin unit (green) and the contact of the intrusion unit (red) with the upper metamorphic folded unit (light pink) in cluster 2. This is not surprising given the high number of non-null elements in the global internal information entropy matrix (Table 4). Indeed, a total of 20 topological relationships were affected by the perturbation process to varying degrees. Moreover, per-cluster internal information entropy matrices result in a significant number of non-null elements (Table 4) which can be used to determine the main “breaking” topological relationships when compared against each other and against the global matrix. Most topological shifts between the two clusters relate to internal topological relationships of the metamorphic folded unit and the basement. These shifts are consistent with the representative cross sections and indicate that per-cluster internal information entropy matrices may be used to draw geological inferences from their topological differences. When the internal entropy matrices of the clusters are compared against the global one, small differences become visible because of the inclusion of the unclustered plausible models. Notably, the intermediate metamorphic folded unit entries are non-null against all other units and themselves, which suggests that the unit may be absent from some of the unclustered plausible models.
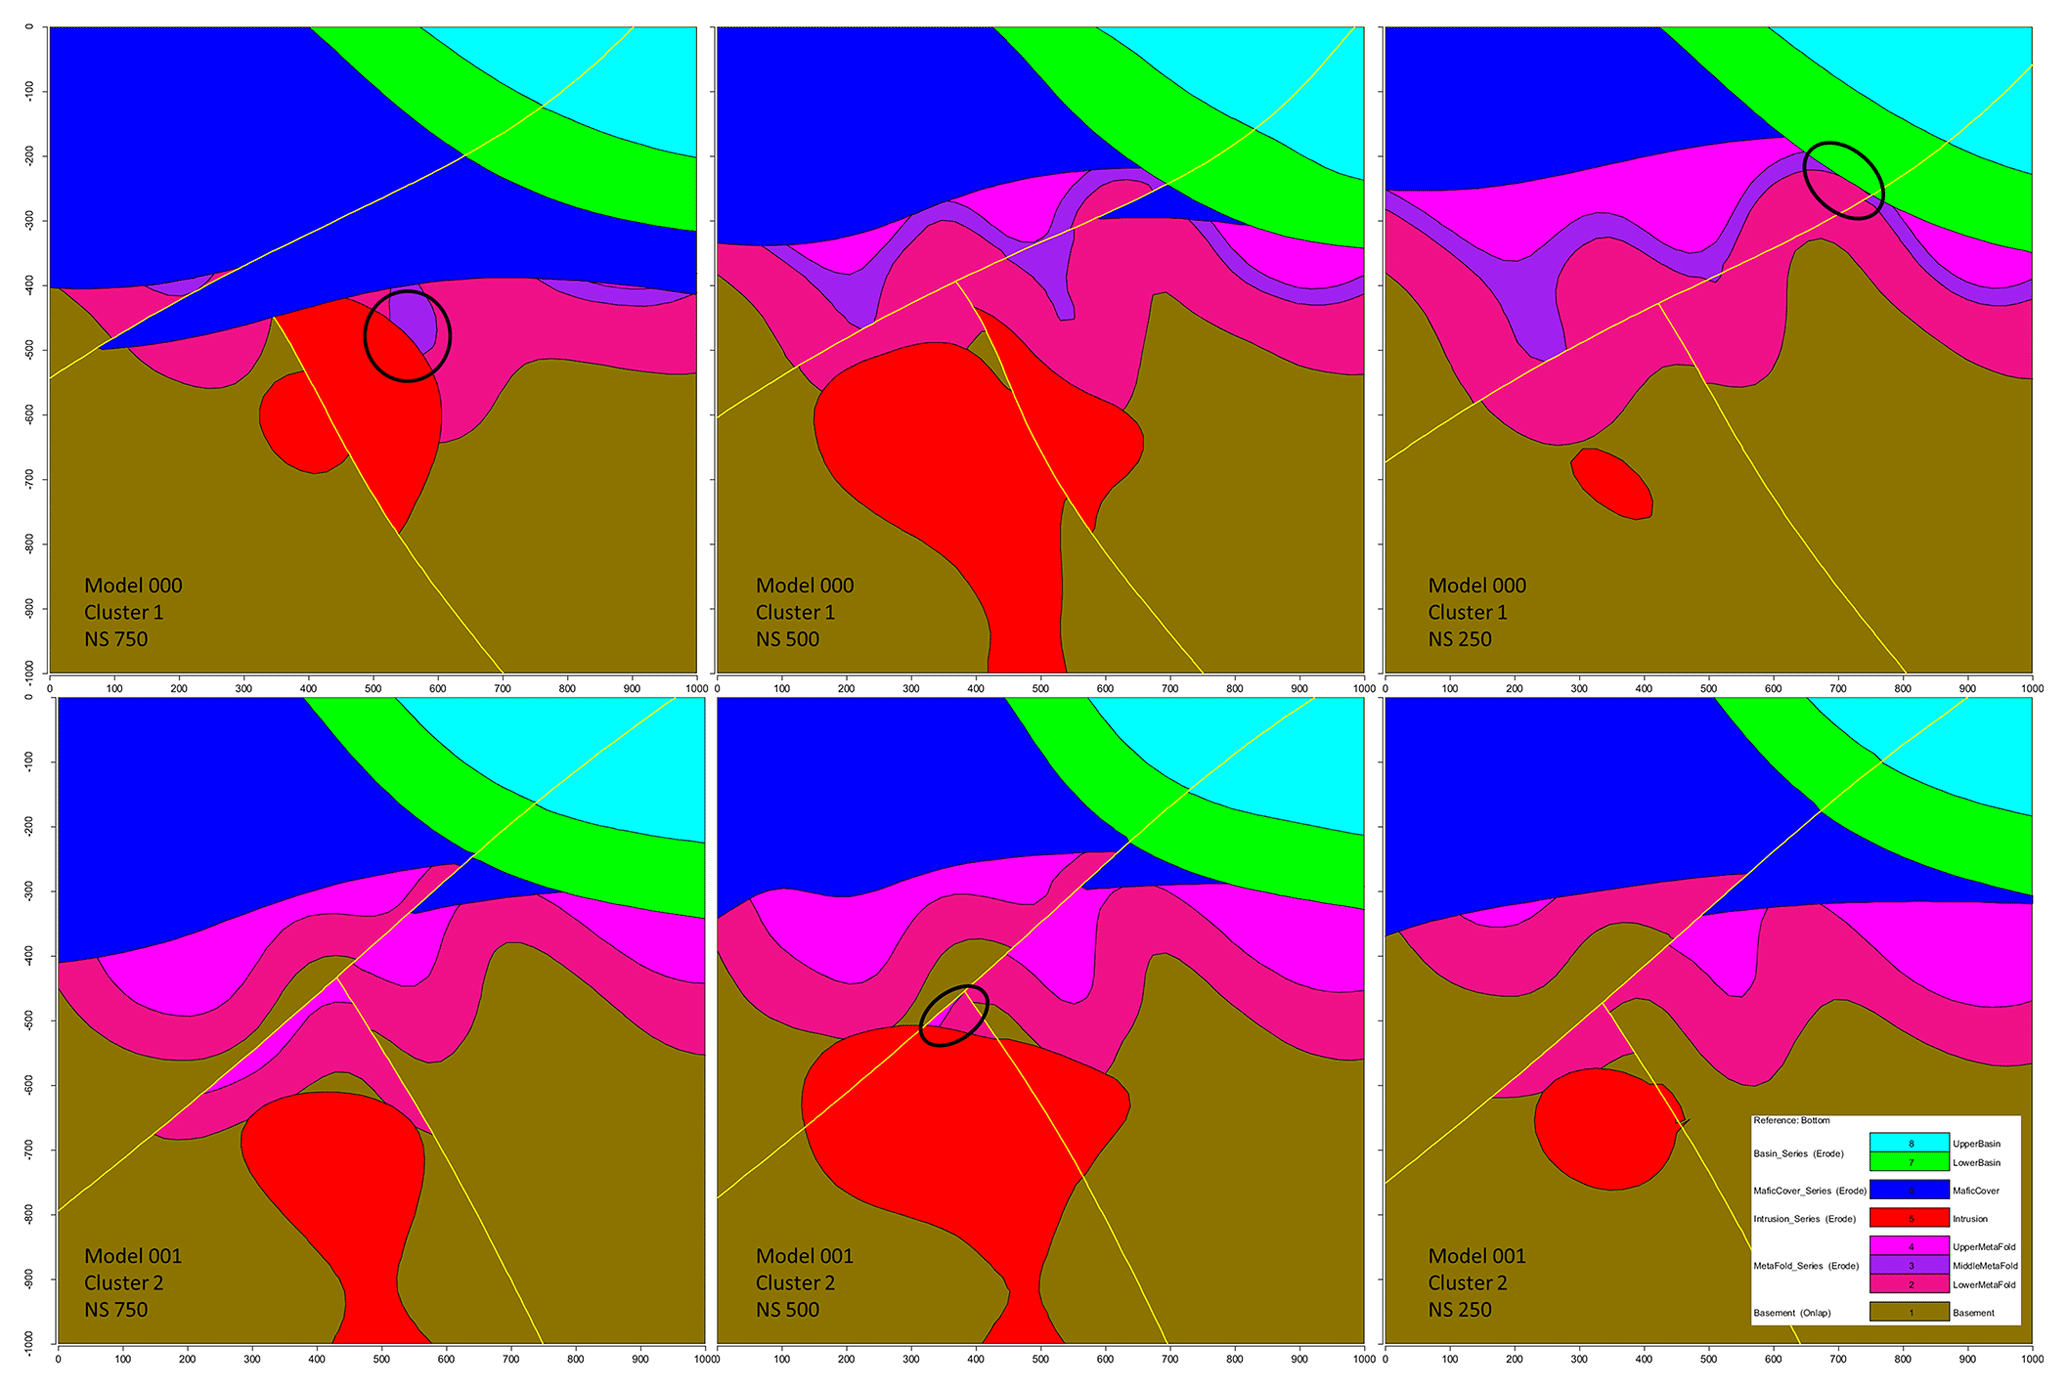
Figure 15Vertical cross sections of example plausible models for each cluster in the low-input data confidence run. Major topological changes are circled.
The information entropy uncertainty index model cross section for cluster 1 shows little variation to its global counterpart (Fig. 13). This is mainly due to the large size of cluster 1 compared to the number of plausible models. About 95 % of plausible models carry a topological signature that links them to cluster 1. Given the convex nature of information entropy, large clusters are likely to be near undiscernible with the global population. Overall, cluster 2 displays sharper entropy halos than cluster 1 or the global cross sections. It also features strong aliasing because of its relatively small size (39). Information entropy peaks about the metamorphic folded series appear to be shifted by a half of a fold wavelength between the two clusters (ellipses), while other features remain mostly constant. The relative similarity between the information entropy cross sections for both clusters (Fig. 13) despite their strong geological, structural and topological disagreement suggests that topological clustering holds potential as a differentiation tool in MCUP comparative analysis. Topological clustering would then be a way to mitigate the weaknesses of global information entropy uncertainty index models in regard to structural relevance.
In this paper, a basic procedure for topological clustering in MCUP was explored as possible improvement over currently available comparative analysis methods. The theoretical and practical aspects of the procedure were discussed and demonstrated over two proof-of-concept case studies.
The case for topological clustering rests on the fact that MCUP commonly generates topologically distinct models because of the non-linear relationship between the plausible datasets and the plausible model suite. This effect is introduced by the geometrical rule set that implicit 3-D geological modeling engines depend on to solve topological ambiguities. Ultimately, this topology-induced non-linearity translates into plausible model topological heterogeneity which is damaging to global comparative analysis methods that MCUP normally relies on and justifies topological clustering. Plausible model topological heterogeneity forms a strong logical barrier to merging plausible models into a single probabilistic geological model or uncertainty index model. Plausible models obtained through the perturbation of the same dataset may describe very different “realities” which correspond to significantly different topologies. Combining such model types that describe distinct topologies into a single uncertainty estimate is detrimental to the understanding of the quality of our knowledge in the area of interest.
Topological clustering provides more flexibility to external validation systems such as geophysical inversion or physical simulations, as it does not lock them into a single probabilistic geological model or uncertainty index model. In turn, such an approach holds the potential to make targeted ground truthing easier, as topological differences between clusters and per-cluster leverage analysis would help indicate which observations or topological relationships introduce topological heterogeneity in the plausible model suites. Furthermore, per-cluster uncertainty is always lower than its global counterpart because of the convexity of uncertainty index models. Therefore, topological clustering produces sharper per-cluster uncertainty index models that are more comprehensible than the global uncertainty index model which helps to parameterize external validation systems. Topological clustering preserves and improves geological knowledge since the differences between the topological signatures of distinct clusters are visible in the internal information entropy matrices and can be interpreted in terms of geological relationships. Lastly, the proposed method increases the value of MCUP against analytical uncertainty propagation methods since the latter cannot consider the non-linearity that plausible model topological heterogeneity indicates. Analytical uncertainty propagation would estimate uncertainty from the interpolator directly without the need to build any more than a single probabilistic geological model. However, it was shown that a single probabilistic geological model cannot adequately express the inherent non-linearity of the modeling engine. Note that this non-linear behavior is not a defect of the modeling engines themselves but rather a consequence of natural geological rules such as intrusion, cross cutting or superposition.
Table 4Per-cluster (top), global (bottom left) and contrast (bottom right) internal information entropy matrices for the low-input data confidence run. Matrix indices refer to geological formation ranking in the stratigraphic pile.
Although promising, in its current form, the procedure may suffer from a number of limitations that concern DBSCAN and may indicate that other clustering algorithms such as k means, c means or machine learning are more appropriate. The low number of parameters, simplicity of the algorithm and low computational cost make DBSCAN an appealing choice for data clustering of large datasets where the number and shape of clusters are unknown. However, DBSCAN suffers from a number of disadvantages that may hinder its ability to function effectively. The most relevant ones to this study are the “hidden” metric parameter, point density scale issues and conflicted points. The metric parameter relates to the choice of the metric used to compute de distance matrix such as Euclidean or Manhattan distances. Datasets with high dimensionality may exhibit a degeneracy of the concept of distance when the data are uncorrelated and noisy. The issue is mostly covered by the fact that the topology of 3-D geological model is usually well structured because of the geometrical rule set's influence. The point density scale issue relates to the intra-cluster point density variance. That is, intra-cluster point density should be as close as possible to a constant throughout the clusters. A high point density variance prevents an effective ε parameterization because the concept of a reachable neighbor then becomes ambiguous. In the case of basic topological signatures extracted from plausible models, the variability of the point density of clusters is usually low. That is because the geometrical rule set massively decreases the chances of odd topological signatures occurring. Note that this applies even for very-low-confidence disturbance distribution parameterization, provided that all units are sufficiently informed. Conflicted points relate to the fact that the DBSCAN algorithm is non-deterministic in some instances (Schubert et al., 2017). As a consequence, some border points may be reachable by several core points from different clusters at the same time. However, DBSCAN only allows each point to belong to a single cluster. It is then the order in which the data were processed by the algorithm that will determine to which cluster these conflicted points belong to. For the purpose of this paper, this effect was avoided by parameterizing DBSCAN with a low ε. Regardless of which clustering algorithm is chosen and how it is parameterized, the issue of the relevance of Boolean topological signature clustering arises. Boolean topological signatures may be argued as being too simplistic in their representation of the actual geometrical relationships observed in the plausible model suites. Such oversimplification may inhibit the differentiating efficiency of the clustering algorithm. To address this problem, more accurate topological signatures may be used. The most straightforward improvement is to distinguish normal and faulted contacts between geological units and express topological signatures as a ternary signal instead of a binary one. This solution is appealing because the rest of the procedure remains unchanged given that the Hamming distance is defined for all degrees.
Replacing lithological, unit-based adjacency matrices with super, series-based adjacency matrices is another possibility of improvement for the procedure. In this case, the geological units of a series would be considered as a single entry of the matrix. The aim is to simplify the adjacency matrices, eliminate redundant information, decrease computational costs and increase readability. However, this approach assumes that series are topologically similar, which is not guaranteed as illustrated by the metamorphic folded series behavior in the low-input data confidence run. The clustering algorithm would then be made blind to them and, in some cases, display higher differentiating ability. However, the question of the relevance of a topological relationship is likely to be ad hoc. At the practical level, in this paper, adjacency matrices were extracted from 3-D grids obtained by discretizing the plausible 3-D geological model. Therefore, adjacency matrices are prone to discretization artifacts when resolution is too low. Triangulated interfaces could be used to derive the topological signatures while avoiding these artifacts.
Overall, more in-depth case studies are required to assess the capabilities of the method and determine the best route for possible improvements. More specifically, 3-D real case studies are needed to better demonstrate the usability and practicability of the method as opposed to the synthetic 2-D section-based model used in this paper.
In this paper, previous findings (Wellmann et al., 2014; Thiele et al., 2016a; Wellmann and Caumon, 2018) about plausible model variability in MCUP were verified and a complete comparative analysis procedure was proposed to address the issues raised by said findings. It was confirmed through the experiment that MCUP outputs a significant proportion of topologically distinct plausible models and that topological analysis is a viable tool to differentiate them. The reasons for this incompatibility were discussed and were found to be due to the non-linear relationship between the plausible input datasets and the plausible models. That is, the model-building process is non-linear itself. It was proposed that the model-building non-linearity emanates from the geometrical rule set that is used to constrain and partially define the topology of models in implicit 3-D geological modeling engines. In view of this fact, topological clustering was proposed as a solution to distinguish topologically distinct models and increase the relevance and quality of the uncertainty indices and probabilistic models in MCUP. Based off a two-stage synthetic case study, it was found that topological analysis is a viable tool to differentiate topologically distinct models and that topological signatures are strong indicators of geological features in 3-D geological models. Topological analysis was shown to help reduce overall model uncertainty by ensuring topological consistency in the uncertainty indices. Moreover, topology-driven comparative analysis may allow for higher model improvement potential than what standard uncertainty indices or probabilistic geological models allow for. The rationale is that improved knowledge of uncertainty allows users to target areas of interest where supplementary data collection is required to reduce said uncertainty. In this case, uncertainty is thought of as an improvement-enabling tool that initiates a positive feedback loop and allows users to refine their understanding of the modeled area and increase the reliability of their model. This work finds applications in mining and oil and gas industries at the strategic and tactical stages of exploration or for mine development and planning. In particular, topologically similar probabilistic geological models and their associated topological signatures could be used as input for geophysical inversion and physical simulation software.
All datasets and models used in the present study are available online at https://doi.org/10.5281/zenodo.1202314 (Pakyuz-Charrier, 2018).
The spherical cap distribution is designed to describe variables that are uniformly distributed over any solid angle on the unit sphere S2. The proposed parameterization is that of the mean/median direction spherical unit vector μ and half-aperture angle λ:
Start with the formula for the area of a spherical cap,
where θ is the polar angle and r is the radius of the sphere. It ensues that, over S2, the maximum value for A is for θ=π:
The relative area of a spherical cap to the total sphere area is then given by
given
and knowing
It follows that if
then
The authorized form is then
To generate a spherical cap uniformly distributed pseudo-random spherical 3-D unit vector Xsphe on S2 for a given mean direction μ and range λ, define
For , the pseudo-random vector is given by
W is given by
where1
V is drawn as follows:
Xsphe should then be rotated to be consistent with the chosen μ.
The standardized Irwin–Hall (IH) distribution is the distribution of the sum of a number of standardized uniformly distributed independent random variables:
with all Un drawn from . This distribution is useful in Bayesian inference as it models the sequenced hypersampling of a standardized uniform distribution in a compact form. For , the IH distribution density is given by
In this form, its mean is always 0 and variance is . The standardized IH distribution can be redefined as the chain convolution of its uniform components. For example,
Using the convolution theorem, this can be generalized to
where F is the Fourier transform and F−1 its inverse. Substituting Eq. (A4) into Eq. (B4), one finds that the standardized spherical IH distribution of order n is proportional to the inverse Fourier transform of the n-exponentiated Fourier transform of the standardized spherical cap distribution:
with
EPC was responsible for the tasks of conceptualization, data curation, formal analysis, design of the methodology, software development, validation of the results, writing of the original paper, and review and editing. JG was responsible for the tasks of validation of the results and review and editing of the paper. MWJ was responsible for the tasks of funding acquisition, review and editing of the paper, project administration, and supervision. MDL was responsible for the tasks of review and editing of the paper and supervision. VO was responsible for the tasks of review and editing of the paper, design of the methodology, and validation of the results.
The authors declare that they have no conflict of interest.
This article is part of the special issue “Understanding the unknowns: the impact of uncertainty in the geosciences”. It is not associated with a conference.
The authors would like to thank Intrepid Geophysics for their participation in the software development effort that proved essential to the completion of this project.
This work was supported by the Geological Survey of Western Australia, the Western Australian Fellowship Program and the Australian Research Council.
This paper was edited by Nick Roberts and reviewed by Guillaume Caumon and Gautier Laurent.
Abrahamsen, P., Omre, H., and Lia, O.: Stochastic models for seismic depth conversion of geological horizons, Offshore Europe, 329–341, 1991.
Aguilar, M. Á. L., Khrennikov, A., and Oleschko, K.: From axiomatics of quantum probability to modelling geological uncertainty and management of intelligent hydrocarbon reservoirs with the theory of open quantum systems, Philos. T. R. Soc. A, 376, 20170225, https://doi.org/10.1098/rsta.2017.0225, 2018.
Aug, C., Chilès, J.-P., Courrioux, G., and Lajaunie, C.: 3-D geological modelling and uncertainty: The potential-field method, in: Geostatistics Banff 2004, Springer, 145–154, 2005.
Bardossy, G. and Fodor, J.: Traditional and NewWays to Handle Uncertainty in Geology, Nat. Ressour. Res., 10, 179–187, 2001.
Beven, K. and Binley, A.: The future of distributed models: model calibration and uncertainty prediction, Hydrol. Process., 6, 279–298, 1992.
Bijani, R., Lelièvre, P. G., Ponte-Neto, C. F., and Farquharson, C. G.: Physical-property-, lithology-and surface-geometry-based joint inversion using Pareto Multi-Objective Global Optimization, Geophys. J. Int., 209, 730–748, 2017.
Burns, K. L.: Lithologic topology and structural vector fields applied to subsurface predicting in geology, Proc. of GIS/LIS, 1988.
Calcagno, P., Chilès, J. P., Courrioux, G., and Guillen, A.: Geological modelling from field data and geological knowledge, Phys. Earth Planet. Int., 171, 147–157, https://doi.org/10.1016/j.pepi.2008.06.013, 2008.
Carter, J. N., Ballester, P. J., Tavassoli, Z., and King, P. R.: Our calibrated model has poor predictive value: An example from the petroleum industry, Reliab. Eng. Syst. Saf., 91, 1373–1381, 2006.
Cawood, A. J., Bond, C. E., Howell, J. A., Butler, R. W., and Totake, Y.: LiDAR, UAV or compass-clinometer? Accuracy, coverage and the effects on structural models, J. Struct. Geol., 98, 67–82, 2017.
Chakraborty, S., Nagwani, N., and Dey, L.: Performance comparison of incremental k-means and incremental dbscan algorithms, 14–18, 2014.
Cherpeau, N., Caumon, G., and Lévy, B.: Stochastic simulations of fault networks in 3-D structural modeling, C. R. Geosci., 342, 687–694, 2010.
Chilès, J. P. and Delfiner, P.: Geostatistics: modeling spatial uncertainty, John Wiley & Sons, New Jersey, 313–321, 2009.
Chilès, J.-P., Aug, C., Guillen, A., and Lees, T.: Modelling the geometry of geological units and its uncertainty in 3D from structural data: the potential-field method, Proceedings of international symposium on orebody modelling and strategic mine planning, Perth, Australia, 22, 313–320, 2004.
Dang, C., Nghiem, L., Nguyen, N., Chen, Z., Yang, C., and Nguyen, Q.: A framework for assisted history matching and robust optimization of low salinity waterflooding under geological uncertainties, J. Petrol. Sci. Eng., 152, 330–352, 2017.
de la Varga, M. and Wellmann, J. F.: Structural geologic modeling as an inference problem: A Bayesian perspective, Interpretation, 4, SM1–SM16, 2016.
Ester, M., Kriegel, H.-P., Sander, J., and Xu, X.: A density-based algorithm for discovering clusters in large spatial databases with noise, Kdd, Proceedings of the Second International Conference on Knowledge Discovery and Data Mining, 1996, 226–231, 1996.
Giraud, J., Pakyuz-Charrier, E., Jessell, M., Lindsay, M., Martin, R., and Ogarko, V.: Uncertainty reduction through geologically conditioned petrophysical constraints in joint inversion Geophys, 82, ID19–ID34, https://doi.org/10.1190/geo2016-0615.1, 2017.
Giraud, J., Lindsay, M., Ogarko, V., Jessell, M., Martin, R., and Pakyuz-Charrier, E.: Integration of geoscientific uncertainty into geophysical inversion by means of local gradient regularization, Solid Earth, 10, 193–210, https://doi.org/10.5194/se-10-193-2019, 2019.
Guillen, A., Calcagno, P., Courrioux, G., Joly, A., and Ledru, P.: Geological modelling from field data and geological knowledge, Phys. Earth Planet. Int., 171, 158–169, https://doi.org/10.1016/j.pepi.2008.06.014, 2008.
Hamming, R. W.: Error detecting and error correcting codes, Bell Labs Tech. J., 29, 147–160, 1950.
Jessell, M.: Three-dimensional geological modelling of potential-field data, Comput. Geosci., 27, 455–465, 2001.
Julio, C., Caumon, G., and Ford, M.: Sampling the uncertainty associated with segmented normal fault interpretation using a stochastic downscaling method, Tectonophys, 639, 56–67, 2015.
Lark, R. M., Mathers, S. J., Thorpe, S., Arkley, S. L. B., Morgan, D. J., and Lawrence, D. J. D.: A statistical assessment of the uncertainty in a 3-D geological framework model, Proc. Geol. Assoc., 124, 946–958, https://doi.org/10.1016/j.pgeola.2013.01.005, 2013.
Lindsay, M. D., Aillères, L., Jessell, M., de Kemp, E. A., and Betts, P. G.: Locating and quantifying geological uncertainty in three-dimensional models: Analysis of the Gippsland Basin, southeastern Australia, Tectonophys, 546/547, 10–27, https://doi.org/10.1016/j.tecto.2012.04.007, 2012.
Lindsay, M. D., Perrouty, S., Jessell, M., and Aillères, L.: Making the link between geological and geophysical uncertainty: geodiversity in the Ashanti Greenstone Belt, Geophys. J. Int., 195, 903–922, https://doi.org/10.1093/gji/ggt311, 2013.
Lipari, V., Urbano, D., Spadavecchia, E., Panizzardi, J., and Bienati, N.: Regularized tomographic inversion with geological constraints, Geophys. Prospect., 65, 305–315, 2017.
Mery, N., Emery, X., Cáceres, A., Ribeiro, D., and Cunha, E.: Geostatistical modeling of the geological uncertainty in an iron ore deposit, Ore Geol. Rev., 88, 336–351, 2017.
Nearing, G. S., Tian, Y., Gupta, H. V., Clark, M. P., Harrison, K. W., and Weijs, S. V.: A philosophical basis for hydrological uncertainty, Hydrol. Sci. J., 61, 1666–1678, https://doi.org/10.1080/02626667.2016.1183009, 2016.
Novakova, L. and Pavlis, T. L.: Assessment of the precision of smart phones and tablets for measurement of planar orientations: A case study, J. Struct. Geol., 97, 93–103, 2017.
Pakyuz-Charrier, E.: CarloTopo synthetic GeoModeller model and relevant MCUE outputs, https://doi.org/10.5281/zenodo.1202314, 2018.
Pakyuz-Charrier, E., Lindsay, M., Ogarko, V., Giraud, J., and Jessell, M.: Monte Carlo simulation for uncertainty estimation on structural data in implicit 3-D geological modeling, a guide for disturbance distribution selection and parameterization, Solid Earth, 9, 385–402, https://doi.org/10.5194/se-9-385-2018, 2018a.
Pakyuz-Charrier, E., Giraud, J., Ogarko, V., Lindsay, M., and Jessell, M.: Drillhole uncertainty propagation for three-dimensional geological modeling using Monte Carlo, Tectonophys, 747–748, 16–39, https://doi.org/10.1016/j.tecto.2018.09.005, 2018b.
Pakyuz-Charrier, E., Giraud, J., Lindsay, M., and Jessell, M.: Common Uncertainty Research Explorer Uncertainty Estimation in Geological 3D Modelling, ASEG Ext Abstr, 2018, 1–6, https://doi.org/10.1071/ASEG2018abW10_2D, 2018c.
Pellerin, J., Caumon, G., Julio, C., Mejia-Herrera, P., and Botella, A.: Elements for measuring the complexity of 3-D structural models: Connectivity and geometry, Comput. Geosci., 76, 130–140, https://doi.org/10.1016/j.cageo.2015.01.002, 2015.
Schubert, E., Sander, J., Ester, M., Kriegel, H.-P., and Xu, X.: DBSCAN Revisited,Revisited: Why and How You Should (Still) Use DBSCAN, ACM Trans. Database Syst. 42, 3, Article 19, 21 pp., https://doi.org/10.1145/3068335, 2017.
Schweizer, D., Blum, P., and Butscher, C.: Uncertainty assessment in 3-D geological models of increasing complexity, Solid Earth, 8, 515–530, https://doi.org/10.5194/se-8-515-2017, 2017.
Stigsson, M.: Orientation Uncertainty of Structures Measured in Cored Boreholes: Methodology and Case Study of Swedish Crystalline Rock, Rock Mech. Rock Eng., 49, 4273–4284, 2016.
Thiele, S. T., Jessell, M. W., Lindsay, M., Ogarko, V., Wellmann, J. F., and Pakyuz-Charrier, E.: The topology of geology 1: Topological analysis, J. Struct. Geol., 91, 27–38, 2016a.
Thiele, S. T., Jessell, M. W., Lindsay, M., Wellmann, J. F., and Pakyuz-Charrier, E.: The topology of geology 2: Topological uncertainty, J. Struct. Geol., 91, 74–87, 2016b.
Wang, H., Wellmann, J. F., Li, Z., Wang, X., and Liang, R. Y.: A Segmentation Approach for Stochastic Geological Modeling Using Hidden Markov Random Fields, Math Geosci, 49, 145–177, https://doi.org/10.1007/s11004-016-9663-9, 2017.
Wellmann, J. F.: Information Theory for Correlation Analysis and Estimation of Uncertainty Reduction in Maps and Models, Entropy, 15, 1464–1485, https://doi.org/10.3390/e15041464, 2013.
Wellmann, F. and Caumon, G.: 3-D Structural geological models: Concepts, methods, and uncertainties, in: Advances in Geophysics, edited by: Cedric, S., Elsevier, 121, https://doi.org/10.1016/bs.agph.2018.09.001, 2018.
Wellmann, J. F. and Regenauer-Lieb, K.: Uncertainties have a meaning: Information entropy as a quality measure for 3-D geological models, Tectonophys, 526–529, 207–216, https://doi.org/10.1016/j.tecto.2011.05.001, 2012.
Wellmann, J. F., Lindsay, M. D., Poh, J., and Jessell, M. W.: Validating 3-D Structural Models with Geological Knowledge for Improved Uncertainty Evaluations, Energy Proced., 59, 374–381, https://doi.org/10.1016/j.egypro.2014.10.391, 2014.
Wellmann, J. F., Thiele, S. T., Lindsay, M. D., and Jessell, M. W.: pynoddy 1.0: an experimental platform for automated 3-D kinematic and potential field modelling, Geosci. Model Dev., 9, 1019–1035, https://doi.org/10.5194/gmd-9-1019-2016, 2016.
Zlatanova, S.: On 3-D topological relationships, Database and Expert Systems Applications, Proc. 11th International Workshop On 2000, 913–919, 2000.
U(a,b) is the usual continuous uniform distribution.
- Abstract
- Introduction
- MCUP method
- Plausible model topological heterogeneity
- Plausible model topological analysis
- Synthetic case study
- Discussion
- Conclusions
- Code and data availability
- Appendix A: The spherical cap distribution
- Appendix B: Spherical cap pseudo-random number generation
- Appendix C: Spherical standardized Irwin–Hall distribution
- Author contributions
- Competing interests
- Special issue statement
- Acknowledgements
- Financial support
- Review statement
- References