the Creative Commons Attribution 4.0 License.
the Creative Commons Attribution 4.0 License.
 | 13 Jun 2019
Fluid-mediated, brittle–ductile deformation at seismogenic depth – Part 1: Fluid record and deformation history of fault veins in a nuclear waste repository (Olkiluoto Island, Finland)
Barbara Marchesini
Paolo Stefano Garofalo
Luca Menegon
Jussi Mattila
The dynamic evolution of fault zones at the seismogenic brittle–ductile transition zone (BDTZ) expresses the delicate interplay between numerous physical and chemical processes. Deformation and fluid flow at the BDTZ are closely related and mutually dependent during repeating and transient cycles of frictional and viscous deformation. Despite numerous studies documenting in detail seismogenic faults exhumed from the BDTZ, uncertainties remain as to the exact role of fluids in facilitating broadly coeval brittle and ductile deformation at that structural level. We combine structural analysis, fluid inclusion, and mineral chemistry data from synkinematic and authigenic minerals to reconstruct the temporal variations in fluid pressure (Pf), temperature (T), and bulk composition (X) of the fluids that mediated deformation and steered strain localization along BFZ300, a strike–slip fault originally active at the BDTZ. BFZ300 deforms the Paleoproterozoic migmatitic basement of southwestern Finland and hosts in its core two laterally continuous quartz veins formed by two texturally distinct types of quartz – Qtz I and Qtz II, with Qtz I older than Qtz II. Veins within the damage zone are formed exclusively by Qtz I. Mesostructural and microstructural analysis combined with fluid compositional data indicate recurrent cycles of mutually overprinting brittle and ductile deformation triggered by oscillations of fluid pressure peaking at 210 MPa. Fluid inclusion microthermometry and mineral pair geothermometry indicate that the two documented quartz types precipitated from different fluid batches, with bulk salinities in the 1 wt % NaCleq–5 wt % NaCleq range for Qtz I and in the 6 wt % NaCleq–11 wt % NaCleq range for Qtz II. The temperature of the fluids involved with initial strain localization and later fault reactivation evolved through time from > 350 ∘C during Qtz I precipitation to < 300 ∘C at the time of Qtz II crystallization. The peak fluid pressure estimates constrain pore pressure oscillations between 80 and 210 MPa during the recorded faulting episodes. Our results suggest variability of the physico-chemical conditions of the fluids steering deformation (Pf, T, X), reflecting the ingress and effects of multiple batches of fluid in the fault zone. Initial fluid-mediated embrittlement generated a diffuse network of joints and/or hybrid–shear fractures in the damage zone; subsequent strain localization led to more localized deformation within the fault core. Localization was guided by cyclically increasing fluid pressure and transient embrittlement of a system that was otherwise under overall ductile conditions.
Our analysis suggests that fluid overpressure at the BDTZ can play a key role in the initial embrittlement of the deforming rock and steer subsequent strain localization.
- Article
(20196 KB) - Full-text XML
- Companion paper
-
Supplement
(1551 KB) - BibTeX
- EndNote


The physical and chemical properties of fault systems play a fundamental role in controlling the rheological behaviour of the Earth's crust and in steering channelled fluid flow (e.g. Caine et al., 1996). Deformation and fluid flow are closely related and mutually dependent via a number of feedbacks, such as the control that fluids exert upon the effectiveness of deformation processes and the development of fault systems at all scales, and the control by rock heterogeneities and/or fracture system topology on the net fault transmissivity (e.g. Crider and Peacock, 2004). The nucleation and development of permeable fault systems and the mechanisms whereby individual faults may weaken and eventually fail are therefore complex functions of a number of processes. In this perspective, the interaction between fluid and mineral phases within fault rocks needs to be studied with a system approach in order to single out the role and importance of all processes involved (Kaduri et al., 2017).
An obvious effect of fluid involvement, particularly in crustal volumes that have experienced large deformation-controlled fluid fluxes, is the precipitation of authigenic and hydrothermal minerals within faults (Oliver and Bons, 2001; Viola et al., 2016) and their immediately adjacent host rock (Mancktelow and Pennacchioni, 2005; Garofalo, 2004). In the seismogenic region of the crust, where fluids may even be the primary driver of the seismic cycle (e.g. Miller, 2013), faults have been shown to have the potential to function like a “fluid-activated valve”, whereby they experience transient and cyclic fluid pressure build-up before sudden fluid venting, pore pressure and mechanical strength drop concomitant with seismic failure (e.g. Sibson, 1989, 1992b, 1993; Cox, 1995; Viola et al., 2006; De Paola et al., 2007; Wehrens et al., 2016). Hydrothermal ore deposits, in which fault networks focus relatively large volumes of ore fluids and precipitate economic minerals (Cox et al., 2001; Boiron et al., 2003; Moritz et al., 2006; Scheffer et al., 2017a), are also pertinent examples of significant deformation-controlled fluid ingress.
The seismogenic depth down to 10–15 km (e.g. Kohlstedt et al., 1995) is thus a key region of the crust in which to study the whole range of fluid–rock interaction processes occurring within fault zones. Deformation at that depth might be accommodated under overall brittle–ductile conditions along fault systems crossing or rooting into the brittle–ductile transition zone (BDTZ). In detail, the deformation style in the BDTZ is generally characterized by the cyclicity, also at the short timescale, between brittle and ductile behaviour (Famin et al., 2004, 2005; Siebenaller et al., 2013). This is induced and regulated by the complex and transient interplay of numerous parameters, among which are the lithological composition and transient variation of temperature, pore pressure, and strain rate within the deforming system. Field studies have documented unequivocally that ductile and brittle deformation may even be simultaneously active during deformation as a function of the transient and spatially heterogeneous evolution of the chemical and physical parameters steering deformation, leading to the broad coexistence of geological features expressing frictional deformation and viscous creep and to mutual cross-cutting relationships thereof (e.g. Guermani and Pennacchioni, 1998; Kjøll et al., 2015; Pennacchioni et al., 2006; Wehrens et al., 2016; Scheffer et al., 2017b).
Veins are particularly important in this context because they attest to the relative abundance of aqueous fluids in the deformation history (e.g. Cox et al., 2001). Portions of the seismogenic crust that experience large fluid fluxes host pervasive and vertically extensive vein networks (Sibson et al., 1988), within which up to several million cubic metres of hydrothermal minerals may deposit from the flowing fluid (e.g. Heinrich et al., 2000; Cox, 2005; Bons, 2001; Garofalo et al., 2002). In contrast, portions of the crust deforming in the absence of significant fluid flow would show little to no evidence of veining, with only synkinematic H2O-rich minerals within the fault rock attesting to hydrous conditions (Mancktelow and Pennacchioni, 2004; Menegon et al., 2017).
The physical–chemical conditions of fluid–rock interaction in the BDTZ have been studied within exhumed faults by applying a set of geochemical tools that include fluid inclusion analysis (e.g. Morrison, 1994; Morrison and Anderson, 1998; Mulch et al., 2004; Ault and Selverstone, 2008; Garofalo et al., 2014; Siebenaller et al., 2016; Compton et al., 2017), determination of the isotopic compositions of fault fluids, and mass transfer calculations between host rock and fault rocks (e.g. Goddard and Evans, 1995; Garofalo, 2004; Mittempergher et al., 2014; Spruzeniece and Piazolo, 2015). This approach yields important constraints on the P–T conditions of fluid–rock interaction within the BDTZ, on the source region of the fluids reaching and flowing within the deformation zones, and on element mobility during syn-tectonic fluid flow. These studies, however, do not specifically address the role of fluids in the mechanisms that trigger and permit the aforementioned cycles of brittle–ductile deformation. Open questions thus remain, such as what pressure, temperature, and composition (P, T, X) conditions are best for a fluid to trigger brittle–ductile deformation cycles in a fault system within the BDTZ and which fluid property is specifically most effective in controlling the cycles.
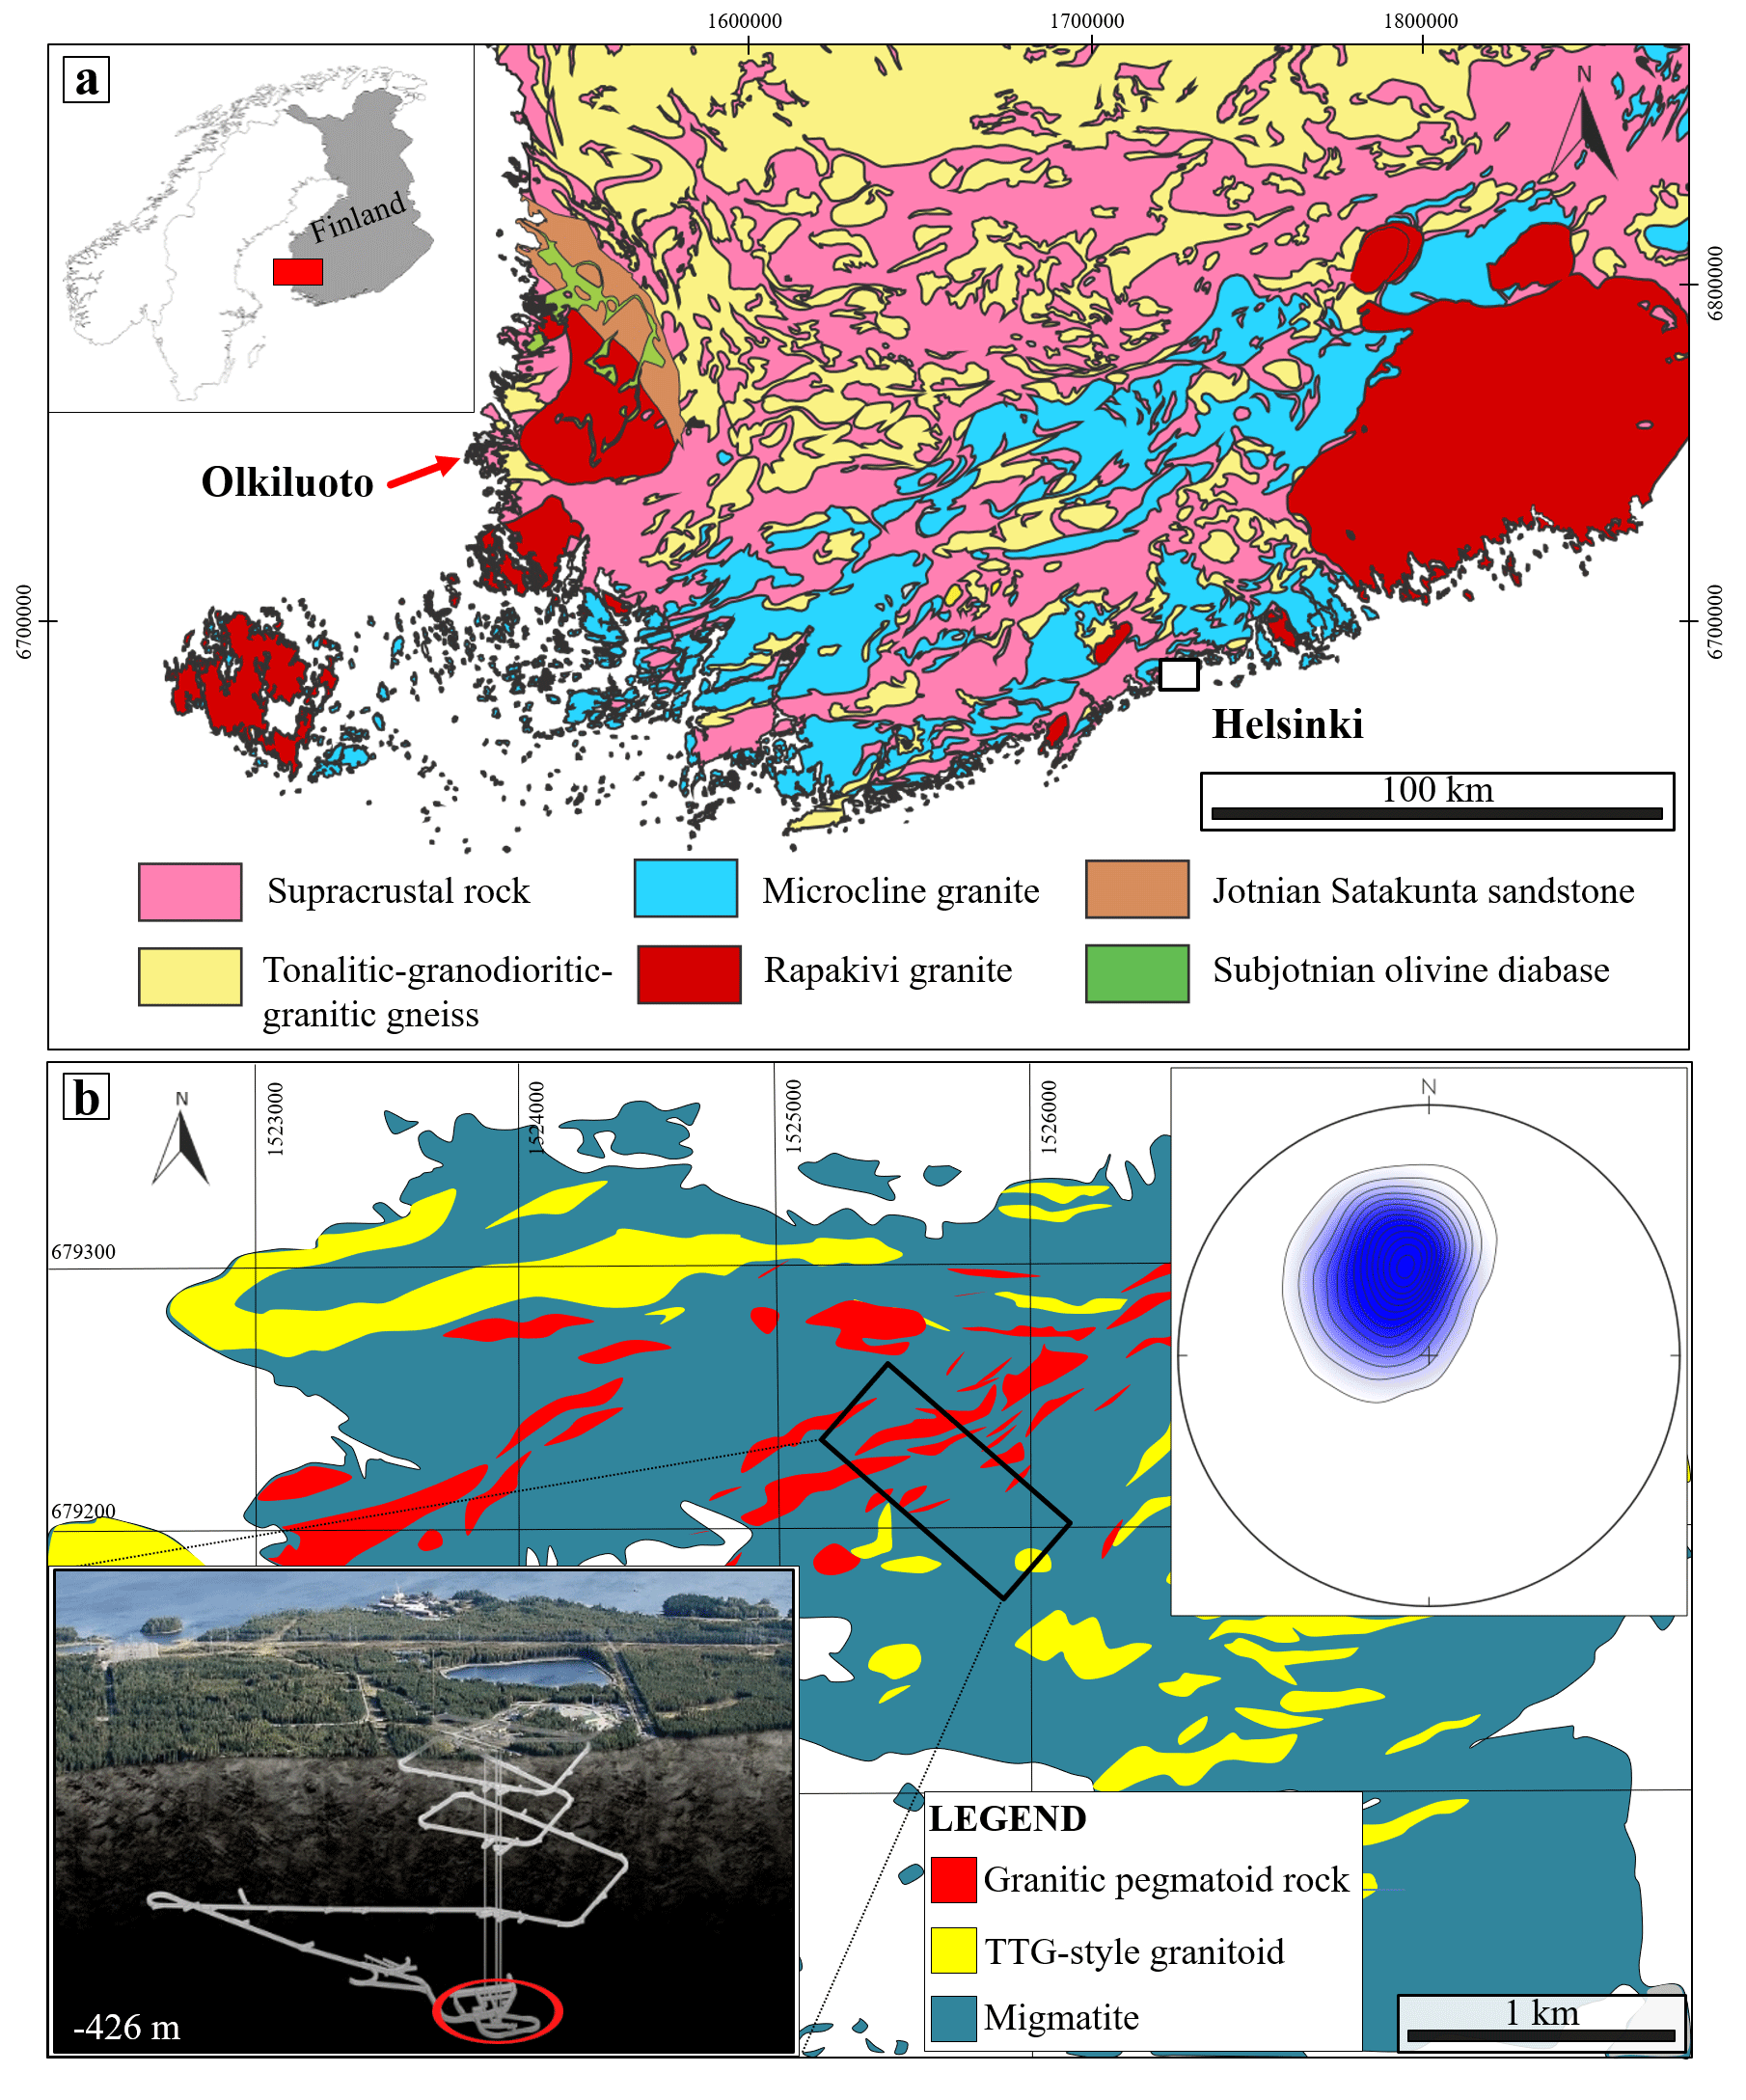
Figure 1(a) Simplified geological map of southwestern Finland modified after Mattila and Viola (2014). (b) Geological sketch of Olkiluoto Island. The upper right inset shows the poles to foliation planes measured from all available Olkiluoto drill cores (N=4479, equal area, lower hemisphere projection; Mattila and Viola, 2014). The lower left inset is a panoramic photograph with an overlay drawing of the underground infrastructure (photo courtesy of Posiva Oy, Finland). The red circle shows the depth location of BFZ300. Coordinates are given in the local KKJ1 coordinate system.
In this work, we follow a multidisciplinary approach by combining mesostructural and microstructural observations with the geochemical analysis of fluids, petrographic documentation of fault rocks and veins, microthermometric properties of fluid inclusion assemblages, electron probe microanalysis (EPMA) of fault minerals, Raman spectrometry of fluid inclusions, and electron probe cathodoluminescence imaging to study the effects of numerous cycles of fluid–rock interaction that have occurred in a vein-rich deformation zone at the seismogenic BDTZ and now exhumed as part of the Paleoproterozoic continental crust of southwestern Finland. The studied deformation zone belongs to an exhumed conjugate fault system that experienced a complex history of structural reactivation and fluid flow. Deformation zone BFZ300, the target of our study, crops out at ca. 426 m below sea level within the deep Onkalo nuclear waste repository that is presently being built on the island of Olkiluoto (Fig. 1a).
Our results allow us to constrain and describe the progressive evolution of the deformation processes and the role of fluids involved both at fault initiation and during the subsequent reactivation phases. We propose that fluid pressure fluctuation cycles within an overall ductile environment at the BDTZ triggered brittle–ductile cyclicity encompassing fracturing, vein precipitation, and crystal–plastic deformation before renewed and fluid-induced embrittlement. Our multi-technique approach made it possible to determine many of the actual chemical and physical properties of the fluids involved in the deformation process, leading to a well-constrained conceptual mechanical model for the fault nucleation and subsequent development.
The study area is located in southwestern Finland on the island of Olkiluoto (Fig. 1a) within the Paleoproterozoic Svecofennian orogenic province, which is formed by supracrustal high-grade metamorphic sequences and plutonic rocks. The most abundant lithologies in the study area are variably migmatitic metasedimentary rocks interleaved with metavolcanic rocks up to several metres thick in addition to calc-alkaline synorogenic tonalite-trondhjemite-granodiorite-type (TTG) granitoids, as well as late orogenic leucogranites (Fig. 1a, b). For a detailed lithological characterization of the area, we refer the reader to Hudson and Cosgrove (2006) and Aaltonen et al. (2016).
Numerous studies carried out on Olkiluoto have highlighted the long geological evolution of the region, which is commonly summarized by tectonic models proposing either an evolution during a single and semi-continuous Svecofennian orogenic event (Gorbatschev and Bogdanova, 1993) or, alternatively, a sequence of up to five distinct accretion events leading to the amalgamation of several microcontinents and island arcs at the margin of the Archean craton between 1.92 and 1.79 Ga (e.g. Lahtinen et al., 2005). In this scenario, several subduction systems developed, and the collision of the involved microcontinents and island arc complexes resulted in conspicuous continental growth, forming the major part of the Paleoproterozoic domain of the Fennoscandian Shield (1.89–1.87 Ga). According to Lahtinen et al. (2005), this “Fennian accretionary event” ended with a phase of orogenic collapse associated with regional extension and remarkable crustal thinning between ca. 1.86 and 1.84 Ga. Renewed compression ensued during collision of the “Sarmatian Plate” with the previously consolidated Svecofennian Shield, causing major crustal shortening, high-temperature regional metamorphism (Kukkonen and Lauri, 2009), and the emplacement of S-type granites (e.g. Ehlers et al., 1993). Tectonic activity ascribable to this orogenic phase ceased with a distinct orogenic collapse phase at 1.79–1.77 Ga (Lahtinen et al., 2005).
Pervasive reworking of the Svecofennian domain took place in the Mesoproterozoic when the crust underwent significant stretching and was intruded by voluminous Rapakivi granites and diabase dykes resulting from the widespread melting of the lower crust at ca. 1.65–1.50 Ga. This tectonic phase was probably due to the development of a rift along the present Baltic Sea (Korja et al., 2001). Crustal thinning also caused the formation of the “Satakunta Graben”, a NW–SE-trending graben located ca. 50 km to the north of Olkiluoto, which was later filled by Mesoproterozoic sandstone (Jotnian sandstones, Fig. 1a). The latest stage of crustal evolution in southern Finland is expressed by the intrusion of 1.27–1.25 Ga, N–S-striking olivine diabase dikes (Fig. 1a; e.g. Suominen, 1991).
As to the structural evolution of the study area, the bedrock was affected by complex, polyphase ductile deformation between 1.86 and 1.81 Ga. According to the evolutionary deformation scheme by Aaltonen et al. (2010) the results of up to five different phases, referred to as D1–D5, are preserved in the local structural record, each characterized by structures with distinctive mineral composition, metamorphic grade, geometry, and kinematics. The most relevant phases to our study are D2 to D4. During these ductile episodes, a regional and pervasive NE–SW-striking and moderately SE-dipping foliation developed, strain localized along mesoscopic shear zones parallel to subparallel to the foliation, and extensive migmatization occurred under amphibolite facies metamorphic conditions. NNE–SSW- and N–S-striking mylonitic shear zones also formed under those conditions, whereas later ductile events developed under progressively lower-grade metamorphism until ca. 1.7 Ga, when brittle deformation became the dominant deformation style in response to progressive regional exhumation and cooling (Mattila and Viola, 2014; Aaltonen et al., 2016). The penetrative, inherited ductile grain that by then characterized the crystalline basement and that was suitably oriented with regard to the prevailing stress field was invariably reactivated. This is the case for several NNE–SSW-striking faults mapped underground in the Onkalo repository, which clearly overprint earlier D4 shear zones and fully exploit the pre-existing ductile precursors. Other faults, such as BFZ300, do not show any clear genetic relation to the older ductile fabric and cut it discordantly.
As shown in the following section, BFZ300 belongs to a set of subvertical, conjugate brittle–ductile to fully brittle strike–slip faults characterized by N–S-trending sinistral and NW–SE dextral faults. Both sets document a complex history of reactivation and contain evidence for cyclic and transient switches between brittle and ductile deformation at all scales. Mesostructural and microstructural studies show that the sinistral faults overprint and probably reactivate a dextral mylonitic precursor related to earlier localized ductile deformation (Prando et al., 2019). These faults locally contain pseudotachylyte injections, which suggests seismic behaviour during deformation (Menegon et al., 2018). In contrast, dextral faults cut across the foliation, do not exploit any ductile precursors, and do not host pseudotachylytes. BFZ300 belongs to this second group of faults. In the following, we describe its architecture, reconstruct its deformation history, and constrain the deformation mechanisms and faulting conditions that prevailed during its nucleation and subsequent development. The architecture and deformation history of the remarkably different conjugate structure to BFZ300, which is a sinistral brittle–ductile deformation zone, is described in the Part II companion paper (Prando et al., 2019).
Field documentation and sampling were carried out at the underground Onkalo exposures of BFZ300 (Fig. 1b), which were necessarily limited in extent to the actual excavated volume of rock at the time of our study but that, together with the logged diamond drill cores from the underground exploration, allow for a well-constrained 3-D reconstruction of the local geology.
Fluid inclusion measurements were conducted on “fluid inclusion assemblages” (FIAs), i.e. on petrographically discriminated, cogenetic groups of fluid inclusions located along trails or (less commonly) within clusters (Bodnar, 2003a; Goldstein, 2003). By definition, FIAs are groups of inclusions that have been trapped together (i.e. they are cogenetic) at a specific stage of mineral formation and, as such, give the highest level of confidence when characterizing the properties of trapped fluids and discriminating possible stages of post-entrapment re-equilibration (Bodnar, 2003b, and references therein). We applied Roedder's identification criteria of FIAs according to the timing of entrapment (i.e. primary, secondary, pseudosecondary) in order to link stages of fluid entrapment with stages of brittle and ductile deformation of quartz. In this regard, we considered only FIAs that exhibited both similar orientation and petrographic characteristics at the scale of the thin section to be cogenetic and therefore representative of one specific stage of brittle deformation and fluid circulation.
In the selected samples, we studied 28 FIAs entrapped within two distinct generations of quartz (named Qtz I and Qtz II) forming two different generations of veins and exhibiting the least petrographic evidence of post-entrapment overprinting by later ductile and/or brittle deformation, which provided ca. 800 microthermometric properties. Due to the well-documented tendency of fluid inclusions to modify their shape, volume, and composition after their initial entrapment even under low deviatoric stress conditions (e.g. Diamond et al., 2010; Kerrich, 1976; Tarantola et al., 2010; Wilkins and Barkas, 1978), working on FIAs that show the least possible degree of textural re-equilibration is essential when aiming at constraining the physical and chemical properties of the fluid(s) involved in the fault activity.
Microthermometric properties of fluid inclusions were determined at the Department of Biological, Geological and Environmental Sciences of the University of Bologna using a Linkam THMSG 600 heating–freezing stage coupled with an Olympus BX51 polarizing microscope. The microthermometry stage was calibrated by using synthetic fluid inclusion samples at −56.6, 0.0, and 374 ∘C, which correspond to the melting of CO2, ice melting, and final homogenization of H2O inclusions, respectively. Obtained accuracies were ±0.3 ∘C for final ice melting temperature (Tmice) and ±3 ∘C for final homogenization temperature (Thtot). In order to produce an internally consistent dataset, all phase transitions were exclusively collected for individual FIAs and measured with the same standard procedure. Samples were first rapidly cooled to ca. −180 ∘C and then slowly heated to detect the potential formation of a solid carbonic phase, eutectic phases, salt hydrates, ice, and clathrates. The Thtot values were later determined in the FIAs by heating the samples from room temperature and recording the mode of homogenization (i.e. by bubble or liquid disappearance). All phase transitions were measured by using the cycling method described by Goldstein and Reynolds (1994), and care was taken to also record the minimum and maximum values for each assemblage. Volume fractions of individual fluid inclusions, determined as a percentage of the ratio (Diamond, 2003), were estimated optically at room temperature using calibrated charts. Salinity, bulk densities, and isochores were computed from the measured Tmice values using the HokieFlincs Excel spreadsheet (Steele-MacInnis et al., 2012, and references therein).
Fluid inclusions were also analysed using micro-Raman spectrometry. Analyses were carried out at the Department of Mathematical, Physical and Computer Sciences of the University of Parma (Italy) using a Jobin-Yvon Horiba LabRam spectrometer equipped with an He–Ne laser (emission line 632.8 nm) and motorized XY stage. The spectral resolution of the measurements was determined as nearly 2 cm−1. The confocal hole was adjusted to obtain a spatial (lateral and depth) resolution of 1–2 µm. Most spectra were obtained with a 50× objective (N.A. 0.75), although for shallow inclusions a 100× objective (N.A. 0.90) was also used. The calibration was made using the 520.7 cm−1 Raman line of silicon. A wide spectral range (100–3600 cm−1) was scanned for each inclusion for the presence of CO2, N2, CH4, and H2S, but the final acquisitions were made mainly between 1100 and 1800 cm−1 for the study of CO2 spectra and between 2500 and 3300 cm−1 for CH4 and H2S. The acquisition time for each spectral window was 120–240 s, with two accumulations. The power on the sample surface is nearly 1 mW, but the power on the analysed inclusions has to be considered lower due to reflections and scattering. Analyses were carried out on the vapour bubbles of the fluid inclusions.
After the calculation of representative fluid inclusion isochores for each FIA, the pressure corrections were assessed by using the crystallization temperatures of two mineral pairs – namely chlorite–quartz and stannite–sphalerite – as independent input parameters. Chlorite–quartz temperatures were calculated by using the method of Bourdelle and Cathelineau (2015), which assumes quartz–chlorite equilibrium and uses ratios of chlorite endmember activities to link the chlorite compositions with the corresponding formation temperatures through the quartz–chlorite equilibrium constants. This method is based on the measurements of the concentrations of the major chlorite components (Si, Fe, Mg) and can only be applied to chlorites with () < 1 wt %, which is indeed the case of our chlorites. To estimate the formation temperature of cogenetic sulfides associated with Qtz II we used the stannite–sphalerite formation temperature following the method proposed by Shimizu and Shikazono (1985). This geothermometer uses the temperature dependency of iron and zinc partitioning between stannite and sphalerite (Nekrasov et al., 1979) as a temperature indicator of the association of Qtz II stannite and sphalerite.
Electron probe microanalysis (EPMA) of fault minerals was carried out with a JEOL-8200 wavelength-dispersive electron microprobe housed at the Department of Earth Sciences of the University of Milan, Italy. The instrument fits five wavelength dispersive spectroscopy (WDS) spectrometers utilizing lithium fluoride (LiFH), pentaerythritol (PETJ and PETH), and thallium acid phthalate (TAP) analysing crystals and an optical microscope. Samples were probed with a beam size of ∼1 µm at a 15 keV and 5 nA beam current. Synthetic and natural materials were used as calibration standards at the beginning of each session. Analytical 1σ errors are typically < 4 % for major elements and for the minor elements.
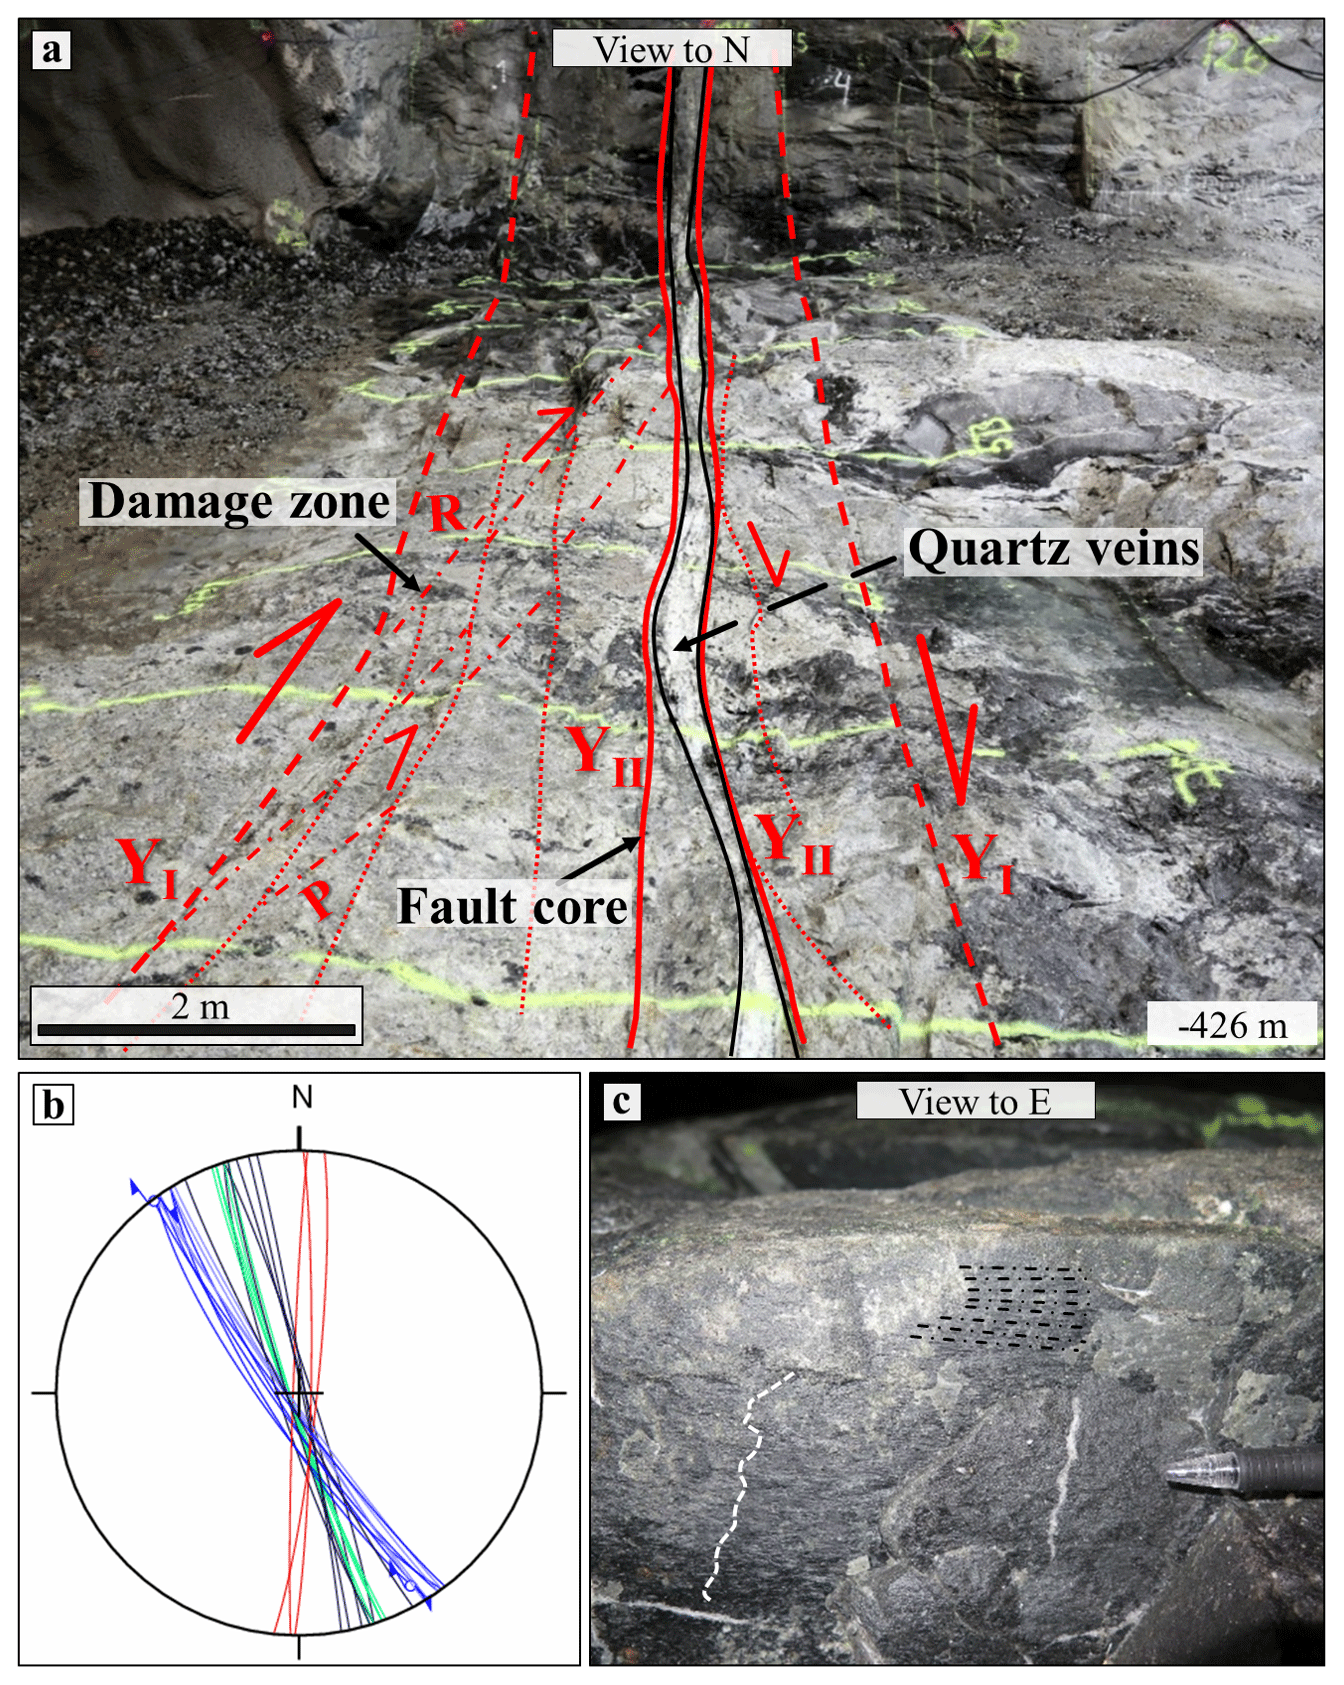
Figure 2(a) View to the north and interpretation of the structural elements of BFZ300. (b) Lower hemisphere, equiangular projection of conjugate fault segments (blue: dextral faults; red: sinistral faults), cleavage (green), and Qtz I chlorite veins infilling joints (black). (c) Slickensides (white dashed line) and slickenlines (black dashed lines) on a chlorite-decorated, NW–SE-striking fracture plane at the vein–host interface, indicating dextral strike–slip kinematics.
Panchromatic cathodoluminescence (CL) imaging was also performed by using the CL CCD detector adjacent to the optical microscope of the JEOL-8200 on the sections used for microstructural work. The electron beam was focused on the sections with an accelerating voltage of 15 kV and a 30 nA beam current. Black-and-white digital images were collected with a 40× magnification by beam mapping with the CCD detector at a spatial resolution of 1 µm (beam resolution), which resulted in imaged areas of 27.8×22.2 mm. The exposure time for image acquisition was 120 s.
Petrographic thin sections were later studied with the scanning electron microprobe (SEM) to investigate the crystallographic preferred orientation (CPO) of selected sites of the quartz veins from the fault core (sample name TPH-120-4; see Fig. 2 for sample location). Samples were analysed with a JEOL-6610 SEM equipped with a Nordlys Nano electron backscatter diffraction (EBSD) detector, hosted at the Electron Microscopy Centre of the University of Plymouth, UK. EBSD detailed results are reported in the Supplement.

Figure 3BFZ300 architecture with examples of representative structural features. The red rectangles locate the areas where detailed outcrop photos were taken. Stars locate hand and drill core samples. Stars with a black outline identify samples used for the microthermometric study. Note that the fault is made of two main segments offset laterally at a sinistral compressive step-over zone. Fault core quartz veins are shown by thicker black lines in the schematic model (centre of figure), while blue and white lines highlight the positions of the two types of quartz veins in the outcrop pictures. (a) Damage zone made of millimetre-thick, en echelon veins connected by conjugate shear segments. (b) Detail of (a) showing fractures filled by the first quartz generation (Qtz I). (c) Two distinct generations of quartz–chlorite veins recognized in the fault core (Qtz I and Qtz II). (d) Detail of the sinistral compressional step-over zone characterized by multiple and parallel T fractures, filled by Qtz I. A brecciated body is cross-cut by the Y planes. (e) Tensional fracture infilled by Qtz I. (f) Compressional structures (P shears) from the step-over zone and relationships between Qtz I and Qtz II. The Riedel geometry suggests that the Qtz II vein formed due to the reactivation of the internal principal slip zones (YII). Note the Qtz II vein cutting the Qtz I vein. (g) Juxtaposed Qtz I and Qtz II veins. Qtz I veins are thinner and made of a translucent, small-grained quartz. In contrast, Qtz II veins, which contain pockets of sulfide aggregates, are thicker and made of larger and euhedral quartz. Chlorite occurs as a minor phase in both veins. Notice the presence of a cataclastic band between the two veins. (h) Spatial continuity of the chlorite aggregates within the Qtz II veins, which always grow orthogonal to the vein boundaries. This open-space filling texture suggests hybrid conditions of reactivation of the older Qtz I veins. (i) Small quartz breccia formed between the two generations of quartz veins.
4.1 BFZ300 fault architecture
The studied BFZ300 section is located at a depth of 426 m b.s.l. and is about 8 m long (Fig. 2a). It strikes NNW–SSE and dips very steeply to subvertically to the southwest (Fig. 2b). It cuts through high-grade veined migmatite, interlayered with gneiss and pegmatitic granite. The fault is a strike–slip fault system formed by two main subparallel fault segments connected by a mesoscopic sinistral step-over zone. Subhorizontal striae defined by elongated trails of chlorite grains and kinematic indicators, such as chlorite slickensides (Fig. 2c) and R and R' planes, invariably indicate dextral strike–slip kinematics. The most striking mesoscopic characteristic of BFZ300 is the presence in the fault core of a composite set of almost continuous quartz veins (between 1 and 20 cm in thickness) along the entire exposed strike length. A schematic representation of the fault zone is shown in Fig. 3.
The fault contains a 0.5–2 m thick damage zone separated from the undeformed host rock by two discrete bounding surfaces (YI planes according to Tchalenko, 1970; Fig. 2a). The damage zone can be defined in the field on the basis of the presence of a fractured volume containing sets of conjugate dextral and sinistral hybrid fractures (Fig. 3a) intersecting to form a tight acute angle of ca. 38∘ (Figs. 2b, 3a). Laterally continuous, NNW–SSE-striking Mode I fractures (joints) invariably bisect this angle (Fig. 2b), helping to constrain the stress field orientation at the time of fracture formation, with the greatest compressive stress axis σ1 parallel to the Mode I fracture strike and oriented ca. NNW–SSE. Joints are sharp and have a regular spacing of ca. 10 cm. The joints and the hybrid fractures of the damage zone contain quartz, referred to as Qtz I hereinafter, forming veins up to 1–1.5 cm thick (Fig. 3a). Fractures and faults decorated by Qtz I have a translucent look that reflects the generally fine grain size of Qtz I (< 1 cm, Fig. 3b). Locally they are formed by en echelon tensional segments connected by shear planes not decorated by any quartz infill (Fig. 3b). Joints occur also as barren fractures defining a penetrative sympathetic fracture cleavage (sensu Basson and Viola, 2004; green lines in Fig. 2b). Field evidence also suggests that fracture density within the damage zone tends to increase towards the fault core.
The fault core is bounded by two main discrete slip surfaces (YII; Figs. 2a, 3d, f, h). It contains, and is defined by, two distinct generations of quartz veins (Fig. 3c) that are interrupted and offset laterally by a metric sinistral step-over zone (Fig. 3d–f). The main quartz vein of the core is infilled by quartz exhibiting the same mesoscopic appearance of Qtz I in the damage zone; we therefore refer to it as a Qtz I vein. It is accompanied by a younger, subparallel vein formed by a milky-white type of quartz with a significantly larger grain size than Qtz I (> 1 cm) that we refer to as Qtz II (Fig. 3c). Locally, pockets of cataclasite and breccia formed at the expense of the host migmatitic gneiss are also observed along and between the two veins (Fig. 3g, i). The Qtz II vein exhibits a quite irregular, curved geometry (Fig. 3c, h) and a variable thickness up to a maximum of ca. 20 cm. The minimum Qtz II vein thickness coincides spatially with an apparent lateral displacement of the vein. The BFZ300 core varies in thickness between 20 and 30 cm along most of the exposed fault length but becomes thicker (up to 50 cm) in the compressional step-over zone that connects the two fault segments that are offset laterally by ca. 1 m. The sinistral step-over zone is defined by synthetic T fractures (Fig. 3d, e) and contains a decimetric brecciated lens (Fig. 3d). T fractures are filled by Qtz I veins (Fig. 3e).
Chlorite is present as a secondary phase, with a modal abundance between 5 % vol and 10 % vol in both Qtz I and Qtz II veins. In Qtz I veins it occurs as euhedral–subhedral crystals up to 1–2 mm in size (Fig. 3g). Chlorite is present mostly as a disseminated, interstitial phase concentrated mainly in the internal part of the Qtz I veins (Fig. 3g). In the Qtz II vein, however, it occurs as elongated crystals (5–8 mm in length) arranged perpendicularly to the walls of the vein, which suggests orthogonal dilation at the time of opening (Fig. 3h). The Qtz II vein also contains small (1–2 cm) aggregates of sulfides (sphalerite, pyrite, galena, and chalcopyrite) mainly concentrated in the central part of the vein (Fig. 3g).
As observed in the field, the presence of Qtz I veins along the joints in the damage zone and the continuity of the fault core Qtz I vein suggest Mode I fracturing during Qtz I emplacement (Figs. 2a, 3a, c). The semi-continuous parallelism of Qtz I and Qtz II veins in the fault core, combined with the location of the Qtz II vein along the walls of the Qtz I vein, suggests the partial reactivation of the Qtz I vein during Qtz II emplacement. Dilation leading to Qtz II emplacement exploited and further reworked the Qtz I host-rock contact, which seemingly had a lower tensile strength than the pristine migmatite. The reconstructed time relationship between the two vein generations is also consistent with local evidence of the Qtz II vein partly cross-cutting the Qtz I vein (Fig. 3f).
4.2 BFZ300 microstructural analysis
To constrain the spatial and temporal association of fault rocks and the type of fluid involved in the deformation, several outcrop samples, each representative of a specific structural domain, were collected (TPH-120-2, TPH-120-3, TPH-120-4, TPH-120-5, and TPH-120-6), in addition to samples PH21 and PH22 from diamond drill cores that intersect BFZ300 at the same depth in an area that is currently not excavated. From these samples we prepared 10 petrographic thin sections (samples TPH-120-2, TPH-120-4, TPH-120-6, PH21, and PH22) and 9 doubly-polished sections for fluid inclusion analysis (thickness ∼150 µm; samples TPH-120-2, TPH-120-4, TPH-120-6, PH21, and PH22). Due to the extensive reactivation of the fault zone and the consequent obliteration of the fluid inclusion (FI) record, the FI study was carried out only in samples TPH-120-4, TPH-120-6, and PH21. Hand samples and drill cores localities are shown in Fig. 3.
The microstructural work was carried out on oriented petrographic thin sections cut orthogonally to the migmatitic foliation and parallel to the slickenlines.
In the following we provide a description of the microstructural characteristics of BFZ300 by detailing our findings and observations separately for the main structural domains of the fault zone.
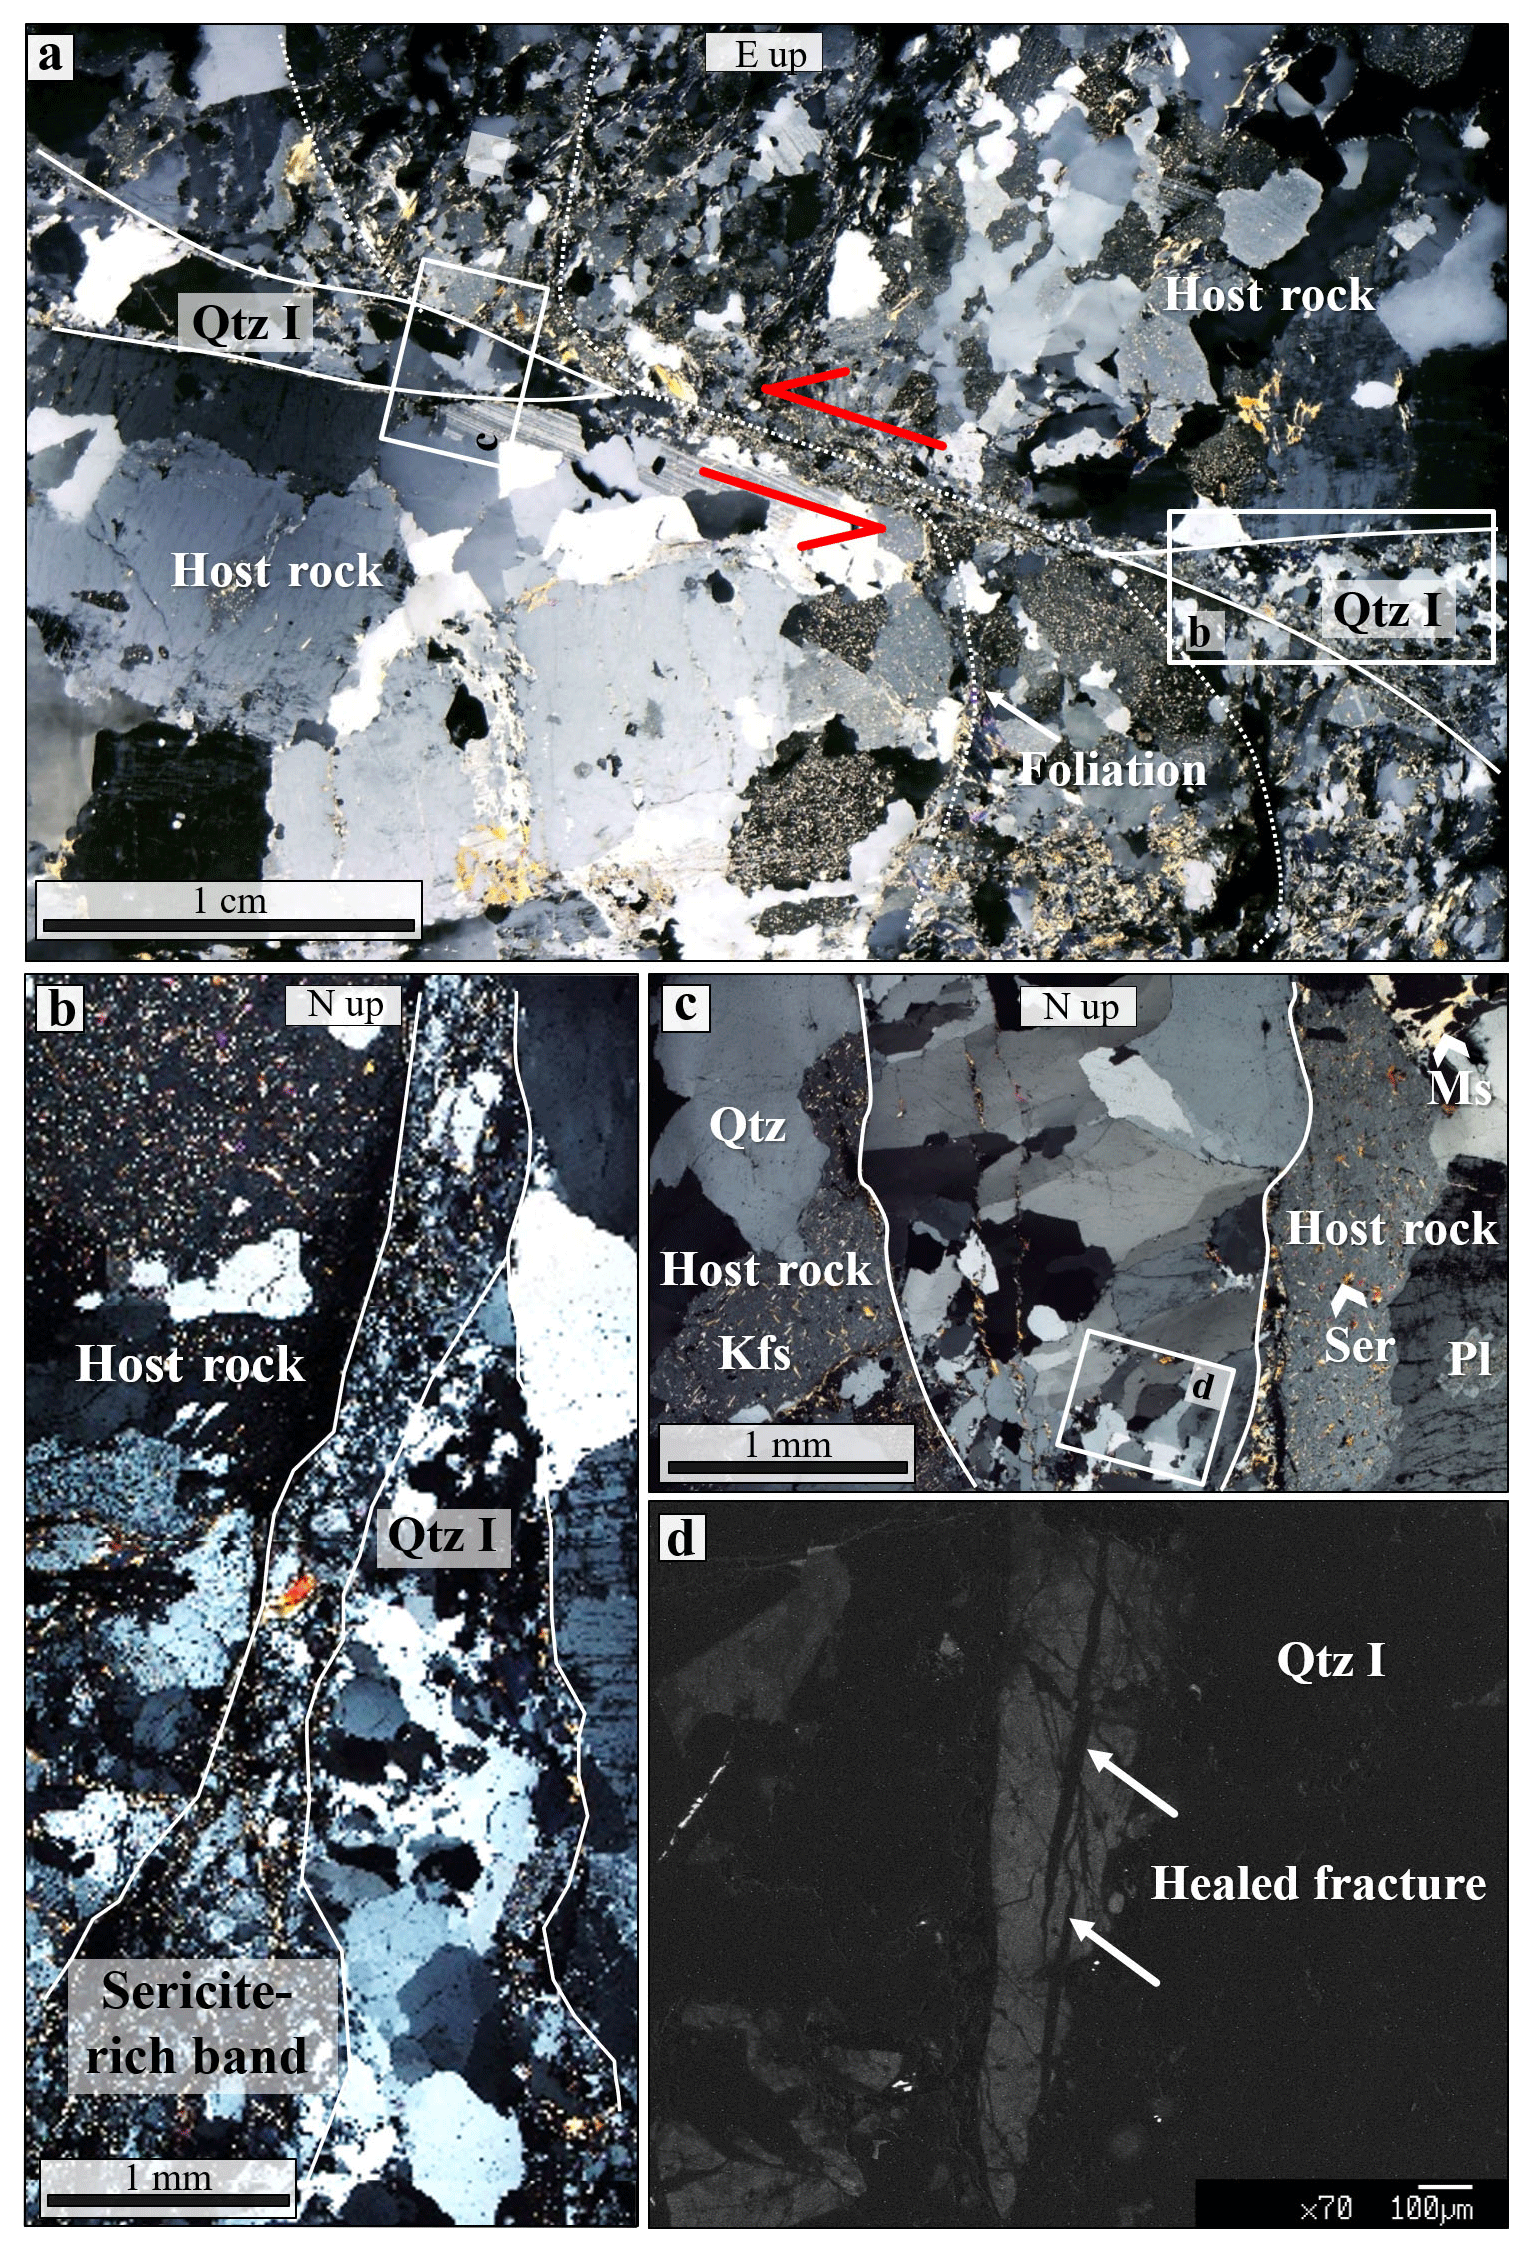
Figure 4Microtextural characteristics of Qtz I from the damage zone of BFZ300 (sample: TPH-120-2). (a) Stitched photomicrographs of a Qtz I vein interconnecting with a sinistral shear band (crossed nicols). Faulting kinematics is suggested by drag folds in the host rock. (b) Tip of Qtz I vein hosted by a sericite-rich cataclastic band of the host rock. (c) Detail of panel (a) showing open-space filling texture in the Qtz I vein. Notice the sericite microfractures cross-cutting Qtz I. (d) Panchromatic cathodoluminescence image of Qtz I showing healed microfractures cross-cutting the crystal.
4.2.1 Damage zone
Qtz I veins within the damage zone cut across the migmatitic host rock and form the infill of conjugate sets of hybrid fractures, which, when studied at the microscale, appear to be formed by dilatant segments joined by cataclastic shear fractures (Fig. 4a). Shearing on the latter is well documented by the asymptotic bending into the shear surfaces of foliation planes formed by the alignment of chlorite and muscovite, both partly altered to sericite and chlorite, respectively (Fig. 4a). Qtz I infilling the tensional segments has an average grain size between 200 µm and 3 mm and exhibits a rather heterogeneous texture, from purely blocky to mixed elongated–blocky (Fig. 4b, c). The largest crystals (800 µm to 1 mm) are elongated and stretched from the vein walls towards the inner part of the vein (Figs. 4c, 5a). At least two episodes of vein growth and renewed dilation, as indicated by the presence of median lines (MLs), are visible within one of the studied veins and confirm a syntaxial growth mechanism for the vein (Fig. 5; e.g. Bons et al., 2012). Medial lines are defined by the alignment of chlorite, sericite, and carbonate aggregates (Fig. 5a, b, d). Blocky euhedral quartz crystals are also found varying in grain size between 300 and 600 µm. These crystals are juxtaposed against very-fine-grained quartz (< 200 µm) within sericite-rich cataclastic bands (Fig. 4b). These cataclasites contain also hydrothermally altered host-rock fragments including pervasively altered K-feldspar-bearing lithic fragments and phyllosilicates.
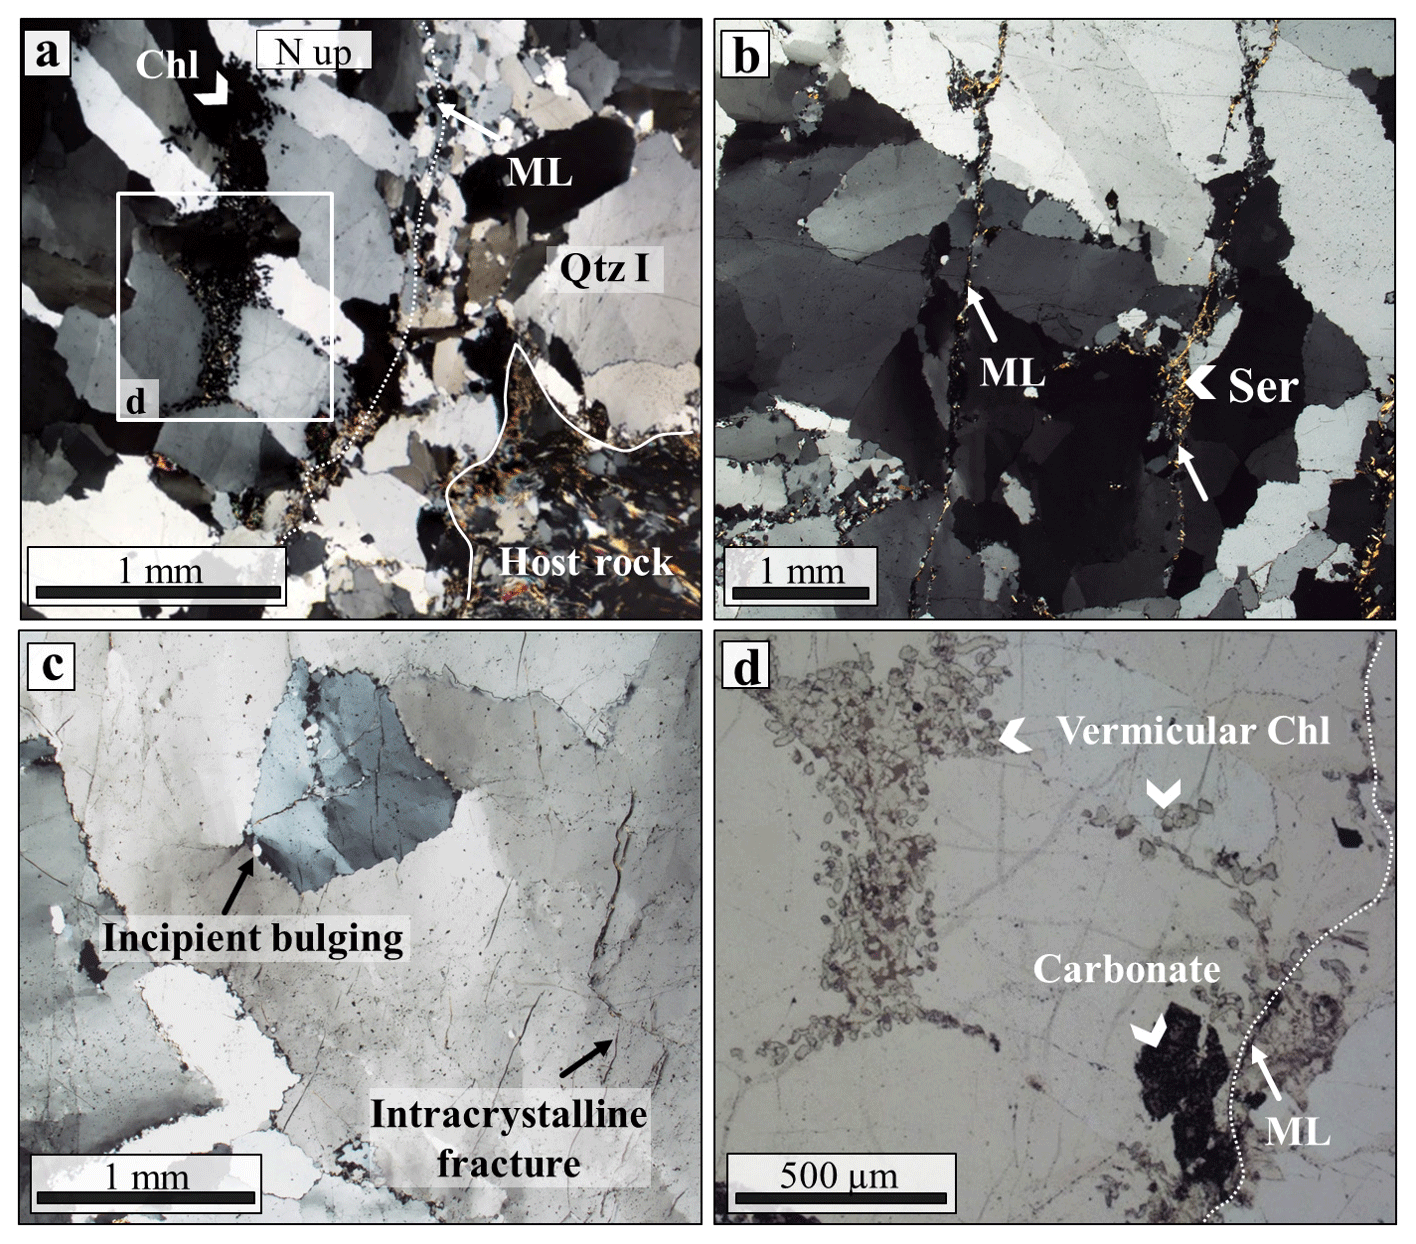
Figure 5Microtextural characteristics of Qtz I from the damage zone of BFZ300 (samples PH21 and TPH-120-2). (a) Stitched microphotographs of a Qtz I vein showing elongated–blocky texture with crystals growing obliquely with respect to the vein boundaries, which suggests growth under oblique dilatation. A series of median lines (MLs) are marked by (b) sericite crystals suggesting repeated crack and seal. Quartz crystals show low-temperature crystal–plastic deformation by undulose extinction and extinction bands. (c) Detail of plastic deformation in damage zone quartz veins: distorted crystals showing incipient bulging and intracrystalline fracturing. (d) Detail (plane-polarized light) of an ML and secondary fractures both decorated by vermicular chlorite and aggregates of rare-earth-element-bearing carbonate.
With the exception of the blocky variety, Qtz I crystals exhibit various degrees of crystal–plastic deformation and recovery. They contain widespread evidence of undulose extinction and extinction bands (Fig. 5b), and incipient bulging along grain boundaries is also evident (Fig. 5c). Millimetric intracrystalline barren fractures are also recognized (e.g. Fig. 5c). Cathodoluminescence imaging of Qtz I from the damage zone also shows the presence of a dense network of healed quartz microfractures (Fig. 4d), which demonstrates healing subsequent to brittle deformation and fracturing.
Chlorite occurs along the ML of the veins, secondary cracks, along grain boundaries, and as inclusions within quartz crystals. It has a vermicular texture (Fig. 5d) and crystal dimensions up to 50 µm.
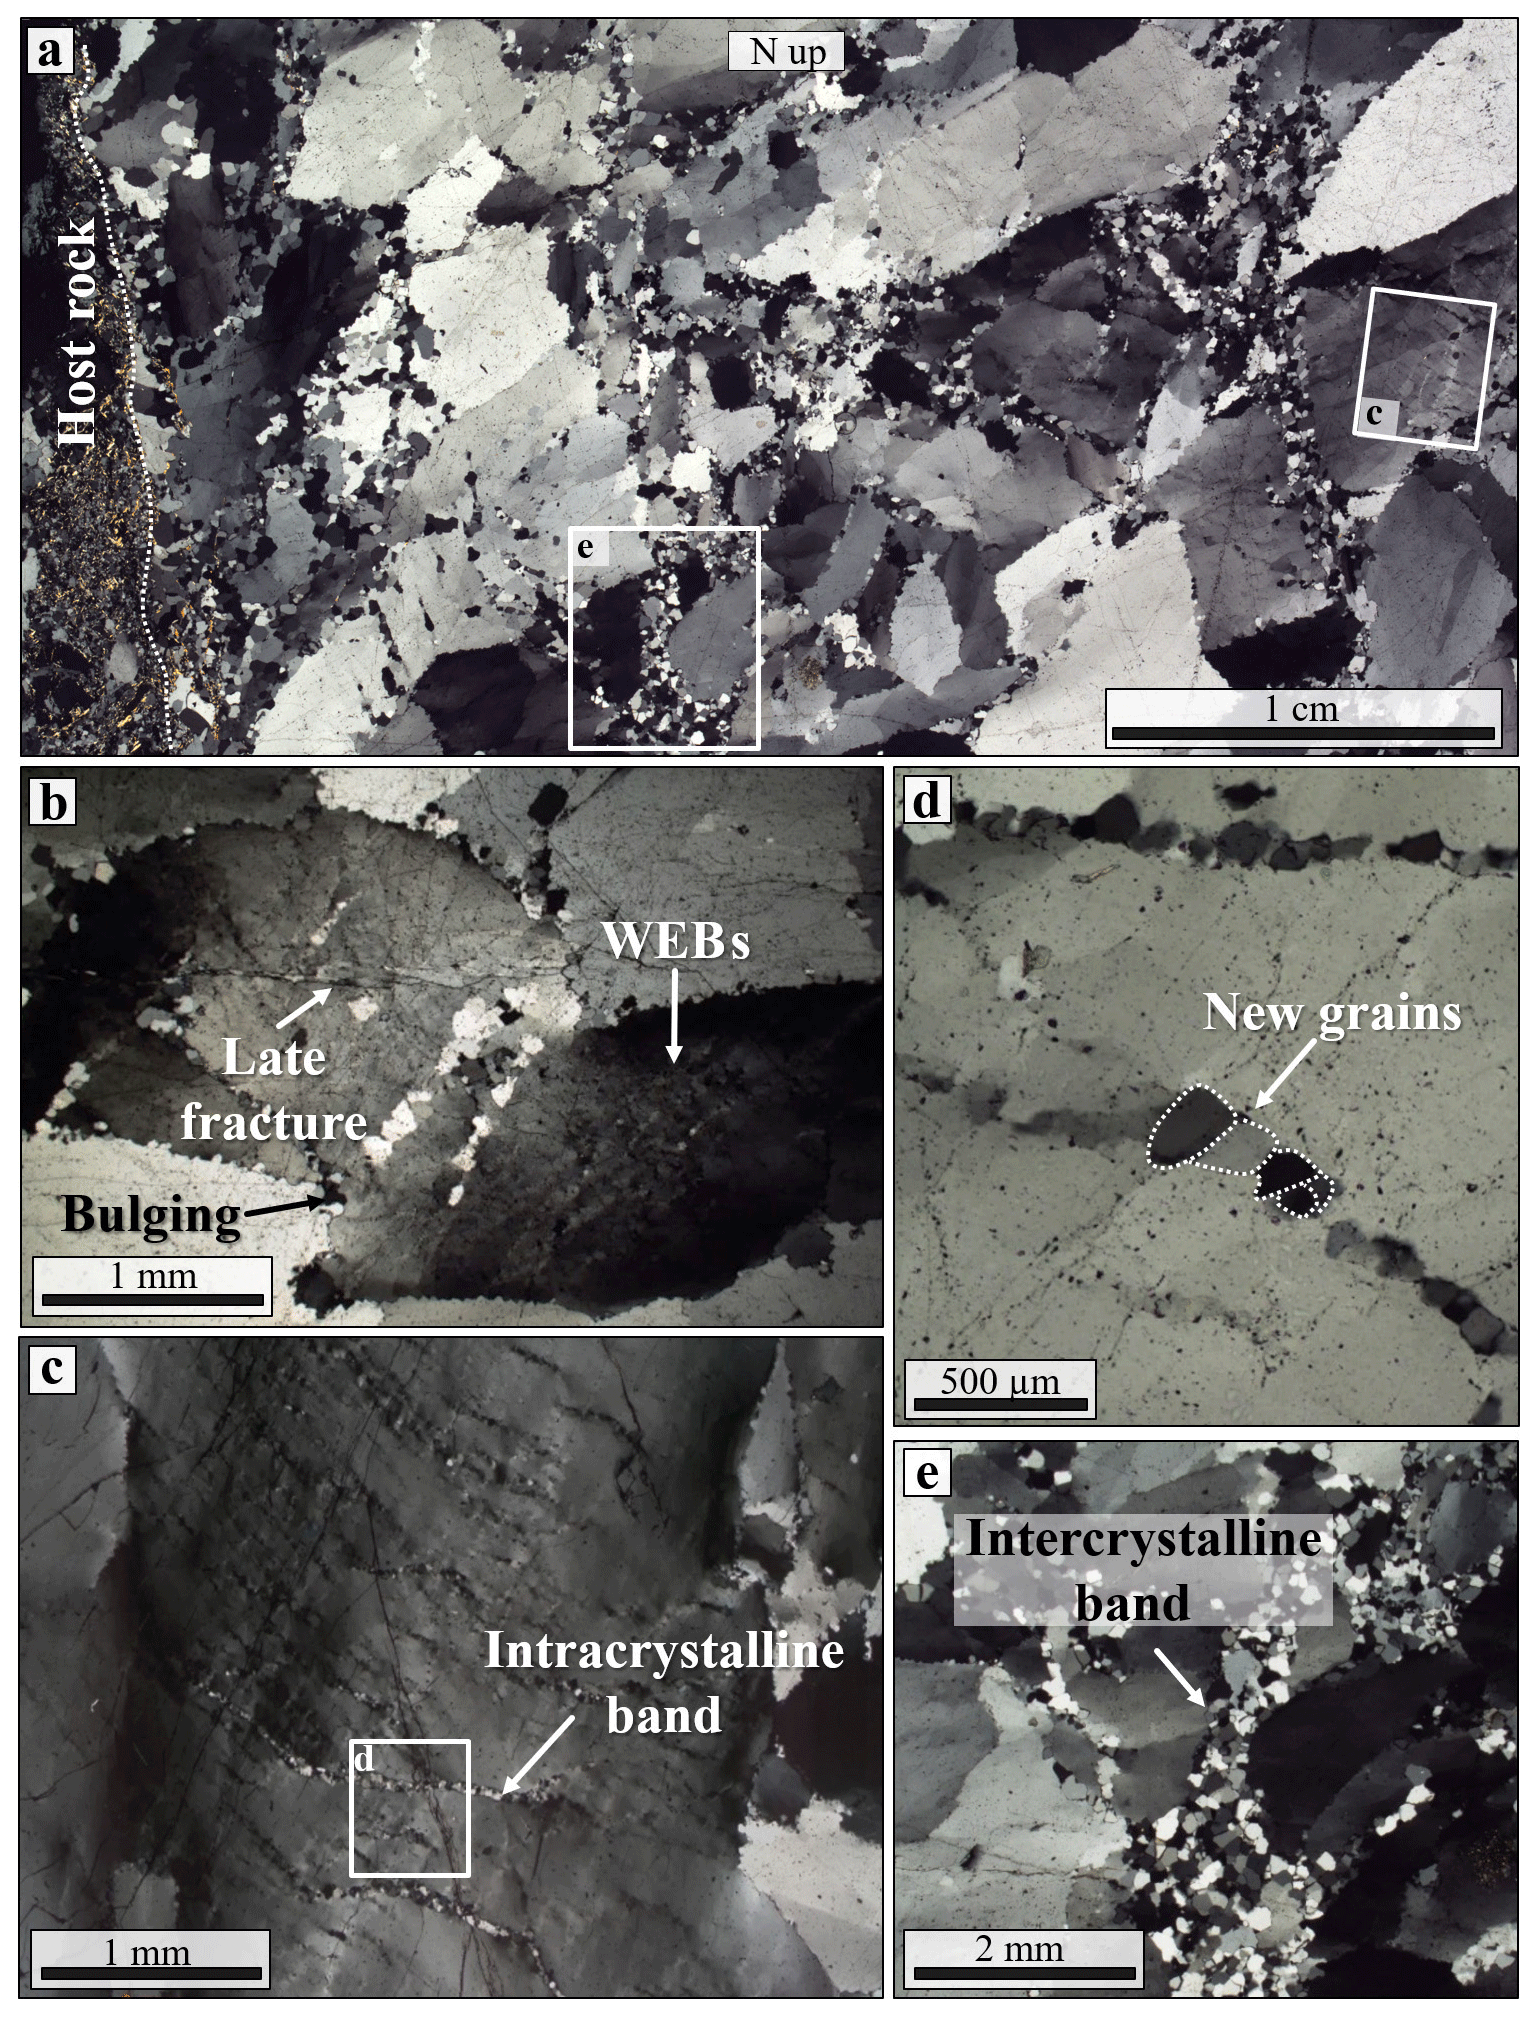
Figure 6Microtextural characteristics of Qtz I from the BFZ300 core (sample TPH-120-4). (a) Stitched photomicrographs showing the typical heterogeneous grain size of Qtz I (30–800 µm). (b) Evidence of plastic deformation of Qtz I from the fault core given by bulging of the largest crystals, wide extinction bands, and undulose extinction. Note the late brittle fractures cross-cutting all the previously formed plastic features. (c) Intracrystalline deformation bands within a large crystal. (d) Detail of (c) showing the typical grain size of the band (50–250 µm). Intracrystalline deformation bands are oriented at < 30∘ with respect to the BFZ300 vein walls and can be up to 2 mm in length. (e) Intercrystalline deformation band showing a thickening at the triple junction of larger grains. These intercrystalline bands are parallel to the strike of BFZ300.
4.2.2 Fault core
In the fault core, Qtz I grain size reaches the smallest observed value (range: 30–800 µm; Fig. 6a), although it is strongly variable within the vein, suggesting the presence of heterogeneous and complex structural sub-domains. The earliest post-vein emplacement deformation stage is reflected by the low-temperature, intracrystalline deformation of the largest crystals (400–800 µm in size). Undulose extinction, wide extinction bands (WEBs; Derez et al., 2015), and bulging along grain boundaries are the most common microstructures ascribable to this deformation stage (Fig. 6a, b). A first brittle deformation event is documented by narrow, intracrystalline fractures that cross-cut the largest quartz crystals (Fig. 6c) and which locally contain new grains of quartz ranging in size between 20 and 100 µm (Fig. 6d). In more detail, these new grains form parallel bands that are oriented at a low angle (< 30∘) to the vein walls and that can be up to 2 mm in length and 200 µm in thickness. Plastically deformed Qtz I crystals hosting these intracrystalline bands of new grains are cut across by another later set of subparallel intercrystalline fractures, which are interpreted as the expression of yet another deformation event that occurred under overall brittle conditions. These fractures are parallel to the strike of BFZ300 and are in turn sealed by partly recrystallized new quartz grains (grain size: 50–150 µm; Fig. 6e). The cathodoluminescence imaging of these fractures shows that they are sealed, yielding a homogeneous dark signal (Fig. S1 in the Supplement). They are locally decorated by trails of fluid inclusions (Fig. S2a, d) and can be up to 2.5 cm in length and up to 500 µm in width (Fig. 6a). EBSD maps were acquired along some of these intercrystalline bands, and results suggest that the new grains sealing the fractures reflect the combined effect of initial cracking, grain nucleation, and subsequent partial dynamic recrystallization (Fig. S2b, c).
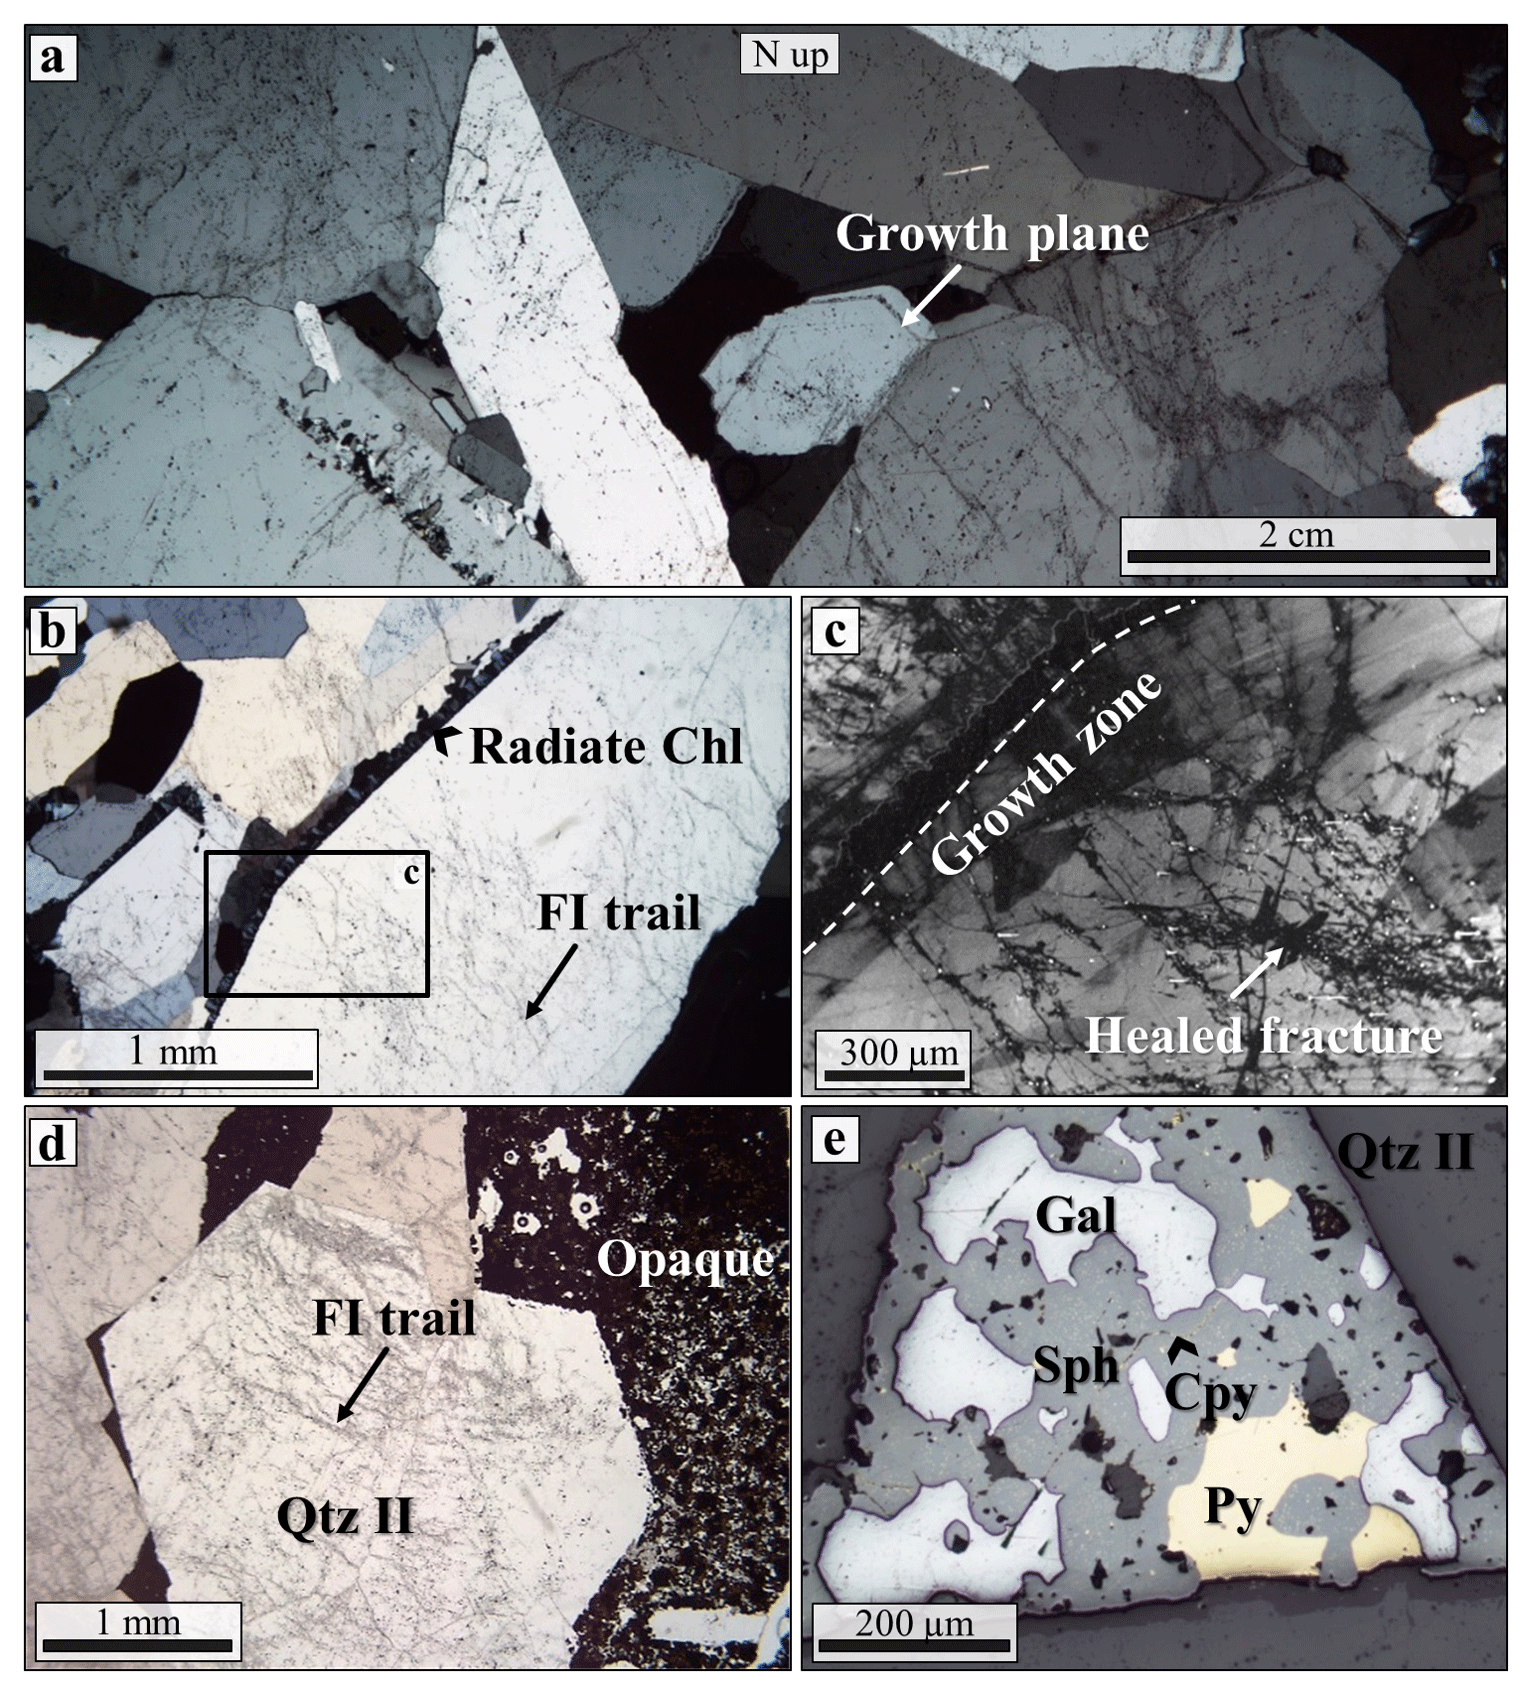
Figure 7Microstructural characteristics of Qtz II from BFZ300 (samples TPH-120-6, PH22). (a) Stitched photomicrographs of Qtz II vein from the fault core. Notice the coarse quartz crystals and their elongated–blocky texture. Primary growth textures are sometimes visible and are marked by solid inclusions and decrepitated FIAs. (b) Radiate chlorite crystals along a prismatic Qtz II crystal boundary. Note that Qtz II is cross-cut by numerous trails of FIs. (c) Panchromatic cathodoluminescence image of the same large Qtz II crystal from panel (b), showing radiate chlorite along the crystal boundary and a primary growth zone cut by a set of healed fractures. (d) Euhedral quartz crystals set within opaque phases and cross-cut by a network of thin microfractures. (e) Reflected-light photomicrograph showing the opaque mineral assemblage typically associated with Qtz II, i.e. subhedral to anhedral sphalerite, pyrite, and galena. Chalcopyrite is a minor phase and occurs as small round inclusions within sphalerite (chalcopyrite “disease”) or as large subhedral–anhedral masses together with galena.
Qtz II within the fault core is typically coarse grained (individual crystals: 300 µm–1 cm in size) and exhibits a regular blocky texture devoid of any shape or crystal preferred orientation (Fig. 7a). Locally, these large crystals display primary growth textures, such as primary FIAs oriented parallel to specific crystallographic planes. With the exception of undulose extinction, Qtz II does not show clear evidence of plastic deformation, although cathodoluminescence imaging of optically continuous Qtz II has also shown that a dense network of healed quartz microfractures locally cross-cuts Qtz II crystals (Fig. 7c). These are relatively thin (hundreds of micrometres thick) networks that are poorly visible to invisible by standard petrographic analysis. The only petrographic evidence for these healed microfractures within quartz is represented by well-defined trails of fluid inclusions cross-cutting primary growth bands (Fig. 7d).
Chlorite is the second most abundant phase within the fault core Qtz I and Qtz II veins and occurs with a variety of textures. Aggregates of vermicular chlorite similar to that occurring in the damage zone are also present in Qtz I from the core (Fig. 8e), although chlorite with flaky and radiate textures (Fig. 8f) is also present. The latter is generally 100–300 µm in size and is in textural equilibrium with quartz and rare calcite. Radiate chlorite overgrowing fractured Qtz II (Fig. 7b) suggests late Qtz II precipitation.
Associated with Qtz II, a sulfide assemblage made of pyrite, sphalerite, galena, and chalcopyrite (Fig. 7d, e; see also Fig. 3g) forms aggregates that are commonly located along quartz grain boundaries. These aggregates have dimensions between 10 and 600 µm.
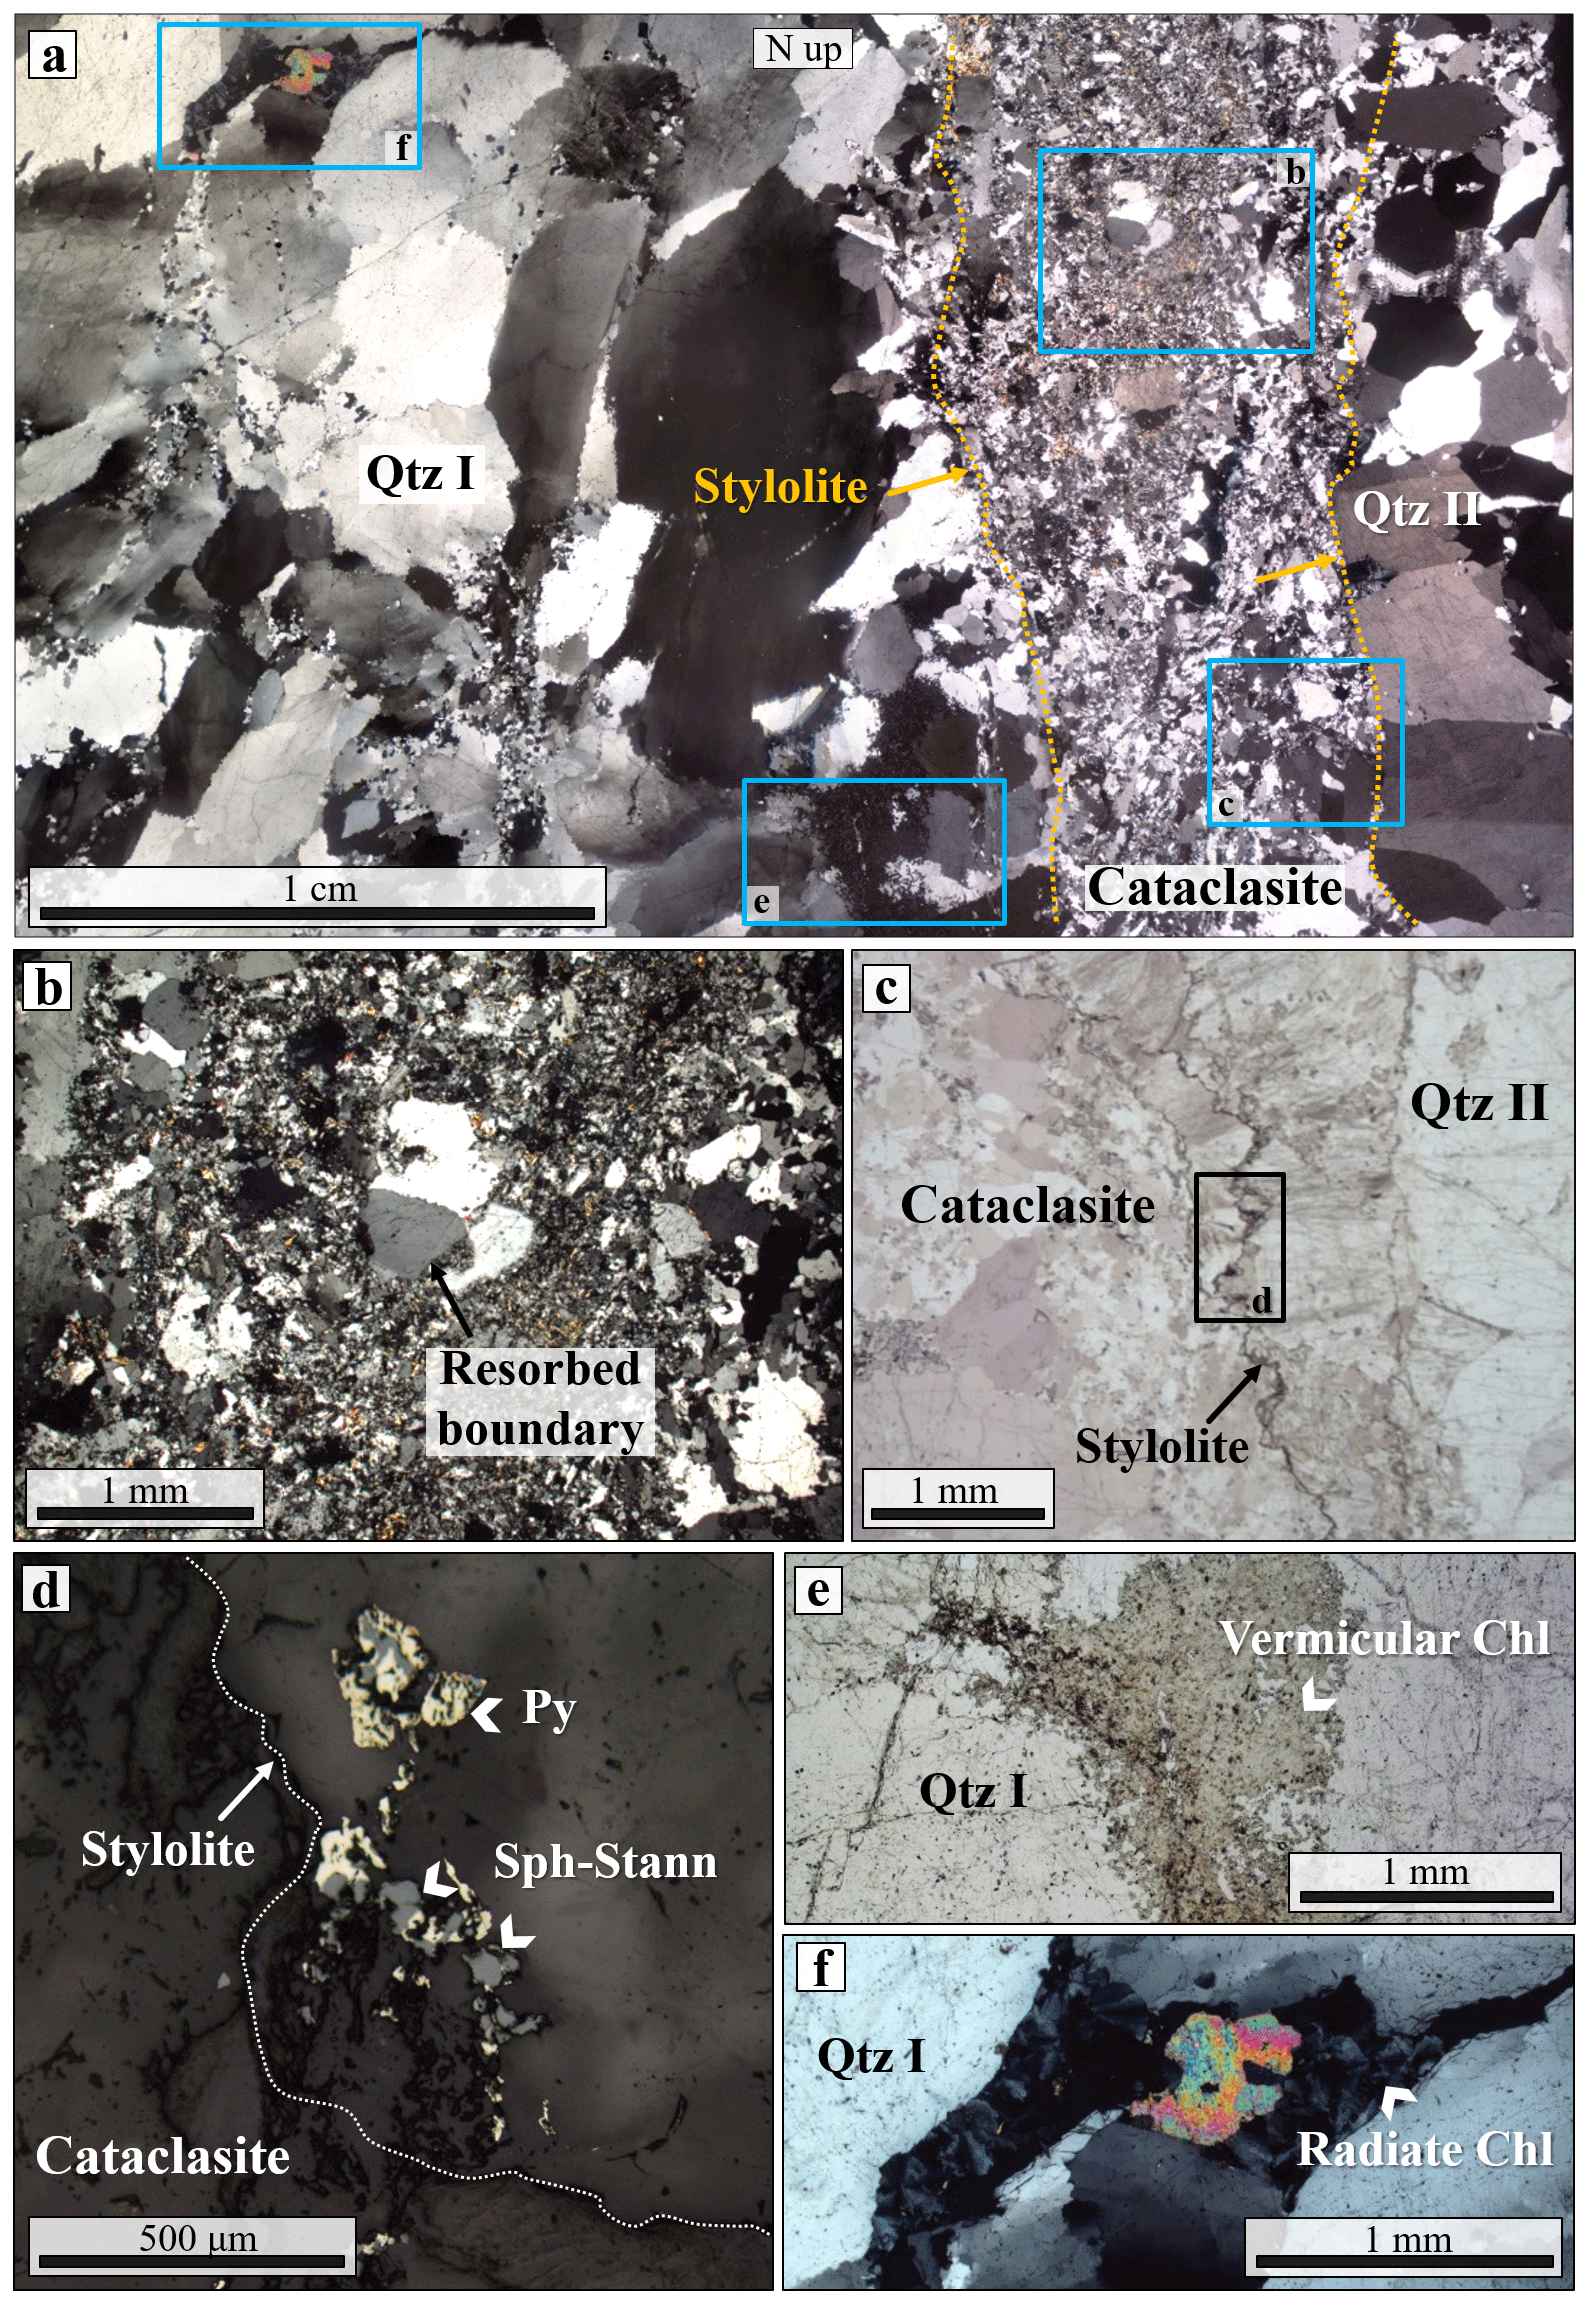
Figure 8Microstructures of the cataclasite juxtaposing Qtz I and Qtz II veins (sample TPH-120-4). (a) Stitched photomicrographs covering the contact between the two quartz veins and the intervening 5 mm thick cataclastic band. (b) Cataclastic band containing large Qtz I fragments (8–12 mm) embedded within a finer matrix (20–200 µm in size) of sericite and recrystallized quartz. The largest crystals show lobate boundaries, suggesting dissolution and local resorption along the clast–matrix interface. (c) Stylolite seams at the boundary of the cataclasite that strike parallel to the BFZ300. (d) Reflected-light photomicrograph showing anhedral to subhedral pyrite, chalcopyrite, stannite, and sphalerite arranged along the stylolite as residual products of pressure solution. (e) Vermicular and radiate (f) chlorite aggregates associated with Qtz I close to the cataclastic band.
Multiply reworked breccias and cataclasites occur within and cross-cut BFZ300. In the studied sections, a cataclastic band between 5 and 8 mm thick cross-cuts both Qtz I and Qtz II veins (Fig. 8a), but it is in turn cross-cut by a different quartz–radiate–chlorite vein displaying evidence of syntaxial growth. This cataclasite contains poorly sorted and angular quartz clasts between 8 and 12 mm in size set in a finer (20–200 µm in size) white mica–quartz matrix. The largest quartz fragments show irregular, lobate grain boundaries and are affected by undulose extinction. We interpret these textures as the product of dissolution and cataclastic reworking of Qtz I
Parallel sets of stylolitic seams trend ca. N–S, parallel to the strike of BFZ300, and mark the two sides of the cataclastic band (Fig. 8a, c). They host anhedral sphalerite, stannite, galena, pyrite, and chalcopyrite (Fig. 8d), which are coeval with the formation of the Qtz II vein. We interpret the presence of these anhedral sulfide minerals along the stylolite as the product of passive concentration by pressure solution.
Table 1Schematic summary of main microstructures, fluid properties, and P–T deformation conditions in the quartz veins of the BFZ300 fault.

Note: microstructures are coupled with the corresponding FI types and P–T constraints derived from the collected dataset. See text for a further explanation. Note that we combine structural and geochemical data to constrain the relationships between stages of mineral-scale deformation and fluid circulation, which in turn defines the relative chronology of stages of fluid flow during faulting. ML: median line; Blg: bulging.
4.3 Fluid inclusion data
4.3.1 Fluid inclusion petrography
The studied FIAs invariably contain a two-phase fluid (liquid–vapour) and are mainly arranged in secondary trails within Qtz I crystals in the damage zone (Type S1) and also within Qtz I fault core, where they form dismembered (Type S2) trails and also appear as individual clusters inside the crystals affected by crystal–plastic deformation (Type S3). Within Qtz II, FIAs are arranged as pseudosecondary (Type PS) and secondary (Type S4) trails. Representative examples of FI petrographic features are shown for each structural domain in Fig. 9. Table 1 provides a schematic representation of the location of the FI types, in addition to their location within the fault architecture and their fluid properties.
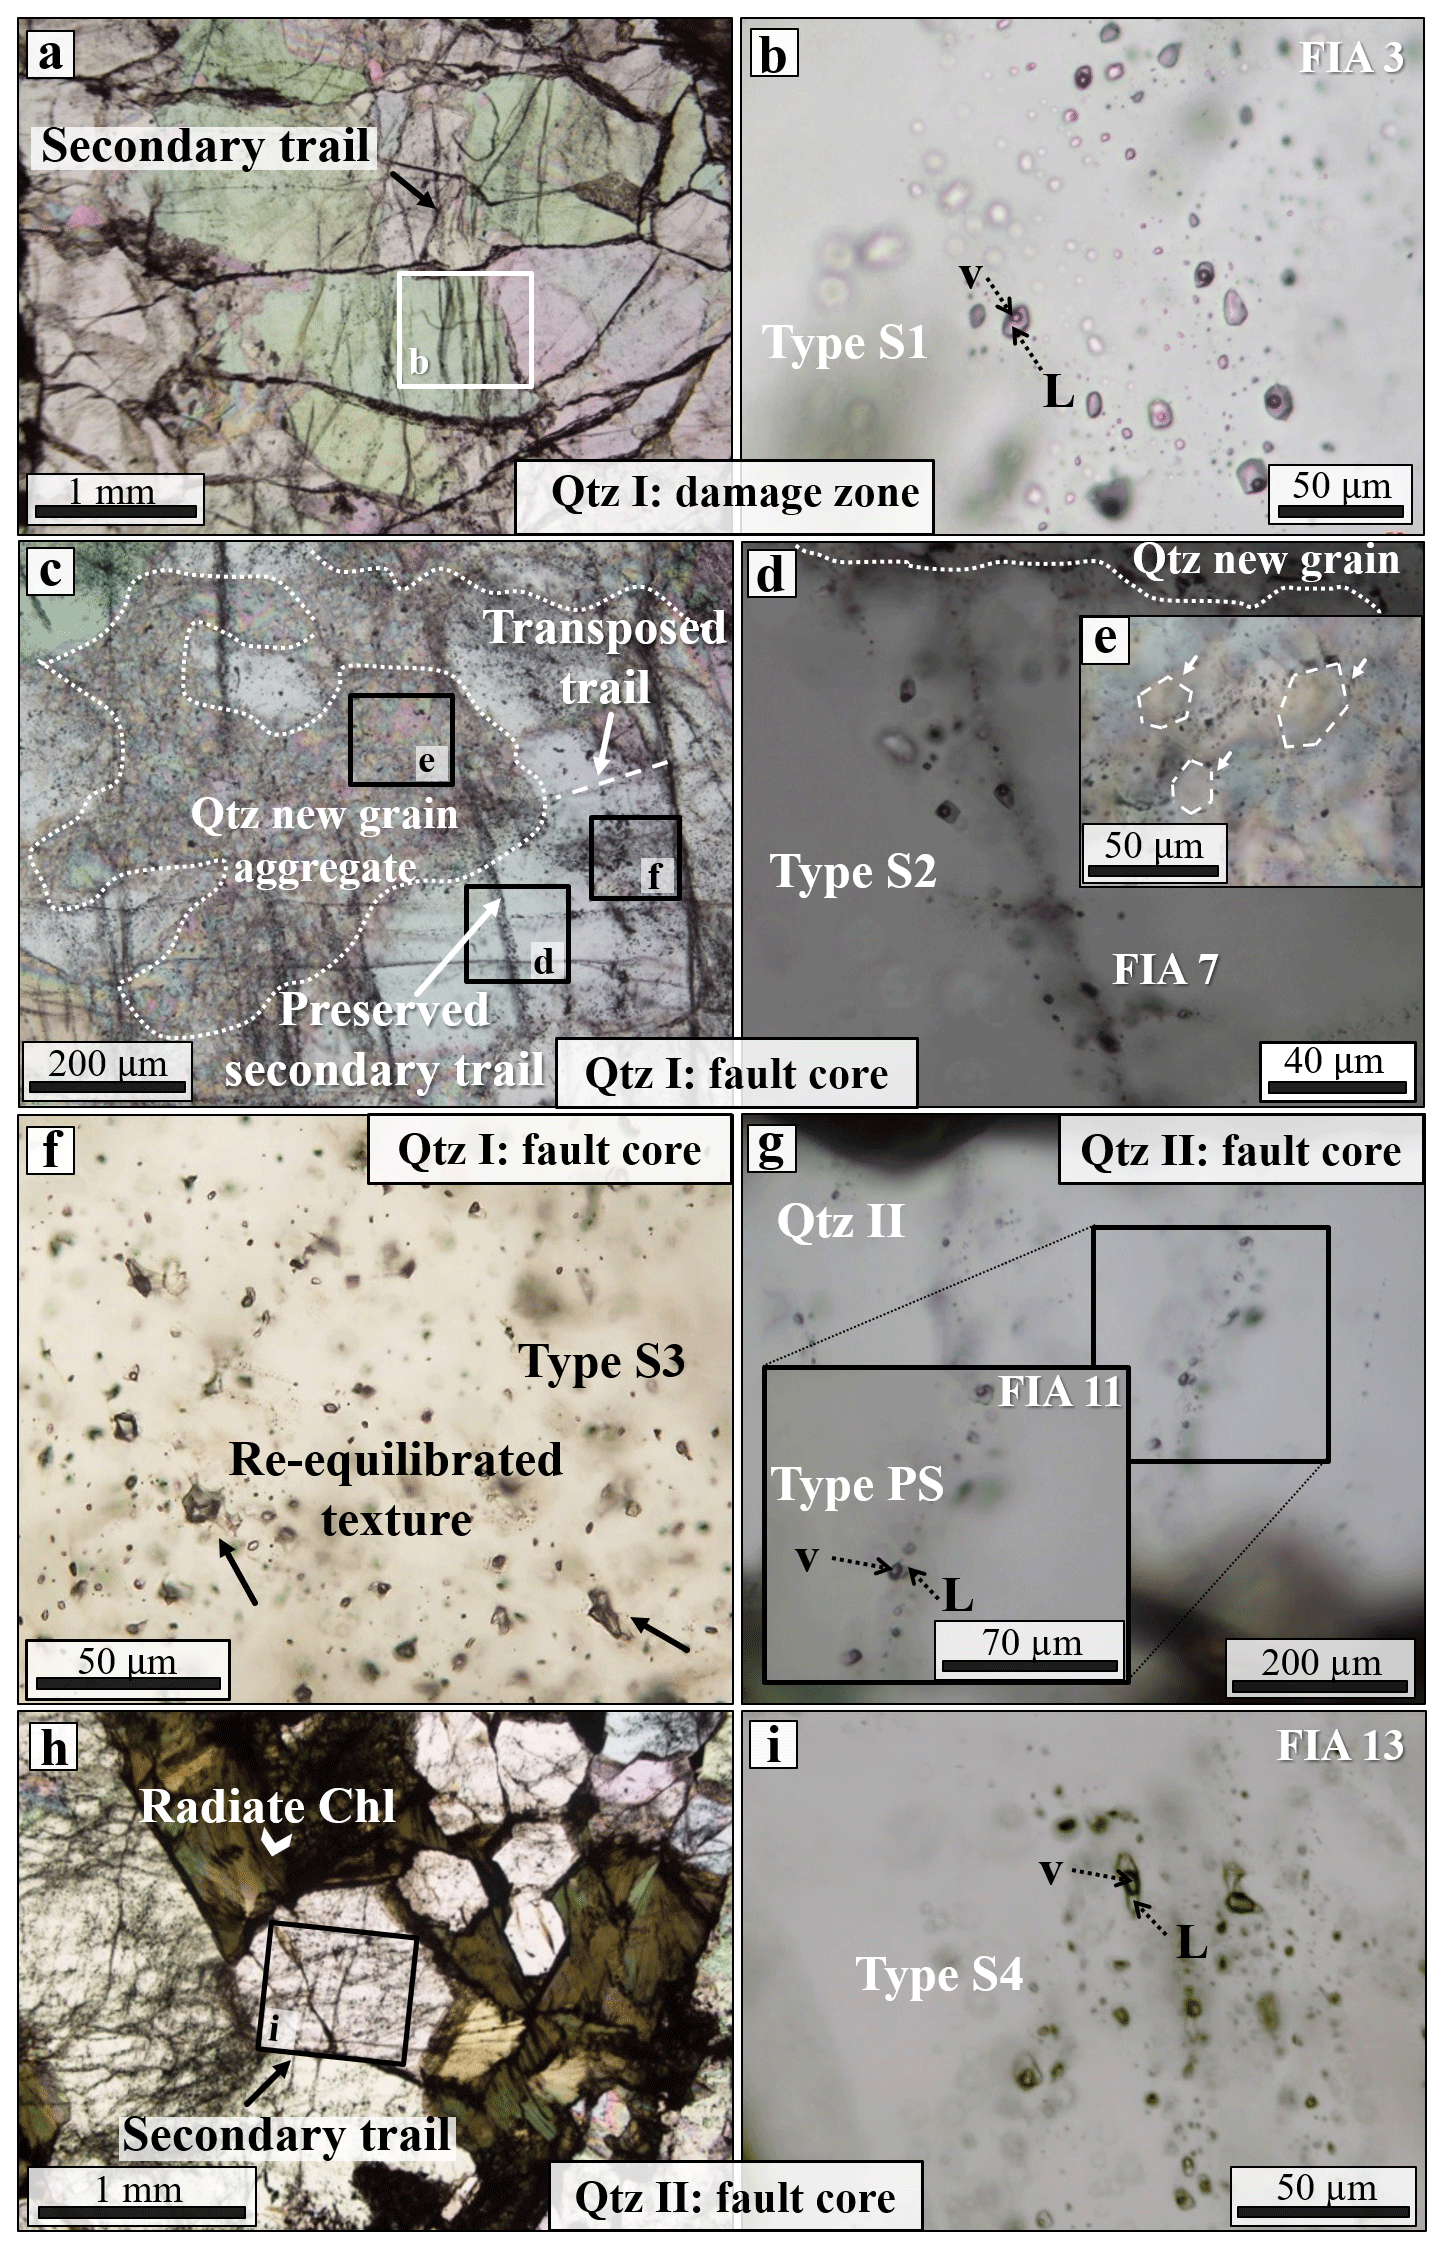
Figure 9Characteristic textures of FIAs hosted within the BFZ300 quartz (samples PH21, TPH-120-4, TPH-120-6). (a) Secondary trails cross-cutting large Qtz I crystals of the damage zone. (b) Detail of (a) showing the phase ratios of one of the studied secondary assemblages (FIA 3), most representative of Type S1 FIA. (c) Long secondary transgranular trails cross-cutting Qtz I of the fault core, dismembered by intercrystalline fractures, infilled by quartz new grains. Qtz I fault core also hosts a set of short sub-trails developed at a high angle with respect to the long trails. (d) Detail of Type S2 FIA entrapped along a preserved secondary fracture trail. (e) Small inclusions (< 1 µm) arranged along the boundaries of new polygonal quartz. (f) Example of Type S3 FIA arranged as isolated clusters inside ductile-deformed fault core Qtz I. These trails formed during a brittle deformation stage that predates ductile re-crystallization. (g) Pseudosecondary FIA associated with Qtz II chlorite (FIA 11). The enlargement shows the phase ratio details. (h) Small-scale view of secondary FIAs cross-cutting Qtz II. (i) Detail of secondary trails cross-cutting euhedral Qtz II (FIA 13). In all photographs north points up.
Damage zone. Within Qtz I grains (Fig. 9a, b), secondary FIAs are found as trails (Fig. 9a) that parallel what we interpret as healed, old microfractures. In these assemblages, FIs have a maximum size between 2 and 20 µm, a regular equi-dimensional shape (i.e. negative crystal morphology), and a volume fraction, ϕ (, see Sect. 3), ranging between 5 and 15 % (Fig. 9b).
Fault core. Qtz I grains host secondary FIAs (Type S2), which are transgranular trails (Fig. 9c) along healed joints and hybrid fractures. These trails are locally interrupted and dismembered by aggregates of new, fine-grained quartz grains (Fig. 9c) and generate a texture that is indeed typical of Qtz I from the fault core (Fig. 6a). Fluid inclusions vary in size between 1 and 10 µm, have a ϕ of 10 %–20 %, and show a negative crystal morphology (Fig. 9d). Fluid inclusions are also found as isolated clusters inside intensely recrystallized quartz domains (Fig. 9c). FIAs inside these recrystallized quartz domains were pervasively obliterated during later episodes of ductile deformation. The development of WEBs, intercrystalline bands, and bulging resulted in the remobilization (i.e. “transposition” sensu Anderson et al., 1990) of these assemblages. This is regularly observed and is documented, for instance, by the presence of short, secondary trails of regularly shaped inclusion oriented at a high angle with respect to a longer parent trail (Fig. 9c). Morphologically, these trails resemble the transposed trails documented in high-grade metamorphic rocks (Andersen et al., 1990; Van den Kerkhof et al., 2014). Different types of fluid inclusion morphologies are found within the intensely recrystallized quartz domains (Fig. 9f). Negative crystal morphology is observed in some areas of the selected samples, but it is uncommon. The “dismembered” morphology is instead more typical (Vityk and Bodnar, 1995; Tarantola et al., 2010), and is observed in the relatively large inclusions (> 20 µm). This morphology is made of a central (often empty) inclusion, showing several tails and re-entrants, surrounded by three-dimensional clusters of small “satellite” inclusions. These clusters might be arranged with a quasi-planar geometry inside the host (i.e. in a trail-like fashion). Another typical texture found in most assemblages is the “scalloped” morphology of small- to medium-sized inclusions (< 10–15 µm), which is defined by the presence of indentations, embayments, irregularities, and sharp tips of the inclusion walls (Fig. 9f). Small inclusions (< 1 µm) are also found at the edge of the straight, regular boundaries of new quartz grains; they are mostly dark, i.e. they are vapour-rich or empty, and are equant in shape (Fig. 9e). Although small inclusions do not allow for a microthermometric study of the fluid-phase behaviour in this structural domain, they confirm the complex reactivation history of BFZ300.
Qtz II contains both pseudosecondary (Type PS) and secondary (Type S4) assemblages (Fig. 9g, i, h). The first type is arranged in trails that cut at a low angle the hosting quartz but not the neighbouring phases (e.g. chlorite). In these assemblages, FIs are relatively large (2–45 µm) and exhibit an elongated shape and ϕ values between 15 % and 30 % (Fig. 9g). Type S4 FIAs (Fig. 9h) host two-phase inclusions whose size (5–35 µm) is similar to that of PS trails but show a ϕ between 30 % and 40 % (Fig. 9i).
Primary FIAs are also present along growth planes of Qtz II, where they have a relatively large size (20–50 µm; Fig. S3a, b, c). They present irregular and dismembered textures, which suggest intense post-entrapment re-equilibration.
In summary, our microtextural study shows that the FIAs to be selected for the microthermometric study are only those hosted within Qtz I and Qtz II crystals with little to no recrystallization and whose inclusions have textures corresponding to the least intense post-entrapment re-equilibration (Bodnar, 2003b, and references therein; Tarantola et al., 2010). These are the pseudosecondary and secondary FIAs in which dendritic or transposed inclusions are absent and in which the host quartz exhibits only undulose extinction (S1, S2, S4, and PS).
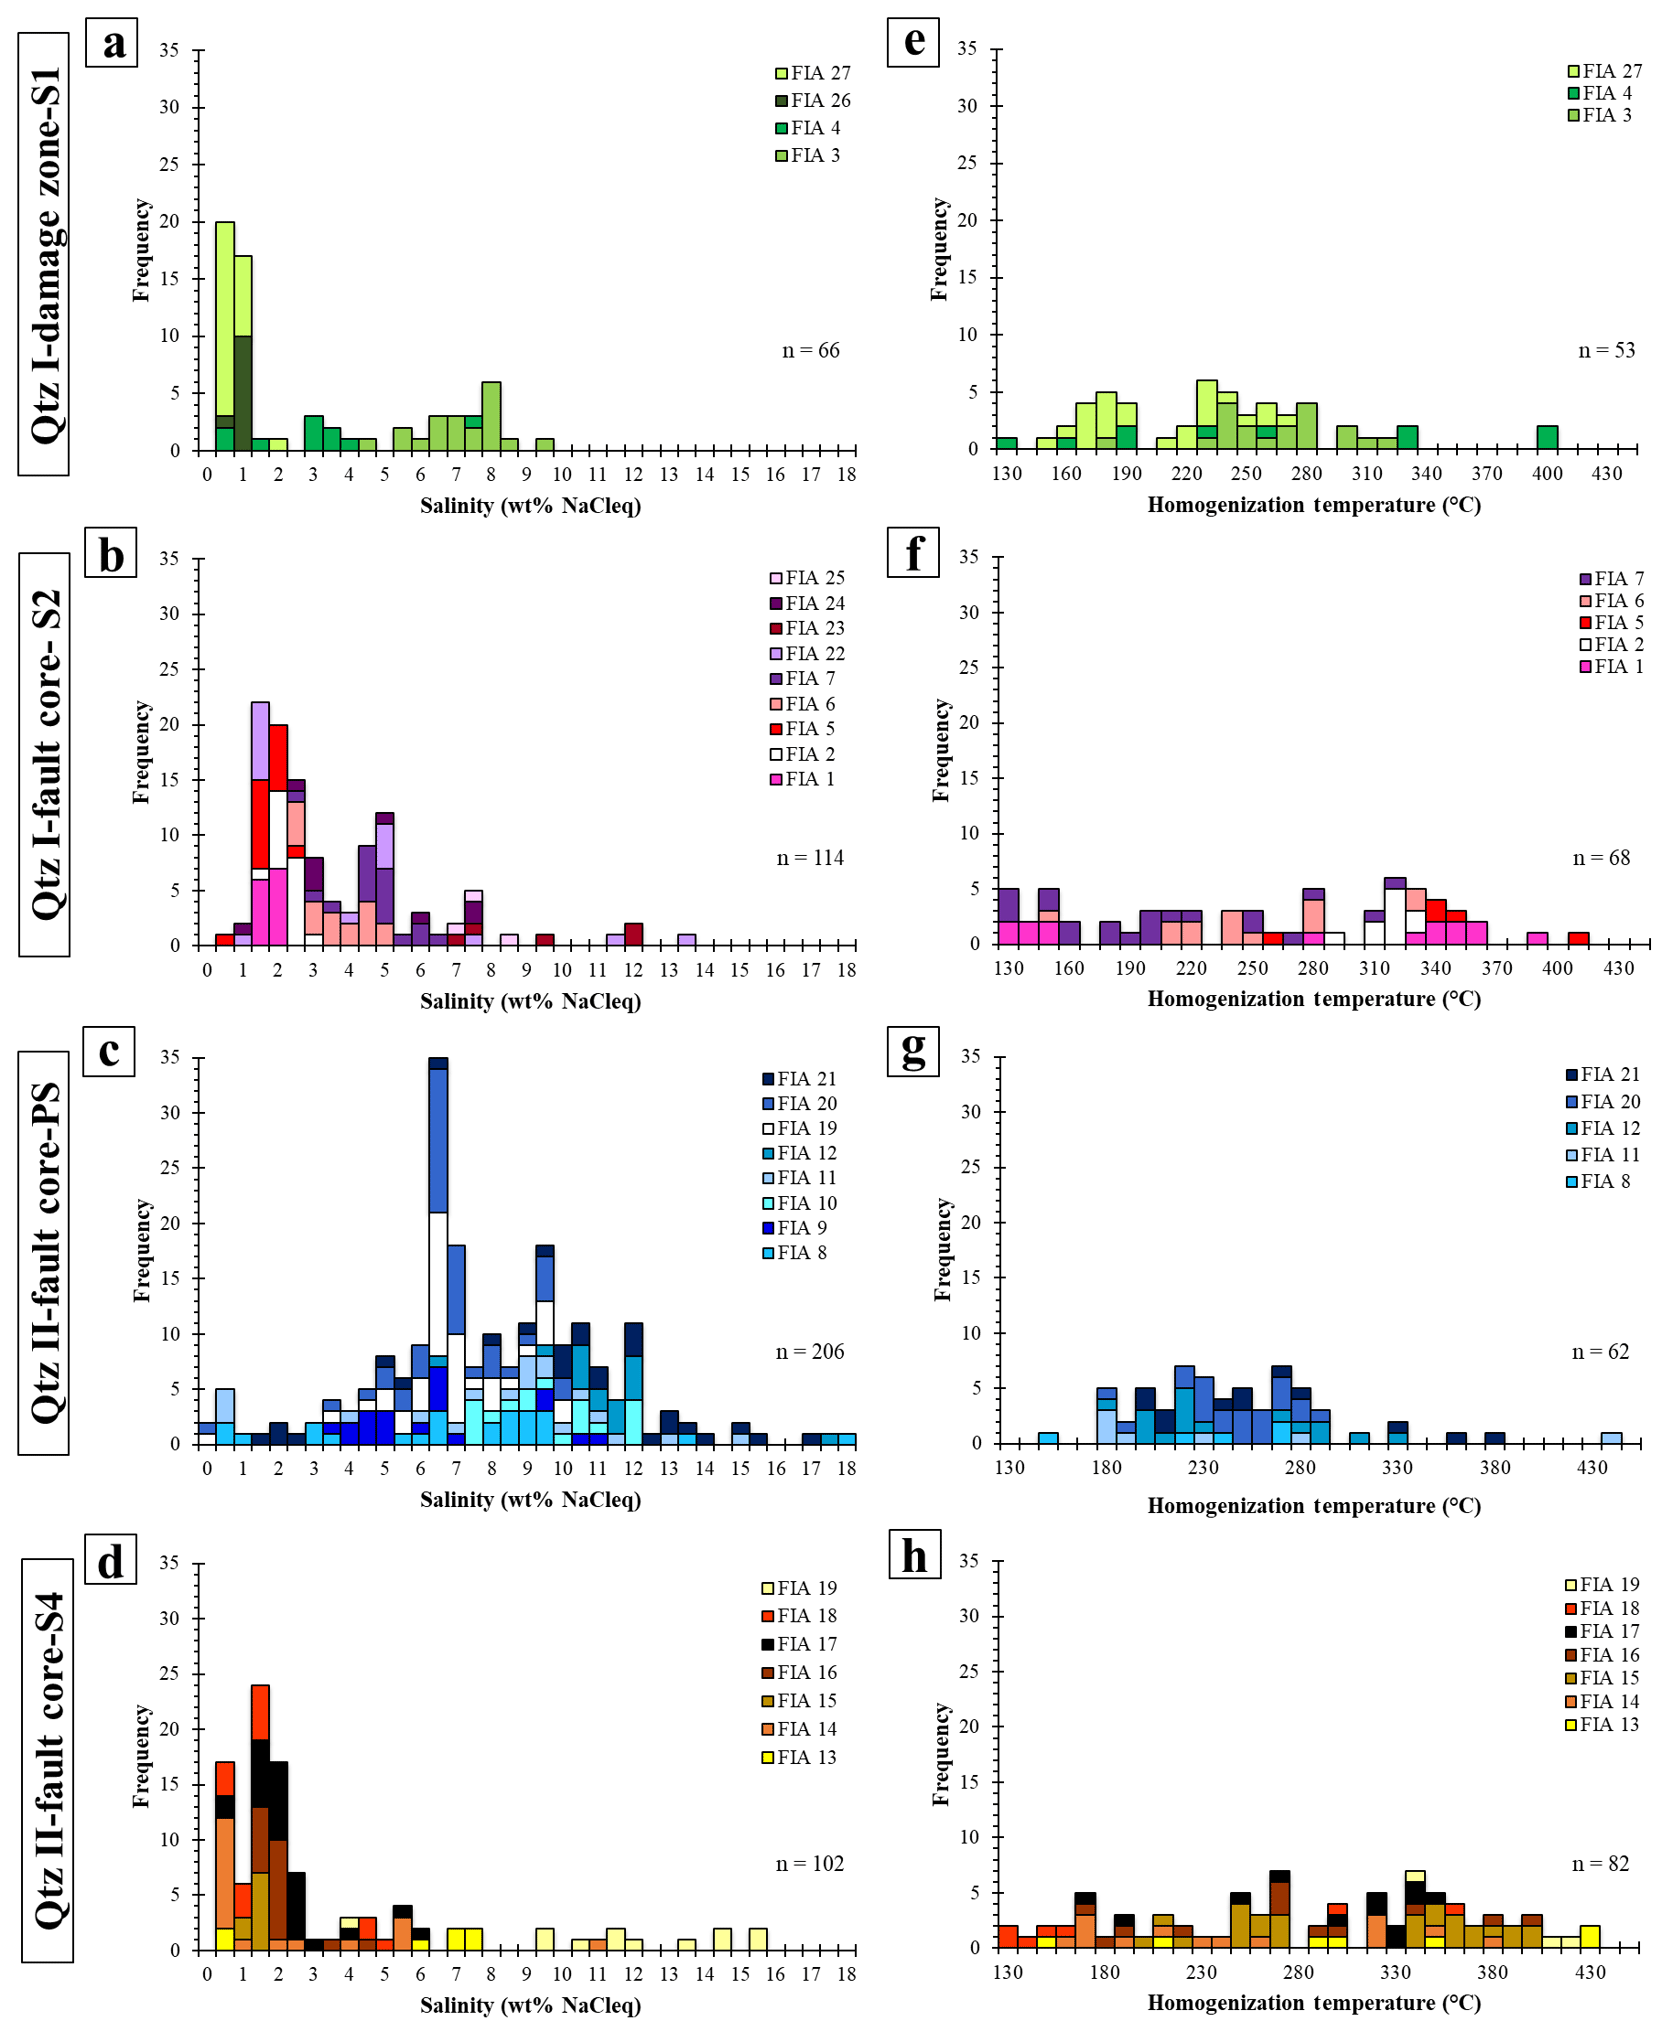
Figure 10Microthermometric data of the studied FIAs. Panels (a)–(d) show the bulk salinities of individual FIAs calculated from the Tmice data, while panels (e)–(h) refer to the temperatures of final homogenization in the same assemblages. Notice that the data report the properties of individual FIAs according to their occurrence within Qtz I of the damage zone, Qtz I from the fault core, and Qtz II from the fault core. Notice that pseudosecondary (PS) and secondary (S) FIAs identify progressive later stages of fluid entrapment and can be used to constrain the fluid properties in the fault zone. Notice also that the measured ranges of Thtot spread across T intervals that are too large to represent entrapment at equilibrium (e.g. FIA 7 of Qtz I from fault core: 130–320 ∘C), which suggests post-entrapment re-equilibration of the inclusions. Fluid bulk composition is expressed as salinity, which is conventionally reported as weight percent of NaCl equivalents (wt % NaCleq; Roedder, 1984).
4.3.2 Microthermometry
Damage zone. Secondary FIAs hosted within Qtz I from the damage zone (Type S1) show a range of Tmice between −5.9 and −0.1 ∘C, which corresponds to a salinity of 0 wt % NaCleq–9 wt % NaCleq (Fig. 10a). In these FIAs, final homogenization (Thtot) occurs into the liquid phase (i.e. by disappearance of the vapour bubble) and mainly between 150 and 400 ∘C (Fig. 10e).
Fault core. The secondary FIAs hosted within Qtz I in the fault core (Type S2) show a range of Tmice between −8.2 and −0.4 ∘C, which corresponds to salinities between 0 wt % NaCleq and 14 wt % NaCleq (Fig. 10b), and final homogenization occurs into the liquid phase between 130 and 410 ∘C (Fig. 10f).
Pseudosecondary FIAs entrapped within Qtz II (Type PS) show a range of Tmice between −13.6 and −0.1 ∘C, which corresponds to a salinity range between 0 wt % NaCleq and 18 wt % NaCleq (Fig. 10c); final homogenization occurs into the liquid phase and between 150 and 440 ∘C (Fig. 10g). Secondary FIAs in Qtz II (Type S4) show a range of Tmice between −11 and 0 ∘C, which corresponds to a 0 wt % NaCleq–15 wt % NaCleq range of salinity (Fig. 10d), while final homogenization into the liquid phase is between 130 and 430 ∘C (Fig. 10h).
As no gases were determined during microthermometric analysis (i.e. melting of carbonic-phase or clathrate hydrates was not detected during the freezing experiments), additional micro-Raman analysis was performed on a set of representative FIAs (samples: TPH-120-4; TPH-120-6; PH21; PH22). Aqueous fluid inclusions hosted by both Qtz I and Qtz II show peaks at the characteristic wavenumbers of CH4 (2917 cm−1) and CO2 (1388 cm−1). These peaks were determined as weak in all spectra, and CO2 detection was sporadic in a few inclusions of only one sample of the fault core (TPH-120-4). Although spectroscopic detections, the CO2- and CH4-bearing inclusions are not systematically associated with specific quartz vein generations or microstructures (i.e. intracrystalline healed cracks, WEB planes, intercrystalline fractures). We therefore cannot associate the presence of CO2 and/or CH4 to any specific deformation stage of the fault.
Such spectroscopic determinations are consistent with the lack of microthermometric evidence of carbonic-phase or clathrate hydrates during the freezing experiments (Rosso and Bodnar, 1995; Dubessy et al., 2001). The impossibility of detecting CO2- and CH4-bearing fluids during the freezing experiments indicate a gas pressure that is systematically lower than that required to observe clathrate dissociation (e.g. 1.4 MPa in CO2–H2O fluids; Rosso and Bodnar, 1995); i.e. it shows low gas concentrations. As a consequence, we have modelled the fluid phases as simple H2O–NaCl systems.
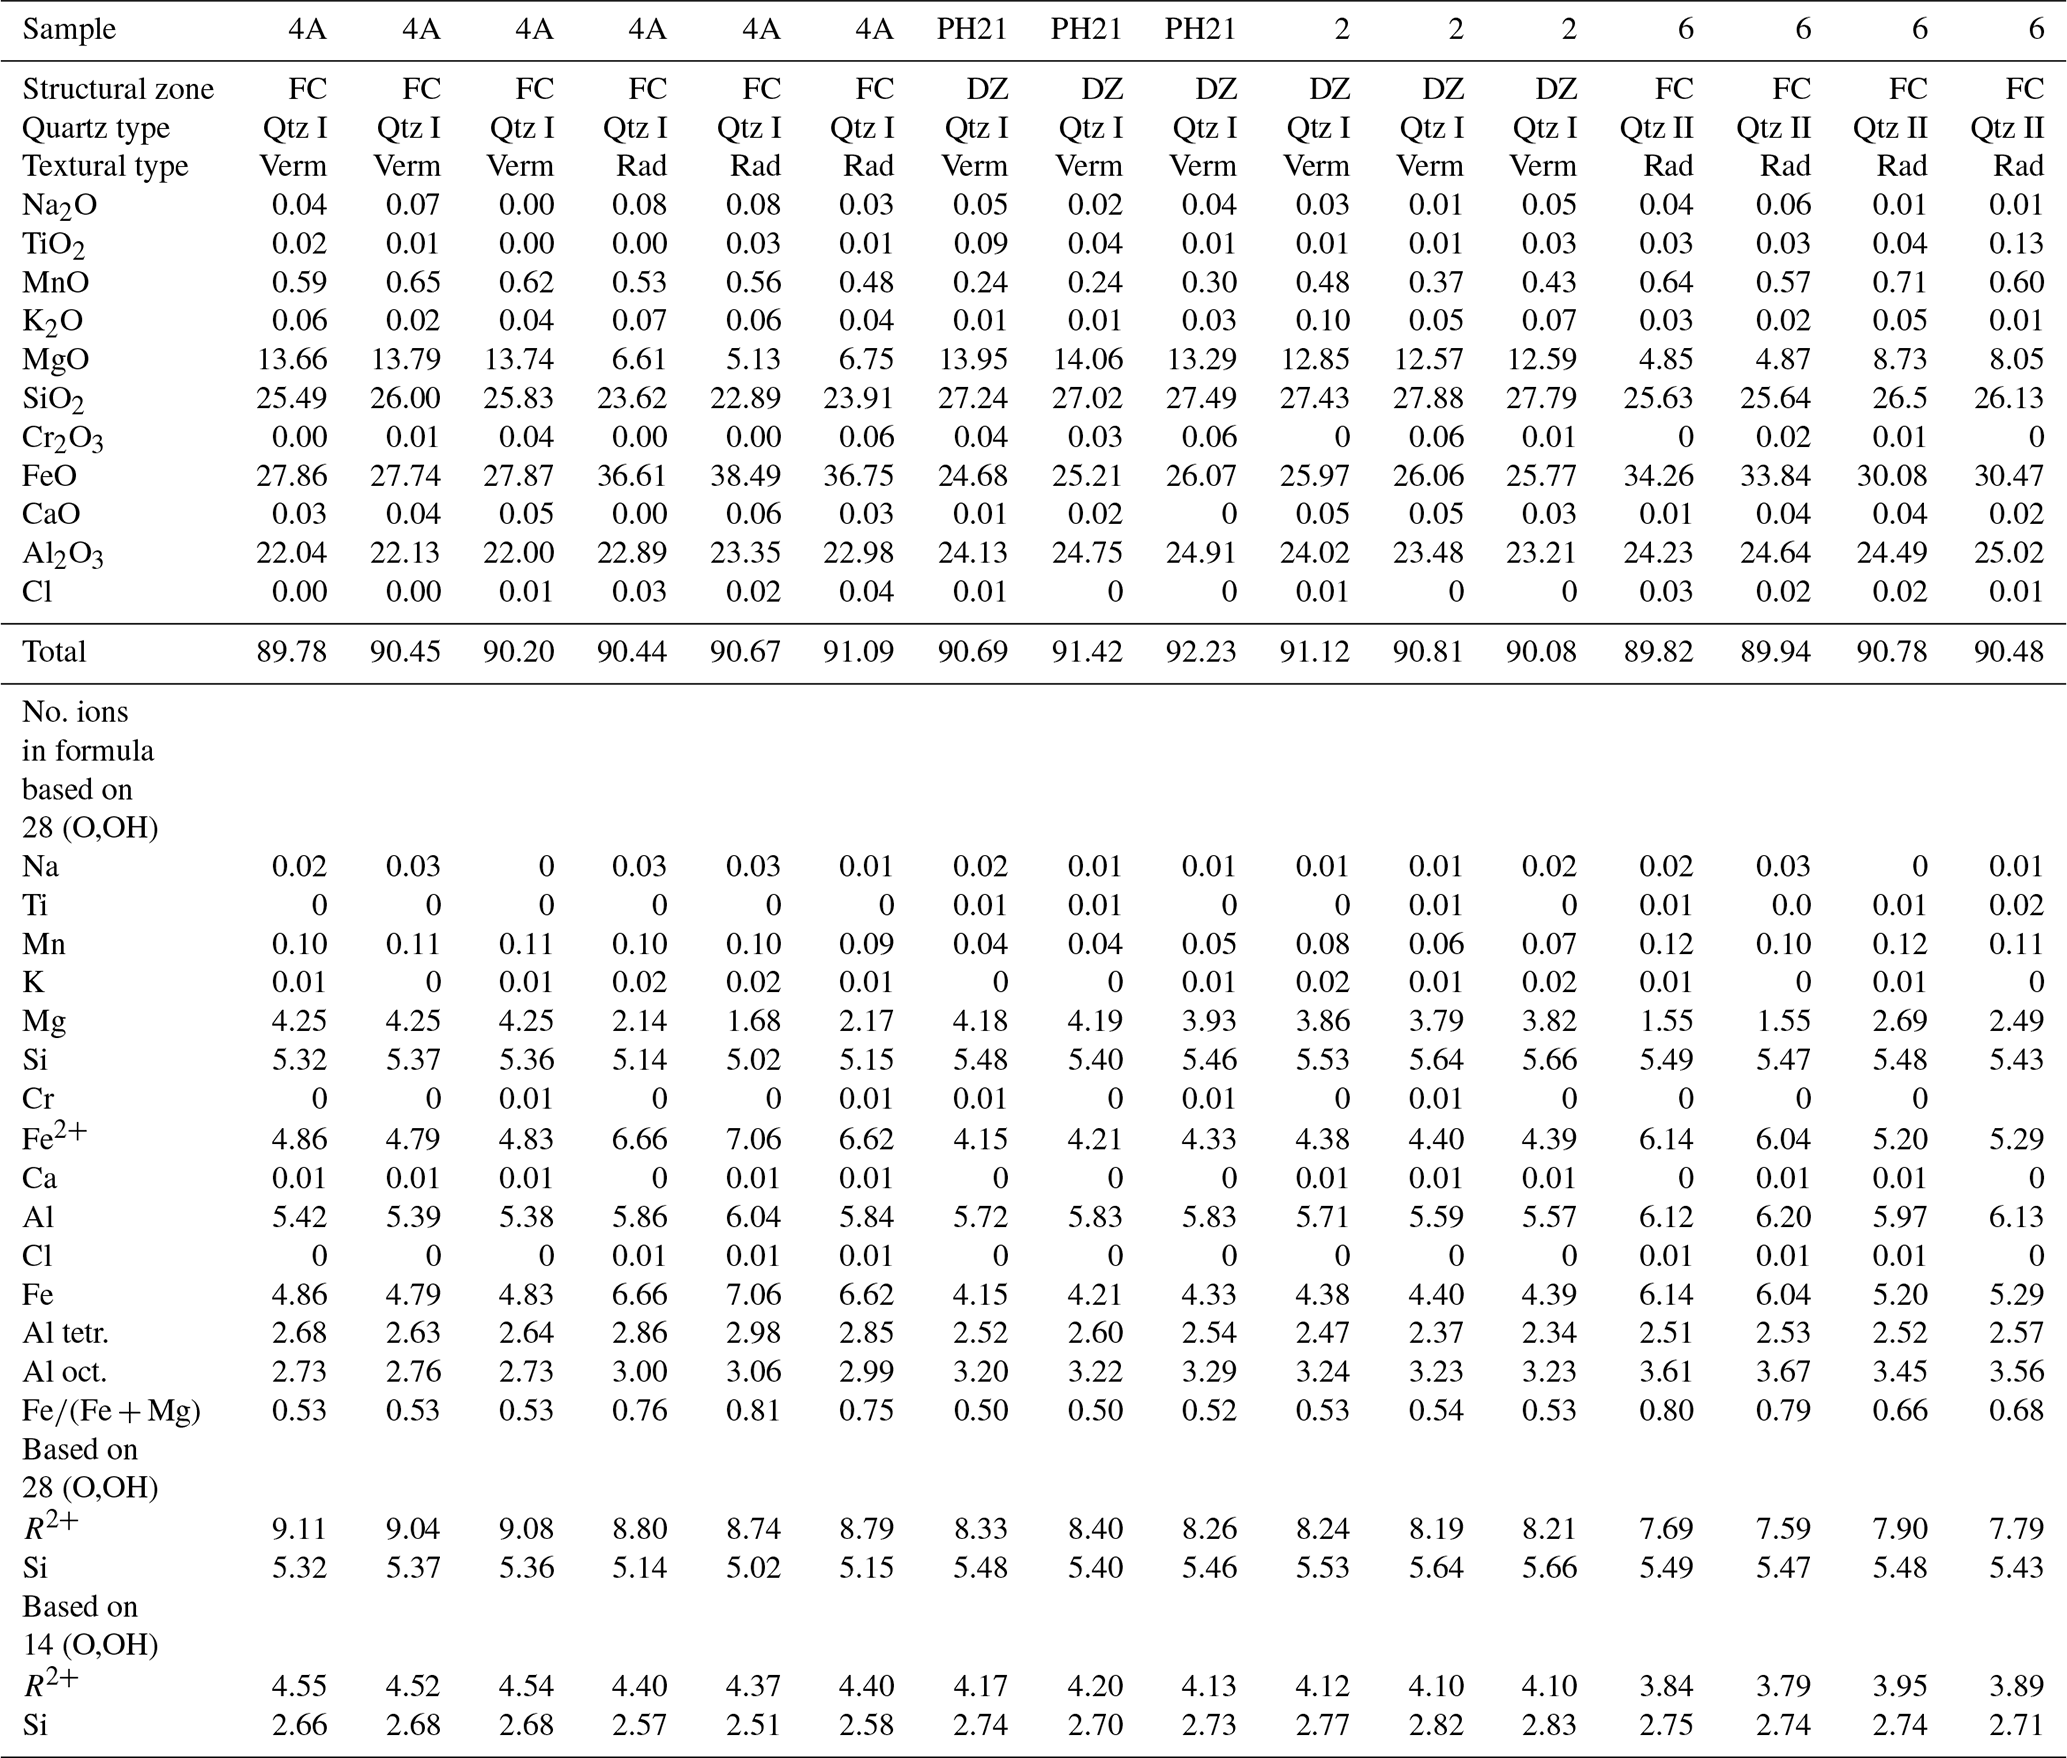
Table 2Representative chlorite EPMA from various structural zones of BFZ300.
4.4 Chlorite and sulfide geothermometry
Chlorite composition has been determined for several generations of chlorites in association with Qtz I and II, namely vermicular chlorite associated with Qtz I from the damage zone, vermicular and radiate chlorite associated with Qtz I from the fault core, and radiate chlorite associated with Qtz II from the fault core (Table 2). Chlorite compositions are shown in Fig. 11a and are expressed as a function of the ratio. Chlorite compositional data are presented according to the structural domain of the fault they are associated with and to the corresponding texture. Vermicular chlorite associated with Qtz I in the damage zone has an XFe range between 0.50 and 0.55, while vermicular chlorite associated with Qtz I from the fault core has an XFe of 0.53. Radiate chlorite associated with Qtz I from the fault core has an XFe range between 0.71 and 0.81, while radiate chlorite associated with Qtz II from the fault core is between 0.65 and 0.80, constraining compositions within the ripidolite and aphrosiderite endmembers.
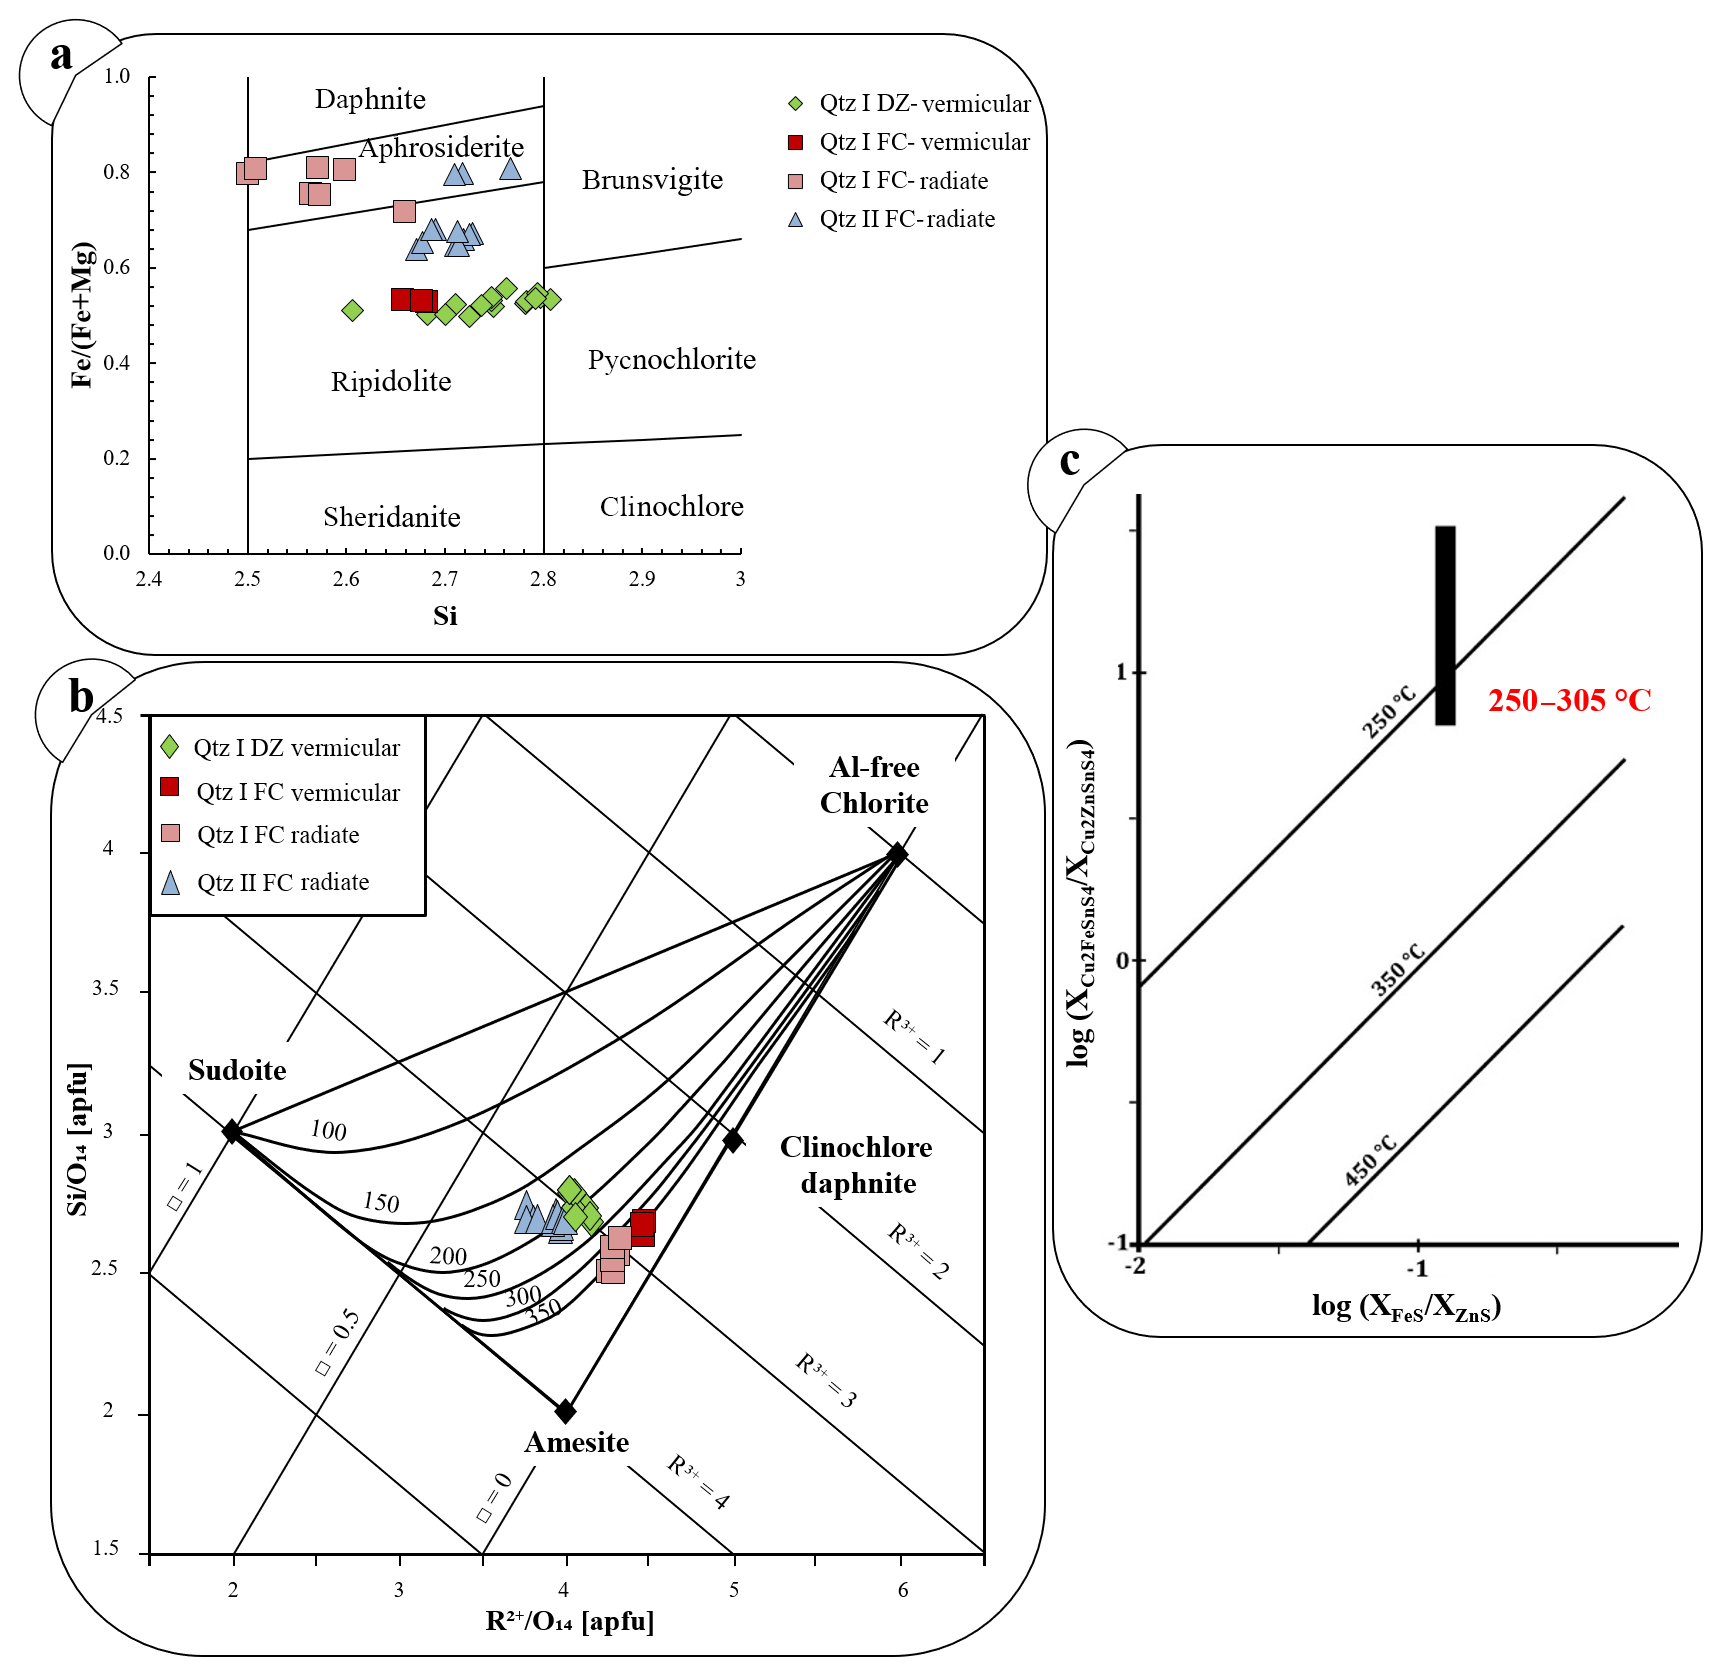
Figure 11Chlorite chemical composition diagram and mineral pair geothermometry applied to the assemblages of the Qtz I and Qtz II veins. (a) Chlorite compositional diagram based on Hey (1954). Green, red, pink, and light blue symbols indicate distinct chlorite textures in association with Qtz I and Qtz II veins. (b) Chlorite–quartz formation temperature estimated using the method of Bourdelle and Cathelineau (2015). The maximum temperature is from the Qtz I chlorite pair from the fault core. (c) Estimated temperature of formation of sphalerite–stannite in association with the Qtz II vein (based on Shimizu and Shikazono, 1985). The region of the plot that was calibrated with this geothermometer lies between the 250 and 450 ∘C isotherms.
Temperature–composition relationships for the quartz–chlorite pair portrayed in the T–R2+–Si diagram of Bourdelle and Cathelineau (2015) show that, in the hypothesis of quartz–chlorite equilibrium, the precipitation of vermicular chlorite within the Qtz I of the damage zone took place in the 175–240 ∘C range (green diamonds in Fig. 11a). This range is distinct from that of the vermicular and radiate chlorite from Qtz I of the fault core, which is probably ca. 350 ∘C because the measured R2+–Si compositional parameters ( Mg+Fe) plot at the edge of, or slightly outside, the calibrated region of the Bourdelle and Cathelineau plot (red diamonds in Fig. 11a). We stress that the high-T chlorite plots parallel to the 350 ∘C isotherm, suggesting that it most probably precipitated at the same or at a similar temperature. Radiate chlorite associated with Qtz II from the fault core is instead compatible with an equilibrium precipitation at 160–220 ∘C (light blue diamonds in Fig. 11a).
Table 3Representative EPMA of sulfides associated with Qtz II.
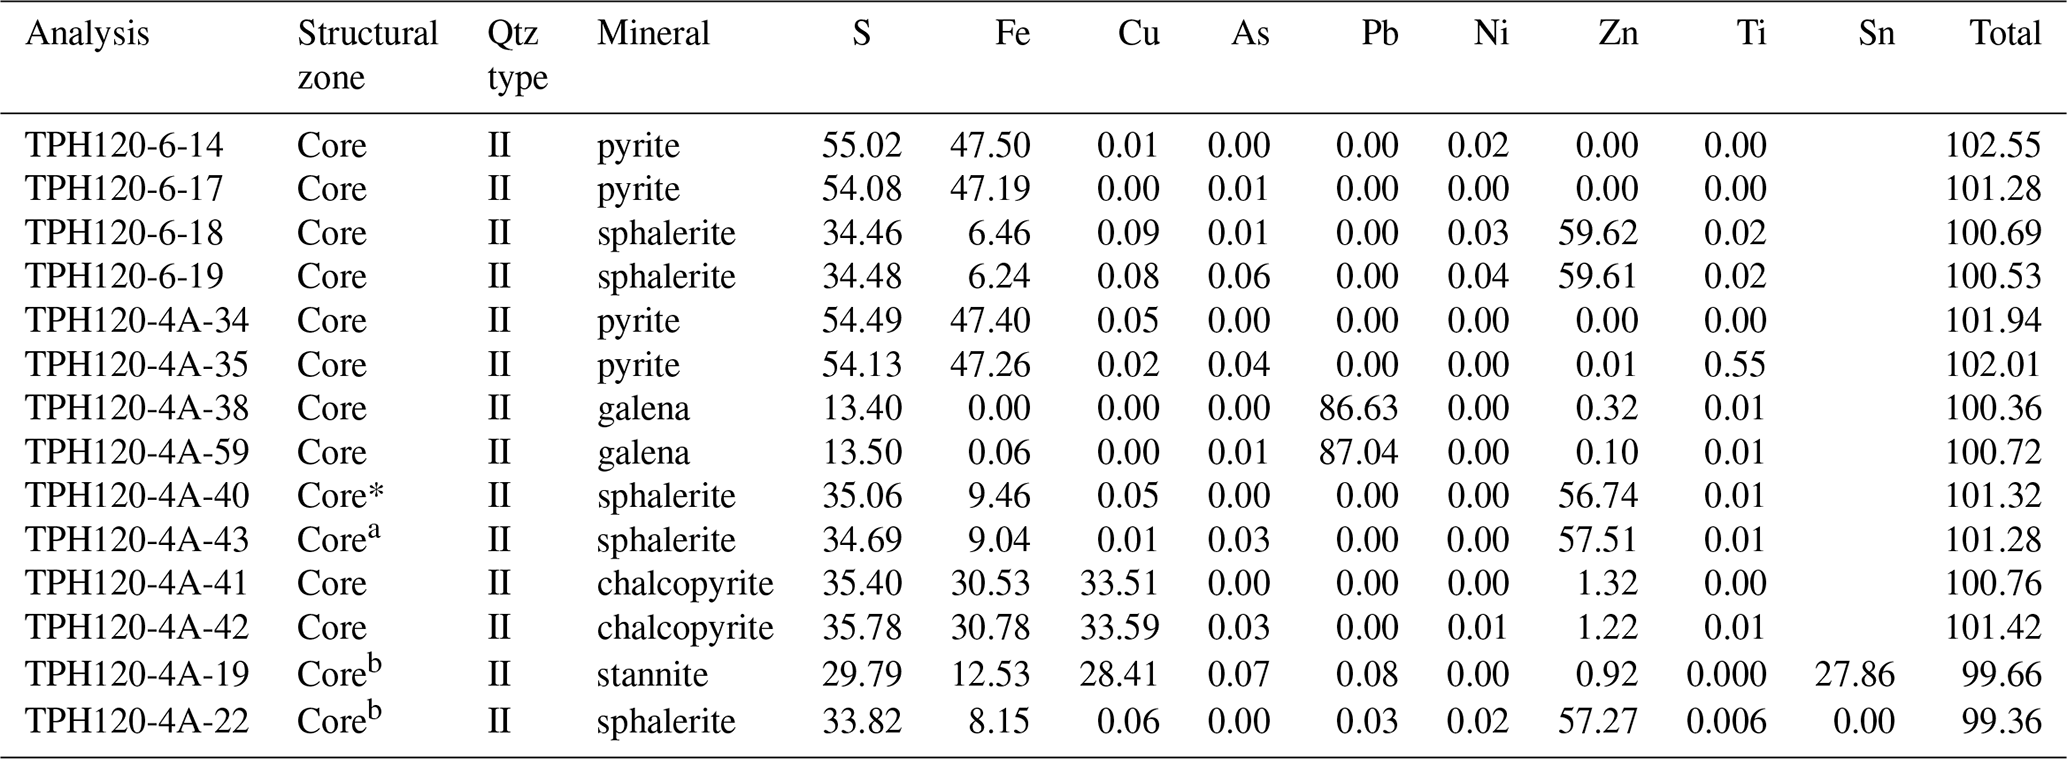
a Located within cataclastic band and close to stylolite. b Located along stylolite. Sphalerite and stannite compositions from locations indicated by b have been used to calculate the temperatures of sphalerite–stannite equilibrium following the geothermometer of Shimizu and Shikazono (1985). See text for a further explanation.
The collected EPMA data show that the sulfides associated with Qtz II have compositions that approach those of pure phases (Table 3). Pyrite has trace element concentrations (Cu, As, Pb, Ni, Zn) that are in general below the EPMA detection limit, while galena, sphalerite, and chalcopyrite show only some significant trace contents of Fe and Zn (e.g. Fe: 0.22 wt %–1.00 wt % in galena; Zn: 0.11 wt %–3.95 wt % in chalcopyrite). Pyrite and sphalerite from the Qtz II veins (Fig. 7e) have trace element concentrations that are, again, mostly below detection limits.
The stylolites bordering the cataclasite bands described above and formed at the contact between the Qtz I and Qtz II vein contain pyrite, galena, and the sphalerite–stannite pair (Fig. 8a, c, d), with the latter showing the largest compositional variation. This pair represents a mineral geothermometer because the partitioning of Zn and Fe between sphalerite and stannite was demonstrated to be temperature dependent but pressure independent (Nekrasov et al., 1979; Shimizu and Shikazono, 1985). In the 14 analysed pairs, stannite shows a range of Zn concentrations varying between 0.48 wt % and 3.25 wt %, while those of Fe, Cu, and Sn vary within narrow ranges (Fe: 12.74±0.56 wt %; Cu: 28.30±0.33 wt %; Sn: 27.65±0.71 wt %). Sphalerite in the pair has concentrations of Fe and Zn of 7.63±0.87 wt % and 56.68±1.17 wt %, respectively. These ranges allow for the calculation of the partition coefficient (KD) of the following reaction: Cu2FeSnS4 (in stannite) + ZnS (in sphalerite) = Cu2ZnSnS4 (in stannite) + FeS (in sphalerite). We have used the logkD–T relationship of Shimizu and Shikazono (1985) to calculate the formation temperature of the pair, which is portrayed in the (/)–(XFeS/XZnS) plot of Shimizu and Shikazono (Fig. 11b). The resulting 220–305 ∘C interval lies at the low end of, or slightly outside, the 250–350 ∘C interval of the geothermometer.
Therefore, we consider the 250–305 ∘C interval as the best estimation of the formation T of sphalerite–stannite in the stylolite.
Our work constrains the architecture and the environmental conditions at which BFZ300 deformation took place. Field and petrographic observations support the idea of transiently elevated fluid pressures, cyclic frictional–viscous deformation and progressive, and discrete strain localization (Figs. 2, 3). Analytical data suggest that these deformation cycles took place at the BDTZ. In the following, we discuss these constraints by systematically considering our different analytical results.
5.1 Fluid inclusion data and mineral pair geothermometry
Field evidence combined with microstructural observations, fluid inclusion analyses, and the documented distinct generations of synkinematic chlorites confirm that Qtz I and Qtz II veins precipitated from distinct batches of aqueous fluid (i.e. H2O–NaCl) that infiltrated the fault zone during different stages of its evolution.
We documented a wide range of bulk salinity for each FIA entrapped within the quartz veins in each structural domain (Fig. 10a–d). This suggests post-entrapment re-equilibration of fluid inclusions (Bakker and Jansen, 1990; Diamond et al., 2010). The Thtot varies between ca. 130 and 440 ∘C without a clear mode or a skew (Fig. 10e, h), indicating that no common range of entrapment temperature can be identified in the dataset. Therefore, we conclude that even the properties of petrographically intact FIAs do not correspond to chemically well-preserved assemblages. Indeed, the ranges of Thtot in individual FIAs are typically of the order of 150–200 ∘C (Fig. 10e–h), i.e. a value that is much higher than the ∼10 ∘C range expected for homogeneous FIAs entrapped isochorically and isoplethically (Fall et al., 2009; Vityk and Bodnar, 1998) and that demonstrates post-entrapment re-equilibration (Vitik and Bodnar, 1998; Bodnar, 2003b; Sterner and Bodnar, 1989; Invernizzi et al., 1998). A major implication of fluid inclusion re-equilibration in our study is that the calculated fluid properties do not rigorously reflect those of the pristine fluid originally entrapped within BFZ300, but rather those of a fluid that modified its properties during the fault activity.
Then, a possible approach to interpret our FI dataset is a comparison with experimental work on synthetic fluid inclusions subjected to a range of post-entrapment re-equilibration conditions (Bakker, 2017; Bakker and Jansen, 1990, 1991, 1994; Vityk and Bodnar, 1995, 1998; Vityk et al., 1994; Invernizzi et al., 1998). A straight comparison to the experiments is in our case difficult because most experimental work was carried out at high P–T conditions (500–900 ∘C; 90–300 MPa), and also only few experiments were carried out under deviatoric stress conditions that approach those of natural rocks (Diamond et al., 2010; Tarantola et al., 2010). Despite these limitations, however, some key experimental results provide fundamental constraints on our dataset. First, both hydrostatic and uniaxial compression experiments showed that in each re-equilibrated FIA a number of inclusions survive the modified post-entrapment P–T conditions virtually intact, showing that only severe deformation leads to total re-equilibration and complete obliteration of pristine inclusions (i.e. Δσ > 100 MPa in uniaxial compression experiments; > 400 MPa change of confining P in hydrostatic experiments). Second, under conditions leading to only low to moderate re-equilibration, the bulk chemical composition of the fluid inclusions does not change significantly from that of the pristine inclusions.
All of this implies that natural quartz samples with microstructures typical of moderate T deformation, such as deformation lamellae, deformation bands, undulose extinction and bulging, and hosting FIAs with moderately re-equilibrated textures, should still contain a number of inclusions whose properties resemble those of the pristine fluid. In this scenario, our microthermometric dataset can be used to constrain the more probable salinity ranges of the fluid batches which triggered the BZ300 reactivation stages. Two possible interpretations of the microthermometric dataset can follow and we can give the corresponding different salinity ranges for the fluids.
One possibility is that the different quartz veins and the fluids trapped within fluid inclusions originated from multiple pulses of a single low-salinity fluid, with a salinity between 0 wt % NaCleq and 7 wt % NaCleq, as shown by the distribution of > 70 % of the bulk salinities skewed towards values of 7 wt % NaCleq or less (Fig. 10a–d). Thus, it is possible that aliquots of the 0 wt % NaCleq–7 wt % NaCleq FIAs from Qtz I and II crystals from both the damage zone and fault core are still representative of the pristine sampled fluid. These inclusions would be those that survived or were relatively less affected by deformation events post-dating their entrapment. Inclusions falling outside the most typical 0 wt % NaCleq–7wt % NaCleq salinity range would instead correspond to those which progressively modified their properties as a consequence of fluid–rock interaction during faulting and that experienced significant H2O loss and consequent salinity increase during the successive stages of fault deformation (Bakker and Jansen, 1990; Diamond et al., 2010). The large documented range of Thtot lacking a specific mode observed in individual FIAs is the product of fluid density changes caused by fluid inclusion re-equilibration during post-entrapment deformation. This would have happened repeatedly and cyclically within the host quartz during all ductile and brittle stages of deformation of the multistage deformation history of BFZ300.
Alternatively, multiple batches of fluids with different salinities (from low to intermediate salinity) may have infiltrated and evolved within BFZ300 during its activity. In fact, considering the salinity dataset presented for each structural domain, fluid salinity can be seen clustering in restricted ranges typical for each domain: (1) the salinity of 60 % of secondary fluid inclusions in Qtz I from the damage zone is between 0 wt % NaCleq and 1 wt % NaCleq; (2) > 80 % of the secondary inclusions in Qtz I from the fault core preserve a salinity in the 1 to 5 wt % NaCleq range; (3) 75 % of pseudosecondary inclusions in Qtz II show salinity values between 6 wt % NaCleq and 11 wt % NaCleq; and (4) ∼70 % of the secondary inclusions trapped within Qtz II show salinity values between 0 wt % NaCleq and 3 wt % NaCleq. These clusters may best represent the original compositional ranges of different batches of fluids, each involved during a different faulting stage. Salinities outside these ranges may instead be explained again as resulting from the post-entrapment re-equilibration of those fluids with different salinities. This hypothetical scenario, in which chemically distinct fluids entered into the fault and interacted with the rock at different times (e.g. Selverstone et al., 1992; Boiron et al., 2003; Famin et al., 2005), is also reinforced by several lines of observations, such as the variation of chlorite composition, the slight change in paragenesis–redox state within Qtz II and Qtz I veins (i.e. the absence of massive sulfides in Qtz I), and the prolonged history of faulting (see below).
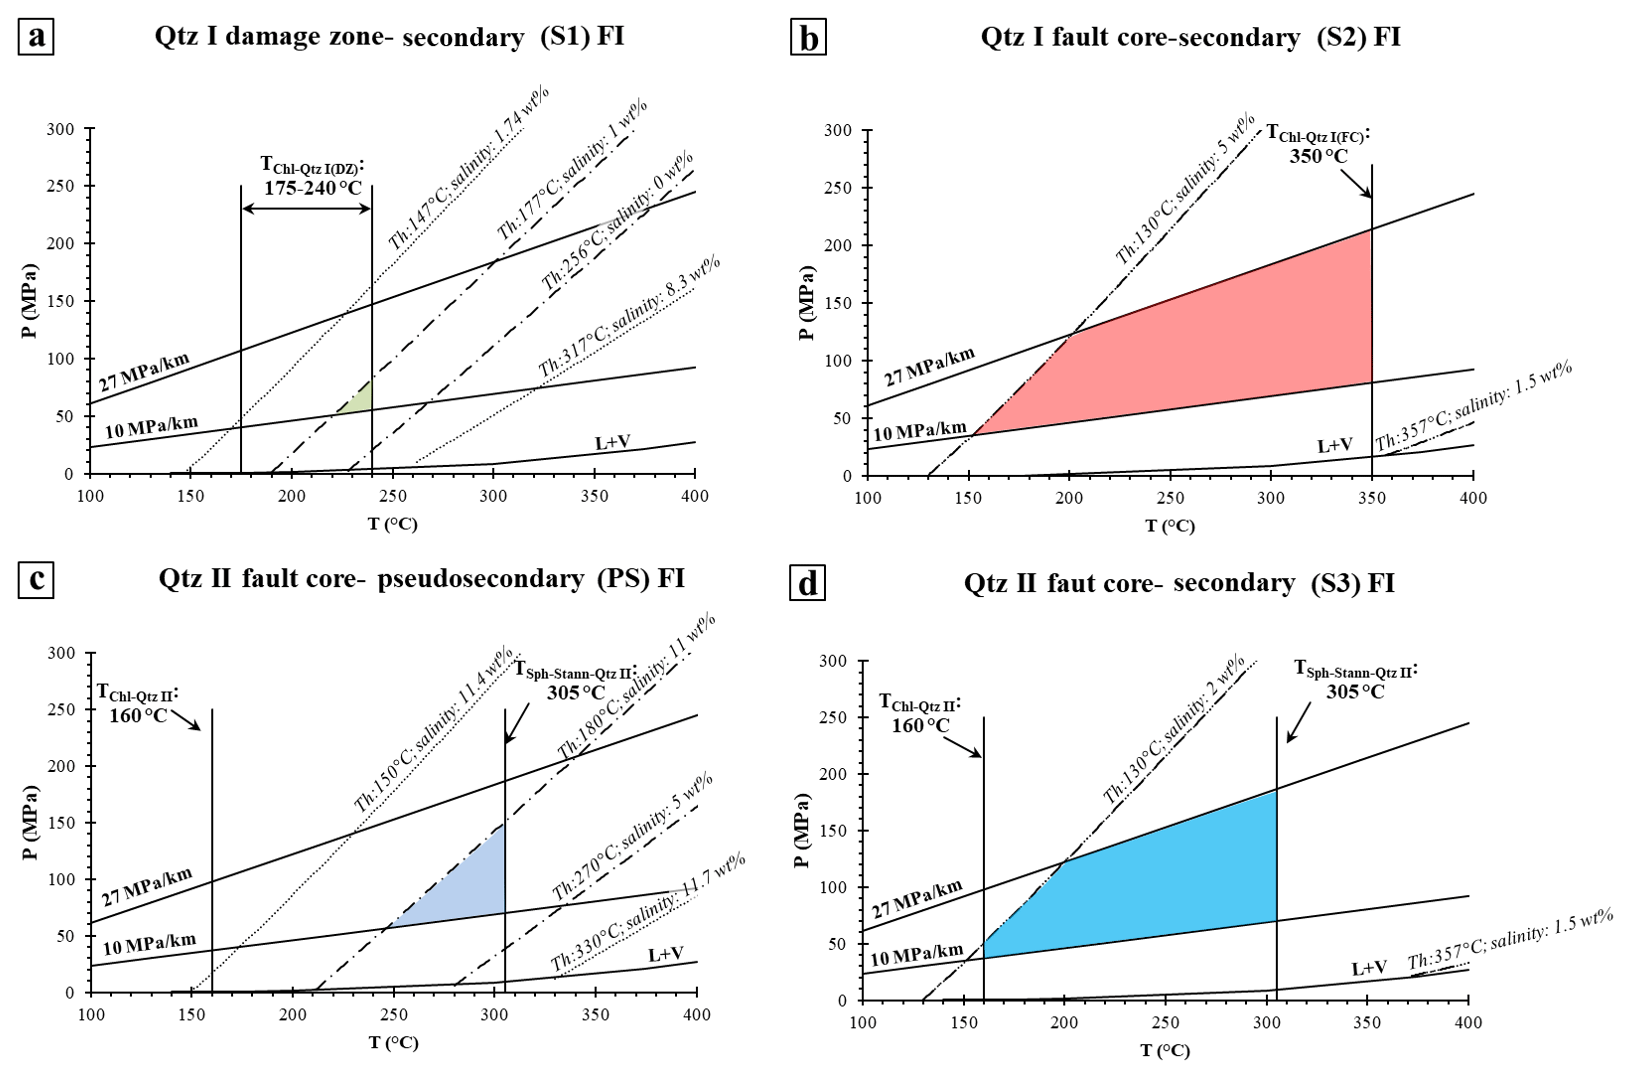
Figure 12P–T diagrams showing the ranges of P–T trapping conditions of the analysed fluid inclusions: (a) secondary inclusions in Qtz I from the fault damage zone; (b) secondary inclusions from Qtz I in the fault core; (c) pseudosecondary inclusions trapped in Qtz II in the fault core; and (d) secondary inclusions in the Qtz II. Thin dashed lines indicate maximum and minimum isochores of FIAs in each structural domain. The coloured areas identify the probable P–T trapping ranges defined by (i) the slope and position of the fluid inclusion isochores as determined by the most representative salinity and homogenization temperature range (see the Supplement for details); (ii) mineral pair geothermometry and (iii) hydrostatic and lithostatic fluid pressures computed assuming a regional geothermal gradient of ca. 40 ∘C km−1 (assuming retrograde conditions of 4 kbar and 650 ∘C; from Kärki and Paulamäki, 2006). The liquid–vapour equilibrium curve for the H2O–NaCl modelled fluid is also indicated.
Fully aware of the interpretative uncertainties of our dataset, we have combined the microthermometric data of the studied FIAs with the independent quartz–chlorite and sphalerite–stannite geothermometers to constrain the most probable fluid pressure during the faulting events. With this approach, we use the formation temperatures of the mineral pairs as independent geothermometers and consider the intersection between these values and the FIA isochores to derive the ranges of trapping pressure (Roedder and Bodnar, 1980). In Fig. 12, we present the ranges of the possible pressure (Pf) of the fluids involved during faulting as calculated by combining the fluid inclusion data with the constraints provided by the mineral pair geothermometry, the hydrostatic and lithostatic pressure gradients, and a possible geothermal gradient (e.g. Van Noten et al., 2011; Selverstone et al., 1995; Jaques and Pascal, 2017). The reconstructed regional gradients at the time of vein emplacement are derived from peak metamorphic conditions (4–5 kbar; 650–700 ∘C, leading to ca. 40 ∘C km−1; from Kärki and Paulamäki, 2006). Hydrostatic and lithostatic pressures are then calculated by using pure water density and assuming a rock density of 2700 kg m−3, respectively. These gradients are used to constrain the upper and lower bounds to physically possible fluid pressures. We computed the maximum and minimum isochores by using the entire salinity and Thtot ranges obtained from the FIAs in each structural domain (Fig. 10). We also computed the isochores of the inclusions with the most representative salinity estimates for each structural domain obtained by comparing the frequency diagrams (Fig. 10) with the Thtot vs. salinity plots (Fig. S4). Considering the peak temperature of each structural zone from the geothermometric estimations in combination with the computed isocores, the estimated peak conditions of the fluid pressure are (1) 80 MPa for Qtz I from the damage zone, (2) 210 MPa for Qtz I from the fault core, (3) 140 MPa from pseudosecondary inclusions in Qtz II from the core, and (4) 180 MPa from secondary inclusions in Qtz II, still from the core (Fig. 12; Table 1).
In addition to the Pf peak conditions we can also constrain the physically possible fluid pressure ranges for each stage of fluid ingress, which are derived by considering the temperature range estimated for each structural domain. Thus, for the damage zone, a Pf interval of 50–80 MPa (Fig. 12a) can be derived by intersecting the range of T obtained from the chlorite–quartz pair in the Qtz I from the damage zone with the range of isochores from the same quartz. As to the fault core, we combine the 350 ∘C constraint from the chlorite–quartz pair from Qtz I in the fault core with the isochores from the same quartz, which yields Pf between ca. 30 and 210 MPa (Fig. 12b). Similarly, the intersection between the equilibrium T of the sphalerite–stannite pair in the Qtz II from the fault core and the range of isochores of the pseudosecondary FIAs of Qtz II defines Pf values between 50 and 140 MPa (Fig. 12c). Estimations from secondary FIAs in Qtz II constrain a range between 40 and 180 MPa (Fig. 12d).
As also supported by the microstructures described above, we propose that these values are sufficiently accurate to constrain at least four stages of fault reactivation, each triggered by a fluid with distinct physical and compositional properties.
As shown by the T vs. P plots in Fig. 12, the secondary FIAs entrapped in Qtz I from the damage zone constrain the lowest value of Pf (i.e. 50–80 MPa) of the entire dataset. We interpret this not as representative of the early BFZ300 localization, but rather as possibly resulting from fluid entrapment during a later stage of fault reactivation at T∼200 ∘C. This is also consistent with the calculated temperature of crystallization of the vermicular chlorite associated with Qtz I from the damage zone (175–240 ∘C, Fig. 11b) and with the secondary nature of the entrapped FIAs. Also, the most abundant salinities observed in the Qtz I from the damage zone (0 wt % NaCleq–1 wt % NaCleq) coincide with the lowest Thtot measured in the same structural domain. Later fracturing of Qtz I in the damage zone may thus have been coeval with the formation of vermicular chlorite preserved therein, which is found along secondary cracks and median lines (Fig. 5d).
In light of these considerations, we propose that initial BFZ300 localization occurred in the presence of a fluid with T and P of at least 350 ∘C and 210 MPa, respectively. Later faulting continued by cyclic brittle–ductile switches induced and assisted by fluid batches at progressively lower temperature and pressure.
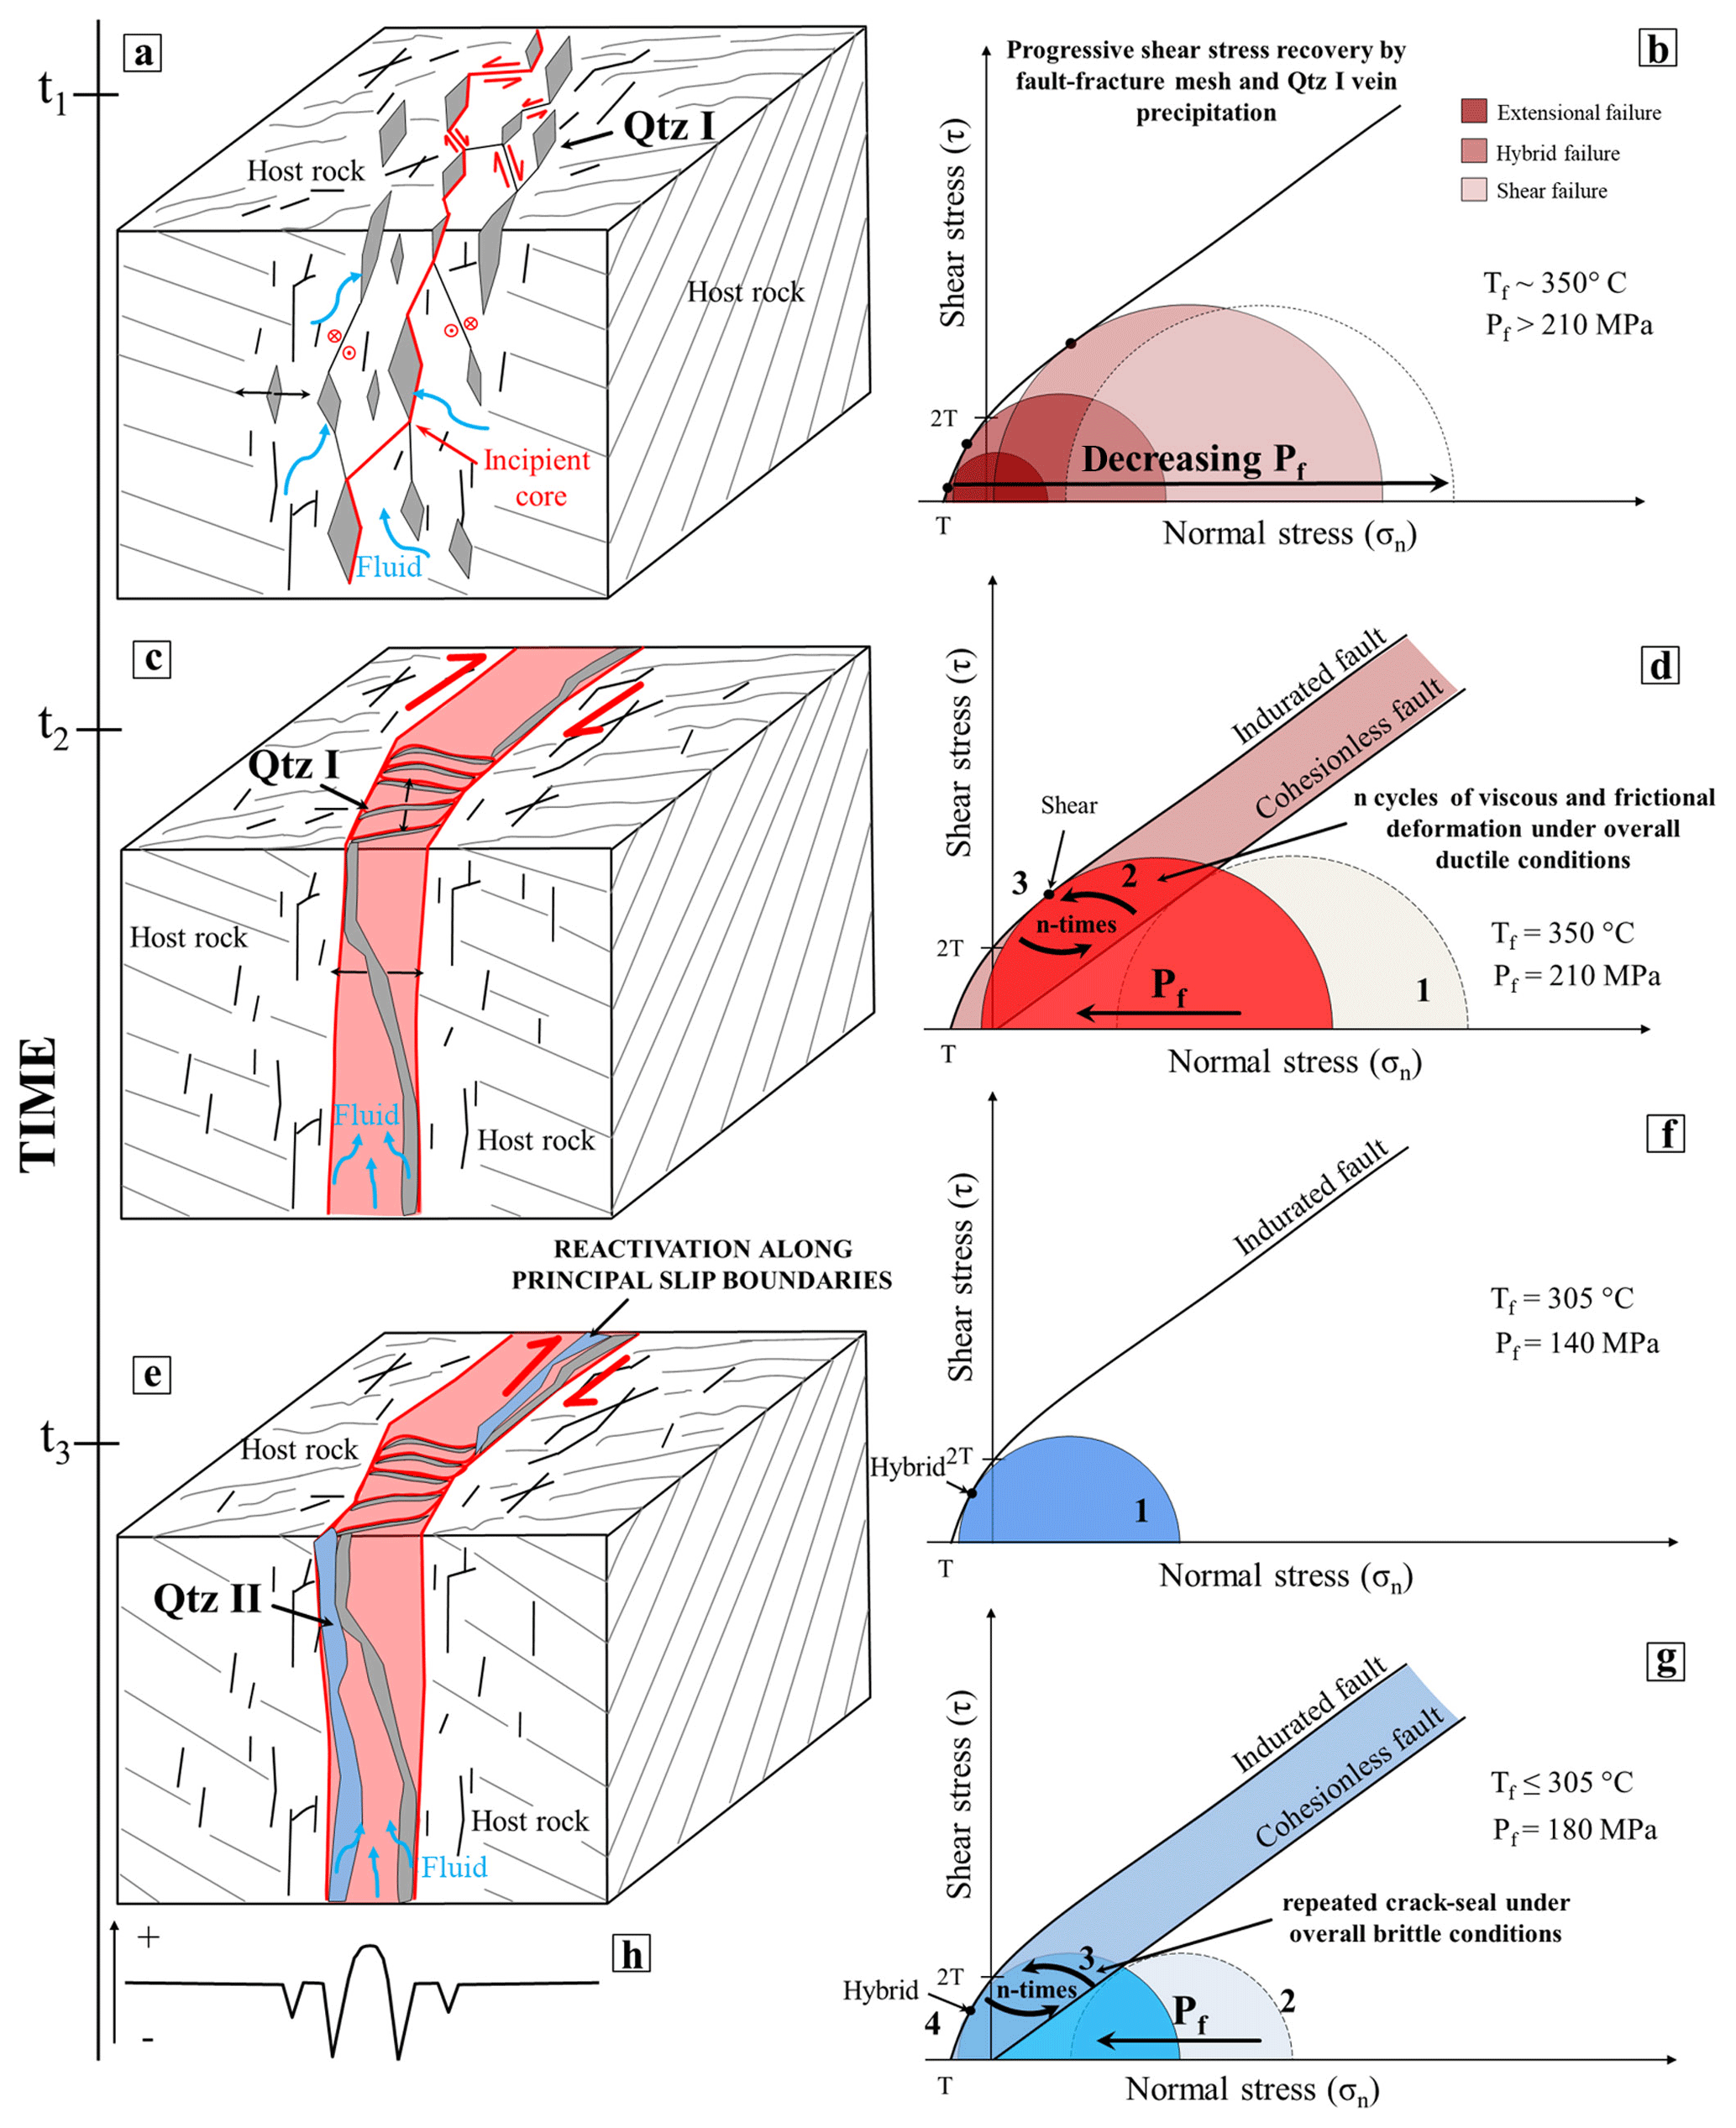
Figure 13Conceptual model of the temporal and mechanical evolution of the BFZ300 fault zone (see text for more details). Grey lines: traces of metamorphic foliation. Black lines: fractures related to the BFZ300 structural development. (a) Initial embrittlement of the migmatitic basement occurred by fracture coalescence (red line) under (b) initial lower differential stress conditions and high fluid pressure, followed by a transient increase in differential stress. A first generation of quartz veins (Qtz I) precipitated inside the diffuse network of joints and hybrid–shear fractures which formed during this first deformation stage. (c) Progressive strain localization and fluid channelling within the fault core occurred by (d) episodically renewed fluid pressure build-up driven by cycles of brittle and ductile deformation. (e–g) Progressive exhumation and cooling of the fault system occurred concomitant with several brittle reactivation episodes of the fault zone under hybrid conditions and fluid pressure lower than during the previous deformational stages. Lastly, a second generation of quartz veins (Qtz II) was emplaced, mainly along the principal slip boundaries of the fault core, following the Qtz I vein as shown by (h) the strength profile across the fault architecture, which suggests lower tensile strength values (and hence higher reactivation potential) along the Qtz I vein and host-rock walls.
5.2 Structural evolution and fluid flow: a conceptual model
Based on the integration of field, microstructural, thermometric, and fluid inclusion constraints (Table 1), we propose a conceptual model for the structural evolution of BFZ300 (Fig. 13). The fault's finite strain results from several slip episodes mediated by multiple events of fluid ingress and fluid–rock interaction. A first constraint provided by our study is that the analysis of the bulk chemical composition of the fluids that cyclically ingressed the fault suggests the likely presence of several batches of fluids of varying salinity and composition.
The embrittlement of the Olkiluoto metamorphic basement (time t1 in Fig. 13a, b) represents the initial stage of the deformational history of BFZ300, when conditions for brittle dilation and fracturing of the Paleoproterozoic basement were first met in a transient fashion. We propose that brittle failure under still ductile environmental conditions was caused by transiently elevated Pf (> 210 MPa), as also demonstrated by field evidence of hydrofracturing (pure tensional en echelon veins at the BDTZ depth). Hydrofracturing of the host basement is also indicated by the emplacement of Qtz I veins within the diffuse network of joints and conjugate hybrid–shear fractures of the damage zone (Figs. 13a, 3a, b). These brittle features are quite broadly distributed, suggesting an initial volumetrically diffuse strain distribution. Their formation caused the overall mechanical weakening of the host-rock volume, which in turn facilitated later strain localization. Brittle structures formed during this stage are discordant to the ENE–WSW-striking metamorphic foliation (Fig. 1b), which they cut at a high angle (Fig. 13a). Conditions for tensional and hybrid failure require low differential stress, i.e. σ1–σ3≦4T, where T is the tensional strength of the rock. Opening of fractures caused a stress drop, sudden increase in permeability, fluid venting, and inhibited further build-up of Pf. Dilatant fractures were partially infilled by Qtz I, which precipitated from a first fluid with inferred low salinity (in the range between 1 wt % NaCleq and 5 wt % NaCleq). Precipitation of Qtz I and formation of veins within these fractures caused hardening of the system. The progressive recovery of shear stresses altered the overall background stress conditions such that failure, after causing initial pure dilation, was later accommodated by hybrid extensional and, eventually, by shear fracturing (Fig. 13b), thus forming laterally continuous and interconnected shear fractures associated with breccia pockets and cataclasites (Fig. 3d, g, i). Conjugate shear fractures connected the previously formed extensional fractures through fracture coalescence (e.g. Griffith, 1920; Sibson, 1996; Fig. 13a). At the microscale this is demonstrated by the elongated–blocky texture of Qtz I crystals from the damage zone (Figs. 4c and 5a), where crystals grew at a high angle to the vein boundaries (thus suggesting initial near-orthogonal dilation) that are physically connected by cataclastic shear bands to form a fault-fracture mesh (e.g. Sibson, 1996). Cataclastic bands formed at the expense of the migmatitic host rock are enriched in authigenic, synkinematic sericite, likely due to the interaction between K feldspar and fluids circulating in the dilatant fault zone (Fig. 4b). Shear fractures thus deformed the migmatitic host rock to connect dilatant and mostly Qtz-I-filled tension gashes during a continuum of deformation. The conjugate shear fractures ascribable to this stage invariably define tight acute angles (Figs. 2b, 3a), which we take as further evidence of overall low differential stress conditions at the time of failure (Fig. 13b).
In synthesis, Qtz I veins from the damage zone are interpreted as the expression of the earliest stage of fault nucleation, before strain localization affected a progressively narrower rock volume to eventually form the main fault core. Indeed, the mesoscale and microscale features observed in the damage zone Qtz I, lacking the pervasive crystal–plastic deformation that otherwise occurred in the fault core Qtz I, are used to document the initial stage of embrittlement. Based on geometric, kinematic, and deformation style characteristics, we tentatively assign this deformation episode to Stage 1 by Mattila and Viola (2014, their Fig. 18), i.e. to a discrete brittle episode considered the expression of the earliest onset of brittle conditions in southwestern Finland ca. 1.75 Ga, under overall NW–SE to NNW–SSE transpressive conditions.
Further deformation of the BFZ300 (time t2 in Fig. 13c) occurred by progressive inward strain localization and narrowing of the actively deforming volume of the deformation zone (from a wide damage zone to a narrow fault core). The early BFZ300 core, consisting of the main Qtz I vein, is interpreted as having formed at this stage within an overall dextral strike–slip kinematic framework. Emplacement of the Qtz I vein in the core represents the last pulse of this brittle deformational episode (Fig. 13b). Major fluid venting was likely associated with it such that the system, once brittle failure in the core had occurred by hydrofracturing, moved back to a more diffuse deformation style typical of the still prevailing ductile conditions. Microscopic evidence of crystal–plastic deformation and dynamic recrystallization (Fig. 6a, b; Table 1) overprinting the early brittle structures of Qtz I in the fault core supports slow strain rate conditions during deformation. However, this ductile background deformation was punctuated by renewed and cyclically transient embrittlement as documented by healed fractures shown by trails of secondary fluid inclusions cutting across both the ductile fabrics and the earlier brittle deformational features (Figs. 6c, S2a, b). EBSD analysis of the new grains documented along healed microcracks also suggests that they likely nucleated from fluids circulating in the early fractures before being later deformed in the low-temperature plasticity regime. Thus, we show that at the BDTZ “neocrystallization” by nucleation and growth in fractured fragments and dynamic recrystallization (typically by bulging and subgrain rotation) coexist and compete in the overall microstructural evolution of quartz (e.g. Kjøll et al., 2015). Repeated fluid ingress and related deformation would, in addition, have also caused some of the post-entrapment equilibration of the FI, as discussed above.
Mattila and Viola (2014) describe a second brittle stage (referred to as Stage 2, their Fig. 18) during which a ca. N–S- to NNE–SSW-oriented episode of transpressional deformation affected southwestern Finland. Geometric and temporal relationships between structures of Stage 1 and 2 (see also Viola et al., 2009) were used to infer a clockwise rotation of the horizontal compression direction from NW–SE (Stage 1) to NNE–SSW (Stage 2). Consistent with the kinematic framework of Stage 2, we propose here that during progressive regional exhumation and cooling to entirely brittle conditions, the BFZ300 deformation continued through a further, distinct deformation phase (t3 in Fig. 13e). This stage accommodated the selective reactivation of the BFZ300 core, with renewed dilation due to the rotated σ1 during Stage 2 acting subparallel to the strike of the Qtz I vein in the BFZ300 core. Localized dilation in a still fluid-rich system allowed for the emplacement of the Qtz II vein (Fig. 13e). Our estimations indicate peak conditions of Pf 140 MPa and T≈305 ∘C. The BFZ300 core was reactivated by an intermediate-salinity fluid (in the range between 6 wt % NaCleq and 11 wt % NaCleq) under overall hybrid conditions (Fig. 13f), as suggested by the irregular thickness and curved geometry of the Qtz II vein therein and by the synkinematic chlorite crystals that are stretched orthogonally to the vein boundaries (Fig. 3h). The Qtz II vein invariably localized along at the contact between Qtz I and the host rock (Figs. 3f, 13e), suggesting selective reactivation along the pre-existing principal slip zones, which represented the weakest part of the fault (Fig. 13h). Evidence for mesoscale hybrid fracturing and our Pf estimates (Fig. 12) suggest that Pf was lower than that of the earlier deformation stages during Qtz I emplacement.
BFZ300 underwent one or more events of brittle fracturing and induration (Fig. 13g), as suggested by the CL imaging of Qtz II crystals (Fig. 7c). The fluid pressure peak value for this structural stage is ca. 180 MPa.
A possible, very late reactivation stage of unknown age is also documented by the secondary chlorite associated with Qtz I in the damage zone (Fig. 5a, d). Also, the stylolitic seams striking parallel to the BFZ300 fault zone suggest compression oriented ca. E–W, i.e. subparallel to the inferred Sveconorwegian main shortening direction (e.g. Viola et al., 2011). The sphalerite–stannite mineral pairs arranged along these structures were possibly concentrated through pressure solution during this deformational stage.
Skyttä and Torvela (2018) proposed that the BFZ300 is a brittle structure localized onto a zone of incomplete structural transposition inherited from the earlier ductile history of the Olkiluoto basement. However, in our mesoscale and microstructural analysis we did not find evidence of any ductile precursor, and we note that BFZ300 cuts the ductile structural grain at a high angle, which excludes any reactivation of precursor ductile fabrics.
5.3 Implications for seismic deformation at the base of the BDTZ
This study demonstrates the role of overpressured fluids in strain localization during the incipient stages of fault nucleation and subsequent reactivation(s) at the BDTZ. The maximum estimated fluid pressure and fluid temperature conditions derived in this study (peak conditions of 210 MPa and 350 ∘C) are indeed realistic for the base of the seismogenic zone in the continental lithosphere (e.g. Scholz, 1990, and references therein) where the brittle–ductile transition for quartz occurs.
Mechanical models of long-term deformation (Rolandone and Jaupart, 2002) propose that deformation at the brittle–ductile transition can be reasonably described as mostly accommodated by intermittent and concomitant coseismic slip and ductile flow. Hydrofracturing, as documented in this study by the Qtz I and II veins, is possibly related in that context to seismic failure. Faults accommodating hydrofracturing are indeed commonly interpreted as seismogenic (e.g. Sibson, 1992a; Cox, 1995), particularly at depth.
Our study confirms this view because BFZ300 contains not only brittle fault rocks overprinting and overprinted by veins, but also clear-cut evidence of mutually overprinting brittle and ductile deformation (Fig. 6). In light of the field observations discussed and the constraints derived, we suggest that BFZ300 behaved in a seismic way at least during the emplacement of the principal Qtz I and Qtz II veins. In this perspective, two possible scenarios can be considered to explain the genetic relationships between BFZ300 and a possible seismic behaviour of the crust during the Svecofennian orogeny. In a first scenario, the quartz veins of the fault core would represent the result of coseismic rupture during the mainshocks of a fully developed seismic cycle. Pore pressure fluctuations caused the repeated transient embrittlement of the rock mass, which was otherwise under overall ductile conditions. The documented brittle–ductile cycles are thus the expression of coseismic fracturing and aseismic creep between the individual shocks, as shown by viscous deformation overprinting the brittle features, guided by the residual differential stress.
A second possibility is that faulting occurred in the absence of a well-defined sequence of mainshocks and aftershocks. As in the case of man-induced earthquakes triggered by high-pressure fluids during injection of fluids (e.g. Healy et al., 1968), whereby deformation is typically accommodated by diffuse swarms of low-magnitude seismicity rather than well-defined mainshock–aftershock sequences (Cox, 2016), we propose that BFZ300 might have localized strain by diffuse veining with crack-and-seal textures (Cox, 2016). Breccias and cataclasites (Figs. 3, 8) mutually overprinting with veins show that failure and veining were indeed broadly coeval (e.g. Cox, 1995, 2016). Healing in fluid-rich environments can occur over short periods of time (days to months) when compared with the recurrence time of large earthquakes (10–100 years) (Olsen et al., 1998; Tenthorey and Cox, 2006). Therefore, the documented repeated switches between brittle and ductile deformations would then be steered by transient episodes of fluid overpressuring but in this case would express the accommodation of swarms of minor background earthquakes within overall ductile conditions.
Microstructures of fault rocks exhumed from the brittle–ductile transition in other geological settings are mostly in agreement with our hypotheses of seismic deformation. Transient and short-term high-stress deformation followed by phases of stress relaxation, which is prevalently characterized by recovery and recrystallization processes, has been documented by several authors in deformed quartz (Trepmann and Stöckhert, 2003, 2013; Trepmann et al., 2007, 2017; Bestmann et al., 2012).
This study shows that a multi-scale and multi-technique approach leading to the generation of independent constraints offers the potential to reconstruct in detail the evolutionary history of fault zones that have experienced multiple events of reactivation triggered by fluid overpressure and in which intense fluid–rock re-equilibration processes have taken place. We document the localized, initial embrittlement of the Paleoproterozoic basement of southwestern Finland at the BDTZ, which occurred by brittle failure under overall ductile conditions in response to transiently high fluid pressure and temperature (peak conditions: Pf > 210 MPa; T∼350 ∘C). Our results further constrain the importance of cyclic seismicity and fluids in the fragmentation of Precambrian cratons when deformed at the BDTZ, something that is not yet that well understood for the Fennoscandian Shield. Our study, moreover, provides potentially important inputs to many modern geological applications, including site characterization of deep geological disposal facilities for spent nuclear fuel. Results from the detailed geological characterization of faults at the Olkiluoto site can thus be used for continuously updating the geological site description and yield further constraints on the mechanics of faulting at the BDTZ.
All the data produced and used to write the paper are contained in it and in the corresponding Supplement.
The supplement related to this article is available online at: https://doi.org/10.5194/se-10-809-2019-supplement.
GV and JM conceptualized and designed the project and performed the fieldwork. BM and PSG performed the sulfides analysis and geothermometry. BM performed the petrography, microthermometry, and Raman analysis of fluid inclusions, chlorite compositions, and geothermometry. BM and LM selected microstructures to analyse with EBSD and LM acquired EBSD maps. BM, PSG, and GV wrote the paper with contributions by JM and LM.
The authors declare that they have no conflict of interest.
We thank Oliver Vanderhaeghe and two anonymous reviewers for their constructive reviews, which led to a greatly improved paper. Stephen F. Cox, Michael Stipp, and Alfons M. Van den Kerkhof are all warmly thanked for fruitful discussions during the early stages of this work. Danilo Bersani and Andrea Risplendente are also thanked for their help with the Raman and SEM analyses. Financial support from Posiva Oy (no. 2105178) is acknowledged.
This paper was edited by Bernhard Grasemann and reviewed by Olivier Vanderhaeghe and two anonymous referees.
Aaltonen, I., Lahti, M., Engström, J., Mattila, J., Paananen, M., Paulamäki, S., Gehör, S., Kärki, A., Ahokas, T., Torvela, T., and Front, K.: Geological model of the Olkiluoto site, Version 2.0, Posiva Working Report 2010-70, Posiva Oy, Eurajoki, 2010.
Aaltonen, I., Engström, J., Front, K., Gehör, S., Kosunen, P., and Kärki, A.: Geology of Olkiluoto, Posiva Working Report 2016-16, Posiva Oy, Eurajoki, 2016.
Andersen, T., Austrheim, H., and Burke, E. A. J.: Fluid inclusions in granulites and eclogites from the Bergen Arcs, Caledonides of W. Norway, Mineral. Mag., 54, 145–158, 1990.
Ault, A. K. and Selverstone, J.: Microtextural constraints on the interplay between fluid-rock reactions and deformation, Contrib. Mineral. Petr., 156, 501–515, https://doi.org/10.1007/s00410-008-0298-9, 2008.
Bakker, R.: Re-Equilibration Processes in Fluid Inclusion Assemblages, Minerals, 7, 1–19, https://doi.org/10.3390/min7070117, 2017.
Bakker, R. J. and Jansen, J. B. H.: Preferential water leakage from fluid inclusions by means of mobile dislocations, Nature, 345, 58–60, https://doi.org/10.1038/345058a0, 1990.
Bakker, R. J. and Jansen, J. B. H.: Experimental post-entrapment water loss from synthetic CO2-H2O inclusions in natural quartz, Geochim. Cosmochim. Ac., 55, 2215–2230, https://doi.org/10.1016/0016-7037(91)90098-P, 1991.
Bakker, R. J. and Jansen, J. B. H.: A mechanism for preferential H2O leakage from fluid inclusions in quartz, based on TEM observations, Contrib. Mineral. Petr., 116, 7–20, https://doi.org/10.1007/BF00310686, 1994.
Basson, I. J. and Viola, G.: Passive kimberlite intrusion into actively dilating dyke-fracture arrays: Evidence from fibrous calcite veins and extensional fracture cleavage, Lithos, 76, 283–297, https://doi.org/10.1016/j.lithos.2004.03.041, 2004.
Bestmann, M., Pennacchioni, G., Nielsen, S., Göken, M., and de Wall, H.: Deformation and ultrafine dynamic recrystallization of quartz in pseudotachylyte-bearing brittle faults: A matter of a few seconds, J. Struct. Geol., 38, 21–38, https://doi.org/10.1016/j.jsg.2011.10.001, 2012.
Bodnar, R. J.: The origin of fluid inclusions, in: Fluid inclusions: Analysis and Interpretation, edited by: Samson, I., Anderson, A., and Marshall, D., Vancouver, Canada: Mineralogical Association of Canada, 11–18, 2003a.
Bodnar, R. J.: Re-equilibration of fluid inclusions, in: Fluid inclusions: Analysis and Interpretation, edited by: Samson, I., Anderson, A., and Marshall, D., Vancouver, Canada: Mineralogical Association of Canada, 213–230, 2003b.
Boiron, M., Cathelineau, M., Banks, D. A., Fourcade, S., and Vallance, J.: Mixing of metamorphic and surficial fluids during the uplift of the Hercynian upper crust: consequences for gold deposition, Chem. Geol., 194, 119–141, 2003.
Bons, P. D.: The formation of large quartz veins by rapid ascent of fluids in mobile hydrofractures, Tectonophysics, 336, 1–17, https://doi.org/10.1016/S0040-1951(01)00090-7, 2001.
Bons, P. D., Elburg, M. A., and Gomez-Rivas, E.: A review of the formation of tectonic veins and their microstructures, J. Struct. Geol., 43, 33–62, https://doi.org/10.1016/j.jsg.2012.07.005, 2012.
Bourdelle, F. and Cathelineau, M.: Low-temperature chlorite geothermometry: a graphical representation based on a a T–R2+–Si diagram, Eur. J. Mineral., 27, 617–626, https://doi.org/10.1127/ejm/2015/0027-2467, 2015.
Caine, J. S., Evans, J. P., and Forster, C. B.: Fault zone architechture and permeability structure, Geology, 24, 1025–1028, https://doi.org/10.1130/0091-7613(1996)024<1025, 1996.
Compton, K. E., Kirkpatrick, J. D., and Holk, G. J.: Cyclical shear fracture and viscous flow during transitional ductile-brittle deformation in the Saddlebag Lake Shear Zone, California, Tectonophysics, 708, 1–14, https://doi.org/10.1016/j.tecto.2017.04.006, 2017.
Cox, S., Knackstedt, M., and Braun, J.: Principles of structural control on permeability and fluid flow in hydrothermal systems, Rev. Econ. Geol., 14, 1–24, 2001.
Cox, S. F.: Faulting processes at high fluid pressures: An example of fault valve behavior from the Wattle Gully Fault, Victoria, Australia, J. Geophys. Res., 100, 841–859, 1995.
Cox, S. F.: Coupling between deformation, fluid pressures and fluid flow in ore-producing hydrothermal environments, Econ. Geol., 100th Anniversary Volume, 39–75, 2005.
Cox, S. F.: Injection-driven swarm seismicity and permeability enhancement: Implications for the dynamics of hydrothermal ore systems in high fluid-flux, overpressured faulting regimes – An invited paper, Econ. Geol., 111, 559–587, https://doi.org/10.2113/econgeo.111.3.559, 2016.
Crider, J. G. and Peacock, D. C. P.: Initiation of brittle faults in the upper crust: A review of field observations, J. Struct. Geol., 26, 691–707, https://doi.org/10.1016/j.jsg.2003.07.007, 2004.
De Paola, N., Collettini, C., Trippetta, F., Barchi, M. R., and Minelli, G.: A mechanical model for complex fault patterns induced by evaporite dehydration and cyclic changes in fluid pressure, J. Struct. Geol., 29, 1573–1584, https://doi.org/10.1016/j.jsg.2007.07.015, 2007.
Derez, T., Pennock, G., Drury, M., and Sintubin, M.: Low-temperature intracrystalline deformation microstructures in quartz, J. Struct. Geol., 71, 3–23, https://doi.org/10.1016/j.jsg.2014.07.015, 2015.
Diamond, L. W.: Introduction to gas-bearing, aqueous fluid inclusions, in: Fluid Inclusions: Analysis and Interpretation, edited by: Samson, I., Anderson, A., and Marshall, D., 363–372, 2003.
Diamond, L. W., Tarantola, A., and Stünitz, H.: Modification of fluid inclusions in quartz by deviatoric stress. II: Experimentally induced changes in inclusion volume and composition, Contrib. Mineral. Petr., 160, 845–864, https://doi.org/10.1007/s00410-010-0510-6, 2010.
Dubessy, J., Buschaert, S., Lamb, W., Pironon, J., and Thiéry, R.: Methane-bearing aqueous fluid inclusions: Raman analysis, thermodynamic modelling and application to petroleum basins, Chem. Geol., 173, 193–205, https://doi.org/10.1016/S0009-2541(00)00275-8, 2001.
Ehlers, C., Lindroos, A., and Selonen, O.: The late Svecofennian granite-migmatite zone of southern Finland-a belt of transpressive deformation and granite emplacement, Precambrian Res., 64, 295–309, 1993.
Fall, A., Donald, R., and Bodnar, R. J.: The effect of fluid inclusion size on determination of homogenization temperature and density of liquid-rich aqueous inclusions, Am. Mineral., 94, 1569–1579, https://doi.org/10.2138/am.2009.3186, 2009.
Famin, V., Hébert, R., Philippot, P., and Jolivet, L.: Evolution of hydrothermal regime along a crustal shear zone, Tinos Island, Greece, Tectonics, 23, TC5004, https://doi.org/10.1029/2003TC001509, 2004.
Famin, V., Hébert, R., Phillippot, P., and Jolivet, L.: Ion probe and fluid inclusion evidence for co-seismic fluid infiltration in a crustal detachment, Contrib. Mineral Petrol., 150, 354–367, https://doi.org/10.1007/s00410-005-0031-x, 2005.
Garofalo, P. S.: Mass transfer during gold precipitation within a vertically extensive vein network (Sigma deposit – Abitibi greenstone belt – Canada). Part II. Mass transfer calculations, Eur. J. Mineral., 16, 761–776, https://doi.org/10.1127/0935-1221/2004/0016-0761, 2004.
Garofalo, P. S., Matthäi, S. K., and Heinrich, C. A.: Three-dimensional geometry, ore distribution, and time-integrated mass transfer through the quartz-tourmaline-gold vein network of the Sigma deposit (Abitibi belt – Canada), Geofluids, 2, 217–232, 2002.
Garofalo, P. S., Fricker, M. B., Günther, D., Bersani, D., and Lottici, P.: Physical-chemical properties and metal budget of Au-transporting hydrothermal fluids in orogenic deposits, Geol. Soc. London, Spec. Publ., 402, 71–102, https://doi.org/10.1144/SP402.8, 2014.
Goddard, J. V. and Evans, J. P.: Chemical changes and fluid-rock interaction in faults of crystalline thrust sheets, northwestern Wyoming, USA, J. Struct. Geol., 17, 533–547, https://doi.org/10.1016/0191-8141(94)00068-B, 1995.
Goldstein, R. H.: Petrographic analysis of fluid inclusions, in: Fluid inclusions: Analysis and Interpretation: Mineralogical Association of Canada, edited by: Samson, I., Anderson, A., and Marshall, D., 1–45, 2003.
Goldstein, R. H. and Reynolds, T. J.: Fluid inclusion microthermometry, in: Systematics of fluid inclusions in diagenetic minerals – SEPM Short Course 31. SEPM (Society for Sedimentary Geology), edited by: Goldstein, R. H., Tulsa, Oklahoma, 87–121, 1994.
Gorbatschev, R. and Bogdanova, S.: Frontiers in the Baltic Shield, Precambrian Res., 64, 3–21, https://doi.org/10.1016/0301-9268(93)90066-B, 1993.
Griffith, A. A.: The Phenomena of Rupture and Flow in Solids, Philos. T. Roy. Soc. Lond., 221, 163–198, 1920.
Guermani, A. and Pennacchioni, G.: Brittle precursors of plastic deformation in a granite: An example from the Mont Blanc massif (Helvetic, western Alps), J. Struct. Geol., 20, 135–148, https://doi.org/10.1016/S0191-8141(97)00080-1, 1998.
Healy, J. H., Rubey, W. W., Griggs, D. T., and Raleigh, C. B.: The Denver Earthquakes. Disposal of waste fluids by injection into a deep well has riggered earthquakes near Denver, Colorado, Science, 161, 1301–1310, 1968.
Heinrich, C. A., Andrew, A. S., and Knill, M. D.: Regional metamorphism and ore formation: Evidence from stable isotopes and other fluid tracers, Rev. Econ. Geol., 11, 97–117, 2000.
Hey, M. H.: A new review of the chlorites, Mineral. Mag. J. M. Soc., 224, 277–292, https://doi.org/10.1180/minmag.1954.030.224.01, 1954.
Hudson, J. A. and Cosgrove, J.: Geological History and Its Impact on the Rock Mechanics Properties of the Olkiluoto Site, Posiva Working Report 2006, Posiva Oy, Eurajoki, 2006.
Invernizzi, C., Vityk, M., Cello, G., and Bodnar, R.: Fluid inclusions in high pressure/low temperature rocks from the Calabrian Arc (Southern Italy): the burial and exhumation history of the subduction-related Diamante-Terranova unit, J. Metamorph. Geol., 16, 2, 247–258, 1998.
Jaques, L. and Pascal, C.: Full paleostress tensor reconstruction using quartz veins of Panasqueira Mine, central Portugal; part I: Paleopressure determination, J. Struct. Geol., 102, 58–74, https://doi.org/10.1016/j.jsg.2017.07.006, 2017.
Kaduri, M., Gratier, J. P., Renard, F., Çakir, Z., and Lasserre, C.: The implications of fault zone transformation on aseismic creep: Example of the North Anatolian Fault, Turkey, J. Geophys. Res.-Sol. Ea., 122, 4208–4236, https://doi.org/10.1002/2016JB013803, 2017.
Kärki, A. and Paulamäki, S.: Petrology of Olkiluoto, Posiva Report 2006-02, Posiva Oy, Eurajoki, 2006.
Kerrich, R.: Some effects of tectonic recrystallisation on fluid inclusions in vein quartz, Contrib. Mineral. Petr., 59, 195–202, https://doi.org/10.1007/BF00371308, 1976.
Kjøll, H. J., Viola, G., Menegon, L., and Sørensen, B. E.: Brittle-viscous deformation of vein quartz under fluid-rich lower greenschist facies conditions, Solid Earth, 6, 681–699, https://doi.org/10.5194/se-6-681-2015, 2015.
Kohlstedt, D. L., Evans, B., and Mackwell, S. J.: Strength of the lithosphere: Constraints imposed by laboratory experiments, J. Geophys. Res., 100, 587–602, 1995.
Korja, A., Heikkinen, P., and Aaro, S.: Crustal structure of the northern Baltic Sea palaeorift, Tectonophysics, 331, 341–358, https://doi.org/10.1016/S0040-1951(00)00290-0, 2001.
Kukkonen, I. T. and Lauri, L. S.: Modelling the thermal evolution of a collisional Precambrian orogen: High heat production migmatitic granites of southern Finland, Precambrian Res., 168, 233–246, https://doi.org/10.1016/j.precamres.2008.10.004, 2009.
Lahtinen, R., Korja, A., and Nironen, M: Palaeoproterozoic tectonic evolution, in: Precambrian Geology of Finland: Key to the Evolution of the Fennoscandian Shield, edited by: Lehtinen, M., Nurmi, P. A., and Rämö, O. T., Developments in Precambrian Geology, 2005.
Mancktelow, N. S. and Pennacchioni, G.: The influence of grain boundary fluids on the microstructure of quartz-feldspar mylonites, J. Struct. Geol., 26, 47–69, https://doi.org/10.1016/S0191-8141(03)00081-6, 2004.
Mancktelow, N. S. and Pennacchioni, G.: The control of precursor brittle fracture and fluid-rock interaction on the development of single and paired ductile shear zones, J. Struct. Geol., 27, 645–661, https://doi.org/10.1016/j.jsg.2004.12.001, 2005.
Mattila, J. and Viola, G.: New constraints on 1.7Gyr of brittle tectonic evolution in southwestern Finland derived from a structural study at the site of a potential nuclear waste repository (Olkiluoto Island), J. Struct. Geol., 67, 50–74, https://doi.org/10.1016/j.jsg.2014.07.003, 2014.
Menegon, L., Pennacchioni G., Malaspina N., Harris K., and Wood E.: Earthquakes as Precursors of Ductile Shear Zones in the Dry and Strong Lower Crust, Geochem. Geophy. Geosy., 18, 4356–4374, https://doi.org/10.1002/2015GC006010, 2017.
Menegon, L., Marchesini, B., Prando, F., Garofalo, P. S., Viola, G., Anderson, M., and Mattila, J.: Brittle-viscous oscillations and different slip behaviours in a conjugate set of strike-slip faults, Geophys. Res., Abstracts Vol. 20, EGU2018-14799, 2018.
Miller, S. A.: The Role of Fluids in Tectonic and Earthquake Processes, edited by: Dmowska, R., Elsevier, 2013.
Mittempergher, S., Dallai, L., Pennacchioni, G., Renard, F., and Di Toro, G.: Origin of hydrous fluids at seismogenic depth: Constraints from natural and experimental fault rocks, Earth Planet. Sc. Lett., 385, 97–109, https://doi.org/10.1016/j.epsl.2013.10.027, 2014.
Moritz, R., Ghazban, F., and Singer, B. S.: Eocene Gold Ore Formation at Muteh, Sanandaj-Sirjan Tectonic Zone, Western Iran: A Result of Late-Stage Extension and Exhumation of Metamorphic Basement Rocks within the Zagros Orogen, Econ. Geol., 101, 1–28, 2006.
Morrison, J.: Meteoric water-rock interaction in the lower plate of the Whipple Mountain metamorphic core complex, California, J. Metamorph. Geol., 12, 827–840, 1994.
Morrison, J. and Anderson, J. L.: Footwall Refrigeration Along a Detachment Fault: Implications for the Thermal Evolution of Core Complexes, Science, 279, 63–67, 1998.
Mulch, A., Teyssier, C., Cosca, M. A., Vanderhaeghe, O., and Vennemann, T. W.: Reconstructing paleoelevation in eroded orogens, 6, 525–528, https://doi.org/10.1130/G20394.1, 2004.
Nekrasov, I. J., Sorokin, V. I., and Osadchii, E. G.: Fe and Zn partitioning between stannite and sphalerite and its application in geothermometry, Phys. Chem. Earth, 11, 739–742, https://doi.org/10.1016/0079-1946(79)90069-7, 1979.
Oliver, N. H. S. and Bons P. D.: Mechanisms of fluid flow and fluid–rock interaction in fossil metamorphic hydrothermal systems inferred from vein–wallrock patterns, geometry and microstructure, Geofluids, 1, 137–162, 2001.
Olsen, M. P., Scholz, C. H., and Léger, A.: Healing and sealing of a simulated fault gouge under hydrothermal conditions: Implications for fault healing, J. Geophys. Res., 103, 7421, https://doi.org/10.1029/97JB03402, 1998.
Pennacchioni, G., Di Toro, G., Brack, P., Menegon, L., and Villa, I. M.: Brittle-ductile-brittle deformation during cooling of tonalite (Adamello, Southern Italian Alps), Tectonophysics, 427, 171–197, https://doi.org/10.1016/j.tecto.2006.05.019, 2006.
Prando, F., Menegon, L., Anderson, M. W., Marchesini, B., Mattila, J., and Viola, G.: Fluid-mediated, brittle-ductile deformation at seismogenic depth: Part 2 – The microstructural record of oscillations of differential stress and fluid pressure in a shear zone in a nuclear waste repository (Olkiluoto Island, Finland), Solid Earth, in preparation, 2019.
Roedder, E.: Fluid Inclusions, Mineralogical Society of America, 1984.
Roedder, E. and Bodnar, R. J.: Geologic determinations from fluid inclusion studies, Annu. Rev. Earth Planet. Sc., 8, 263–301, 1980.
Rolandone, F. and Jaupart, C.: The distributions of slip rate and ductile deformation in a strike-slip shear zone, Geophys. J. Int., 148, 179–192, https://doi.org/10.1046/j.1365-246X.2002.01574.x, 2002.
Rosso, K. M. and Bodnar, R. J.: Microthermometric and Raman spectroscopic detection limits of CO2 in fluid inclusions and the Raman spectroscopic characterization of CO2, Geochim. Cosmochim. Ac., 59, 3961–3975, https://doi.org/10.1016/0016-7037(95)94441-H, 1995.
Scheffer, C., Tarantola, A., Vanderhaeghe, O., Rigaudier, T., and Photiades, A.: CO2 flow during orogenic gravitational collapse: Syntectonic decarbonation and fl uid mixing at the ductile-brittle transition, Chem. Geol., 450, 248–263, https://doi.org/10.1016/j.chemgeo.2016.12.005, 2017a.
Scheffer, C., Tarantola, A., Vanderhaeghe, O., Voudouris, P., Rigaudier, T., Photiades, A., Morin, D., and Alloucherie, A.: The Lavrion Pb-Zn-Fe-Cu-Ag detachment-related district (Attica, Greece): Structural control on hydrothermal flow and element transfer-deposition, Tectonophysics, 717, 607–627, https://doi.org/10.1016/j.tecto.2017.06.029, 2017b.
Selverstone, J., Franz, G., Thomas, S., and Getty, S.: Fluid variability in 2 GPa eclogites as an indicator of fluid behavior during subduction, Contrib. Mineral. Petr., 112, 341–357, 1992.
Selverstone, J., Axen, G. J., and Bartley, J. M: Fluid inclusion constraints on the kinematics of footwall uplift beneath the Brebber Line normal fault, estern Alps, Tectonics, 14, 264–278, 1995.
Shimizu, M. and Shikazono, N.: Iron and zinc partitioning between coexisting stannite and sphalerite: a possible indicator of temperature and sulfur fugacity, Miner. Deposita, 20, 314–320, 1985.
Scholz, C. H.: The Mechanics of Earthquakes and Faulting, Cambridge, Cambridge University Press, 1990.
Sibson, R. H.: Earthquake faulting as a structural process, J. Struct. Geol., 11, 1–14, https://doi.org/10.1016/0191-8141(89)90032-1, 1989.
Sibson, R. H.: Fault-valve behavior and the hydrostatic-lithostatic fluid pressure interface, Earth Sci. Rev., 32, 141–144, https://doi.org/10.1016/0012-8252(92)90019-P, 1992a.
Sibson, R. H.: Implications of fault-valve behaviour for rupture nucleation and recurrence, Tectonophysics, 211, 283–293, 1992b.
Sibson, R. H.: Load-strengthening versus load-weakening faulting, J. Struct. Geol., 15, 123–128, https://doi.org/10.1016/0191-8141(93)90090-W, 1993.
Sibson, R. H.: Structural permeability of fluid-driven fault-fracture meshes, J. Struct. Geol, 18, 1031–1042, https://doi.org/10.1016/0191-8141(96)00032-6, 1996.
Sibson, R. H., Robert, F., and Poulsen, K. H.: High-angle reverse faults, fluid-pressure cycling, and mesothermal gold-quartz deposits, Geology, 16, 551–555, https://doi.org/10.1130/0091-7613(1988)016<0551:HARFFP>2.3.CO;2, 1988.
Siebenaller, L., Boiron, M. C., Vanderhaeghe, O., Hibsch, C., Jessell, M. W., Andre-Mayer, A. S., France-Lanord, C., and Photiades, A.: Fluid record of rock exhumation across the brittle-ductile transition during formation of a Metamorphic Core Complex (Naxos Island, Cyclades, Greece), J. Metamorph. Geol., 31, 313–338, https://doi.org/10.1111/jmg.12023, 2013.
Siebenaller, L., Vanderhaeghe, O., Jessell, M., Boiron, M. C., and Hibsch, C.: Syntectonic fluids redistribution and circulation coupled to quartz recrystallization in the ductile crust (Naxos Island, Cyclades, Greece), J. Geodyn., 101, 129–141, https://doi.org/10.1016/j.jog.2016.07.001, 2016.
Skyttä, P. and Torvela, T.: Brittle reactivation of ductile precursor structures: The role of incomplete structural transposition at a nuclear waste disposal site, Olkiluoto, Finland, J. Struct. Geol., 116, 253–259, https://doi.org/10.1016/j.jsg.2018.06.009, 2018.
Spruzeniece, L. and Piazolo, S.: Strain localization in brittle-ductile shear zones: fluid-abundant vs. fluid-limited conditions (an example from Wyangala area, Australia), Solid Earth, 6, 881–901, https://doi.org/10.5194/se-6-881-2015, 2015.
Steele-MacInnis, M., Lecumberri-Sanchez, P., and Bodnar, R. J.: HokieFlincs_H2O-NaCl: A Microsoft Excel spreadsheet for interpreting microthermometric data from fluid inclusions based on the PVTX properties of H2O-NaCl, Comput. Geosci., 49, 334–337, https://doi.org/10.1016/j.cageo.2012.01.022, 2012.
Sterner, S. M. and Bodnar J.: Synthetic fluid inclusions – VII. Re-equilibration of fluid inclusions in quartz during laboratory-simulated metamorphic burial and uplift, J. Metamorph. Geol., 7, 243–260, 1989.
Suominen, V.: The chronostratigraphy of southern Finland, with special reference to Postjotnian and Subjotnian diabases, Bull. Geol. Surv. Finl., 356, 100, 1991.
Tarantola, A., Diamond, L. W., and Stünitz, H.: Modification of fluid inclusions in quartz by deviatoric stress I: Experimentally induced changes in inclusion shapes and microstructures, Contrib. Mineral. Petr., 160, 825–843, https://doi.org/10.1007/s00410-010-0509-z, 2010.
Tchalenko, J. S.: Similarities between Shear Zones of Different Magnitudes, Geol. Soc. Am. Bull., 81, 1625–1640, https://doi.org/10.1130/0016-7606(1970)81[1625:SBSZOD]2.0.CO;2, 1970.
Tenthorey, E. and Cox, S. F.: Cohesive strengthening of fault zones during the interseismic period: An experimental study, J. Geophys. Res.-Sol. Ea., 111, 1–14, https://doi.org/10.1029/2005JB004122, 2006.
Trepmann, C. A. and Stöckhert, B.: Quartz microstructures developed during non-steady state plastic flowat rapidly decaying stress and strain rate, J. Struct. Geol., 25, 2035–2051, https://doi.org/10.1016/S0191-8141(03)00073-7, 2003.
Trepmann, C. A. and Stöckhert, B.: Short-wavelength undulatory extinction in quartz recording coseismic deformation in the middle crust – an experimental study, Solid Earth, 4, 263–276, https://doi.org/10.5194/se-4-263-2013, 2013.
Trepmann, C. A., Stöckhert, B., Dorner, D., Moghadam, R. H., Küster, M., and Röller, K.: Simulating coseismic deformation of quartz in the middle crust and fabric evolution during postseismic stress relaxation – An experimental study, Tectonophysics, 442, 83–104, https://doi.org/10.1016/j.tecto.2007.05.005, 2007.
Trepmann, C. A., Hsu, C., Hentschel, F., Döhler, K., Schneider, C., and Wichmann, V.: Recrystallization of quartz after low-temperature plasticity – The record of stress relaxation below the seismogenic zone, J. Struct. Geol., 95, 77–92, https://doi.org/10.1016/j.jsg.2016.12.004, 2017.
Van Noten, K., Muchez, P., and Sintubin, M.: Stress-state evolution of the brittle upper crust during compressional tectonic inversion as defined by successive quartz vein types (High-Ardenne slate belt, Germany), J. Geol. Soc. London, 168, 407–422, https://doi.org/10.1144/0016-76492010-112.Stress-state, 2011.
Van den Kerkhof, A., Kronz, A., and Simon, K.: Deciphering fluid inclusions in high-grade rocks, Geosci. Front., 5, 683–695, https://doi.org/10.1016/j.gsf.2014.03.005, 2014.
Viola, G., Mancktelow, N. S., and Miller, J. A.: Cyclic frictional-viscous slip oscillations along the base of an advancing nappe complex: Insights into brittle-ductile nappe emplacement mechanisms from the Naukluft Nappe Complex, central Namibia, Tectonics, 25, 1–20, https://doi.org/10.1029/2005TC001939, 2006.
Viola, G., Venvik Ganerød, G., and Wahlgren, C. H.: Unraveling 1.5 Ga of brittle deformation history in the Laxemar-Simpevarp area, southeast Sweden: A contribution to the Swedish site investigation study for the disposal of highly radioactive nuclear waste, Tectonics, 28, 1–29, https://doi.org/10.1029/2009TC002461, 2009.
Viola, G., Mattila, J., Zwingmann, H., Todd, A., and Raven, M.: Structural and K/Ar Illite Geochronological Constraints on the Brittle Deformation History of the Olkiluoto Region, Southwest Finland, Posiva Working Report 2011, Posiva Oy, Eurajoki, 2011.
Viola, G., Scheiber, T., Fredin, O., Zwingmann, H., Margreth, A., and Knies, J.: Deconvoluting complex structural histories archived in brittle fault zones, Nat. Commun., 7, 1–10, https://doi.org/10.1038/ncomms13448, 2016.
Vityk, M. O. and Bodnar, R. J.: Textural evolution of synthetic fluid inclusions in quartz during reequilibration, with applications to tectonic reconstruction, Contrib. Mineral. Petr., 121, 309–323, https://doi.org/10.1007/BF02688246, 1995.
Vityk, M. O. and Bodnar, R. J.: Statistical microthermometry of synthetic fluid inclusions in quartz during decompression reequilibration, Contrib. Mineral. Petr., 132, 149–162, https://doi.org/10.1007/s004100050413, 1998.
Vityk, M. O., Bodnar, R. J., and Schmidt, C. S.: Fluid inclusion as a tectonothermobarometers: Relation between pressure-tempreture history and reequilibration morphology during crystal thickening, Geology, 22, 731–734, https://doi.org/10.1130/0091-7613(1994)022<0731:FIATRB>2.3.CO, 1994.
Wehrens, P., Berger, A., Peters, M., Spillmann, T., and Herwegh, M.: Deformation at the frictional-viscous transition: Evidence for cycles of fluid-assisted embrittlement and ductile deformation in the granitoid crust, Tectonophysics, 693, 66–84, https://doi.org/10.1016/j.tecto.2016.10.022, 2016.
Wilkins, R. W. T. and Barkas, J. P.: Fluid inclusions, Deformation and Recrystallization in Granite Tectonites, Contrib. Mineral. Petrol., 65, 293–299, 1978.