the Creative Commons Attribution 4.0 License.
the Creative Commons Attribution 4.0 License.
 | 04 Jun 2020
On the self-regulating effect of grain size evolution in mantle convection models: application to thermochemical piles
Jana Schierjott
Antoine Rozel
Paul Tackley
Seismic studies show two antipodal regions of lower shear velocity at the core–mantle boundary (CMB) called large low-shear-velocity provinces (LLSVPs). They are thought to be thermally and chemically distinct and therefore might have a different density and viscosity than the ambient mantle. Employing a composite rheology, using both diffusion and dislocation creep, we investigate the influence of grain size evolution on the dynamics of thermochemical piles in evolutionary geodynamic models. We consider a primordial layer and a time-dependent basalt production at the surface to dynamically form the present-day chemical heterogeneities, similar to earlier studies, e.g. by Nakagawa and Tackley (2014).
Our results show that, relative to the ambient mantle, grain size is higher inside the piles, but, due to the high temperature at the CMB, the viscosity is not remarkably different from ambient mantle viscosity. We further find that although the average viscosity of the detected piles is buffered by both grain size and temperature, the viscosity is influenced predominantly by grain size. In the ambient mantle, however, depending on the convection regime, viscosity can also be predominantly controlled by temperature.
All pile properties, except for temperature, show a self-regulating behaviour: although grain size and viscosity decrease when downwellings or overturns occur, these properties quickly recover and return to values prior to the downwelling. We compute the necessary recovery time and find that it takes approximately 400 Myr for the properties to recover after a resurfacing event. Extrapolating to Earth values, we estimate a much smaller recovery time.
We observe that dynamic recrystallisation counteracts grain growth inside the piles when downwellings form. Venus-type resurfacing episodes reduce the grain size in piles and ambient mantle to a few millimetres. More continuous mobile-lid-type downwellings limit the grain size to a centimetre. Consequently, we find that grain-size-dependent viscosity does not increase the resistance of thermochemical piles to downgoing slabs. Mostly, piles deform in grain-size-sensitive diffusion creep, but they are not stiff enough to counteract the force of downwellings. Hence, we conclude that the location of subduction zones could be responsible for the location and stability of the thermochemical piles of the Earth because of dynamic recrystallisation.
- Article
(9336 KB) - Full-text XML
- BibTeX
- EndNote


Seismic studies show two antipodal regions of low shear velocity at the core–mantle boundary (CMB): one beneath the Pacific and one beneath parts of Africa and the Atlantic (Ritsema et al., 2011; Lekic et al., 2012; Garnero et al., 2016). These regions, called large low-shear-velocity provinces (LLSVPs), are thought to be thermally and chemically distinct and thus differ in density and viscosity from the surrounding material (Masters et al., 2000; Ishii and Tromp, 1999; Trampert et al., 2004).
The shape of LLSVPs is relatively well constrained thanks to seismic tomography models. They consistently reveal a roundish shape for the Pacific LLSVP and an overall north–south elongated form for the African LLSVP (Ritsema et al., 1999; Kuo et al., 2000). In total LLSVPs cover around 20 %–50 % of the area at the CMB (Burke et al., 2008; Garnero and McNamara, 2008) and make up roughly between 1.6 % and 2.4 % of the total mantle volume (Burke et al., 2008; Hernlund and Houser, 2008). The African LLSVP extends upward from the CMB about 1000 km; the height of the Pacific one is less well constrained but is in any case smaller with about 400–500 km of upward extension (Garnero and McNamara, 2008). Following Torsvik et al. (2006, 2010), LLSVPs have not changed their position for at least 200 Myr, possibly up to 540 Myr.
Apart from the geometry, other properties of LLSVPs are not that well defined. The negative correlation between bulk sound speed and shear wave velocity suggests a chemical origin (Masters et al., 2000; Trampert et al., 2004; Davaille et al., 2005) of LLSVPs. Normal-mode data support a density increase of a few percent compared to the ambient mantle (Ishii and Tromp, 1999; Trampert et al., 2004). Recently though, Koelemeijer et al. (2016) proposed that LLSVPs might rather have a reduced density. By analysing deep mantle-sensitive Stoneley-mode data in a joint P- and S-wave inversion, this recent work showed that LLSVPs, except for their roots, could have a decreased density of up to −0.88 % compared to the radial average. Chemical heterogeneities and the presence of post-perovskite (pPv) and its interplay with the thermal boundary layer could explain the observations.
Laboratory studies, e.g. by Davaille et al. (2005), are able to mimic the 3D complexity of LLSVPs and, as numerical models, provide insight into the development over time. Seismological studies, on the other hand, can only provide information on LLSVPs for the current time snapshot. Davaille et al. (2005) emphasised in their work that the presently observed upwellings might be all of transient nature and that all types such as plumes, LLSVPs, hot spots, superswells and traps might represent different stages of the same evolving thermochemical instability. Nevertheless, they also suggest that the upwellings are of different chemical composition.
In numerical studies, both a lower (e.g. McNamara and Zhong, 2005) and a higher viscosity (e.g. McNamara and Zhong, 2004) have been investigated. We learn from McNamara and Zhong (2004) that the viscosity contrast between different components could well be the main control on how the piles in the lowermost mantle are organised. In their study they find that an intrinsic viscosity increase of dense material in the bottom of the mantle yields fewer but larger piles than only a temperature-dependent rheology. However, most of the works on thermochemical piles have in common that viscosity is treated as depth dependent and/or temperature dependent.
Generally, only very few whole-Earth geodynamic studies have considered a composite or even grain-size-dependent viscosity (Hall and Parmentier, 2003; Solomatov, 2001; Solomatov and Reese, 2008; Dannberg et al., 2017). A study by Solomatov (2001) demonstrated that the physical laws behind grain growth in the lower mantle, such as volume diffusion or grain boundary diffusion, could strongly influence the thermal evolution of the Earth. Hall and Parmentier (2003) investigated the impact of grain size evolution on the onset time of small-scale convection to apply it to the upper mantle of the Earth. Solomatov and Reese (2008) first illustrated with convection simulations that the 660 km discontinuity strongly decreases the grain size, which tends to stabilise the viscosity profile. Obtaining a viscosity profile comparable to that of the Earth was not attempted. Dannberg et al. (2017) ran mantle convection simulations with a composite rheology and grain size evolution using rheological parameters obtained from a combination of laboratory experiments and trial and error. A realistic viscosity profile was obtained for the relatively short time span of their simulations (a few tens or hundreds of millions of years) using forced surface velocities. Dannberg et al. (2017) were thus able to study the effect of grain size evolution on physically observable characteristics of the mantle, but they did not attempt to self-consistently reproduce the convection regime of the Earth nor the existence of LLSVPs.
Although numerical modellers have by now included grain-size-dependent viscosity in several studies, the idea originates from experimentalists, who have shown how important it might be to consider grain size evolution in the viscosity formulation (Karato and Wu, 1993; Karato, 2010). In experiments they observe grain size reduction under high strain (e.g. Karato et al., 1993) and grain growth when conditions favour high grain boundary energy (Karato, 1989). In times of high stress and strain rate, dynamic recrystallisation operates, leading to a smaller grain size and shifting the deformation regime from dislocation to diffusion creep. As a result, regions under the influence of a high work rate exhibit a lower viscosity than the surrounding regions (Warren and Hirth, 2006).
Karato et al. (1995) suggest that most parts of the lower mantle likely deform under diffusion creep due to the absence of shear wave splitting. However, several other studies indicate that in many regions dislocation creep is active (Lay et al., 1998; McNamara et al., 2001). Poirier et al. (1983) and Cordier et al. (2004) suggested dislocation creep as the deforming mechanism for the perovskite phase in the uppermost lower mantle and McNamara et al. (2001) for regions around downwellings. Therefore, it would be worth not only considering grain-size-dependent diffusion creep but also a composite rheology formulation involving both diffusion and dislocation creep. Since dislocation creep is favoured when grain sizes are large, in the region along the CMB, hot upwellings and plumes might rather deform in dislocation creep because temperature and stresses are high (Solomatov and Moresi, 1996; Karato and Rubie, 1997; Solomatov et al., 2002; Korenaga, 2005).
The wide range of proposed possibilities in terms of composition, viscosity and density of LLSVPs convinced us to apply the grain-size-dependent composite-viscosity formulation implemented in the global convection code StagYY for studying the effects on the development of LLSVPs. We study how thermochemical piles behave in the dynamic system of mantle convection using simulations evolving over 4.5 billion years. We investigate whether piles behave as obstacles to convection or whether they get pushed around. Identified average properties of piles give us information about their reaction to different convection regimes. However, we only focus on large-scale processes and quantities as we do not have the resolution necessary to study small-scale features. Instead we provide long-term evolutionary simulations that approximate in a first attempt the influence of grain size evolution on pile behaviour and on general mantle viscosity.
2.1 Set-up
Apart from the rheology, our model set-up is very similar to the model used by Nakagawa and Tackley (2014). The composition of the mantle consists of 80 % harzburgite and 20 % basalt. In other words, the pyrolitic composition is a mechanical mixture of 60 % olivine and 40 % pyroxene-garnet phases. Phase transition depths, temperatures, densities and Clapeyron slopes for the independent olivine and pyroxene-garnet phases can be found in Table 1. Additionally, we impose a primordial layer with physical properties similar to pyroxene-garnet at the base of the mantle. The initial temperature at the CMB is set to 5000 K and at the surface to 300 K.
Further, melting and crustal production in the simplified two-phase system is included. Melting helps with buffering the internal temperature of the Earth (Armann and Tackley, 2012) and affects the tectonic regime as it generates compositional heterogeneities (Lourenço et al., 2016, 2018). Typically, melting of the pyrolitic mantle locally produces a melt of basaltic composition and a solid residue more enriched in harzburgite than the source rock. In each cell, the melt fraction is obtained by comparing the temperature to the solidus temperature (see Table 1) and using a latent heat of 600 kJ kg−1. The solidus temperature Ts is a function of depth and composition:
where Td is a depth-dependent solidus temperature, d is depth (in km), ΔTc is a composition-dependent temperature adjustment to Td, erfc is the complementary error function and cb is the fraction of solid in the cell that has a basaltic composition. If the melt is generated at a depth lower or equal to 300 km, it is either erupted at the surface of the model or intruded at the base of the crust. Heat-producing elements are initially homogeneously distributed in the computational domain (see Table 1). When melting occurs, heat sources are partitioned between melt and solid using a partitioning coefficient Dp=0.1. This makes the basaltic melt more enriched in radioactive elements than the remaining depleted residue. When the melt is erupted, it is assumed to instantly cool to surface temperature. When the melt is intruded, only adiabatic cooling is subtracted from it while it is brought upward. Intruded material is therefore warmer than the ambient lithosphere, which results in lithosphere weakening. We use a constant partitioning of eruption as opposed to intrusion. The fraction of eruption is called “eruption efficiency” (er) and has been shown to have a strong influence on the thermal states of both mantle and lithosphere (Lourenço et al., 2018). In conjunction with testing the eruption efficiency, we test more parameters that influence the convection regime such as the yield stress (τy) and the yield stress gradient ().
Table 1List of grain-size-related and general model set-up parameters. Grain size parameters are taken from Yamazaki et al. (2005).
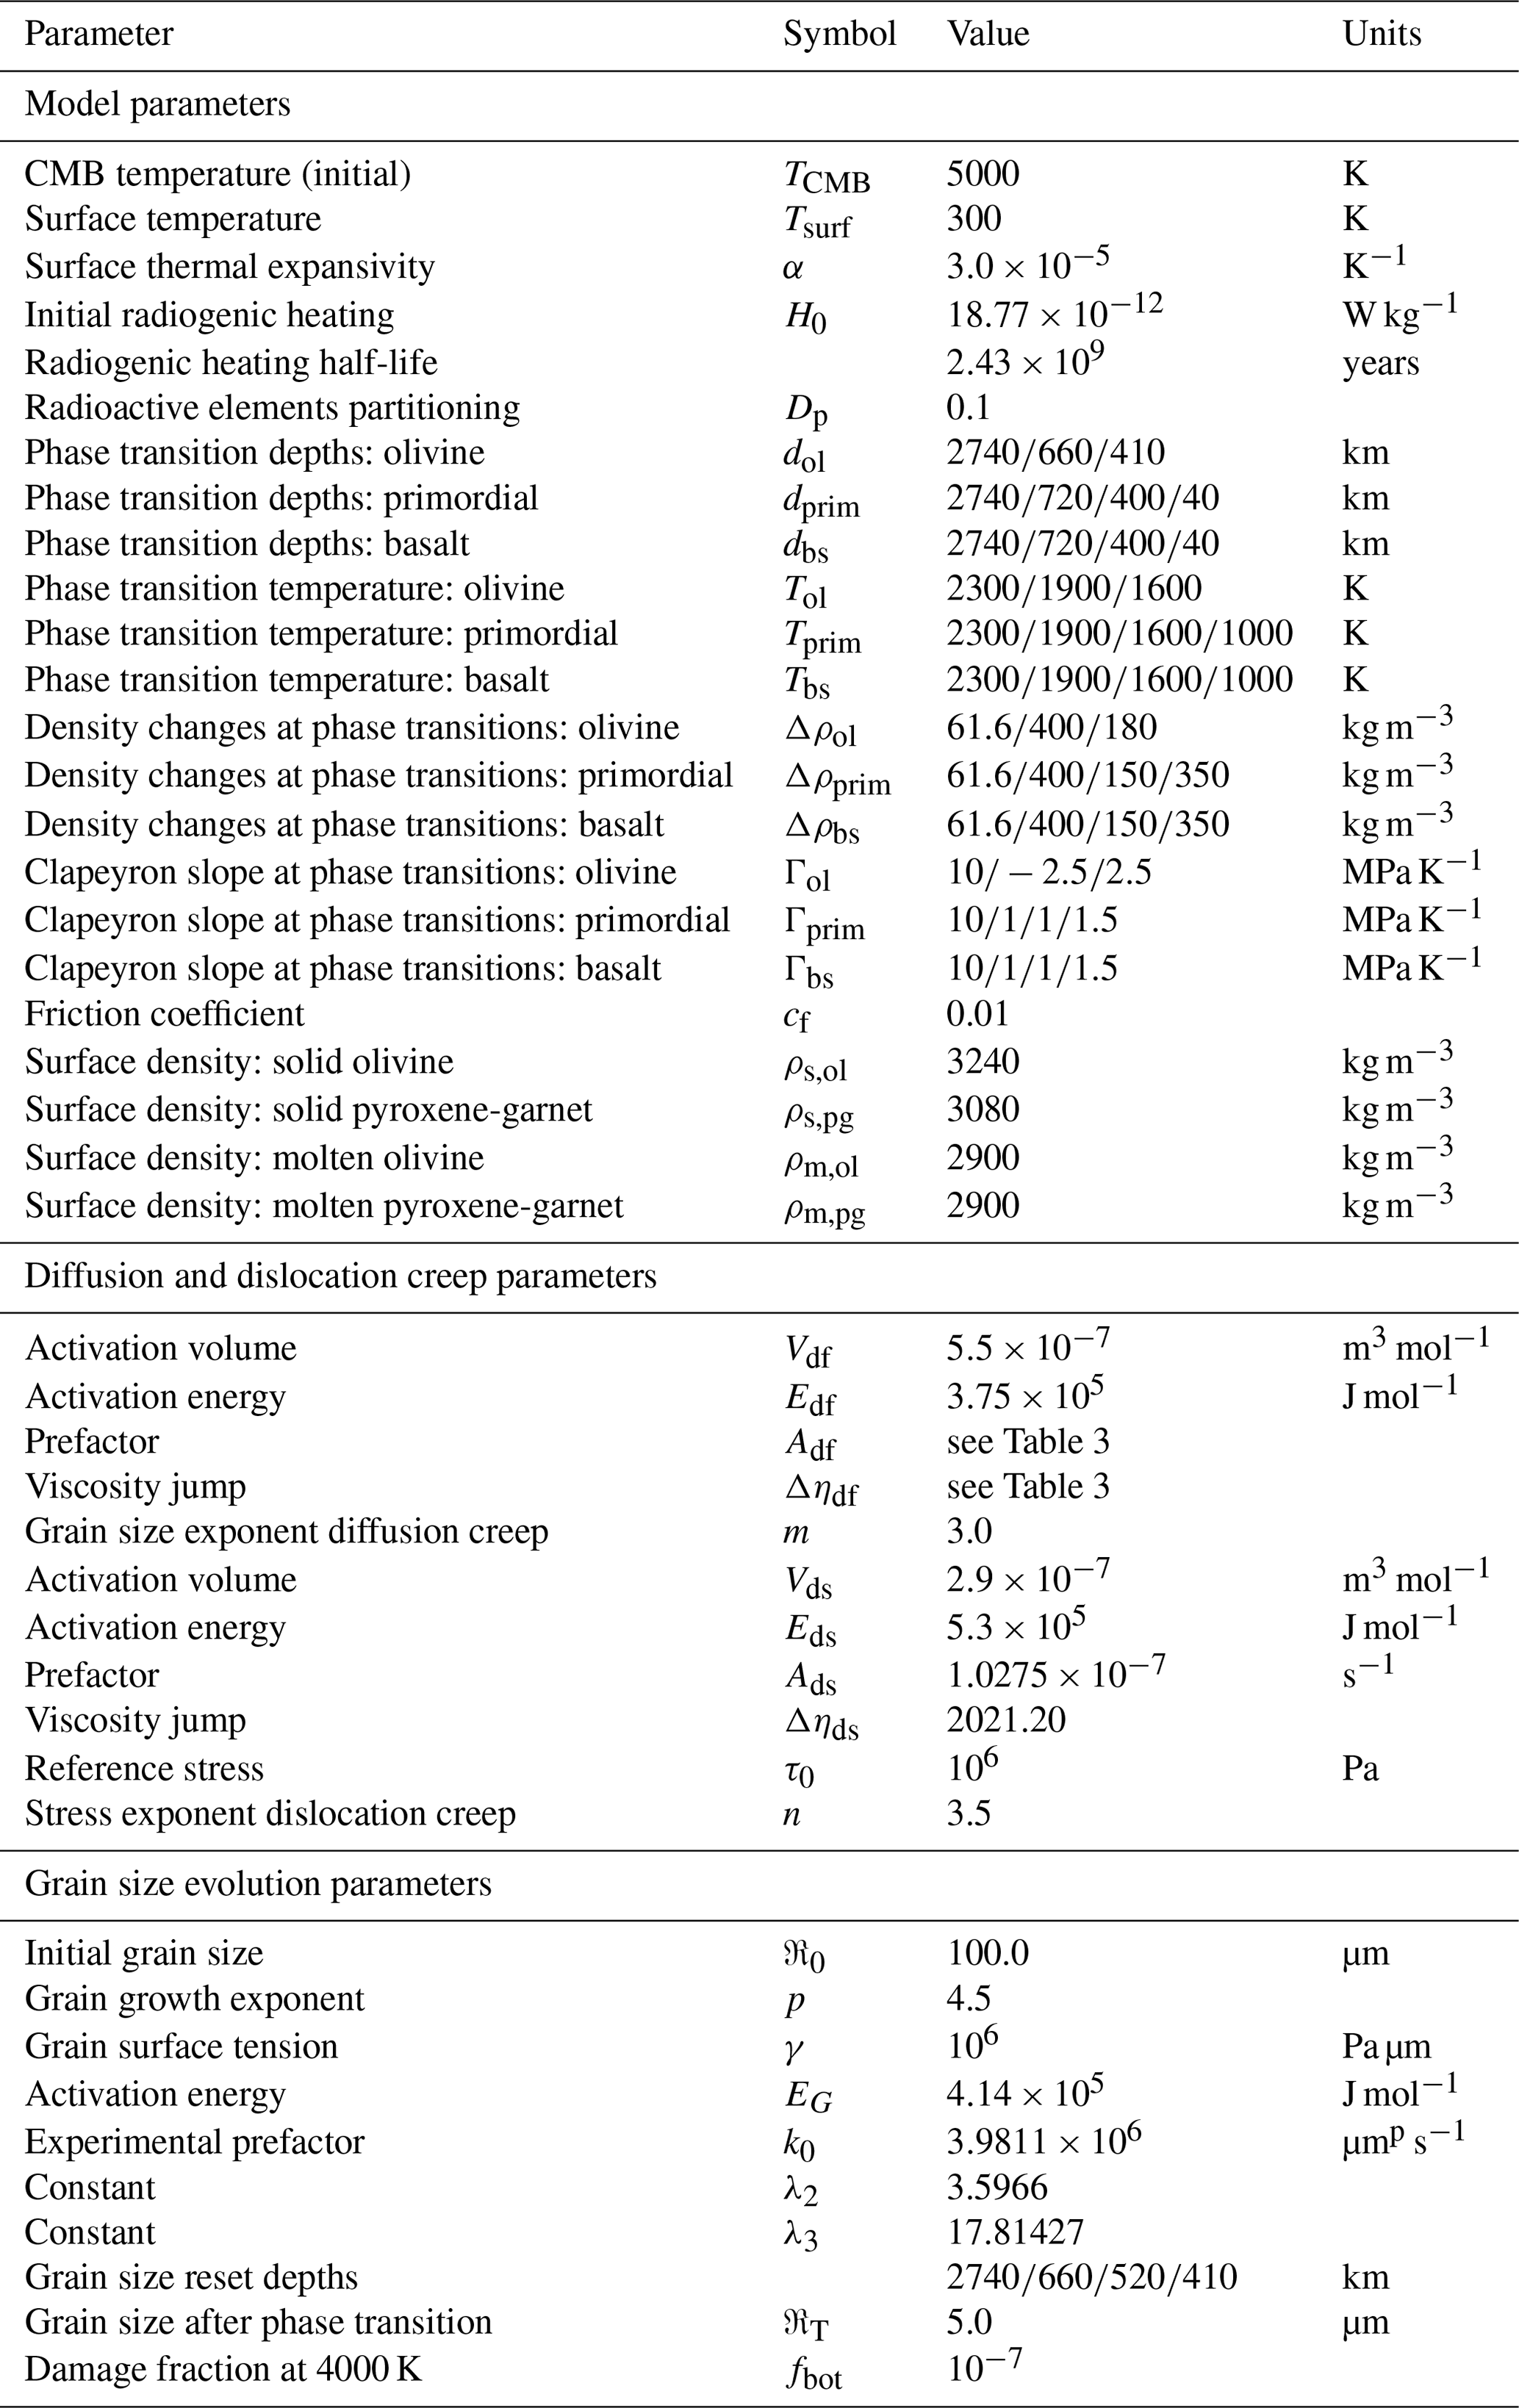
To account for the compressibility of mantle material, we use a third-order Birch–Murnaghan equation of state. A detailed explanation and list of parameters can be found in Tackley et al. (2013). All solid phases have a bulk modulus of 210 GPa in the lower mantle, 85 GPa in the transition zone and a bulk modulus of 163 GPa in regions shallower than the transition zone. Solid phases also have a bulk modulus gradient, which is 3.9 in the lower mantle and 4 everywhere else. A Grüneisen parameter of 0.85 is used in the transition zone and 1.3 everywhere else. Molten phases (molten basalt/eclogite and molten harzburgite) have everywhere a bulk modulus of 30 GPa, a bulk modulus gradient of 6 and a Grüneisen parameter of 0.6. The surface densities of each phase are given in Table 1.
To study the evolution of large low-shear-velocity provinces (LLSVPs), we impose a 200 km thick basal primordial layer along the CMB at the beginning of the runs. The physical properties of the primordial layer are the same as basalt but with a different viscosity (see Eq. 5) and density (Table 1 and 2). In order to test the dynamic effect of the density of primordial material, we vary its surface value. When ρprim=3080 kg m−3, the primordial material has the same density as the basalt phase. When ρprim=3140 kg m−3, the primordial material is 60 kg m−3 denser than the basalt/eclogite phase (all the way between the surface and the CMB).
In addition to pile-related parameters, we test various intensities of dynamic recrystallisation, by using different values for its prefactor (see term ftop in Eq. 13), and the diffusion creep efficiency in the upper and lower mantle (χUM and χLM) to investigate their effect on mantle convection in general (Table 2).

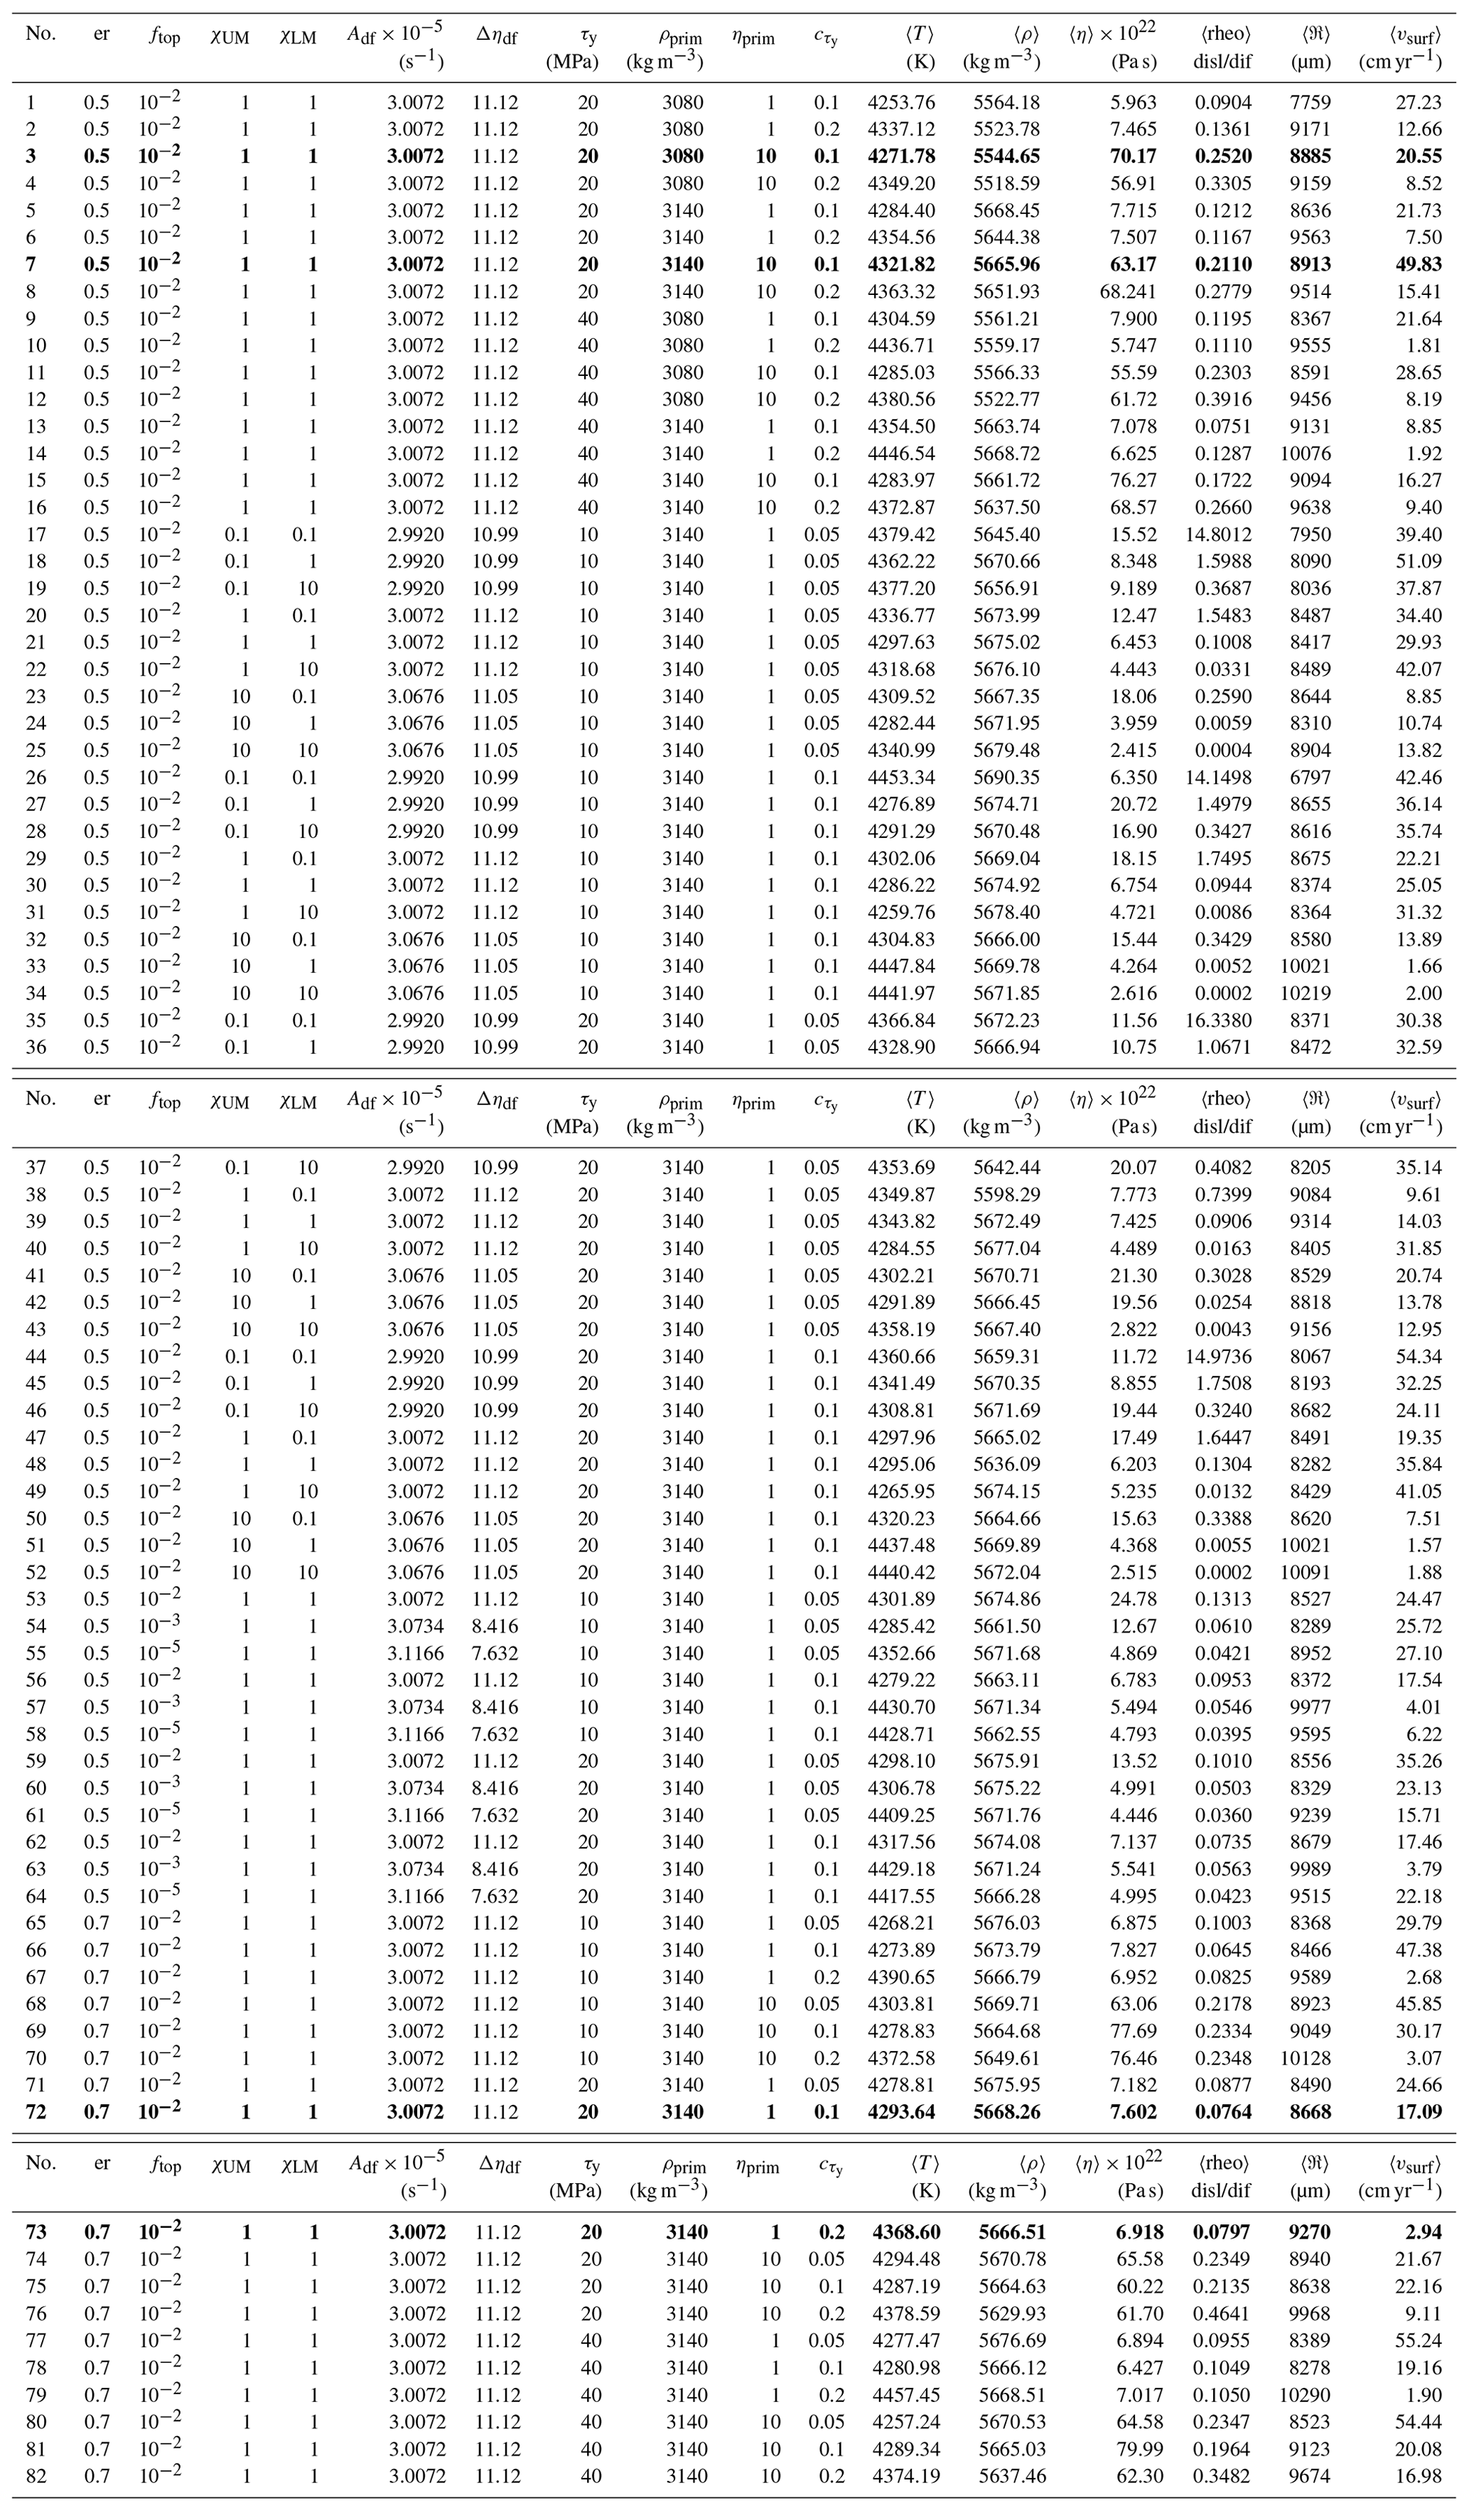
A compilation of all models can be found in Table . The bold-marked models are used for specific figures in the Results section. We emphasise that the used simulations either represent average observations or show the extreme. Generally, the Results section shows that the effective quantities such as viscosity, grain size, rheology and stress in the deep mantle weakly depend on the input parameters. This can be understood by the interesting presence of self-regulating processes as discussed in the Results section.
Table 3All simulations with input parameters and resulting pile properties and surface velocities averaged over the whole simulation period of 4.5 Gyr. ρprim=3080 kg m−3 and ρprim=3140 kg m−3 are the densities of the primordial material at surface. The bold values mark the simulations that we use in the figures.
2.2 Conservation of mass, momentum and energy
We use a thermomechanical modelling approach in 2D spherical annulus geometry (Hernlund and Tackley, 2008) to model the development and evolution of thermochemical piles along the CMB. We solve the conservation equations for a compressible fluid using a finite difference method on a fully staggered grid (Tackley, 2008; Hernlund and Tackley, 2008). Pressure, density and viscosity are defined in the cell centres, whereas velocities are placed on the cell edges. Temperature, composition, grain size and additional material attributes are tracked using Lagrangian tracers which are moved according to the velocity field and extrapolated to the cell centres. The computational domain consists of 512×64 cells, with a radially varying resolution which is higher at the surface, the 660 km phase transition and along the CMB.
In the anelastic approximation, density, expansivity, diffusivity and heat capacity are functions of depth, and the Prandtl number is considered infinite (Tackley, 2008). Mass conservation is written as
with velocity v and density ρ.
The equation for conservation of momentum is
where τ is the deviatoric stress tensor; P is pressure; density depends on composition C, temperature T, and radius r; and g is the gravitational acceleration.
Conservation of energy is defined as
with radial velocity vr, internal heating rate per unit mass H, specific heat capacity Cp, κ as the thermal conductivity, α as thermal expansivity and Ψ as the mechanical work. This is defined as the contraction of the stress and strain rate tensors: . The first term on the right-hand side is the heat production/consumption due to adiabatic (de)compression, the second term describes heat diffusion, the third term contributes radiogenic heating and the fourth term adds viscous dissipation during non-elastic deformation processes (Ismail-Zadeh and Tackley, 2010). The viscosity η varies with temperature, depth, strain rate or stress, composition, and grain size. For details on our viscosity formulation, see the following sections.
2.3 Rheology
We use a viscoplastic modelling approach. The viscous deformation can be accommodated by two mechanisms: diffusion and dislocation creep. Diffusion creep is grain size sensitive and diffusion creep strain rate is directly proportional to shear stress. Dislocation creep is a non-Newtonian deformation mechanism where strain rate and applied shear stress are related via a power law. Both creep mechanisms depend on temperature (activation energy) and pressure (activation volume) of the system (Ranalli, 1995). The total strain rate is a sum of the strain rate in dislocation and diffusion creep (Weertman, 1970; Frost and Ashby, 1982; Hall and Parmentier, 2003). Following the fundamental relation between stress and strain rate tensors , we can identify the dislocation and diffusion creep components of the viscosity:
where Δηi represents dimensionless constants used to impose viscosity jumps at the 660 km discontinuity for each creep mechanism. Δηi values are equal to 1 in the upper mantle and are greater than 1 in the lower mantle. ηprim is only different from 1 in the primordial material. Ai are rheological prefactors, Ei and Vi are activation energies and volumes, respectively. ℜ is the average grain size (see Eq. 11), τ is the second invariant of the shear stress, τ0 is a reference stress, n is the dislocation creep exponent and m is the diffusion creep grain size exponent. Rheological coefficients depend on the creep regime but not on composition (see Table 1).
In order to study the importance of the relative contributions of diffusion and dislocation creep, we define the composite viscosity using their weighted contributions:
where the diffusion creep efficiency χ is a dimensionless positive weight which can have a different value in the upper mantle (χUM) and in the lower mantle (χLM). χ greater than 1 favours diffusion creep. The equation is formulated in such a way that the value of each component of the composite viscosity (i.e. either ηdf or ηds) corresponds to the viscosity expected for the Earth.
The sum of diffusion and dislocation creep weights is always 1; the effective viscosity is therefore not affected by the choice of χ and is usually roughly equal to the dominant viscosity. The rheological coefficients Δηi, Ai and Vi were obtained using a semi-analytical approach which ensures that the resulting effective viscosity in both diffusion and dislocation creep should be close to 1021 Pa s in the upper mantle and 1023 Pa s in the lower mantle. The diffusion creep efficiency χ represents, therefore, only a shift in rheological prefactors, but it still lets the rheology evolve self-consistently according to what happens during the simulations. χ is equal to the effective diffusion creep strain rate over dislocation creep strain rate if the viscosity profile of the Earth is actually reached by the system and the mobile-lid regime operates.
The plastic rheology is employed by the use of a yield strength. The maximum strength the lithosphere can sustain is given by a yield stress (τy). If the yield stress is overcome, the viscosity is reduced. The yield stress consists of a brittle component and a ductile component:
The brittle yield stress follows a Byerlee-law-type formulation and increases with pressure:
where cf is the friction coefficient. The ductile yield stress also linearly increases with pressure but additionally incorporates the surface ductile yield stress τy, surf into the strength formulation, which looks similarly to the Mohr–Coulomb friction criterion:
where is the yield stress gradient. In the case that the convective stresses overcome the yield stress, the viscosity is reduced to the plastic viscosity ηpl, because the effective viscosity is calculated as
where with as the second invariant of the strain rate tensor.
2.4 Grain size evolution
In order to compute the viscosity resulting from the combined use of both creep deformation mechanisms, we perform a number of steps. First, we calculate the grain size which we afterwards use to compute the diffusion creep viscosity. Then, we take the inverted sum of dislocation and diffusion creep viscosities to determine the total viscosity. We consider a simple grain size evolution equation in which growth and dynamic recrystallisation are competing. The experimental coefficients used (Hiraga et al., 2010) lead to a rather slow grain growth as expected in a multiphase material. The dynamic recrystallisation term has been derived in Rozel et al. (2011) and is here reparameterised and used in a systematic way. The change of the average grain size ℜ with time is given by
where γ is the surface tension, G is the coarsening coefficient, ℜ is the grain size and p the grain coarsening exponent. G is defined as follows:
with the universal gas constant R, an experimental prefactor k0 and the activation energy EG.
fG is the partitioning factor which determines how much of this work is used to create new grain boundaries:
where TCMB, ref = 4000 K is a reference core–mantle boundary temperature, ftop is the maximum (at 300 K) and fbot the minimum damage fraction (at 4000 K). The partitioning factor fG is poorly constrained as it is difficult to obtain from experimental data. Rozel et al. (2011) and Mulyukova and Bercovici (2017) showed that fG seems only to be temperature dependent. We here use a power-law formulation for fG in order to test its influence on mantle convection. Since fG is a multiplicative factor of the dynamic recrystallisation term in Eq. (14), lowering it corresponds to damage inhibition. Composition dependence is neglected in our grain size evolution formulation, but phase transitions are considered by resetting the grain size to 5 µm at a phase transition. All grain size evolution-related and general model parameters are listed in Table 1.
When recrystallisation and grain growth are balanced, the change of grain size with time is zero; . The grain size under this steady-state condition is referred to as equilibrium grain size ℜeq:
Since, theoretically, the stress state of rocks can be reconstructed from a given grain size and known temperature, this state is called a “paleowattmeter” (Austin and Evans, 2007; Rozel et al., 2011).
2.5 Primordial layer and pile detection
The pile detection is based on composition and time-dependent temperature. At least 90 % of the pile must consist of primordial material (Cprim) and/or basalt (Cbas) :
The temperature constraint is defined using the average of a mid-mantle temperature of 3000 K and the current CMB temperature:
We use this additional temperature constraint for the pile detection to prevent having piles that reach up too high from the CMB. Using these two constraints, we start at the CMB with the detection. We check each cell column for the criteria, moving upwards from the CMB. As soon as one of the criteria is not fulfilled, the pile top is reached. During this process, some pile material gets lost because it “overhangs” and is not attached to a continuous column which starts at the CMB (Fig. 1). At each time step, average values for properties such as viscosity, rheology, temperature, internal work rate and grain size of the pile are computed. Additionally, 1D profiles through the pile and through the ambient mantle are calculated.

Figure 1Sketch showing the steps of our pile detection routine: first, we set the criteria; then, we check each cell column starting at the CMB for the criteria and stop the detection if one of the criteria is not any more fulfilled. Finally, we write a new pile field whose characteristics are saved and can be used for further post-processing.
In the current section, we chose to first illustrate the effect of grain size evolution on the dynamics of thermochemical piles mainly using the various convection regimes depicted in simulation number 72. This case is of particular interest as it nicely represents the diversity of processes experienced in all the other simulations: starting in the stagnant-lid regime, experiencing basalt dripping stages, resurfacing episodes and a rather long mobile-lid regime phase (the closest to plate tectonics behaviour of the Earth). Simulation numbers 3, 7 and 73 are also used to illustrate the competing impacts of grain size and temperature on the viscosity in 0D-averages and 1D profiles.
The Results section is divided into four subsections:
-
dynamics of piles (2D fields) (Sect. 3.1),
-
averages of pile properties over time (0D) (Sect. 3.2),
-
difference between properties of pile and ambient mantle (1D profiles) (Sect. 3.3),
-
effect of grain size and temperature on the viscosity with a focus on piles (0D) (Sect. 3.4).
3.1 The dynamics of piles in response to the ambient mantle and lithosphere
We start off by providing an overview of the dynamics of the modelled thermochemical piles and show results from model no. 72 (Table ). In this model a yield stress of 20 MPa, a yield stress gradient of 0.1, an eruption efficiency of 0.7 and a primordial layer with a density of 3140 kg m−3 at surface are employed. χUM and χLM are both 1, so diffusion creep and dislocation creep are both equally important.
In Fig. 2, viscosity, grain size, strain rate, stress, rheology and temperature fields at time 1.50 Gyr are shown. The rheology is defined as the ratio of strain rate due to dislocation creep and strain rate due to diffusion creep (). If dislocation and diffusion creep equally contribute to deformation, the rheology is equal to one. Figure 3 shows snapshots of the same simulation and shows the dynamics of grain size and viscosity during an overturn event (1.58 Gyr), during the mobile-lid phase (2.46 Gyr) and during the stagnant-lid phase (4.0 Gyr). The white line outlines the pile, the black line regions with a partial melt percentage higher than 50 %. In regions of high melt fractions a surprisingly high viscosity can be observed. This is not a physical observation but results from the way the overall viscosity is computed. We only use the grain size in the solid matrix to compute the viscosity and neglect the impact of the melt content. This approach is generally a good approximation except for regions with a particularly high melt content. Therefore, the viscosity in regions of high melt content should be treated with care. In the bottom row, the evolving distribution of basalt is presented.
Figure 2e displays the general rheology of the Earth: the lithosphere deforms mainly in diffusion creep. Small grains (around 5 µm in plate boundary areas and up to 100 µm elsewhere) and a high viscosity (1027 Pa s) mark this region. Up to 660 km, dislocation creep governs the deformation. Grains are larger (300 to 500 µm) and the viscosity is of the order of 1021 Pa s. The mid and lower mantle is characterised by diffusion-dominated creep. Exceptions are plumes, areas surrounding downwellings and some regions of the piles.

Figure 2Snapshots of mantle dynamics at 1.5 Gyr. The white line outlines the detected pile. A downwelling pushes the pile material around. The downgoing material is characterised by a high viscosity, very small grain size and low temperature. It mainly deforms in diffusion creep, as does most of the mantle. Only the upper mantle and parts of the pile accommodate more deformation in dislocation creep. The strain rate in the mantle surrounding the downwelling is very high, and viscosity surrounding the downwelling is very low.
Downwellings lead to a very high strain rate in the surrounding material (5×10⁻¹³ s−1) and consequently to a lower viscosity (1020 Pa s) than in the ambient mantle. The grain size in the region around the downwelling is smaller (100 to 500 µm) due to the higher work rate, resulting in a stronger grain damage and the advection of material through phase transitions. As can be observed in Fig. 2, the strong, cold, basaltic material coming down from the surface has a small grain size and high viscosity. Once the cold material reaches the lowermost mantle, it destroys the pile but does not mix with it (Fig. 3, bottom). The downwellings force the pile to move aside and rearrange itself. The newly formed parts of the pile deform mainly in dislocation creep. The rest of the pile along the CMB deforms mostly in diffusion creep (Fig. 2e).
We find that piles are pushed around by downwellings but are not affected by regular convection of the ambient mantle: panels a in Fig. 3 show that piles distribute around the large downwellings and are not a strong layer, which can prevent the downwelling material from reaching the CMB. Piles appear to be strong as long as no force acts on them, which can be attributed to the non-linearity of non-Newtonian fluids. However, piles nevertheless mainly deform in diffusion creep (Fig. 2e), even during their “strong” phase. It can also be observed that after a certain time, grains have grown back and reach the size they were before the overturn event (Fig. 3, top-left panel). The average viscosity of the pile also returns to the previous value (Fig. 3, centre-left panel). This specific time is further discussed in Sect. 3.2.4. Once the basaltic material has warmed up and mixed with the ambient mantle, the pile can settle again along a larger area of the CMB.
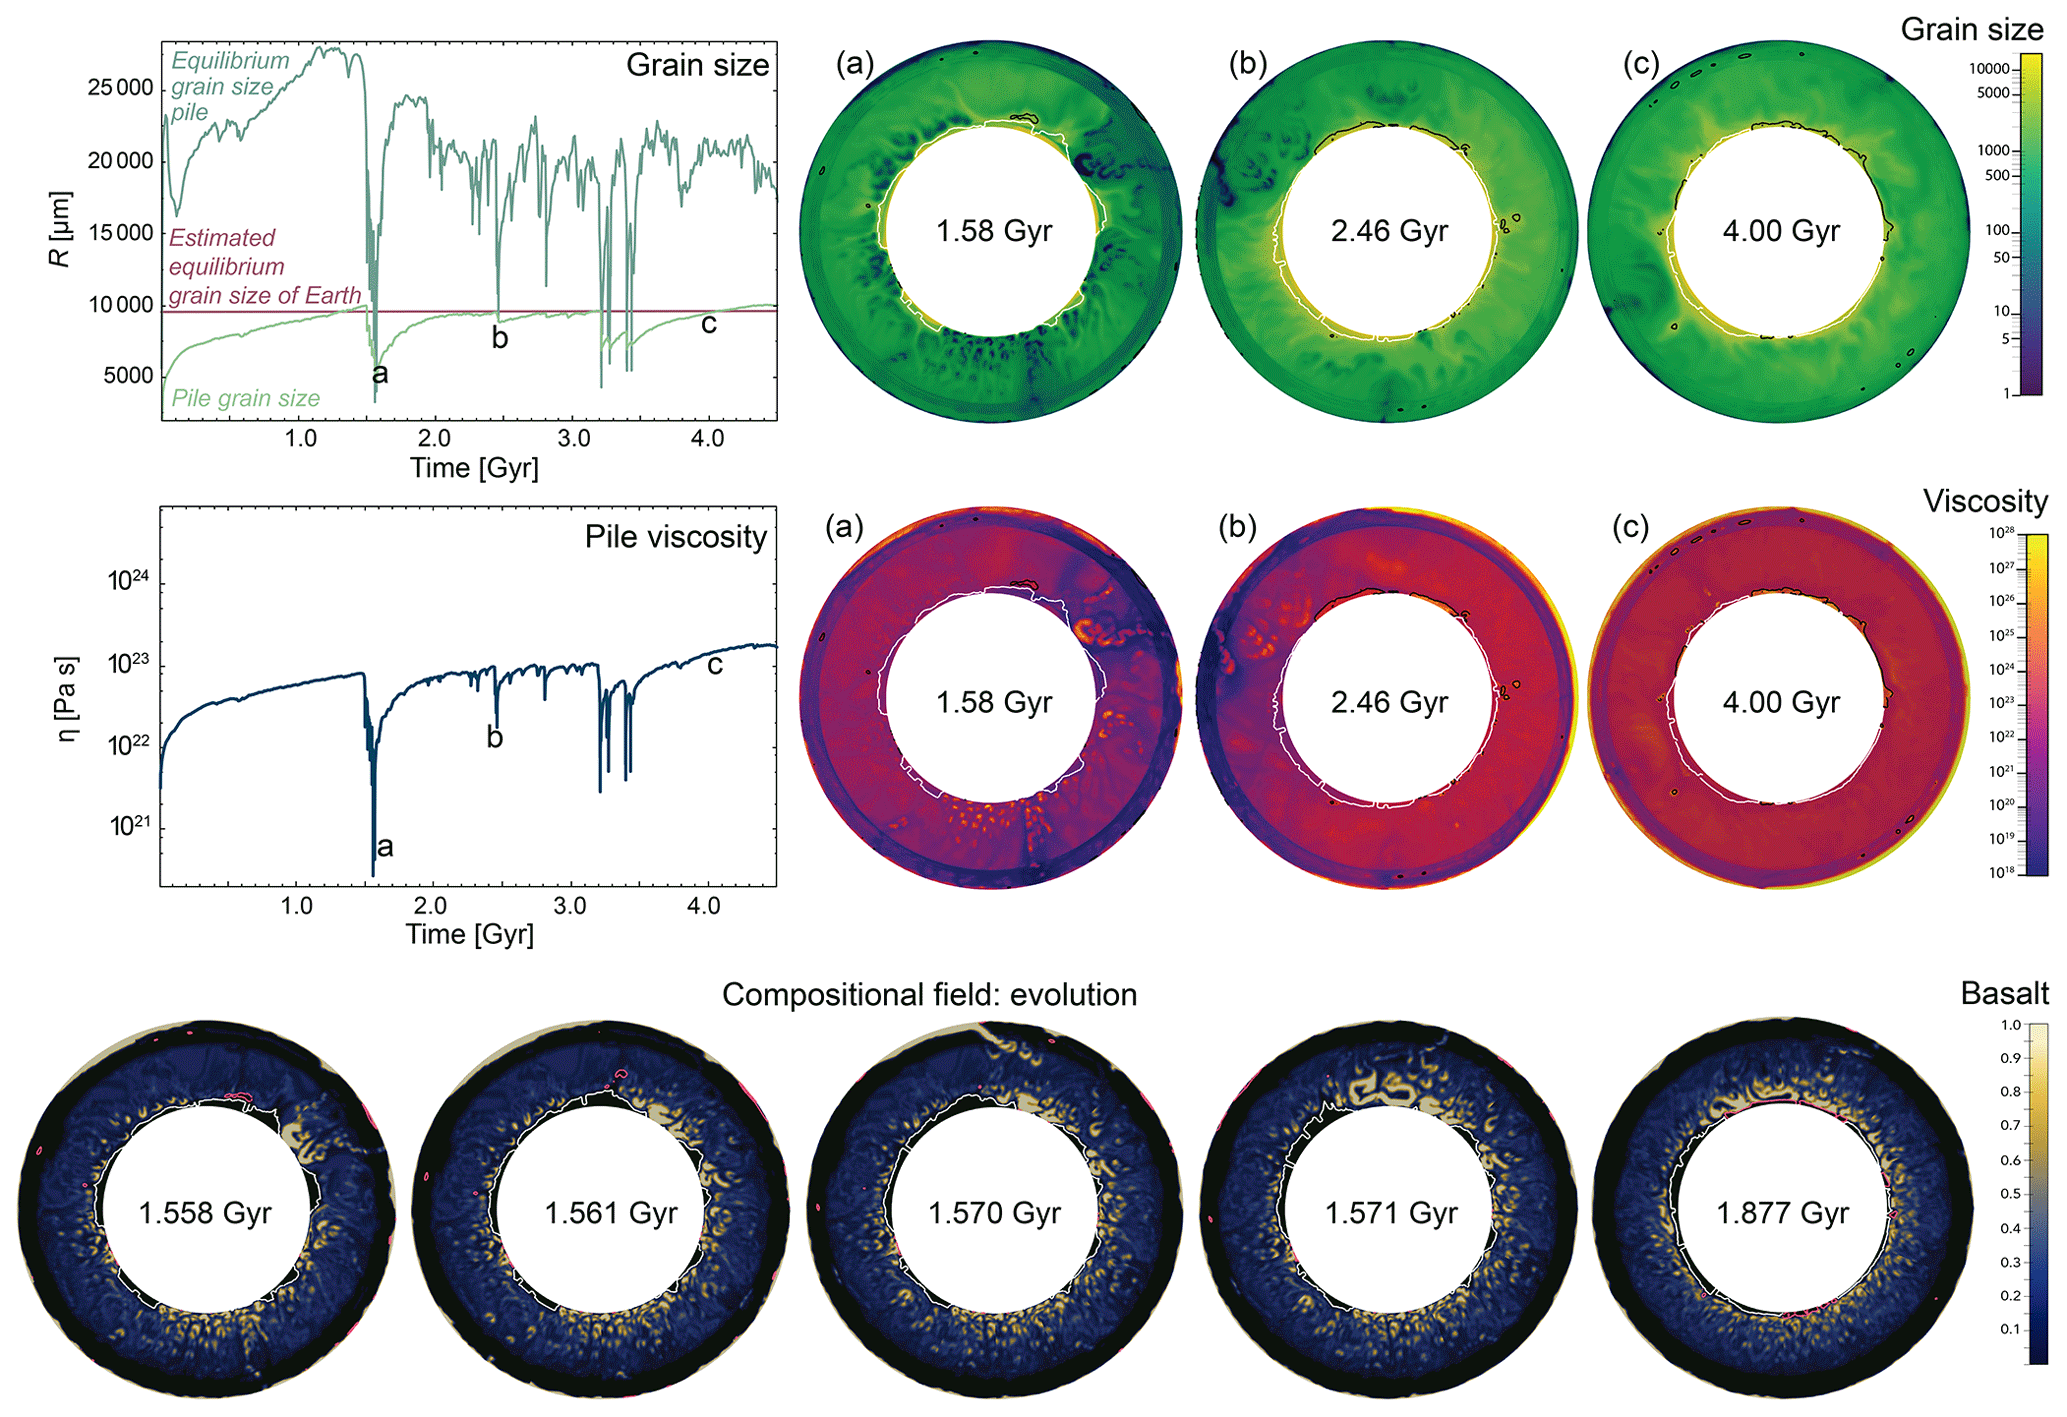
Figure 3Example of the dynamics of grain size and viscosity during an overturn (1.58 Gyr), during the mobile-lid phase (2.46 Gyr) and the stagnant-lid phase (4.0 Gyr). The white line outlines the pile and the black line outlines regions with a partial melt percentage higher than 50 % (viscosity and grain size in these regions only refer to the solid). On the bottom, the evolving distribution of basalt is displayed. Outlined in white is again the detected pile. In red this time are the regions with partial melt. It can be observed that basalt does not mix with the pile but pushes it aside.
3.2 Pile averages
In this section we examine the time-dependent dynamics and properties of the detected piles in detail. We find that the overall pile dynamics and behaviour of the average properties mainly depend on different convection regimes throughout the run time. Therefore, the results are described in light of different tectonic regimes. We differentiate between stagnant-lid phase, plate tectonic-like/mobile-lid phase and overturn events.
We show one exemplary simulation and all average pile properties to present their evolution and interaction. Pile averages of grain size, stress, strain rate, viscosity, temperature and rheology, as well as the surface velocity, are plotted over time (Fig. 4). The model is the same presented in the prior section. The primordial material of the simulation has the same viscosity and mechanical properties as basalt, the yield stress in the simulation is 20 MPa, the yield stress gradient 0.1 and the eruption efficiency 0.7 (model no. 72 in Table ). This simulation shows different types of convection regimes: two stagnant-lid phases (up to 1.5 Gyr and after 3.5 Gyr), overturn events (at 1.5 Gyr and at 3.2 and 3.4 Gyr) and a mobile-lid phase between 2.0 and 3.2 Gyr (Fig. 4). The convection regimes are differentiated by plate velocity, where 1 cm yr−1 is the border between mobile and stagnant lids.
3.2.1 Stagnant-lid phase
During the first stagnant-lid phase (until 1.5 Gyr), grain size and viscosity of the pile both increase and the pile dominantly deforms in diffusion creep. Grain sizes vary between 6000 and 10 000 µm (excluding the initiation phase) and viscosity between 1022 and 8×10²² Pa s. The calculated equilibrium grain size plotted in Fig. 3 is very large during this stage, because the work rate is low.
Strain rate, stress, work rate and surface velocity decrease after the initiation of the simulation. The minimum strain rate right before the overturn event is s−1 and the minimum stress is 5×10⁶ Pa. Accordingly, the work rate is the smallest as well at that time with a value of 10−10 Pa s−1. Surface velocity strongly decreases to less than 10−3 cm yr−1.
Initially, pile average temperature also starts to decrease, but after around 0.5 Myr it stays constant, which can be attributed to the development of thick crust during the stagnant-lid phase. This crust prevents the Earth and therefore also the pile from cooling down further. The average temperature of the pile during the stagnant-lid phase is approximately 4400 K.
During the second major stagnant-lid phase (3.5–4.3 Gyr) all pile properties recover, and grain size as well as viscosity reaches values that are higher than during the mobile-lid phase of the simulation. The surface velocity is not as low as during the first stagnant-lid phase, but rather close to the mobile-lid phase, especially towards the end of the simulation. Accordingly, the average stress of the pile in the second stagnant-lid phase is higher than during the first stagnant-lid phase. Strain and work rate are both as small as towards the end of the first stagnant-lid phase. The small variations in surface velocity are reflected in small oscillations of the average stress, strain and work rate as well as rheology of the pile. The pile temperature can further decrease during the second stagnant-lid phase because there still exists some movement at the surface, manifested by dripping of lithosphere.
3.2.2 Episodic overturn/resurfacing phase
An overturn event (at 1.5 or 3.2 Gyr) is marked by a very high surface velocity. It is unfortunately impossible to observe such velocities (10 to 100 m yr−1) in the solar system as no planet is currently undergoing a resurfacing. However, velocities much larger than Earth's plate velocities are expected considering a much thicker destabilising lithosphere and only one plate. Hence, the resurfacing is associated with a sudden increase and peak in the average strain rate, stress and work rate of the pile material due to the push of the downwelling lithospheric material. The high fluctuations of work rate lead to a very low equilibrium grain size, resetting the grain size in the piles during the overturn and downwellings events. Following the diminished grain size, the viscosity decreases as well.
The rheology is dislocation-creep-dominated during the high work rate phase and then quickly returns to diffusion dominated once the grains are small and have not yet had time to grow back. Since the period of high work rate is short, grain size and viscosity quickly recover and return to the values prior to the overturn event (see Sect. 3.2.4).
3.2.3 Plate tectonic-like/mobile-lid phase
During the mobile-lid phase, stress; strain rate; and thus also the work rate, rheology, and surface velocity show a lot of variations. The pile average viscosity and grain size follow the variations of the work rate, as expected. Deformation of the pile is mainly performed in diffusion creep but with a higher component of dislocation creep than during the stagnant-lid phase. The average pile temperature continuously decreases during the mobile-lid phase because of the absence of an insulating thick lithosphere at the surface.
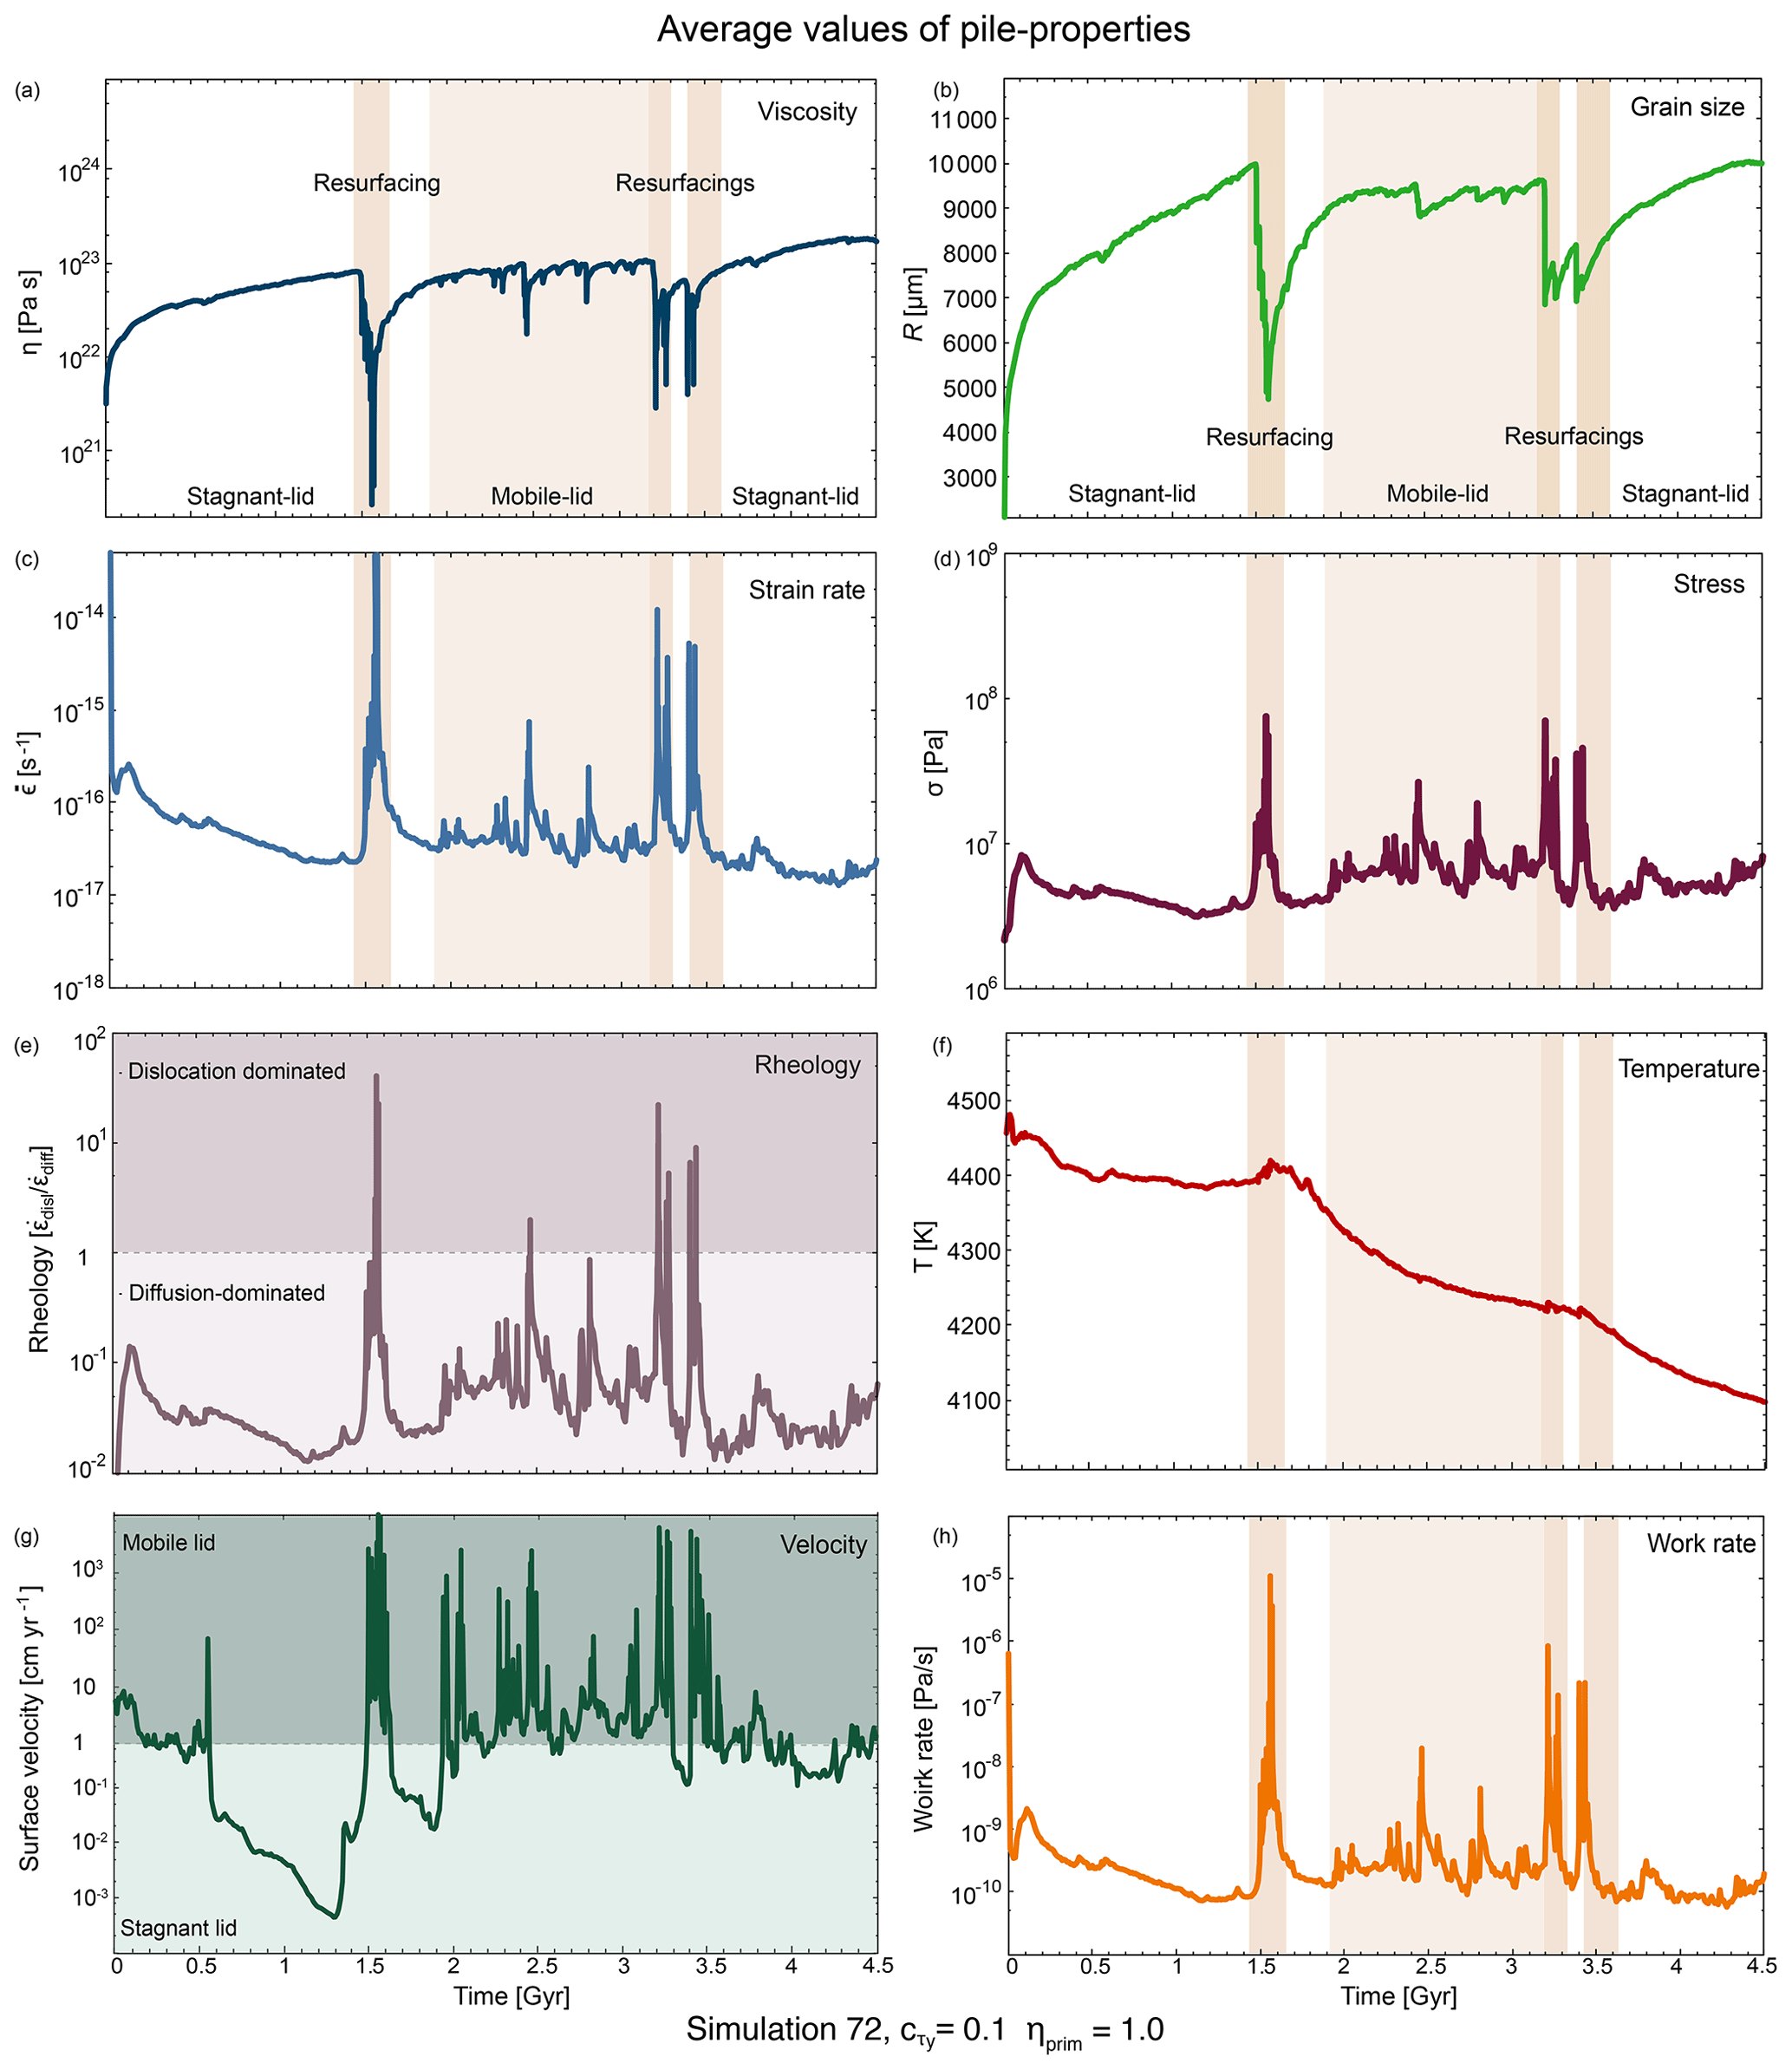
Figure 4Average pile properties for the whole simulation time of model no. 72 and the surface velocity (g) of the simulation to classify the convection regime. Low viscosity; low grain size; high stress, strain, and work rate; and dislocation-dominated rheology are correlated and occur during overturn events.
3.2.4 Pile recovery time and self-regulation effect
We observe that at the end of the simulations average properties of grain size, viscosity, rheology, stress and strain rate are very similar to values in the first billion years of the simulation despite the convection history. This is because average properties quickly return to former values (“recover”) after fluctuations due to downwellings or episodic overturns. We call this the “self-regulation effect” and observe it for all properties (excluding temperature).
The time window of recovery depends, on the one hand, on the vigour of the convection (stress) and, on the other hand, on the grains' drive to reach the equilibrium grain size (Fig. 3, top). Figures 3 and 4 illustrate how fast the piles' grain size and other properties recover after one overturn event. We call this the recovery time trec of the piles. For grain size specifically, it can be computed by reformulating the grain growth term to
We find the grain size recovery time to be approximately 420 Myr for a temperature of 4400 K and an estimated recovered grain size of 9000 µm. This result relates to the plotted grain size in Fig. 3.
Table 4First-order regressions of pile spatial and temporal averages. Temperature and density are fitted with an additive form as their variations are small. Viscosity, rheology and grain size are fitted with a power-law equation. Important input parameters are printed in bold.

3.2.5 Dependency of pile properties on input parameters
In order to estimate the importance of each input parameters on the effective properties of the thermochemical piles, we perform empirical regressions of the time and space averages reported in Table 4. For temperature and density, we use an additive form, since their variations are rather small. Grain size, viscosity and rheology are fit with a power-law equation. Since we use spatial and temporal averages, we can only report first-order correlations. The input parameters that are found to be important are printed in bold characters.
We observe that the pile temperature mostly depends on the eruption efficiency and the yield stress gradient (Table 4). If the eruption efficiency is changed from only intrusive to completely extrusive, the temperature of the pile will decrease. This behaviour can be explained with extensive cold downwelling eclogite in the case of a completely extrusive regime. When the cold eclogite reaches the CMB, it cools the piles more efficiently than the warm eclogitic drips that occur in the case of imposed intrusive magmatism. If the yield stress gradient increases by 0.1, the pile average temperature rises as less cold material reaches the CMB. Other variables do not significantly influence the pile temperature. The error of around 1 % on temperature is relatively high, but we need to consider that we perform these regressions on temporal and spatial averages.
The viscosity of the pile mainly depends on the input density and viscosity, respectively. The error for viscosity is low at ≈30 %, taking into account the logarithmic behaviour of viscosity. The average rheology of the pile is mainly affected by the prescribed effectiveness of diffusion creep in the upper and lower mantle (χUM and χLM) and to a lower extent by the prefactor of the initial viscosity of the pile.
Interestingly, the average grain size does not depend on any of the input parameters. All exponents are very small and the error with 4 % is low (Table 4), meaning the regression fits the behaviour of grain size well. This result underlines the self-regulating behaviour of grain size evolution in an evolutionary convection model.
3.3 1D profiles
In this section we report detailed observations on the differences between pile and ambient mantle properties, focusing on viscosity, grain size, temperature and rheology during different tectonic phases. To investigate how these properties evolve with time, we again show profiles inside and outside the pile for five different time steps (using model no. 72).
We first present some general observations of how the investigated properties vary within the ambient mantle and the piles.
3.3.1 Grain size – general trend
Grain size is very small in the lithosphere and quickly increases to sizes of around 1000 µm in the upper mantle. Differences between different time steps are negligible (Fig. 5). Below 660 km, grains become larger and the differences between time steps increase as well. Inside the pile, grains are larger than in the ambient mantle. The post-perovskite transition at 2740 km leads to a reduction in grain size within the piles as well as within the ambient mantle. However, grain size quickly grows after passing the transition and a final grain size of around 10 000 µm is reached at the CMB.
3.3.2 Viscosity – general trend
Next, we investigate how viscosity changes with time and how ambient mantle viscosity differs from pile viscosity. We observe that all subfigures show a similar behaviour. Generally, the viscosity is very high in the crust, then decreases up to the 660 km boundary, where it instantly rises to a value of around 1023 Pa s. This value remains approximately constant until the post-perovskite phase transition is reached. There, the viscosity increases rapidly up to the core–mantle boundary. Different time snapshots do not display a significantly different behaviour. An exception is viscosities very close to the CMB. Likely, the variations arise due to the amount of subducted material accumulated at that certain time snapshot at the CMB. Within the described general trend there are some variations, depending on the set of input parameters. These variations are described below.
3.3.3 Rheology – general trend
At all time steps, the lithosphere deforms in diffusion creep while the upper mantle is diffusion creep dominated but shows also a strong component of dislocation creep. The mid and lower ambient mantle deform in diffusion creep. At the CMB, deformation mechanisms vary strongly, from completely diffusion-dominated creep to dislocation-creep-governed deformation. Piles deform with diffusion creep, whereas the lowermost ambient mantle is governed by dislocation creep, because it is slightly warmer. The grain size reset at the post-perovskite transition (2740 km) is responsible for the increase in diffusion-creep-accommodated deformation within the pile.
3.3.4 Temperature – general trend
The temperature increases rapidly in the upper 400 km, followed by a nearly steady temperature and a second pronounced increase in the lowermost mantle from around 2500 km up to the CMB.
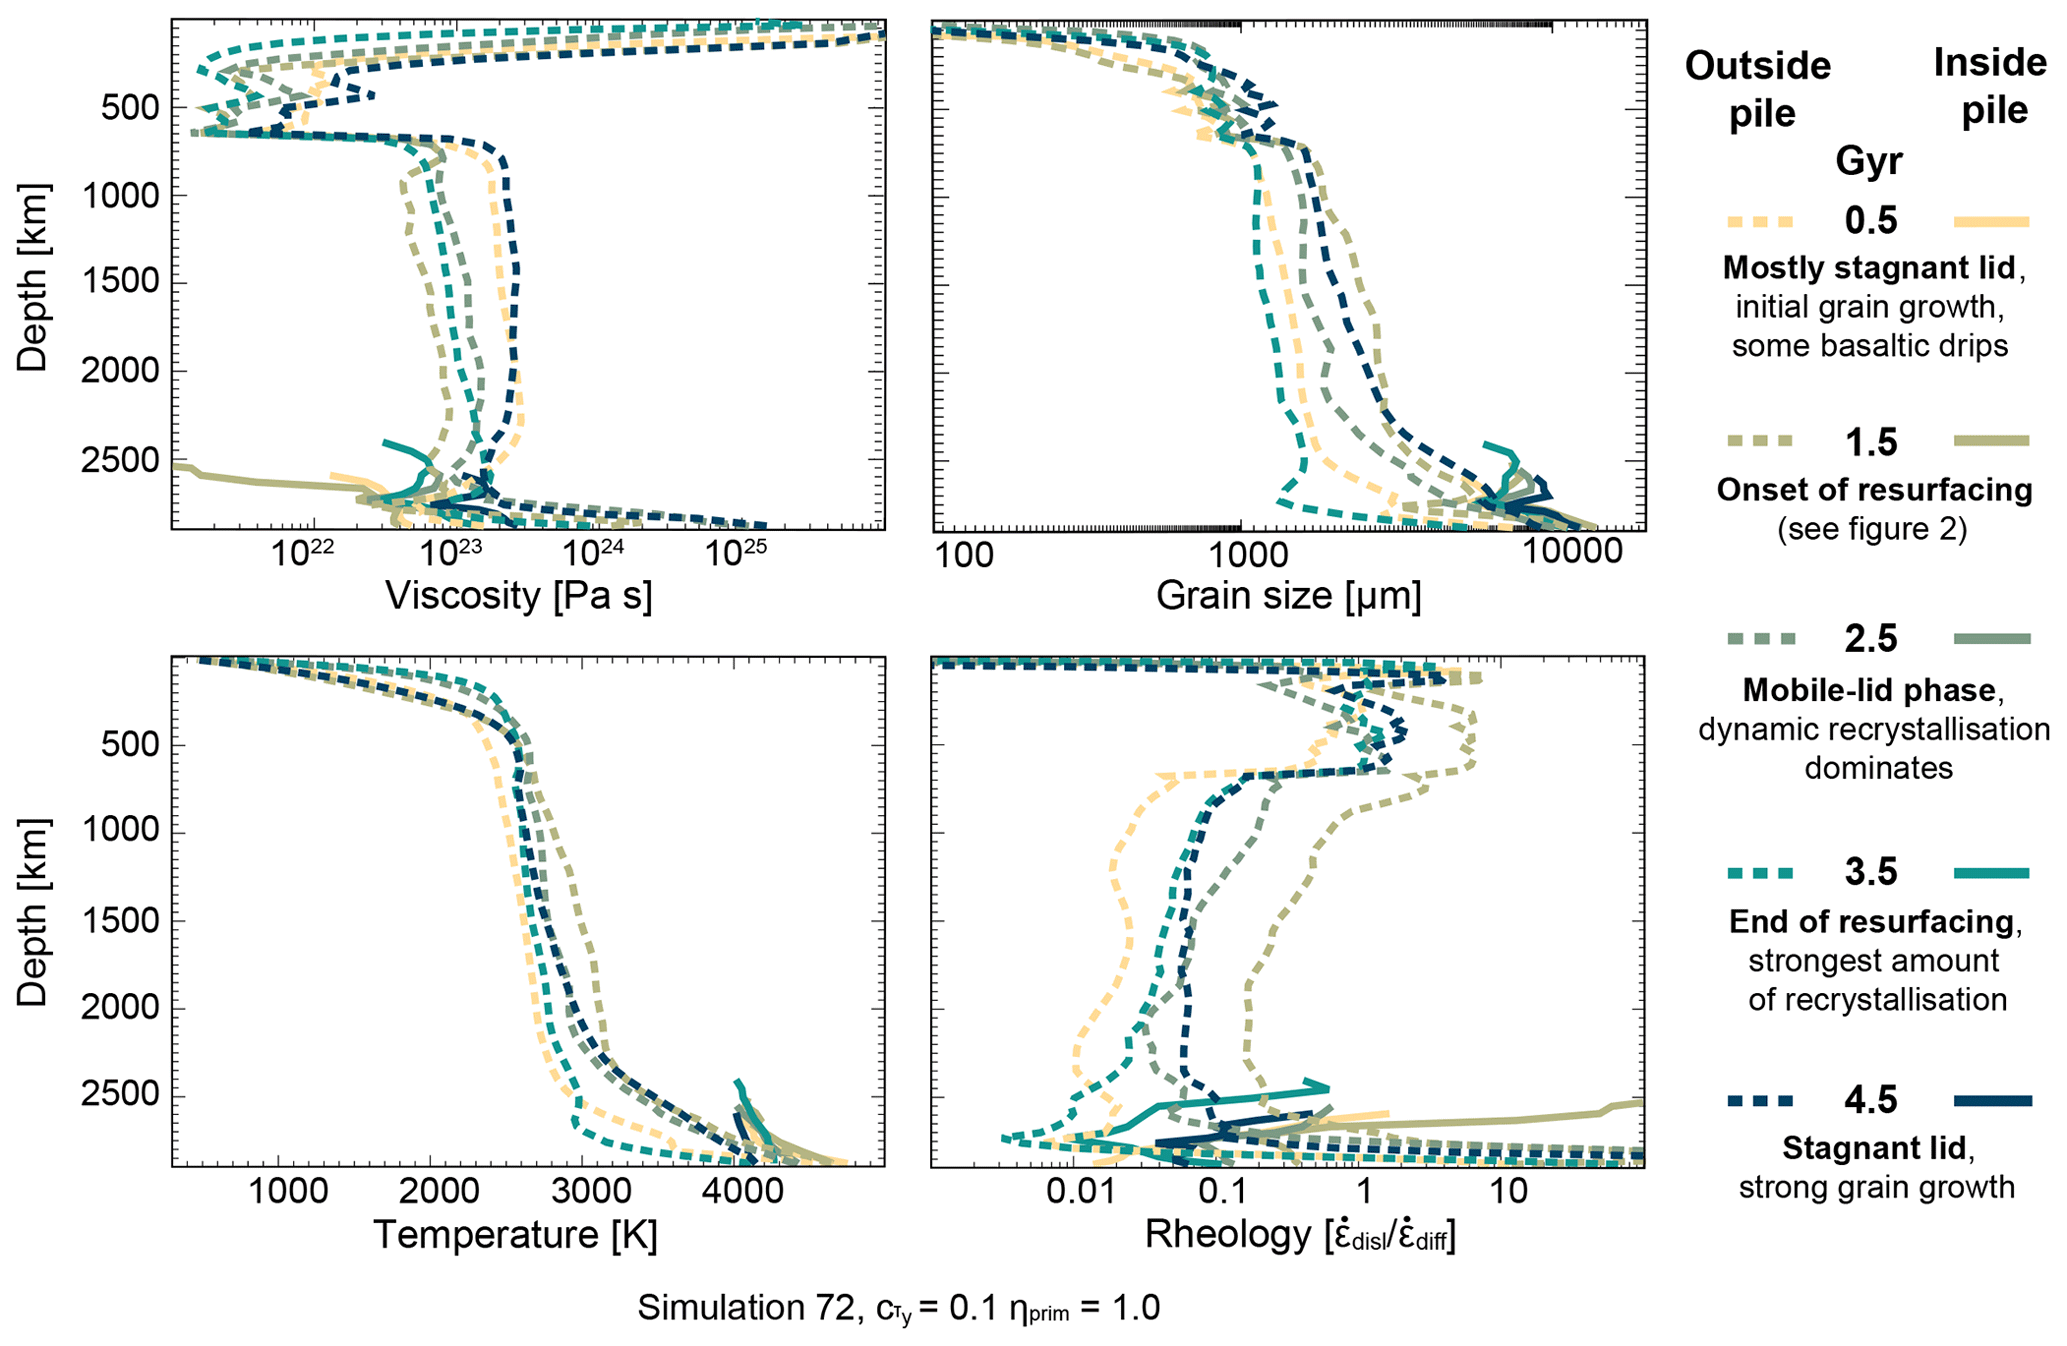
Figure 51D profiles of grain size, viscosity, temperature and rheology through the whole model domain (model no. 72). The dashed lines show the average values of crust and ambient mantle for five time steps; the solid curves show average properties within the pile for the same time steps. Convection regime descriptions are provided in the legend.
3.3.5 Convection regime dependence
During the initial stagnant-lid phase, grains are generally still relatively small and viscosity in the ambient mantle is high, which coincides with the lower temperature. During this phase, the deformation is strongly dominated by diffusion creep. Right before 1.5 Gyr, a resurfacing starts. At 1.5 Gyr, a slab has already subducted, and the rest of the lithosphere follows shortly after. The deformation mechanism has a higher component of dislocation creep due to stress induced by the downwelling basaltic material and the large grain size, which reaches its maximum at this time step. Because of the latter, viscosity is high, although temperature also reaches the maximum. At time 2.5 Gyr, the convection regime is plate tectonic-like with constant downwellings inducing constant stress. This results in a decrease in grain size, viscosity and temperature. Following the recrystallisation of grains, the deformation is strongly dominated by diffusion creep. The profiles plotted for 3.5 Gyr show the deformation regime, grain size, viscosity and temperature right at the end of two resurfacing events. Accordingly, the grains have strongly recrystallised, which is succeeded by a decrease in viscosity. The rheology also shows, by a slightly higher component of diffusion creep than recorded for the previously described time step, that grains are smaller than at 2.5 Ga, implying that the work rate has reduced compared to before. At 4.5 Gyr, the model has been in the stagnant-lid phase for around 1 Gyr, which leads to an increase in temperature and strong grain growth. Viscosity increases a lot, accordingly. At the same time, dislocation creep gets slightly more important again, but the deformation is still governed by diffusion creep.
3.4 Influence of grain size and temperature on the viscosity of the pile and the mantle
Investigating average values for temperature, grain size and viscosity inside the pile helps us to understand the relative importance of grain size and temperature on the viscosity of the pile. We look at two exemplary cases (nos. 3 and 7 in Table ). The two runs use identical parameters except for the imposed density of the primordial layer: 3080 kg m−3 in the simulation shown on the left side (no. 3) and 3140 kg m−3 in the model shown on the right side (no. 7) in Fig. 6.
Figure 6 demonstrates that grain size and viscosity evolution are correlated in the pile. Both (a) and (b) show an increase in viscosity when grains grow. However, grains only start growing after viscosity has already increased, e.g. after a downwelling (Fig. 6a). This implies that viscosity does not solely depend on grain size. We additionally observe a correlation between rising temperature and decreasing viscosity in the pile, e.g. after the overturn event or during the first 0.5 Gyr (Fig. 6b). The general trend of decreasing temperature is reconcilable with the overall increase in viscosity. We also find that grain size and temperature are anticorrelated, although one might expect that grains stop or slow down their growth when temperature decreases. The observed anticorrelation is explicable with several arguments: although the overall temperature inside the pile decreases, the actual temperature inside the pile is high enough for grains to grow. Secondly, grain growth does mainly depend on the absence of stress or strain rate. If the strain rate within the pile is small, grains will grow, because the damage term is small (Eq. 11). From the above described findings we conclude that both pile grain size and pile temperature buffer the development of pile viscosity in opposite directions in our simulations.
In Fig. 7 we present 1D profiles for five different time steps during the model evolution (simulation no. 73). The 1D profiles show averaged values for each depth inside (solid line) and outside (dashed line) the pile. Temperature and grain size in the ambient mantle steadily increase with time, whereas viscosity decreases. The very low viscosity of the ambient mantle at 1.5 Gyr can be explained with a large downwelling occurring right before 1.5 Gyr, which leads to high stresses and strain rates and accumulates along the CMB. The same downwelling also explains why the grain size has not increased a lot until 1.5 Gyr and why the grain size is very low along the CMB. The high viscosity close to the CMB at times 2.5 and 3.5 Gyr can be attributed to the accumulation of stiff, subducted material from previous downwellings and resurfacing events. Although the viscosity of the presented simulation decreases with time, models employing a purely temperature-dependent viscosity have a much stronger decrease. By using the average temperatures for a depth of 1500 km at times 0.5 and 4.5 Gyr, we calculate a viscosity ratio of
using P=50 MPa, J mol−1, m3 mol−1 and R=8.314 J K−1 mol−1. With a grain-size-dependent viscosity, the viscosity ratio is only .
From Fig. 7 we can conclude that in the ambient mantle grain size and temperature are correlated, and, on the other hand, grain size evolution strongly decreases the effective temperature dependence of the viscosity. This is the opposite behaviour to what has been shown in Fig. 6 for average pile properties. However, the 1D profiles through pile material in Fig. 7 support the results presented in Fig. 6. Hence, we infer that for the chosen parameters, temperature dominates the viscosity evolution in the ambient mantle and grain size regulates the viscosity development in the pile. The reason for the small effect of temperature on pile viscosity is that the pile buffers the core temperature and thus pile temperature stays nearly constant over the whole evolution (it varies only 300 K).
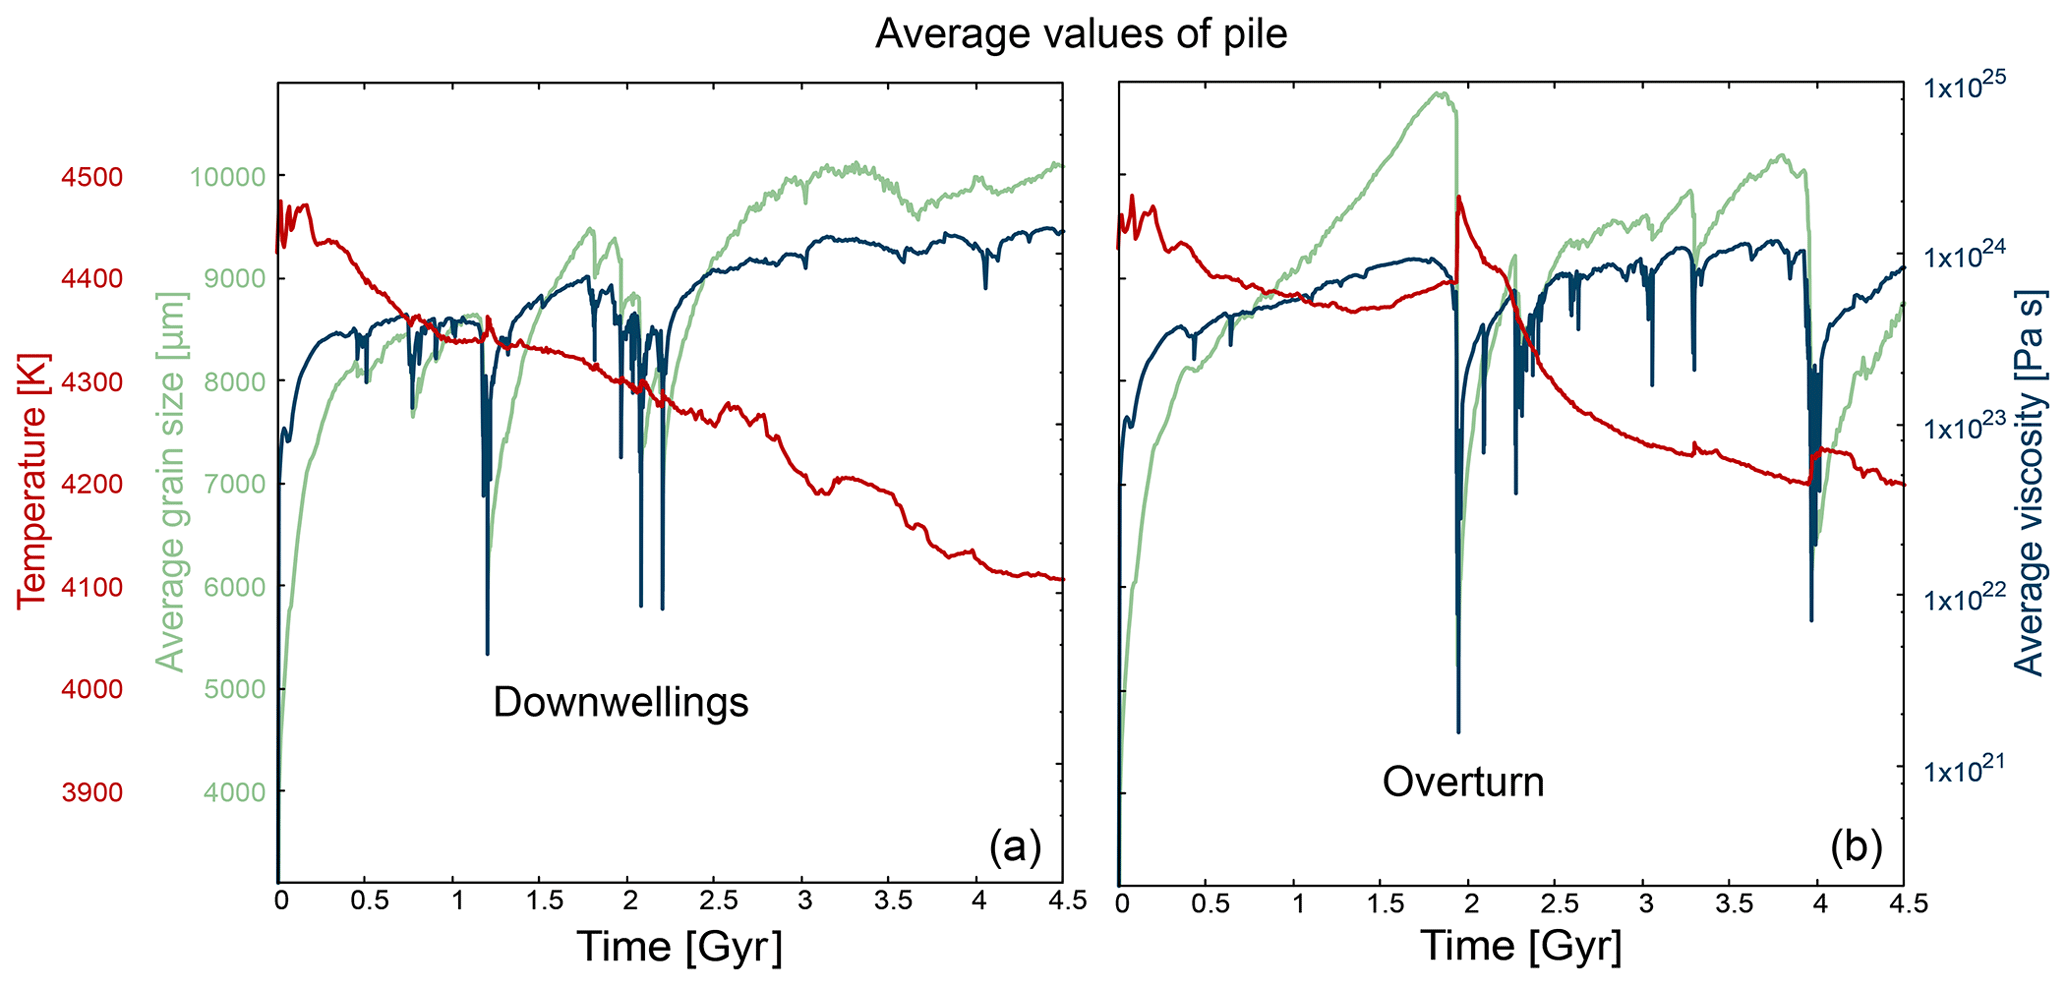
Figure 6Average values for temperature, grain size and viscosity inside the pile. (a) Simulation no. 3 shows the effect of several strong downwelling events in the early stages of the evolution. (b) Simulation no. 7 displays the effect of two overturn events, intermittent by a mobile-lid phase. All properties are plotted in the same graph to emphasise the correlation between grain size and viscosity development and the anticorrelation of temperature evolution.
4.1 Grain size in thermochemical piles and ambient mantle
Our simulations show that deformation in the lower mantle as well as in thermochemical piles is mainly accommodated by diffusion creep. Exceptions during phases of overturn and intense downwelling events result in dislocation-creep-dominated deformation or an even contribution of diffusion and dislocation creep in the piles. During these events, the lower mantle deforms mainly in dislocation creep in regions adjacent to the downwelling. These observations are very similar to findings by McNamara et al. (2002), who also used a composite rheology, though without specifically considering grain size evolution. Although there exists a surprisingly good agreement between our findings and their results, we observe a different deformation mechanism along the CMB. Whereas McNamara et al. (2002) find diffusion creep to dominate deformation, our simulations rather suggest a slight domination of dislocation creep. However, hypotheses featuring strongly dislocation-creep-governed deformation due to a large grain size because of high temperatures along the CMB (Dannberg et al., 2017) cannot be confirmed. The anisotropy observed in some parts of the D′′ layer (Lay and Young, 1991; Lay et al., 1998; Garnero, 2000; Kendall and Silver, 1996), specifically in regions of high stress (Karato, 1998) can be explained by regionally occurring dislocation creep due to downwelling-induced high stresses as has been proposed by Karato (1998). Seismic anisotropy resulting from dislocation creep in the rest of the D′′ layer can better be explained by material layering, aligned inclusions or flow fabrics due to a strongly sheared thermal boundary layer and crystalline alignment as has been suggested by, for example, Kendall and Silver (1996) and Doornbos et al. (1986), respectively.
As noted by Dannberg et al. (2017), LLSVPs are potential regions for large grain size as the stability of LLSVPs and the high temperature gives grains the right conditions to grow. However, we find that the size of the grains is limited and reaches an equilibrium grain size that is not very different from the grain size in the ambient mantle (Fig. 5). Therefore, it is difficult to explain a possible higher stiffness of LLSVPs with large grain size.
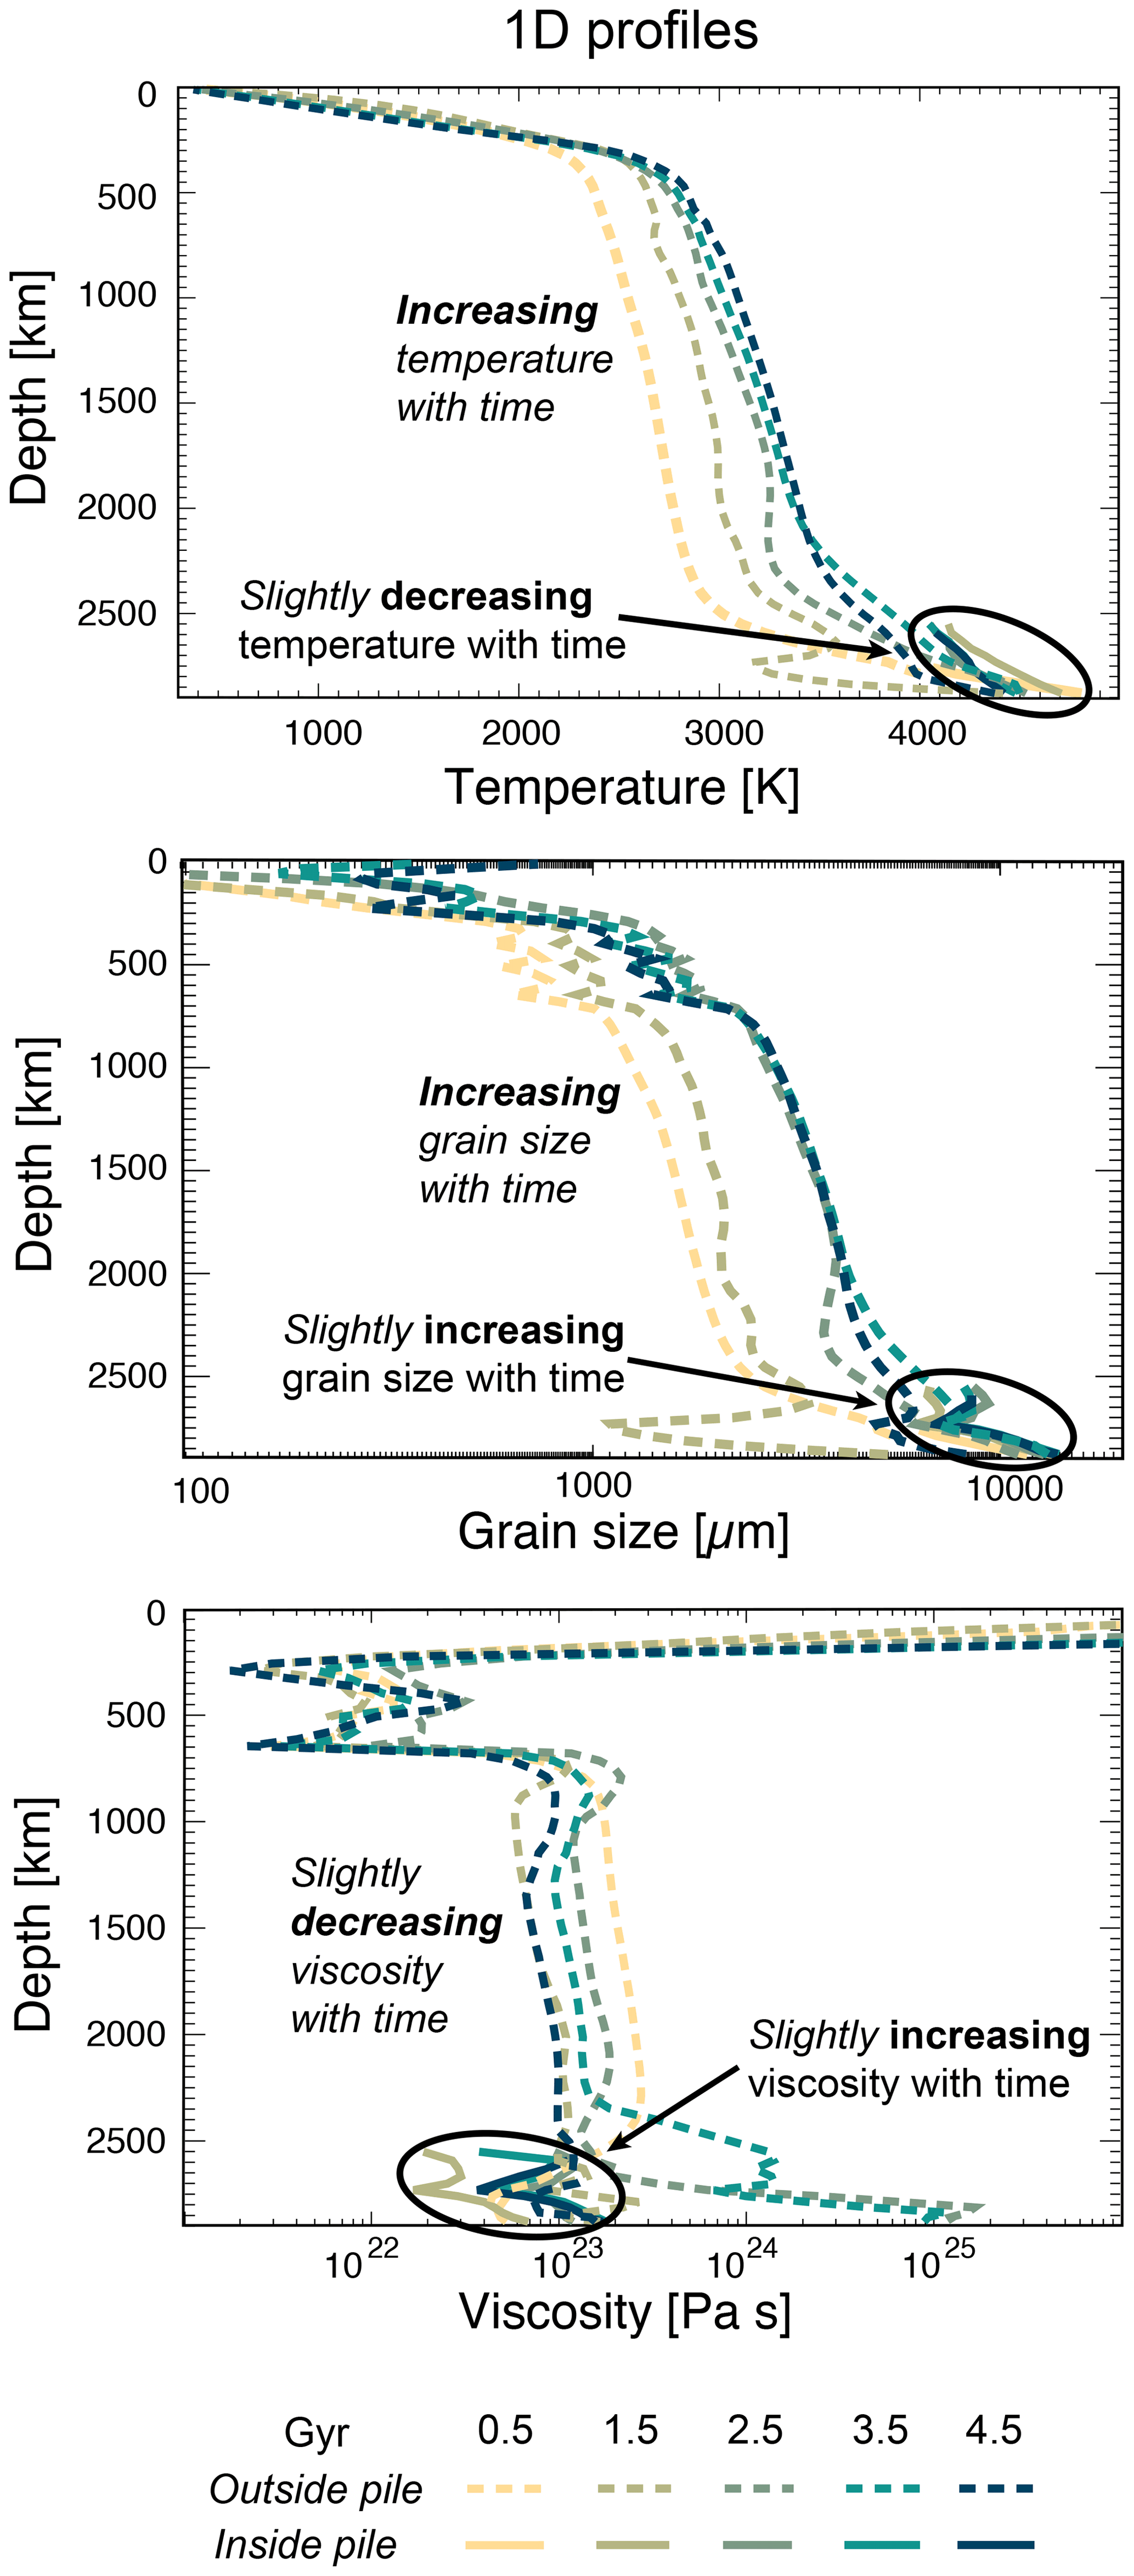
Figure 71D profiles through the whole model domain of simulation no. 73. The dashed lines show the average values of crust and ambient mantle for five time steps of the model evolution. The darker the colour, the later the time step. The solid curves show average properties within the pile for the same time steps. Top: temperature, middle: grain size, bottom: viscosity.
As Ranalli and Fischer (1984) mention, it is impossible to know the grain size in the lower mantle. Therefore, geodynamic studies, in combination with mineral physics studies, can provide an estimate of the grain size and are of great relevance to understand the viscosity and dynamics of the deep Earth. The average grain size we find in the lower mantle is of the order of 2000 to 7000 µm, increasing with depth and time (in piles generally higher) and could, in the future, be compared to similar geodynamic studies, using the same or different grain size evolution equations. In contrast to Ranalli and Fischer (1984), we find that even with a large grain size of up to 7000 µm, the lower mantle can deform by Newtonian-dominated deformation and is not necessarily non-linear.
4.2 Recovery time in the Earth
If we assume that in the Earth stresses are generally higher than in the presented model, because of continuous subduction, the equilibrium grain size and the recovery time for grain size would be smaller and shorter, respectively. A rough estimate for the equilibrium grain size in the Earth can be calculated by using the relations and , where we use vplate=3 cm yr−1 as the plate velocity at surface, Dmantle=3000 km as the thickness of the Earth's mantle and Pa s as the viscosity in the lower mantle. This results in a strain rate of s−1 and stress of τEarth≈30 MPa, which leads to an average equilibrium grain size of around 4000 µm for Earth's piles (Fig. 3). The recovery time for this equilibrium grain size of 4000 µm would be of the order of 215 Myr, when assuming a temperature of 3500 K inside the piles. However, the recovery grain size of the pile will probably be smaller than the equilibrium grain size, similar to the observation shown in Fig. 3 for the pile in our simulations. Hence, if we instead assume a recovery grain size of only 3000 µm, we receive a much shorter recovery time of 50 Myr. Since the recovery time equation (Eq. 17) is very sensitive to both grain size and temperature, the recovery time of thermochemical piles in the Earth might vary a lot, depending on the temperature and the deformation history of the pile.
4.3 Spatial distribution of piles
Our results contribute to the ongoing debate about whether piles are intrinsically stable features that spatially determine subduction zones or are rather defined by subducting slabs themselves. Within the parameter range we studied, we observe that downgoing slabs are responsible for the spatial distribution of piles and their morphology, as has been noted in previous studies by McNamara and Zhong (2004, 2005). However, unlike findings by McNamara and Zhong (2004), we do not see a difference in pile morphology when a viscosity contrast between pile material and ambient mantle is introduced, although we do not investigate a large parameter space since we do not focus on pile morphology in this study. We further do not find that grain size assists the stabilisation of thermochemical piles by increasing their resistance to downgoing slabs. In contrast, we note that piles are strong as long as they are not exposed to stress but weak when slabs exert stress on the piles. This behaviour can be attributed to the non-Newtonian rheology in the composite rheology formulation.
Our thermochemical piles are also not surrounded by plume generation zones (PGZs), as suggested by Burke et al. (2008), but plumes rise directly from the piles as well as from their margins. They, as others have (Torsvik et al., 2006, 2010; Dziewonski et al., 2010), concluded that LLSVPs (in geodynamics referred to as thermochemical piles) have been stable in time, because the downward projection of large igneous province (LIP) sites can be linked to the margins of LLSVPs after rotating them back to their original eruption sites. LIPs in the 200 and 500 Myr age range let them conclude that LLSVPs have been occupying the same location for the same duration. Stable piles can only be confirmed with our models in the case of the absence of strong downwellings (subduction zones), i.e. for the last 200 to 500 Myr because we observe that downwellings govern the piles' spatial distribution. If there are no strong downwelling events disturbing the location of the piles, we can observe piles stable for at least 300 Myr. However, without dominant downwellings, we do not see plate tectonic-like behaviour in our simulations, implying that we observe either stable piles or plate tectonic-like behaviour but not both simultaneously. Even without a plate tectonic-like convection regime in our models, it is difficult to draw conclusions about the actual stability and spatial distribution of LLSVPs. Problematic is that we neither employ realistic plate velocities nor use three-dimensional models.
4.4 Viscosity in thermochemical piles and ambient mantle
Our results show that grain size has a great impact on the viscosity in numerical convection models. Similar to results by Dannberg et al. (2017), we observe strong lateral variations in grain size and resulting viscosity in our simulations, particularly during resurfacing events or prominent downwellings. Overturn events lead to a distinct “bimodal” behaviour in which one half of the spherical annulus shows a distinct decrease in viscosity and smaller grain size than the other half (Fig. 3, 1.58 Gyr). Downgoing slabs are surrounded by regions with lower grain size, high strain rate and reduced viscosity. This finding agrees well with what Dannberg et al. (2017) reported. However, in times without any particular downwelling event, we do not observe strong lateral viscosity variations in the lower mantle. Viscosity is relatively uniform, having values between 5×10²² and 5×1024 Pa s. Most of the lower mantle has a viscosity of the order of 5×10²³ Pa s. Solomatov and Moresi (1996); Karato and Rubie (1997); Solomatov et al. (2002); and Korenaga (2005) suggest that higher temperatures in plumes could result in higher viscosity due to larger grains. This suggestion cannot be supported with our simulations, but it might be probable if different grain growth parameters, for example stronger grain growth, were used. In our simulations, the expected increase in viscosity due to larger grain size in plumes is buffered by the higher temperature of the plume itself.
We further observe that due to the fast recovery of decreased grain size, viscosity quickly reaches values prior to any subduction or overturn event. Although we observe this self-regulating effect specifically for piles, we propose that the whole mantle might behave in a similar way. This proposition is supported by the observation that the viscosity variations with time are much smaller when using a composite grain-size-dependent viscosity than when using a simple Arrhenius-type viscosity formulation. If the self-regulating effect can also be observed for the whole mantle, the recovery time of grain size could, for example, be calculated for regions affected by subduction and provide information on healing and deformation recovery.
4.5 Semi-analytical considerations on the self-regulation of the viscosity of Earth's LLSVPs
In this section, in order to illustrate the self-regulating effect of grain-size-dependent rheologies employing dynamic recrystallisation, we present simple semi-analytical models of the possible evolution of thermochemical piles of the Earth. The results of our calculations are illustrated in Fig. 8. We compare four possible rheological situations: diffusion creep with constant grain size, diffusion creep with grain growth only, dislocation creep only and composite rheologies with grain growth and dynamic recrystallisation.
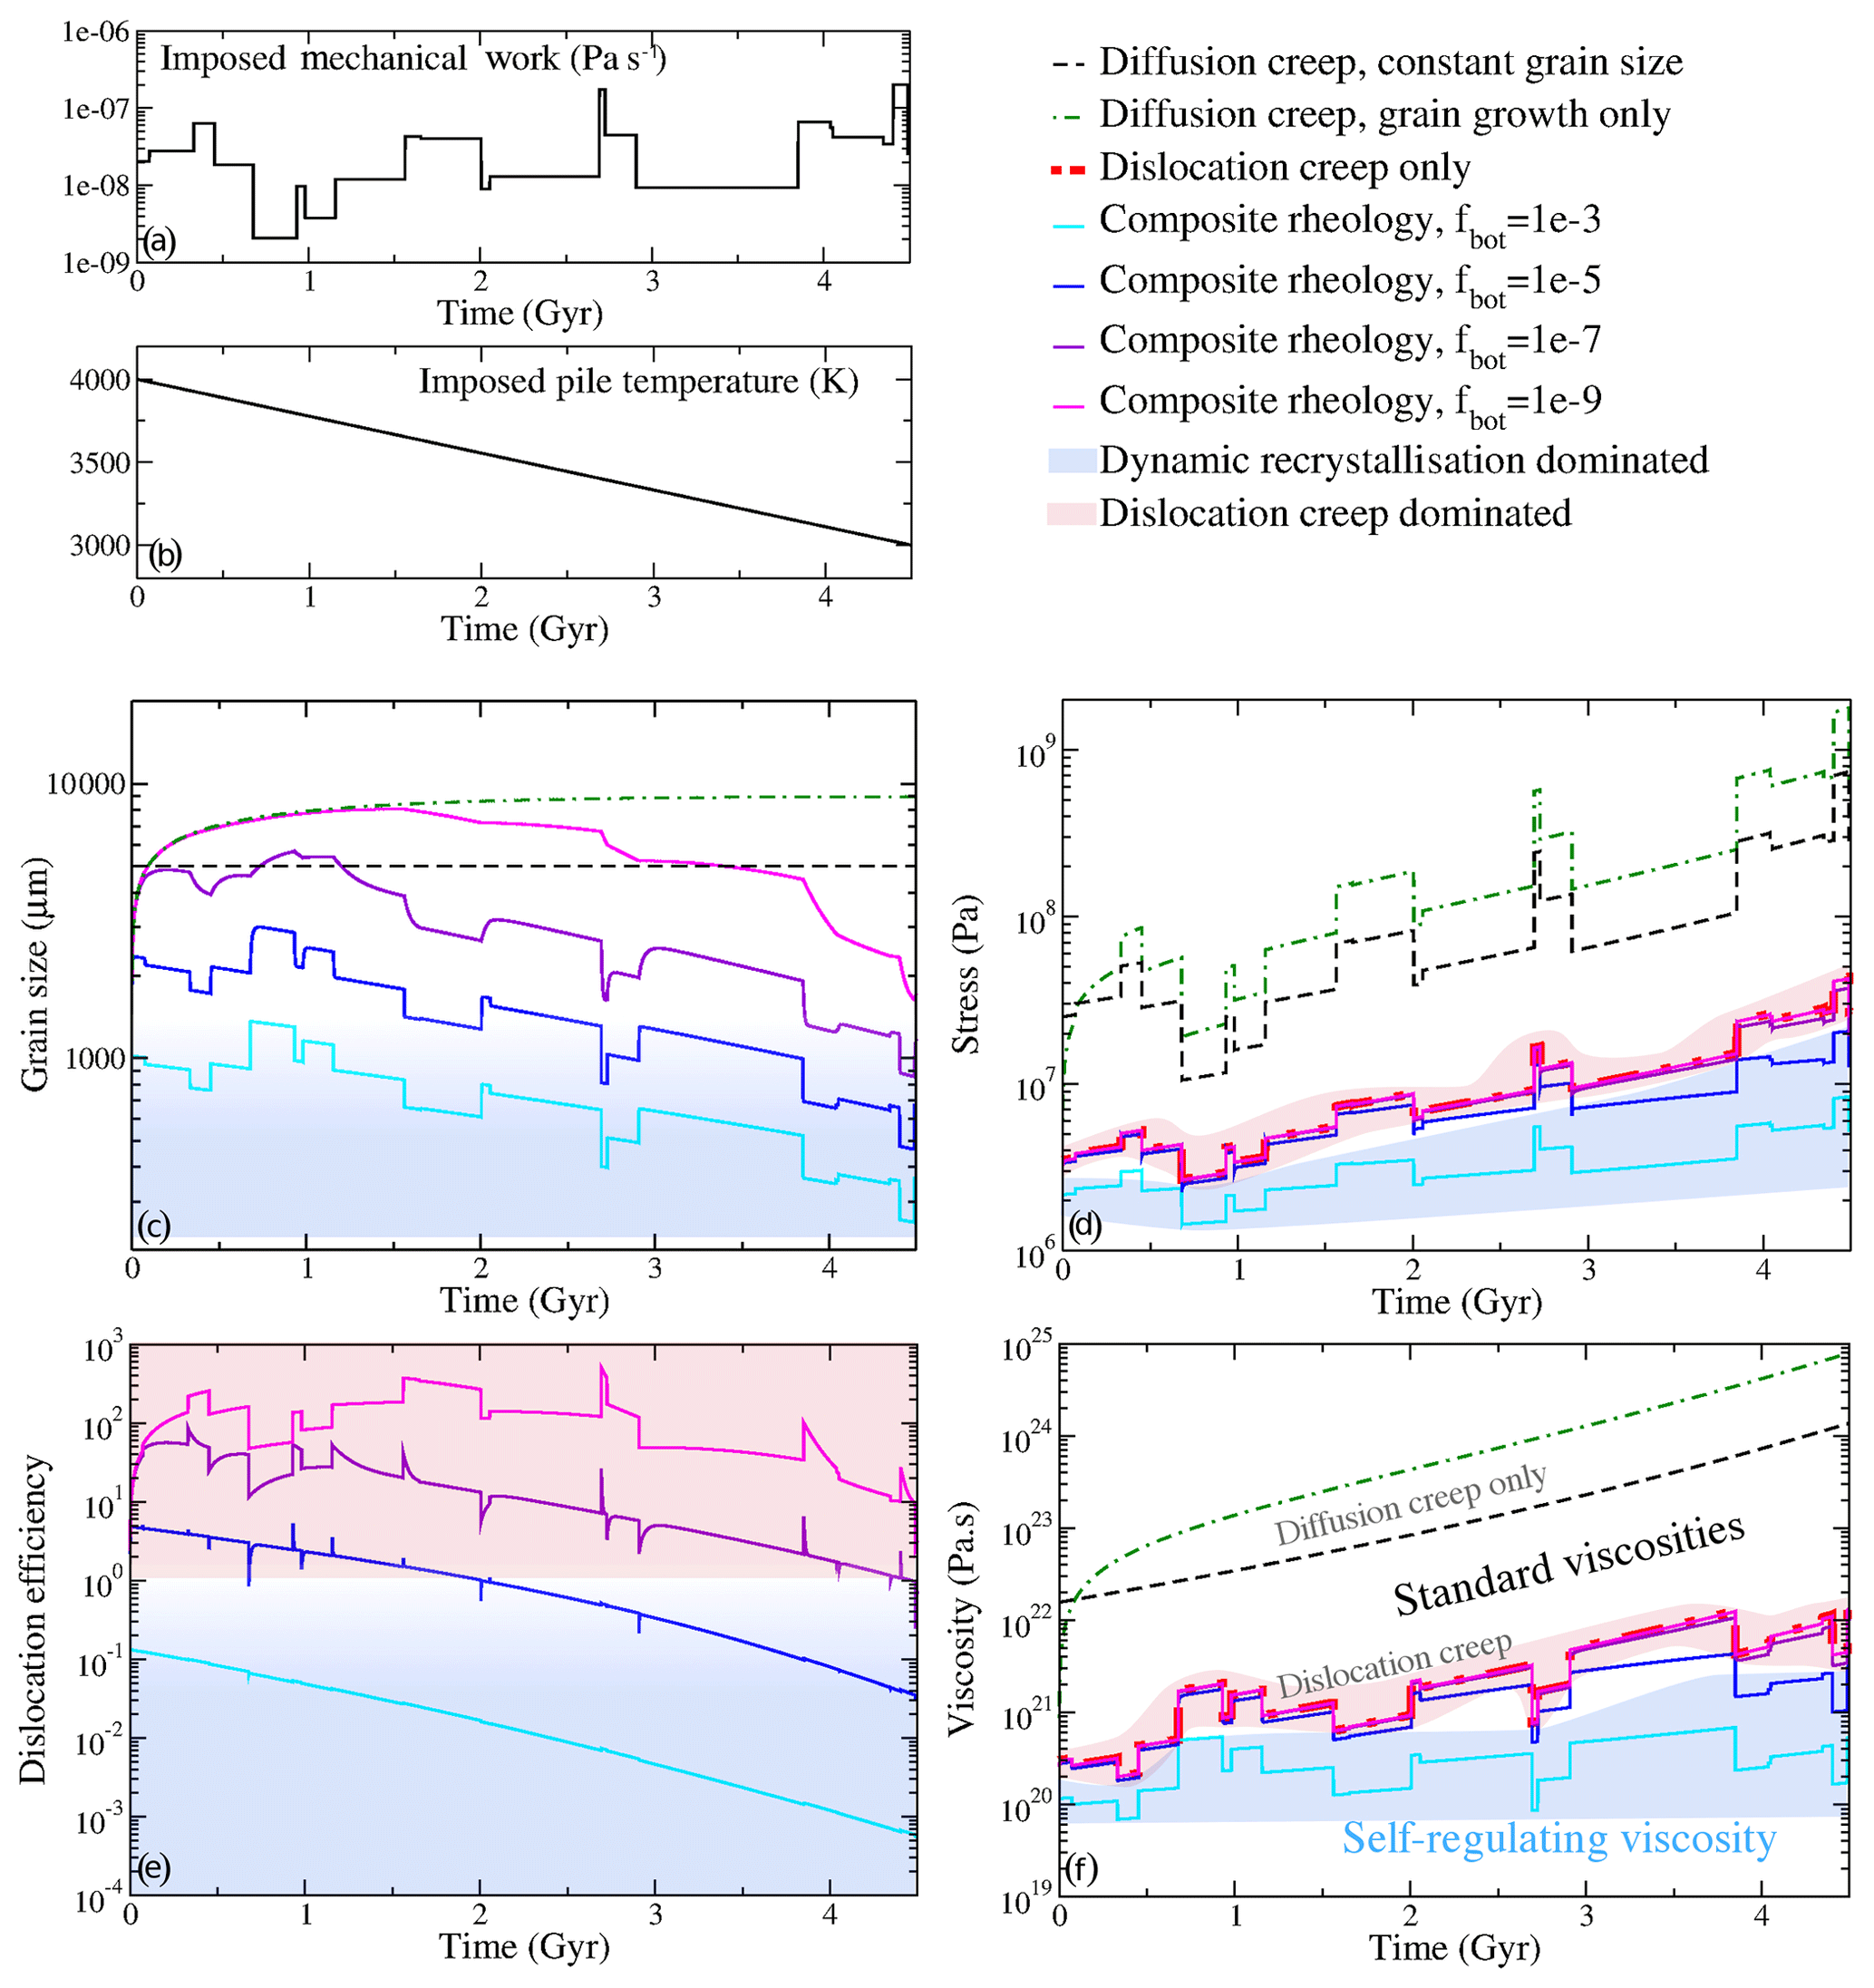
Figure 8Several possible scenarios for the evolution of grain size, stress, dislocation efficiency and viscosity applied to the history of the Earth. Panels (a, b) show our assumptions for the evolution of temperature (constant cooling) and mechanical work (randomised). Panels (c–f) show the impact of different grain size evolution models on the rheology of the thermochemical piles throughout cooling and chaotic convection. (c) shows the evolution of grain size, (d) represents the evolution of stress, (e) depicts the dislocation efficiency (the ratio of diffusion over dislocation creep viscosities) and (f) illustrates the viscosity as a function of time.
4.5.1 Assumptions
For simplicity, and since it has been largely discussed in the previous sections, we use the rheological coefficients of the model run no. 72 (see Table ). For this section, we consider a pile as a simple 0D object, arbitrarily subject to linear cooling from 4000 to 3000 K over 4.5 Gyr of time (Fig. 8b). We do not impose strain rate or stress conditions. Instead, considering that piles are strongly mechanically connected to the surrounding mantle, we impose a mechanical work rate. Since the mechanical work rate at the edges of piles very probably evolves through time, we randomise it around a value computed using a reference velocity of 3 cm yr−1, the reference length of 3000 km and a reference viscosity of 1023 Pa s. We allow for 20 phases of random times in which the mechanical work rate can vary over 2 orders of magnitude (Fig. 8a). The mechanical work rate is therefore Pa s−1. In models with evolving grain size, the initial grain size is 100 µm. This choice of initial value has a very limited impact on the result as grain growth very rapidly increases the grain size. In the case of constant grain size, we impose its value to be 5 mm. When dynamic recrystallisation is employed, we test values of fbot ranging from 0.1 to 10−9 to investigate the impact of dynamic recrystallisation, where large values of fbot represent strong dynamic recrystallisation.
Since both dislocation creep and dynamic recrystallisation are stress-dependent quantities, we use an iterative procedure (at each time step) to determine the stress resulting in the imposed mechanical work. Thus, at each time step, we look for the stress τ such that , where the viscosity η is often stress dependent and ψ is the imposed mechanical work.
4.5.2 Results of the semi-analytical model and discussion
In the following paragraphs, we describe the four scenarios after each other, starting from the most widely used and moving to the most realistic one.
If grain size does not evolve and only diffusion creep is considered, the stress varies rather strongly with both the random variations of imposed mechanical work and slowly decreasing temperature (Fig. 8d, dashed black line). Throughout the cooling of the pile, stress increases by at least an order of magnitude as, due to cooling, the viscosity increases by 2 orders of magnitude (Fig. 8f). This calculation shows that a standard simulation employing diffusion creep without grain size evolution would predict a strong increase of stress and viscosity throughout the cooling of the Earth even if the mechanical work only evolves randomly.
If both grain growth and diffusion creep are considered, grain size evolution only matters during the first billion years of evolution (green dotted-dashed lines in Fig. 8). Later on, the combined effect of the natural flattening of the growth (following a pth root of time) and the cooling of the pile result in a very limited increase of grain size. A diffusion creep rheology combined with only grain growth would therefore resemble standard situations excluding grain size evolution.
If we only consider dislocation creep, stress and viscosity both increase with time (thick dotted-dashed red line in Fig. 8), as it occurs in the case of diffusion creep only. The variations in stress due to the randomisation of the mechanical work are more limited than what was observed using only diffusion creep. This is due to the stress dependence of the viscosity, which tends to flatten the variations of stress as high mechanical work results in high stresses, which decrease the viscosity. Yet, since the dislocation creep rheology has a higher activation energy than the diffusion creep rheology, the evolution of temperature counteracts the self-regulating effect of the stress-dependent viscosity, and both stress and viscosity increase with time. Interestingly, Fig. 8f shows that the viscosity variations reflect the inverse of the variations in mechanical work. If one assumes that mechanical work in the Earth decreases with time (an usual assumption which may not necessarily hold true if one considers the message of the current study), a dislocation creep viscosity would therefore increase even stronger with time than what is estimated here.
In the case of a composite rheology with both grain growth and dynamic recrystallisation, we observe that the intensity of dynamic recrystallisation can control the dynamics of the system. In Fig. 8c–f we represent four intensities of dynamic recrystallisation from small (pink, purple curves) to strong (blue curves). As long as dynamic recrystallisation is relatively weak, grain size reduction is rather limited (Fig. 8c). In Fig. 8e we observe that the rheology is still dominated by dislocation creep, which is confirmed by Fig. 8d and f in which pink and purple curves can barely be distinguished from the dislocation creep curves. However, in the case of higher dynamic recrystallisation, smaller grain sizes are reached which eventually results in a diffusion-dominated rheology. In such case, the evolution of both stress and viscosity become very limited (blue curves in Fig. 8d and f). On average, stresses and viscosities only increase by a factor 2 to 3 (light blue curve in Fig. 8d and f). This can be explained by the decrease of grain size with time, which tends to decrease the viscosity with time. This effect counteracts the increase of viscosity with time due to cooling, even for a 1000 K cooling.
At present, there is no robust estimation of rheologies, grain growth and dynamic recrystallisation in the Earth's thermochemical piles as we ignore even their mineralogical nature. We illustrate here the effect of dynamic recrystallisation by varying the parameter fbot, which is very poorly constrained. However, one could certainly also vary grain growth parameters or rheological parameters. Using Eqs. (11, 12 and 13), one can define a dimensionless number DRX representing the intensity of recrystallisation as opposed to grain growth by dividing the grain growth term over the dynamic recrystallisation term of Eq. (11) (Foley et al., 2012):
One can expect that a self-regulating viscosity can be obtained when dynamic recrystallisation dominates, i.e. DRX >1. Therefore, Eq. (19) shows that a self-regulating viscosity can be obtained by not only varying the parameter fbot. Since the temperature is close to the core–mantle boundary temperature, Eq. (19) demonstrates that one should expect to have rheological prefactors (present in Ψ), and the grain growth prefactor k0 and exponent p have a similar effect as fbot.
Our results demonstrate that thermochemical piles mainly deform in diffusion creep. During downwelling and overturn events, dislocation-creep-accommodated deformation gains importance and can be, but is not necessarily, the dominant deformation mechanism. The spatial distribution of piles depends on the location of subducting slabs and downwelling material. The slightly larger pile grain size compared to the ambient mantle does not lead to stiff features which are able to dominate the dynamics of the lowermost mantle. Once piles are exposed to stress, they are weak features that are swept around the CMB. This behaviour can be explained by the non-Newtonian rheology with which piles deform. Properties of the piles, such as viscosity, strain, work rate, stress or grain size are self-regulating, meaning that after a significant downwelling/resurfacing the values quickly recover to values prior to the event affecting the pile.
Although in our simulations dislocation creep seldom occurs in the lower mantle, we see its association with downwellings. If this information is transferred to the Earth, we can infer that due to continuous subduction there exist more areas under high stress than what we have observed in our simulations. This could potentially lead to more dislocation creep, which in turn could explain long-lasting seismic anisotropy in the lowermost mantle without the need for material layering, crystalline alignment or induced flow fabric.
In our models we find a relatively uniform viscosity in both upper and lower mantles, unless large overturn events occur. The viscosities of hot plumes and thermochemical piles do not differ significantly from ambient mantle viscosity. On the other hand, downgoing slabs display a much larger viscosity, even when reaching the CMB. Overall, our results suggest that viscosity depends more on grain size than on temperature, specifically when constant stress due to downwellings and resurfacing events is present. Our results further demonstrate that the viscosity change over time is considerably smaller in simulations using a grain-size-dependent viscosity than in models employing only an Arrhenius-type viscosity. These findings let us conclude that grain size is important to consider in the viscosity formulation of evolutionary convection models.
The code is available for collaborative studies by request.
The used, unprocessed data (for the figures) can be downloaded from https://www.research-collection.ethz.ch/handle/20.500.11850/371505 and has the following DOI: https://doi.org/10.3929/ethz-b-000371505 (Schierjott, 2019).
AR, PT and JS designed the study. PT developed the code. AR supported JS in setting up the model and in investigating the results. AR coded the grain size evolution routine, the 1D semi-analytical routine and some post-processing routines. JS coded the pile detection and some post-processing routines, made the figures, and wrote the paper draft. AR extended the method section, wrote Sect. 4.5, and provided input and suggestions for the paper draft. PT gave comments and suggestions on the paper draft.
The authors declare that they have no conflict of interest.
Jana Schierjott received funding from the European Union's Horizon 2020 research and innovation programme under the Marie Skłodowska-Curie grant agreement 642029 – ITN CREEP and from SNF (Swiss National Science Foundation) grant 200021-182069. Antoine Rozel and Paul Tackley were funded by ETH Zurich.
This paper was edited by Julien Aubert and reviewed by Bradford Foley and one anonymous referee.
Armann, M. and Tackley, P. J.: Simulating the thermochemical magmatic and tectonic evolution of Venus's mantle and lithosphere: Two-dimensional models, J. Geophys. Res.-Planet., 117, e12003, https://doi.org/10.1029/2012JE004231, 2012. a
Austin, N. J. and Evans, B.: Paleowattmeters: A scaling relation for dynamically recrystallized grain size, Geology, 35, 343–346, 2007. a
Burke, K., Steinberger, B., Torsvik, T. H., and Smethurst, M. A.: Plume generation zones at the margins of large low shear velocity provinces on the core-mantle boundary, Earth Planet. Sc. Lett., 265, 49–60, 2008. a, b, c
Cordier, P., Ungár, T., Zsoldos, L., and Tichy, G.: Dislocation creep in MgSiO3 perovskite at conditions of the Earth's uppermost lower mantle, Nature, 428, 837–840, 2004. a
Dannberg, J., Eilon, Z., Faul, U., Gassmöller, R., Moulik, P., and Myhill, R.: The importance of grain size to mantle dynamics and seismological observations, Geochem. Geophys., 18, 3034–3061, https://doi.org/10.1002/2017GC006944, 2017. a, b, c, d, e, f, g
Davaille, A., Stutzmann, E., Silveira, G., Besse, J., and Courtillot, V.: Convective patterns under the Indo-Atlantic box, Earth Planet. Sc. Lett., 239, 233–252, https://doi.org/10.1016/j.epsl.2005.07.024, 2005. a, b, c
Doornbos, D., Spiliopoulos, S., and Stacey, F.: Seismological properties of D and the structure of a thermal boundary layer, Phys. Earth Planet. In., 41, 225–239, 1986. a
Dziewonski, A. M., Lekic, V., and Romanowicz, B. A.: Mantle anchor structure: an argument for bottom up tectonics, Earth Planet. Sc. Lett., 299, 69–79, 2010. a
Foley, B. J., Bercovici, D., and Landuyt, W.: The conditions for plate tectonics on super-Earths: Inferences from convection models with damage, Earth Planet. Sc. Lett., 331, 281–290, https://doi.org/10.1016/j.epsl.2012.03.028, 2012. a
Frost, H. and Ashby, M.: Deformation-Mechanism Maps: The Plasticity and Creep of Metals and Ceramics, Pergamon Press, Oxford, 1982. a
Garnero, E. and McNamara, A.: Structure and Dynamics of Earth's Lower Mantle, Science, 320, 626–628, 2008. a, b
Garnero, E. J.: Heterogeneity of the lowermost mantle, Ann. Rev. Earth Planet. Sci., 28, 509–537, 2000. a
Garnero, E. J., McNamara, A. K., and Shim, S.-H.: Continent-sized anomalous zones with low seismic velocity at the base of Earth's mantle, Nat. Geosci., 9, 481–489, https://doi.org/10.1038/ngeo2733, 2016. a
Hall, C. and Parmentier, E.: Influence of grain size evolution on convective instability, Geochem. Geophys., 4, 1029, https://doi.org/10.1029/2002GC000308, 2003. a, b, c
Hernlund, J. W. and Houser, C.: On the statistical distribution of seismic velocities in Earth's deep mantle, Earth Planet. Sc. Lett., 265, 423–437, 2008. a
Hernlund, J. W. and Tackley, P. J.: Modeling mantle convection in the spherical recent Advances in Computational Geodynamics: Theory, Numerics and Applications, annulus, Phys. Earth Planet. In., 171, 48–54, https://doi.org/10.1016/j.pepi.2008.07.037, 2008. a, b
Hiraga, T., Tachibana, C., Ohashi, N., and Sano, S.: Grain growth systematics for forsterite ± enstatite aggregates: Effect of lithology on grain size in the upper mantle, Earth Planet. Sc. Lett., 291, 10–20, https://doi.org/10.1016/j.epsl.2009.12.026, 2010. a
Ishii, M. and Tromp, J.: Normal-mode and free-air gravity constraints on lateral variations in velocity and density of Earth's mantle, Science, 285, 1231–1236, 1999. a, b
Ismail-Zadeh, A. and Tackley, P. J.: Computational methods for geodynamics, Cambridge University Press, 2010. a
Karato, S. and Rubie, D.: Toward an experimental study of deep mantle rheology: A new multianvil sample assembly for deformation studies under high pressures and temperatures, J. Geophys. Res., 102, 20111–20122, 1997. a, b
Karato, S.-I.: Grain growth kinetics in olivine aggregates, Tectonophysics, 168, 255–273, 1989. a
Karato, S.-I.: Some remarks on the origin of seismic anisotropy in the D layer, Earth Planets Space, 50, 1019–1028, 1998. a, b
Karato, S.-I.: Rheology of the Earth's mantle: A historical review, Gondwana Res., 18, 17–45, 2010. a
Karato, S. I. and Wu, P.: Rheology of the upper mantle: A synthesis, Science, 260, 771–778, 1993. a
Karato, S.-I., Toriumi, M., and Fujii, T.: Dynamic recrystallization of olivine single crystals during high-temperature creep, Geophys. Res. Lett., 20, 1479–1482, 1993. a
Karato, S.-I., Zhang, S., and Wenk, H.-R.: Superplasticity in Earth's lower mantle: Evidence from Seismic anisotropy and rock physics, Science, 270, 458–461, 1995. a
Kendall, J.-M. and Silver, P. G.: Constraints from seismic anisotropy on the nature of the lowermost mantle, Nature, 381, 409, 1996. a, b
Koelemeijer, P., Ritsema, J., Deuss, A., and van Heijst, H.-J.: SP12RTS: a degree-12 model of shear- and compressional-wave velocity for Earth's mantle, Geophys. J. Int., 204, 1024, https://doi.org/10.1093/gji/ggv481, 2016. a
Korenaga, J.: Firm mantle plumes and the nature of the core-mantle boundary region, Earth Planet. Sc. Lett., 232, 29–37, 2005. a, b
Kuo, B.-Y., Garnero, E. J., and Lay, T.: Tomographic inversion of S-SKS times for shear velocity heterogeneity in D: Degree 12 and hybrid models, J. Geophys. Res.-Sol. Ea., 105, 28139–28157, 2000. a
Lay, T. and Young, C. J.: Analysis of seismic SV waves in the core's penumbra, Geophys. Res. Lett., 18, 1373–1376, 1991. a
Lay, T., Williams, Q., Garnero, E. J., Kellogg, L., and Wysession, M. E.: Seismic wave anisotropy in the D region and its implications, The core-mantle boundary region, 28, 299–318, 1998. a, b
Lekic, V., Cottaar, S., Dziewonski, A., and Romanowicz, B.: Cluster analysis of global lower mantle tomography: A new class of structure and implications for chemical heterogeneity, Earth Planet. Sc. Lett., 357, 68–77, 2012. a
Lourenço, D. L., Rozel, A. B., and Tackley, P. J.: Melting-induced crustal production helps plate tectonics on Earth-like planets, Earth Planet. Sc. Lett., 439, 18–28, https://doi.org/10.1016/j.epsl.2016.01.024, 2016. a
Lourenço, D. L., Rozel, A. B., Gerya, T. V., and Tackley, P. J.: Efficient cooling of rocky planets by intrusive magmatism, Nat. Geosci., 11, 322–327, https://doi.org/10.1038/s41561-018-0094-8, 2018. a, b
Masters, G., Laske, G., Bolton, H., and Dziewonski, A.: The relative behavior of shear velocity, bulk sound speed, and compressional velocity in the mantle: implications for chemical and thermal structure, Earth's deep interior: mineral physics and tomography from the atomic to the global scale, 117, 63–87, 2000. a, b
McNamara, A. and Zhong, S.: Thermochemical structures within a spherical mantle: Superplumes or Piles?, J. Geophys. Res.-Sol. Ea., 109, B07402, https://doi.org/10.1029/2003JB002847, 2004. a, b, c, d
McNamara, A. and Zhong, S.: Thermochemical Structures Beneath Africa and the Pacific Ocean, Nature, 437, 1136–1139, 2005. a, b
McNamara, A. K., Karato, S.-I., and van Keken, P. E.: Localization of dislocation creep in the lower mantle: implications for the origin of seismic anisotropy, Earth Planet. Sc. Lett., 191, 85–99, https://doi.org/10.1016/S0012-821X(01)00405-8, 2001. a, b
McNamara, A. K., Van Keken, P. E., and Karato, S.-I.: Development of anisotropic structure in the Earth's lower mantle by solid-state convection, Nature, 416, 310–314, 2002. a, b
Mulyukova, E. and Bercovici, D.: Formation of lithospheric shear zones: Effect of temperature on two-phase grain damage, Phys. Earth Planet. In., 270, 195–212, 2017. a
Nakagawa, T. and Tackley, P. J.: Influence of combined primordial layering and recycled MORB on the coupled thermal evolution of Earth's mantle and core, Geochem. Geophys. 15, 619–633, https://doi.org/10.1002/2013GC005128, 2014. a, b
Poirier, J., Peyronneau, J., Gesland, J., and Brebec, G.: Viscosity and conductivity of the lower mantle; an experimental study on a MgSiO3 perovskite analogue, KZnF3, Phys. Earth Planet. In., 32, 273–287, https://doi.org/10.1016/0031-9201(83)90131-0, 1983. a
Ranalli, G.: Rheology of the Earth, Chapman and Hall, London, UK, 2 Edn., 1995. a
Ranalli, G. and Fischer, B.: Diffusion creep, dislocation creep, and mantle rheology, Phys. Earth Planet. In., 34, 77–84, 1984. a, b
Ritsema, J., van Heijst, H. J., and Woodhouse, J. H.: Complex shear wave velocity structure imaged beneath Africa and Iceland, Science, 286, 1925–1928, 1999. a
Ritsema, J., Deuss, A., van Heijst, H. J., and Woodhouse, J. H.: S40RTS: a degree-40 shear-velocity model for the mantle from new Rayleigh wave dispersion, teleseismic traveltime and normal-mode splitting function measurements, Geophys. Int., 184, 1223, https://doi.org/10.1111/j.1365-246X.2010.04884.x, 2011. a
Rozel, A. B., Ricard, Y., and Bercovici, D.: A thermodynamically self-consistent damage equation for grain size evolution during dynamic recrystallization, Geophys. J. Int., 184, 719–728, https://doi.org/10.1111/j.1365-246X.2010.04875.x, 2011. a, b, c
Schierjott, J. C.: Data sets used for model 3, 7 and 72 in the paper “On the self-regulating effect of grain size evolution in mantle convection models: Application to thermo-chemical piles”, ETH Zürich, https://doi.org/10.3929/ethz-b-000371505, 2019. a
Solomatov, V.: Grain size-dependent viscosity convection and the thermal evolution of the Earth, Earth Planet. Sc. Lett., 191, 203–212, 2001. a, b
Solomatov, V. and Reese, C.: Grain size variations in the Earth's mantle and the evolution of primordial chemical heterogeneities, J. Geophys. Res., 113, B07408, https://doi.org/10.1029/2007JB005319, 2008. a, b
Solomatov, V. S. and Moresi, L.-N.: Stagnant lid convection on Venus, J. Geophys. Res., 101, 4737–4753, 1996. a, b
Solomatov, V. S., El-Khozondar, R., and Tikare, V.: Grain size in the lower mantle: constraints from numerical modeling of grain growth in two-phase systems, Phys. Earth Planet. In., 129, 265–282, https://doi.org/10.1016/S0031-9201(01)00295-3, 2002. a, b
Tackley, P., Ammann, M., Brodholt, J., Dobson, D., and Valencia, D.: Mantle dynamics in super-Earths: Post-perovskite rheology and self-regulation of viscosity, Icarus, 225, 50–61, https://doi.org/10.1016/j.icarus.2013.03.013, 2013. a
Tackley, P. J.: Modelling compressible mantle convection with large viscosity contrasts in a three-dimensional spherical shell using the yin-yang grid, recent Advances in Computational Geodynamics: Theory, Numerics and Applications, Phys. Earth Planet. In., 171, 7–18, https://doi.org/10.1016/j.pepi.2008.08.005, 2008. a, b
Torsvik, T. H., Smethurst, M. A., Burke, K., and Steinberger, B.: Large igneous provinces generated from the margins of the large low-velocity provinces in the deep mantle, Geophys. J. Int., 167, 1447, https://doi.org/10.1111/j.1365-246X.2006.03158.x, 2006. a, b
Torsvik, T. H., Burke, K., Steinberger, B., Webb, S. J., and Ashwal, L. D.: Diamonds sampled by plumes from the core-mantle boundary, Nature, 466, 352–355, 2010. a, b
Trampert, J., Deschamps, F., Resovsky, J., and Yuen, D.: Probabilistic tomography maps chemical heterogeneities throughout the lower mantle, Science, 306, 853–856, 2004. a, b, c
Warren, J. and Hirth, G.: Grain size sensitive deformation mechanisms in naturally deformed peridotites, Earth Planet. Sc. Lett., 248, 428–450, 2006. a
Weertman, J.: The creep strength of the Earth's mantle, Rev. Geophys., 8, 145–168, 1970. a
Yamazaki, D., Inoue, T., Okamoto, M., and Irifune, T.: Grain growth kinetics of ringwoodite and its implication for rheology of the subducting slab, Earth Planet. Sc. Lett., 236, 871–881, https://doi.org/10.1016/j.epsl.2005.06.005, 2005. a