the Creative Commons Attribution 4.0 License.
the Creative Commons Attribution 4.0 License.
 | 02 Sep 2022
Control of crustal strength, tectonic inheritance, and stretching/ shortening rates on crustal deformation and basin reactivation: insights from laboratory models
Benjamin Guillaume
Guido M. Gianni
Jean-Jacques Kermarrec
Khaled Bock
Geological settings characterized by multiple coeval tectonic regimes provide a unique opportunity to understand complex interactions among different geodynamic processes. However, they remain comparatively less studied from an experimental point of view than areas with more simple patterns of deformation resulting from primary plate–boundary interactions. Here, we carried out analog experiments involving simultaneous shortening and orthogonal extension under different rheological conditions, including the effect of crustal inheritance. We performed brittle experiments and brittle–ductile experiments to simulate cases of “strong” and “weak” crusts, respectively. We present two types of experiments: (i) one-stage experiments with either shortening only or synchronous orthogonal shortening and stretching and (ii) two-stage experiments with a first stage of stretching and a second stage with either shortening only or synchronous orthogonal shortening and stretching. In our models, deformation is accommodated by a combination of normal, thrust, and strike-slip faults with structure location depending on boundary conditions and crustal inheritance. For brittle models, we show that the three types of structures can develop at the same time for intermediate ratios of stretching (extension) over shortening rates (). For lower ratios, deformation is accommodated by in-sequence shortening-orthogonal thrust faults and stretching-orthogonal normal faults at the edges of the model (when Ve>0). For larger ratios and for the same amount of stretching, deformation is accommodated by normal faults at edges and in the center of the model as well as by conjugate strike-slip faults at the edges of the model. For brittle–ductile models, we always observe strike-slip faults that crosscut the entire model. They are associated with shortening-orthogonal thrust faults for models with low and no initial extensional stage or stretching-orthogonal normal faults for models with high and an initial extensional stage. Whatever the crustal strength, the past deformation history, and the stretching / shortening ratio, both normal and thrust faults remain with similar orientations, i.e., stretching-orthogonal and shortening-orthogonal, respectively. Instead, strike-slip faults exhibit orientations with respect to the shortening direction that vary between ∼0 and ∼65∘. Strike-slip faults parallel to the shortening direction develop in previously extended portions of models with a brittle–ductile crust, while strike-slip faults with a high angle form at the boundaries of the brittle model, their orientation being to some extent influenced by pre-existing or newly forming graben in the center of the model. We also show that extensional structures formed during a first stage of deformation are never inverted under orthogonal shortening but can be reactivated as normal or strike-slip faults depending on . Our experiments reproduce V-shaped conjugate strike-slip systems and normal faulting during compression similar to structures observed in the Tibetan Plateau, the eastern Alps, western Anatolia, and the Central Asia orogen. Models with two-stage deformation show variable extensional to strike-slip reactivation of former extensional basins during basin-parallel shortening, which resembles synorogenic foreland transtensional reactivations documented in the Baikal and Golfo de San Jorge basins.
- Article
(13394 KB) - Full-text XML
-
Supplement
(8008 KB) - BibTeX
- EndNote


Forces generated at plate boundaries and the derived stress field result in tectonic regime characteristics of different geodynamic settings (e.g., Anderson, 1905). For instance, contractional regimes are more common at convergent plate boundaries in non-collisional (e.g., Central Andes, Barnes and Ehlers, 2009) and collisional orogens (e.g., Tibetan orogenic Plateau, Royden et al., 2008) associated with fold-and-thrust belt development and crustal thickening. Extensional regimes are characteristic of divergent plate boundaries associated with mid-ocean ridges, intraplate regions in continental rifts (e.g., East African rift system, Chorowicz (2005); Basin and Range Province, Dickinson, 2002), and retreating subduction settings in intra-arc and back-arc areas (e.g., western Pacific marginal basins, Hilde et al., 1977). Strike-slip regimes can be found in convergent settings where transcurrent faults run along magmatic arcs in contexts of oblique subduction (e.g., Liquiñe–Ofqui fault zone, Cembrano et al. (1996); the Great Sumatra fault, Berglar et al. (2010); Median Tectonic Line in Japan, Takagi, 1986), in hinterland regions of collisional orogens and related areas of tectonic escape (Tapponnier et al., 1982, 2001), in intraplate transcurrent regions (Molnar and Dayem, 2010), and at plate–boundary transform zones (e.g., Woodcock, 1986). In all settings, upper-plate weaknesses exert a major control in nucleation, reactivation, and orientation of structures (e.g., Sutherland et al., 2000; Tapponnier et al., 2001; Chorowicz, 2005; Pfiffner, 2017). It is noteworthy that the three tectonic regimes can take place variably in all geodynamic settings, and contrasting regimes may be active in different places (e.g., Harland and Bayly, 1958; Woodcock, 1986; Zoback, 1992). Cases where multiple tectonic regimes acted closely in space and time have long been recognized (Fig. 1). The coexistence of thrust, strike-slip, and normal faulting has been documented in thick orogenic regions reaching crustal thicknesses above ∼60 km (e.g., Molnar and Tapponnier, 1978; Giambiagi et al., 2016) and in oblique convergent settings associated with strain partitioning (Chemenda et al., 2000; Krézsek et al., 2013). It is also observed in areas of indentation tectonics and lateral escape (Tapponnier et al., 1982, 2001; Ratschbacher et al., 1991), synorogenic foreland rifting/transtension settings, where extension–transtension takes place in close spatiotemporal relation with plate–margin shortening (Sengör, 1976; Dèzes et al., 2004; Gianni et al., 2015), and in regions undergoing oroclinal bending (Allmendinger, 2005; Gutierrez-Alonso et al., 2012; Johnston and Acton, 2003; Krstekanić et al., 2021, 2022) (Fig. 1). However, the mechanisms and boundary conditions allowing the coeval existence of different tectonic regimes are not yet fully understood.

Figure 1(a) Geological sketch maps showing locations with active or past multiple coeval tectonic regimes (Tapponnier et al., 1982, 2001; Davy and Cobbold, 1988; Martinod et al., 2000; Fournier et al., 2004; Corti et al., 2006; Scharf et al., 2013; Sengör, 1976; Dèzes et al., 2004; Gianni et al., 2015). (b) Close-up map showing the tectonic setting of the Alpine–Mediterranean region. Structures are modified from Faccenna et al. (2014). (c) Block diagram illustrating typical structures formed in settings involving coeval shortening and extension. Abbreviations are as follows: SA, South American plate; I, Indian plate; E, Eurasian plate; AF, African plate; AR, Arabian plate; IB, Iberian plate; A, Adria plate.
From a modeling point of view, numerical and analog models have been helpful to gain insights into the kinematic and dynamic evolution of geological structures associated with contractional (e.g., Davis et al., 1983; Koyi, 1995; Burbidge and Braun, 2002; Lohrmann et al., 2003; Simpson, 2011; Graveleau et al., 2012), extensional (e.g., Vendeville et al., 1987; Brun, 1999; Zwaan et al., 2016, 2021), and strike-slip regimes (e.g., McClay and Bonora, 2001; Dooley and Schreurs, 2012). These studies allowed a better understanding of deformation at a crustal or lithospheric scale and basin-formation processes simulating scenarios that reproduce a particular tectonic regime or a succession of these, such as in basin inversion experiments (e.g., Buiter and Pfiffner, 2003; Bonini et al., 2012). Simulation of more complex scenarios, where several tectonic regimes act in concert to produce intricate patterns of deformation, allowed us, for instance, to gain insights into thrust–wrench interferences (e.g., Duarte et al., 2011; Rosas et al., 2012, 2015; Fedorik et al., 2019), back-arc-convex orocline formation (e.g., Krstekanić et al., 2021, 2022), regional deformation in the eastern Asian lithosphere triggered by the collisional far-field effects of India and/or Pacific subduction (e.g., Tapponnier et al., 1982; Davy and Cobbold, 1988; Fournier et al., 2004; Schellart et al., 2019), or the formation of the V-shaped south China oceanic basin (Le Pourhiet et al., 2018; Jourdon et al., 2020). In addition, brittle–ductile analog and 3D numerical experiments have been applied to understand complex regional deformation resulting from the close interrelation between the indentation of Arabia, the lateral escape of Anatolia, and back-arc extension in the Aegean region (e.g., Martinod et al., 2000; Sternai et al., 2014; Philippon et al., 2014) and lateral escape and extension in the eastern Alps resulting from the indentation of the Adriatic plate (Ratschbacher et al., 1991; van Gelder et al., 2017). Models imposing coeval orthogonal shortening and stretching with a brittle crust (Corti et al., 2006) or a brittle–ductile crust (Dhifaoui et al., 2021) have also been carried out to understand the strain distribution along the Maghrebides–Apennines accretionary prism and the Sicily Channel rift, where coexisting grabens, strike-slip, and thrust faults formed a complex structural pattern in the general context of Nubia–Eurasia plate convergence. While these studies provide some elements for understanding the coexistence of different tectonic regimes and associated structures, there is a lack of systematic investigation of the role of the relative ratio between shortening and stretching rates, as horizontal extrusion may not always only result from orthogonal indentation but may also be controlled by far-field forces leading to non-plane-strain deformation. In addition, the role of the strength of the crust, owing to its composition or to inherited structures, is not always taken into account, while it may be of importance in controlling the type and location of structures accommodating deformation (e.g., Cruden et al., 2006; Munteanu et al., 2013; Zwaan et al., 2021).
In this study, we carry out a series of brittle and brittle–ductile analog experiments to gain insights into the role played by simultaneous shortening and orthogonal extension under different boundary and rheological conditions on the crustal tectonic regime. We also analyze the role of crustal inheritance in fault reactivation and potential basin inversion during coeval shortening and lateral extension, which has not been explored so far. Although we do not intend to reproduce any specific natural case, we find some similarities between our experiments and deformation patterns in several natural cases, which provide additional insights into the rheological conditions and kinematics associated with their formation.
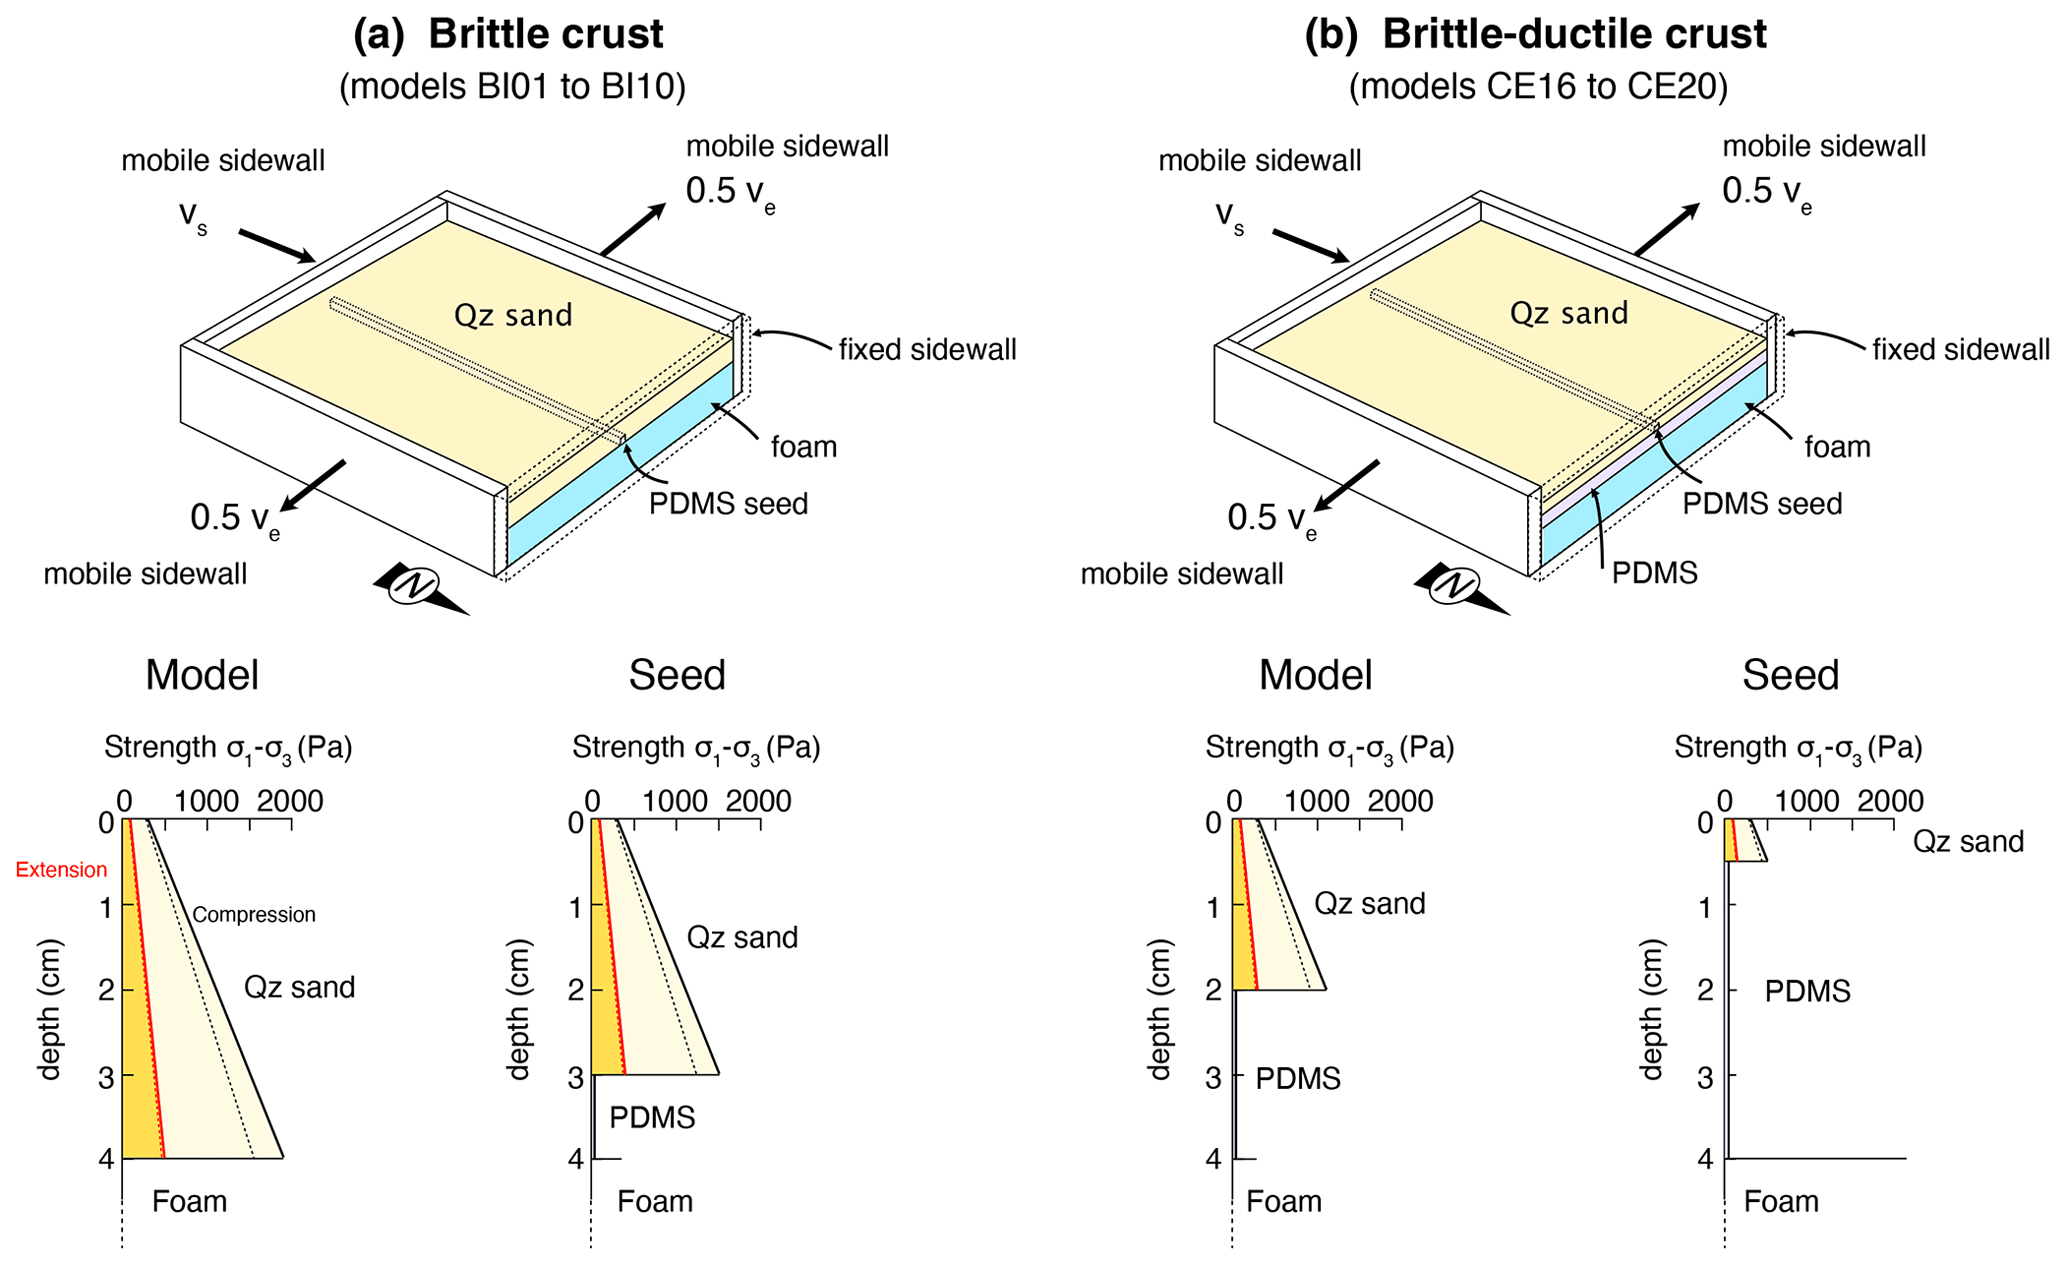
Figure 2Experimental setup (top) and corresponding strength envelopes (bottom) under extension and compression for (a) models with brittle crust (“strong” crust) and (b) models with a brittle–ductile crust (“weak” crust). Solid lines correspond to the peak friction for Qz sand and dashed lines to the reactivation friction.
2.1 Materials
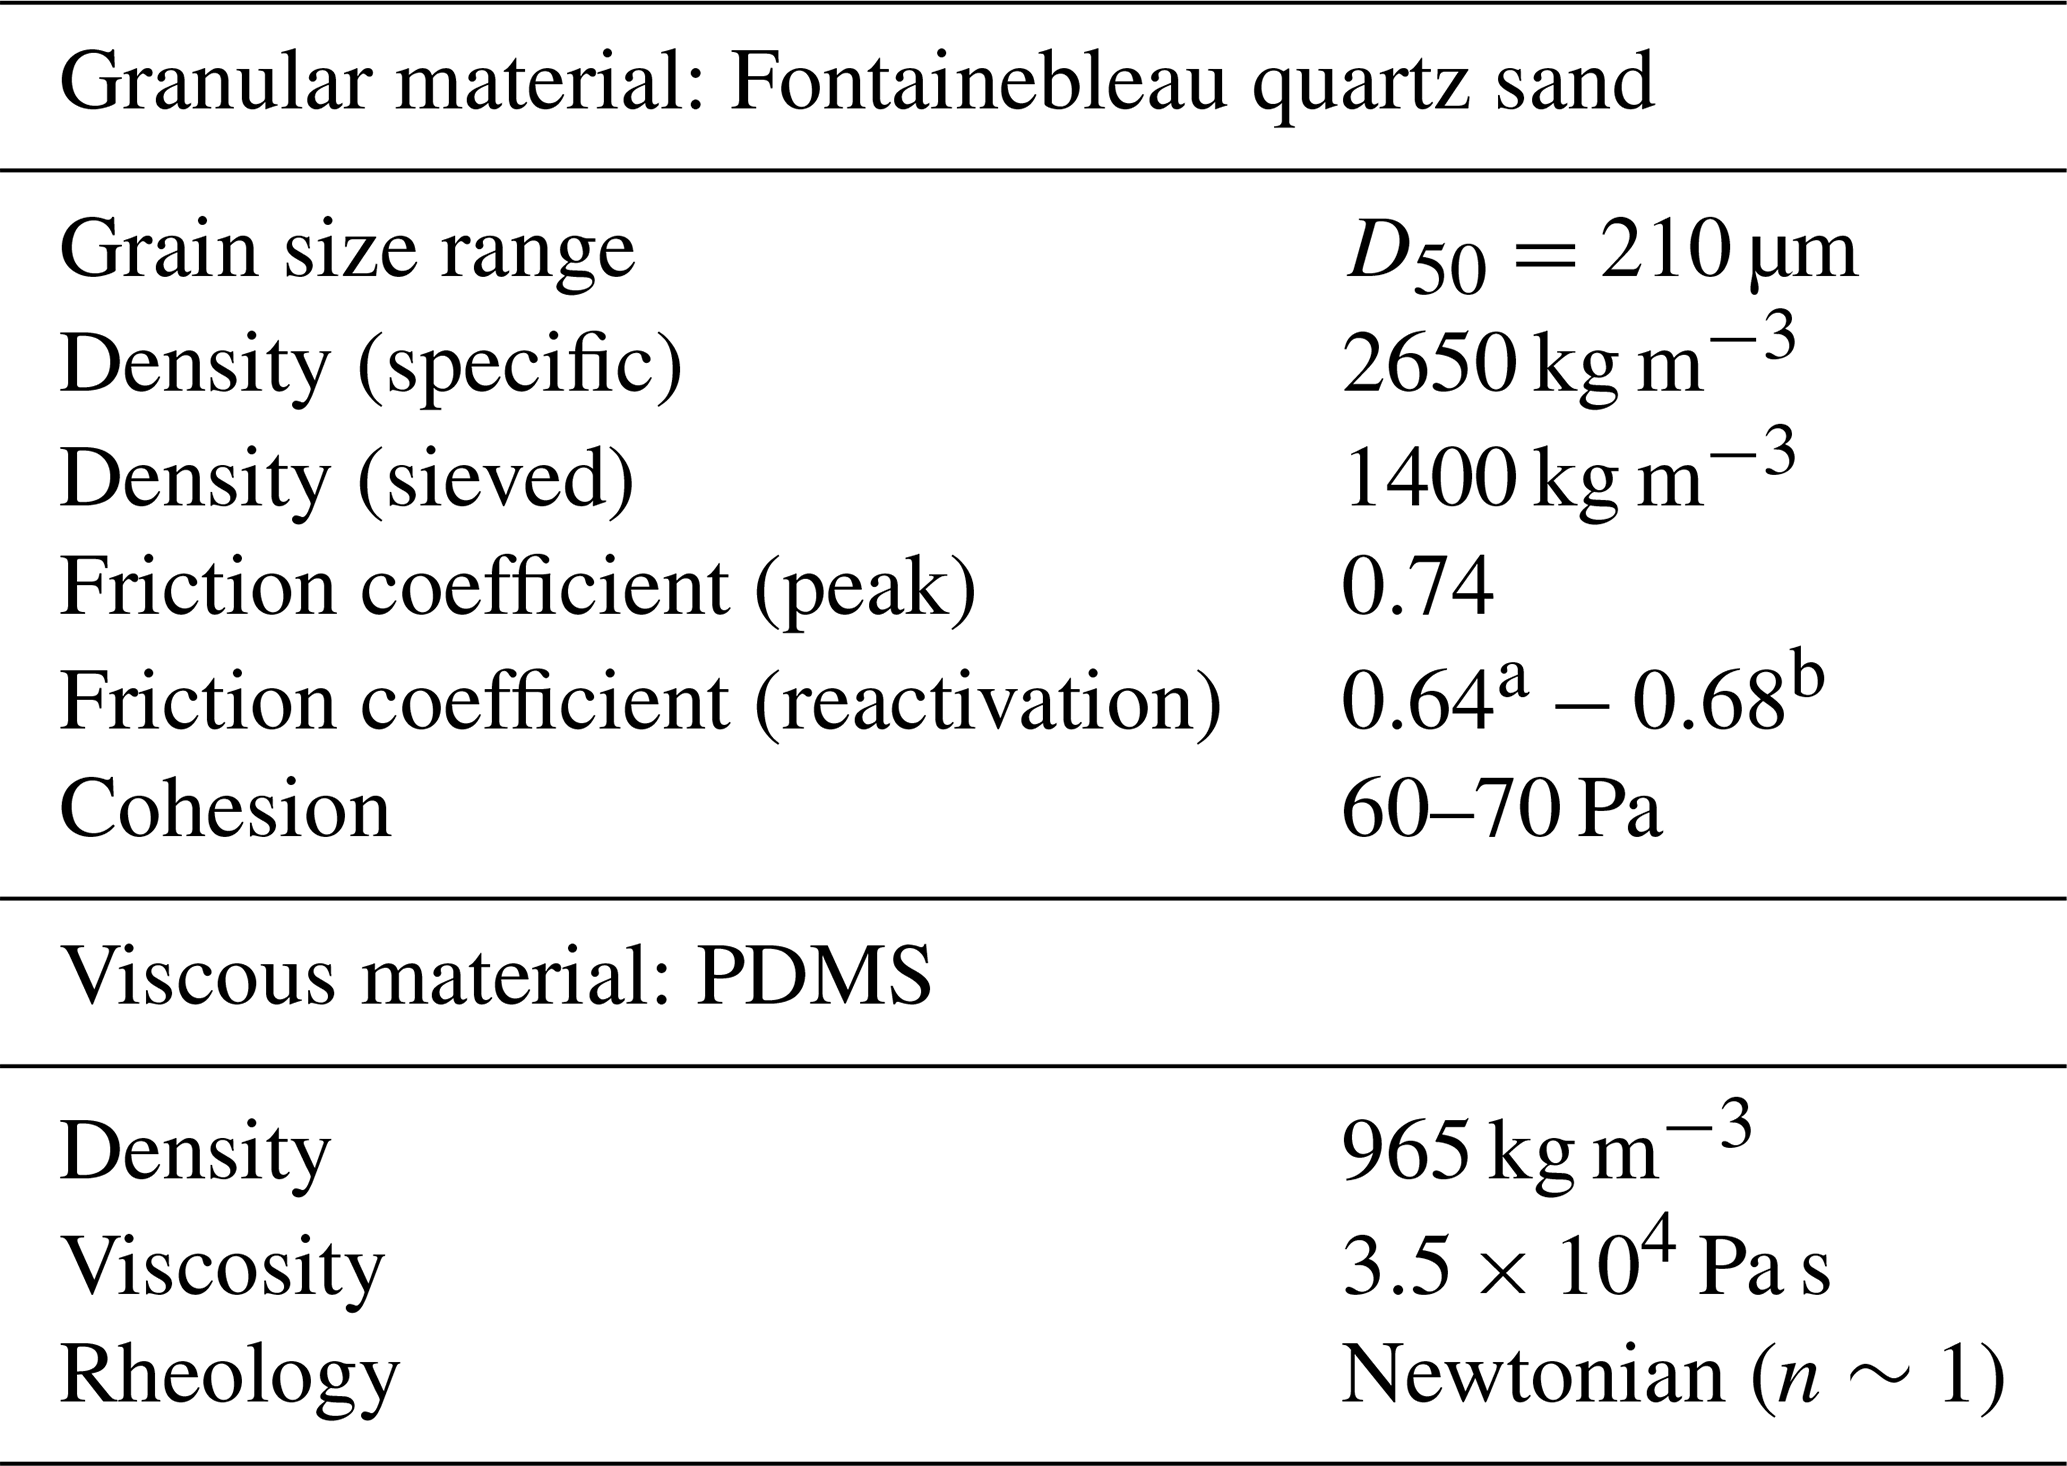
We perform both brittle (one-layer) experiments (models BI) and brittle–ductile (two-layer) experiments (models CE) to reproduce a brittle upper crust and a brittle–ductile crust simulating cases of “strong” and “weak” crusts, respectively (Fig. 2). For both types of experiments, the 4 cm thick single or double layers rest on top of a foam layer (8 cm thickness). To simulate the brittle part of the crust, whose behavior is of the Mohr–Coulomb type (Byerlee, 1978), we use Fontainebleau quartz sand (NE34, Sibelco, France, D50=210 µm) (Klinkmüller et al., 2016). This material has a peak friction of 0.74 and an immediate reactivation friction (after 10 s) of 0.64 (Rudolf et al., 2022). Healing of this material increases the reactivation friction to 0.68 after 2.6 h (maximum duration of our experiments) (Table 1). The cohesion (C) of Fontainebleau quartz sand is around 60–70 Pa (e.g., Klinkmüller et al., 2016; Schreuers et al., 2016). We sieve the dry sand from a height of ∼15–20 cm, ensuring that its density is 1400 kg m−3 (Table 1). Dry sand exhibits frictional plastic behavior and the geometry of structures that form when deformed does not depend on the applied strain rate. The strength of the sand layer is calculated following Schellart (2000):
with and , where ϕ is the angle of internal friction (Fig. 2).
To simulate the ductile part of the crust, we use PDMS silicone whose density is 965 kg m−3 and viscosity μ is around 3.5×10⁴ Pa s−1 (Table 1). This material has a Newtonian rheology (n=1) for strain rates lower than 10−2 s−1 (e.g., Rudolf et al., 2016; Guillaume et al., 2021). Strain rates based on the length of the models and applied velocities at model boundaries are in the range of 1.2– s−1. The strength of the layer of silicone putty (σ1−σ3) varies with imposed strain rates as
where η is the viscosity and the strain rate. For the values of applied strain rates, differential stress is on the order of 0.4–1.6 Pa. Initial strength envelopes for both types of models and different parts of the models are shown in Fig. 2. The polyurethane foam RG35 used at the base of the model has a Poisson coefficient of 0.12 and allows producing a linearly varying velocity field (no velocity discontinuities) at the base of the deforming pile by compressing it to obtain shortening or letting it decompress to obtain stretching. However, there is a limitation on the amount of applied stretching/shortening. After 20 % of shortening, the foam starts buckling and we therefore limit the amount of applied stretching/shortening under this threshold.
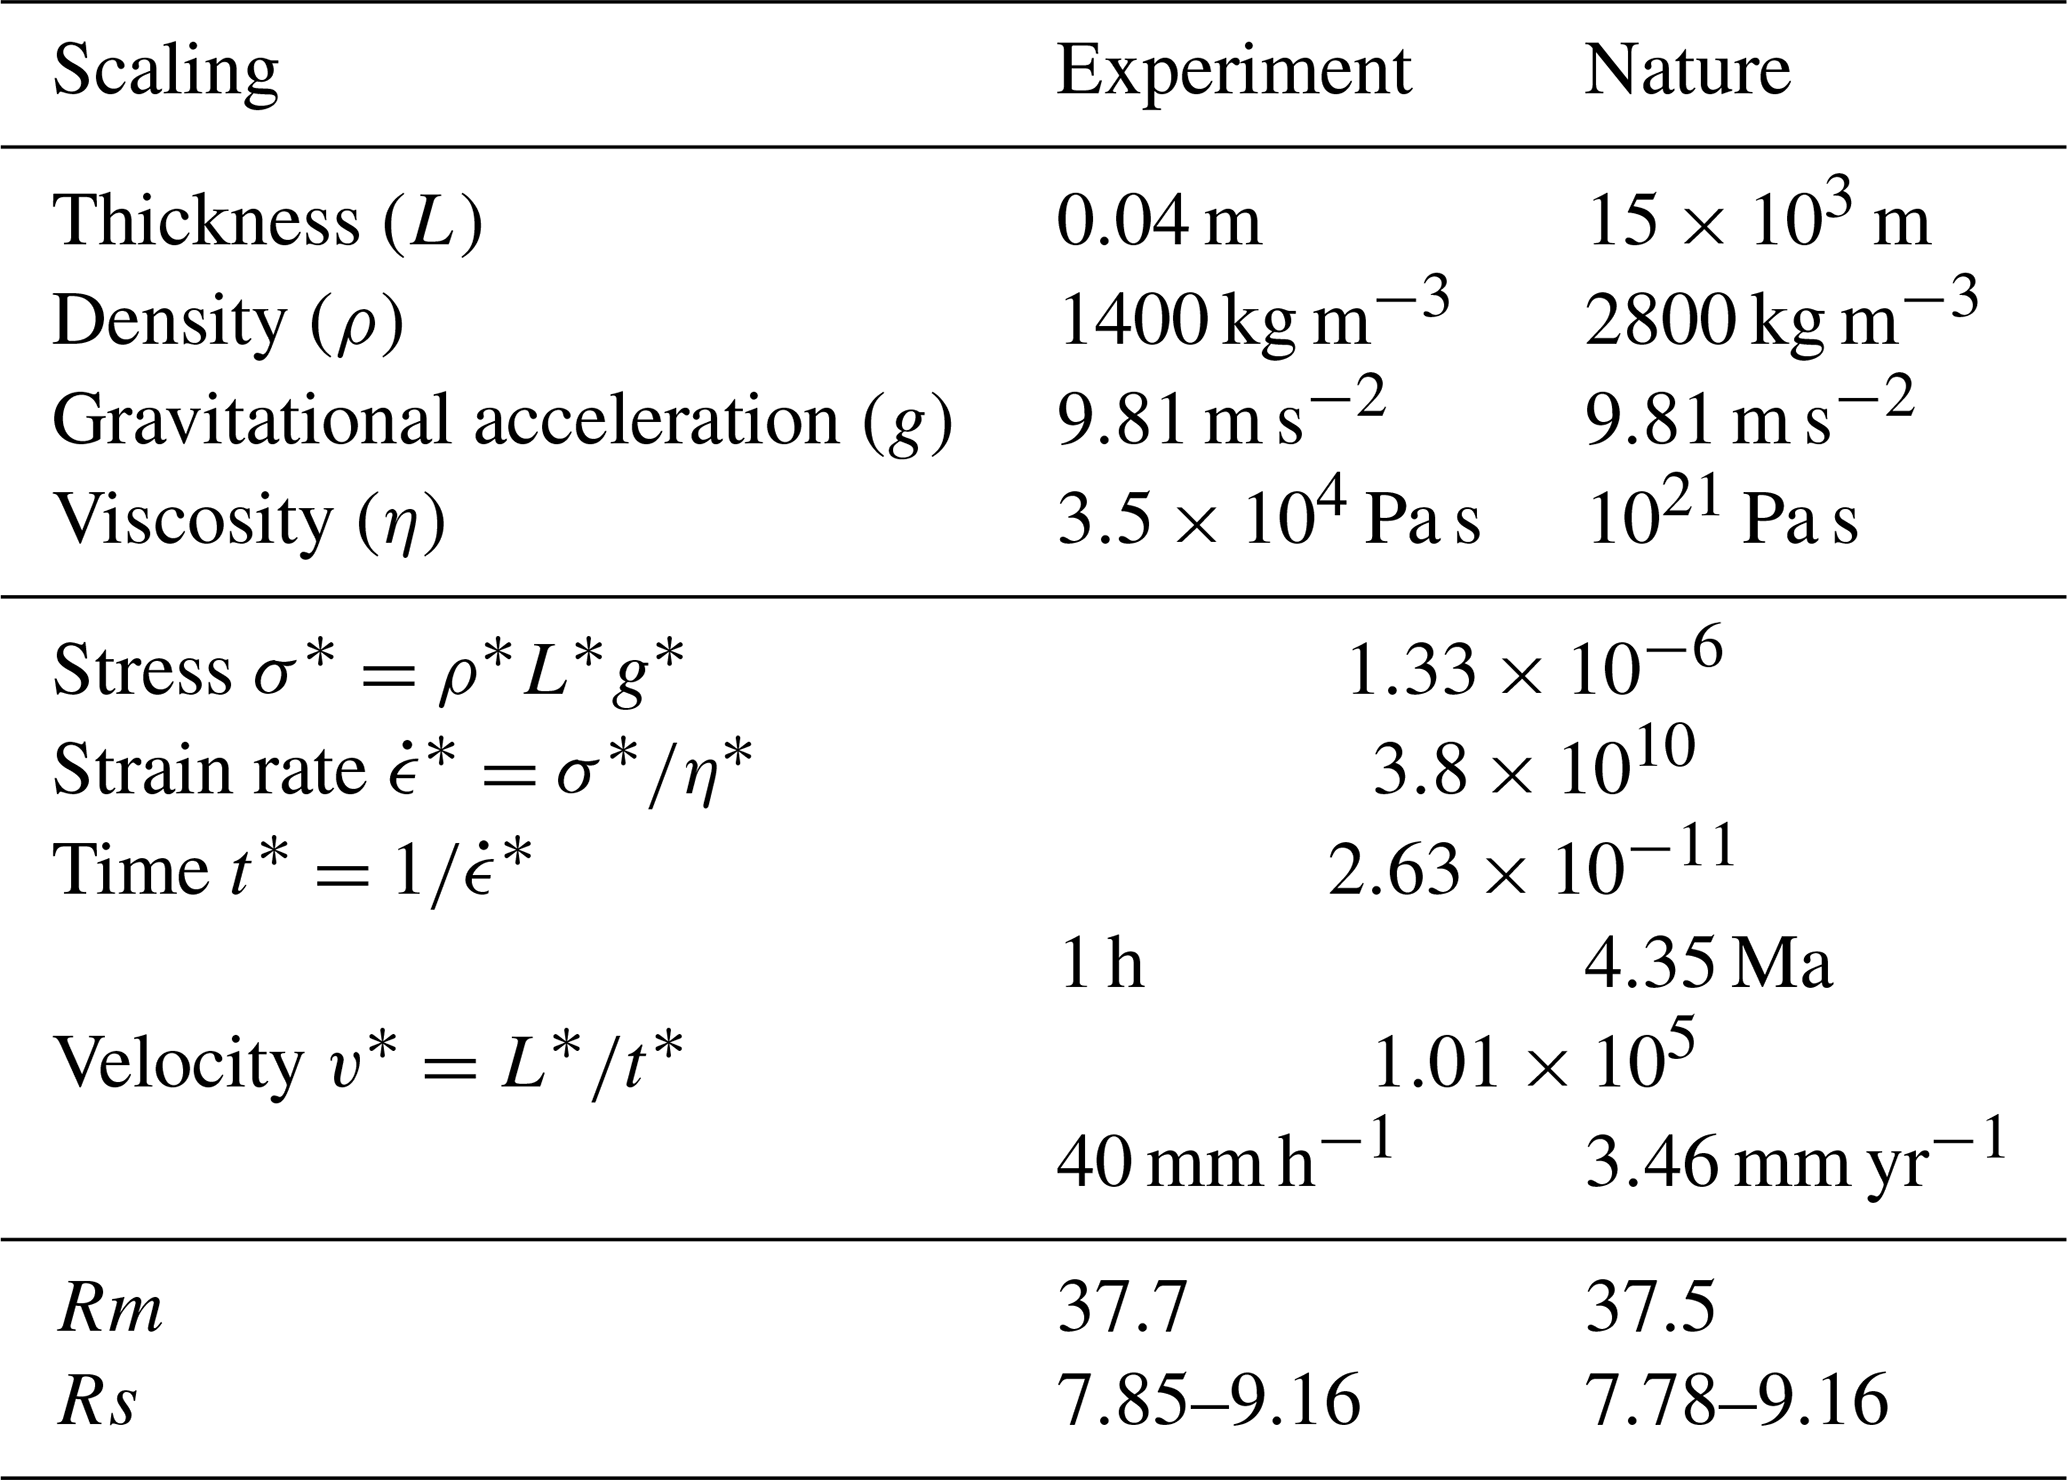
Table 2Scaling between the model and nature. By convention, ratios (*) are given as laboratory/nature. The Rm number is given for a velocity of 60 mm h−1 in the model (equivalent to 5.2 mm yr−1 in nature). The Rs number is given for a cohesion of 60–70 Pa in the model and 45–53 MPa in nature.
2.2 Scaling
We follow the scaling procedure shown, e.g., in Zwaan et al. (2019) and based on Hubbert (1937), Ramberg (1981), and Weijermars and Schmeling (1986). The scaling parameters are given in Table 2. Stress ratios between the laboratory and nature σ* are calculated as follows:
where ρ* represents the density ratio, g* the gravity ratio, and L* the length ratio. Considering that we simulate the upper 15 km of the crust with our 4 cm thick pile of material, it gives , i.e., that 1 Pa in the lab corresponds to 0.75 MPa in nature.
For the two-layered models, the density ratio between the brittle and ductile parts of the crust is high (1.45). Increasing the density of the viscous layer would have resulted in a strong increase in its viscosity, which would have required applying speeds too low for the capacities of the engines used. We acknowledge that it leads to buoyancy forces that may trigger gravitational instability of the silicone layer and possible amplification of the folding of the brittle–ductile interface during shortening/stretching. However, given the relatively high viscosity of the silicone layer and the limited amount of deformation and short duration of these models (between 1.6 and 2.6 h), we consider that such a process may remain limited during the experimental time frame.
The strain rate ratio is obtained as the ratio between the stress ratio σ* and the viscosity ratio η*:
We assume a natural viscosity for the crust of 1021 Pa s, within the range of proposed values in varying tectonic contexts ( Pa s; e.g., Buck, 1991; Brun, 1999; Bürgman and Dresen, 2008). It gives ; i.e., imposed strain rates correspond to strain rates of s−1 in nature.
The time ratio t* can be obtained from
It implies that 1 h in the lab corresponds to 4.34 Ma in nature. Given that the duration of our models is at a maximum 2.6 h, we simulate geological processes lasting for ∼11 Ma at a maximum.
The velocity ratio v* is obtained from
The imposed values for extension/shortening rates between 0 and ∼60 mm h−1 in the lab correspond to 0–5.2 mm yr−1 in nature, typical values for continental rifting (e.g., Saria et al., 2014), subduction- and collision-related (e.g., Andes, Oncken et al., 2006; Alps, Sternai et al., 2019; Zagros, Tatar et al., 2002), or intra-continental collision orogens (e.g., Pyrenees, Mouthereau et al., 2014; Tian Shan, Saint-Carlier et al., 2016).
The dynamic similarity between our experiments and the natural case for the viscous regime is verified by computing the ratio between lithostatic pressure and viscous strength (Ramberg number Rm):
which gives a value of ∼37 considering the maximum deformation velocity for both the model and the natural case (Table 2). For the brittle regime, the dimensionless friction coefficient is similar (0.6–0.7) in the laboratory and in nature. The ratio between gravitational stress and cohesive strength is also similar with values ranging between 7.85 and 9.16 considering a cohesion in nature of 45–53 MPa (Table 2), which is well within the range of cohesion values measured on natural rocks at 24–110 MPa (Jaeger and Cook, 1976; Raleigh and Paterson, 1965; Twiss and Moore, 1992; Handin, 1969).
2.3 Procedure and analysis
The cm layer of foam is initially compressed in one direction and is maintained in this state for the rest of the preparation phase. For the two-layer models, we place a pre-cut PDMS layer with dimensions of 50 cm × 50 cm × 2 cm (Fig. 2). Sieving of the sand is performed from a distance of 15–20 cm above the PDMS layer, and the sand is leveled with a rigid plate until the desired thickness is achieved. The brittle part of the crust is made of white quartz sand that is randomly sprinkled on top with black colored sand in order to allow particle detection for digital image correlation. Before deformation, the models cover an area of ca. 46 cm × 46 cm that would represent an area of 172 km × 172 km in nature.
We also include “seeds” in our models to help localize deformation. They may represent weak zones inherited from previous phases of deformation. This weaker zone in our experiments is also compatible with the requirement of a finite-width low-viscosity zone underneath the fault zones possibly caused by grain size reduction, shear-heating, and localized presence of fluids (e.g., Le Pourhiet et al., 2014). These seeds are linear pieces of silicone that are placed on top of the silicone layer or directly on top of the foam for the brittle models (Fig. 2). They are placed at the center of the models, orthogonal to the extension direction, have a rectangular shape, and extend along the entire length of the model. The dimensions of the seed are 46 cm × 1.5 cm × 1.5 cm for the brittle–ductile models and 46 cm × 1.5 cm × 1 cm for the brittle models (Fig. 2). The strength of the crust is decreased at these locations owing to the reduced thickness of the overlying sand layer (Fig. 2), which in turn may help deformation to localize.

Figure 3Applied boundary kinematic conditions for models with brittle crust (circles) and brittle–ductile crust (squares). Models with two-stage deformation have black filled symbols and subscripts to indicate the stage of deformation. Laboratory and scaled values are given for the shortening and stretching rates.
The layer(s) are then deformed by applying a constant velocity boundary condition at the edges of the model through pistons activated by step motors, which allows us to precisely control the stretching rate to shortening rate ratio. Stretching is applied to both edges of the models by letting the foam decompress while shortening is only applied to one side of the models, the other side having a no-motion boundary condition (Fig. 2). We arbitrarily consider the non-moving wall as the north in our experiments. We performed two types of experiments: (i) one-stage experiments with either shortening only or synchronous orthogonal shortening and stretching and (ii) two-stage experiments with a first phase of 5 % stretching and a second phase with either shortening only or synchronous orthogonal shortening and stretching in order to study the possible reactivation/inversion of structures formed during the first stage (Fig. 3). Applied velocities for stretching vary between 0 and 75 mm h−1 and for shortening between 0 and 43 mm h−1 (Fig. 3).
We do not include surface processes in the models (erosion, deposition), especially in between the two stages of deformation, meaning that the created grabens remain unfilled when the second stage of deformation starts. While we acknowledge that redistribution of mass associated with surface processes may impact stress distribution and further deformation (e.g., Mugnier et al., 1997; Pinto et al., 2010), we wanted to ensure similar conditions between models that are difficult to achieve when manually intervening during the course of the experiment.
Experiments are recorded from the top by a DSLR camera (Nikon D3300) taking pictures every 2 min. Pictures are then automatically analyzed using an image cross-correlation technique, particle image velocimetry (PIV), using the PIVlab software (Thielicke and Sonntag, 2021). We pre-process the images with a CLAHE (contrast-limited adaptive histogram equalization) filter with a window size of 64 px to enhance contrast in the pictures and allow particle detection. PIV analyses are made with the direct Fourier transform correlation with multiple passes and deforming windows with interrogation areas of 128, 64, and 32 px and with a step of 50 %. PIV results are then calibrated using spatial scales set on top of the models. We obtain velocity maps with a spatial resolution of 16 px, corresponding to ∼4 mm (∼1.5 km in nature).
Velocity fields obtained from the PIV analyses are then processed with the StrainMap algorithm (Broerse et al., 2021) that allows tracking the cumulative deformation field and as such mapping the distribution of deformation over time. In particular, this algorithm is based on the description of shape changes in terms of Hencky strains. It allows us to discriminate between coexisting strike-slip faults, thrust faults, and normal faults, and their evolution over time and as such efficiently complement inherently subjective visual inspection. Videos and strain analysis of the 12 experiments are available in Guillaume et al. (2022).
3.1 Brittle-only models: role of inheritance under varying stress fields
3.1.1 Inheritance as a crustal heterogeneity (seed)
We investigate the role of a crustal heterogeneity (basal seed orthogonal to the stretching direction) on deformation distribution under different kinematic boundary conditions for a brittle crust (Fig. 2a). For this, we performed a series of five single-stage models in which the ratio of stretching velocity over shortening velocity is varied between 0 (no stretching) and 2.8 (stretching dominated) (Fig. 3). We compute the principal stretches λmax and λmin and the corresponding strain type for the five models after 4 % of shortening (Fig. S1 in the Supplement) and 10 % of stretching for models BI05 to BI09 and 12 % of shortening for the model BI10 with zero stretching (Figs. 4 and S2).
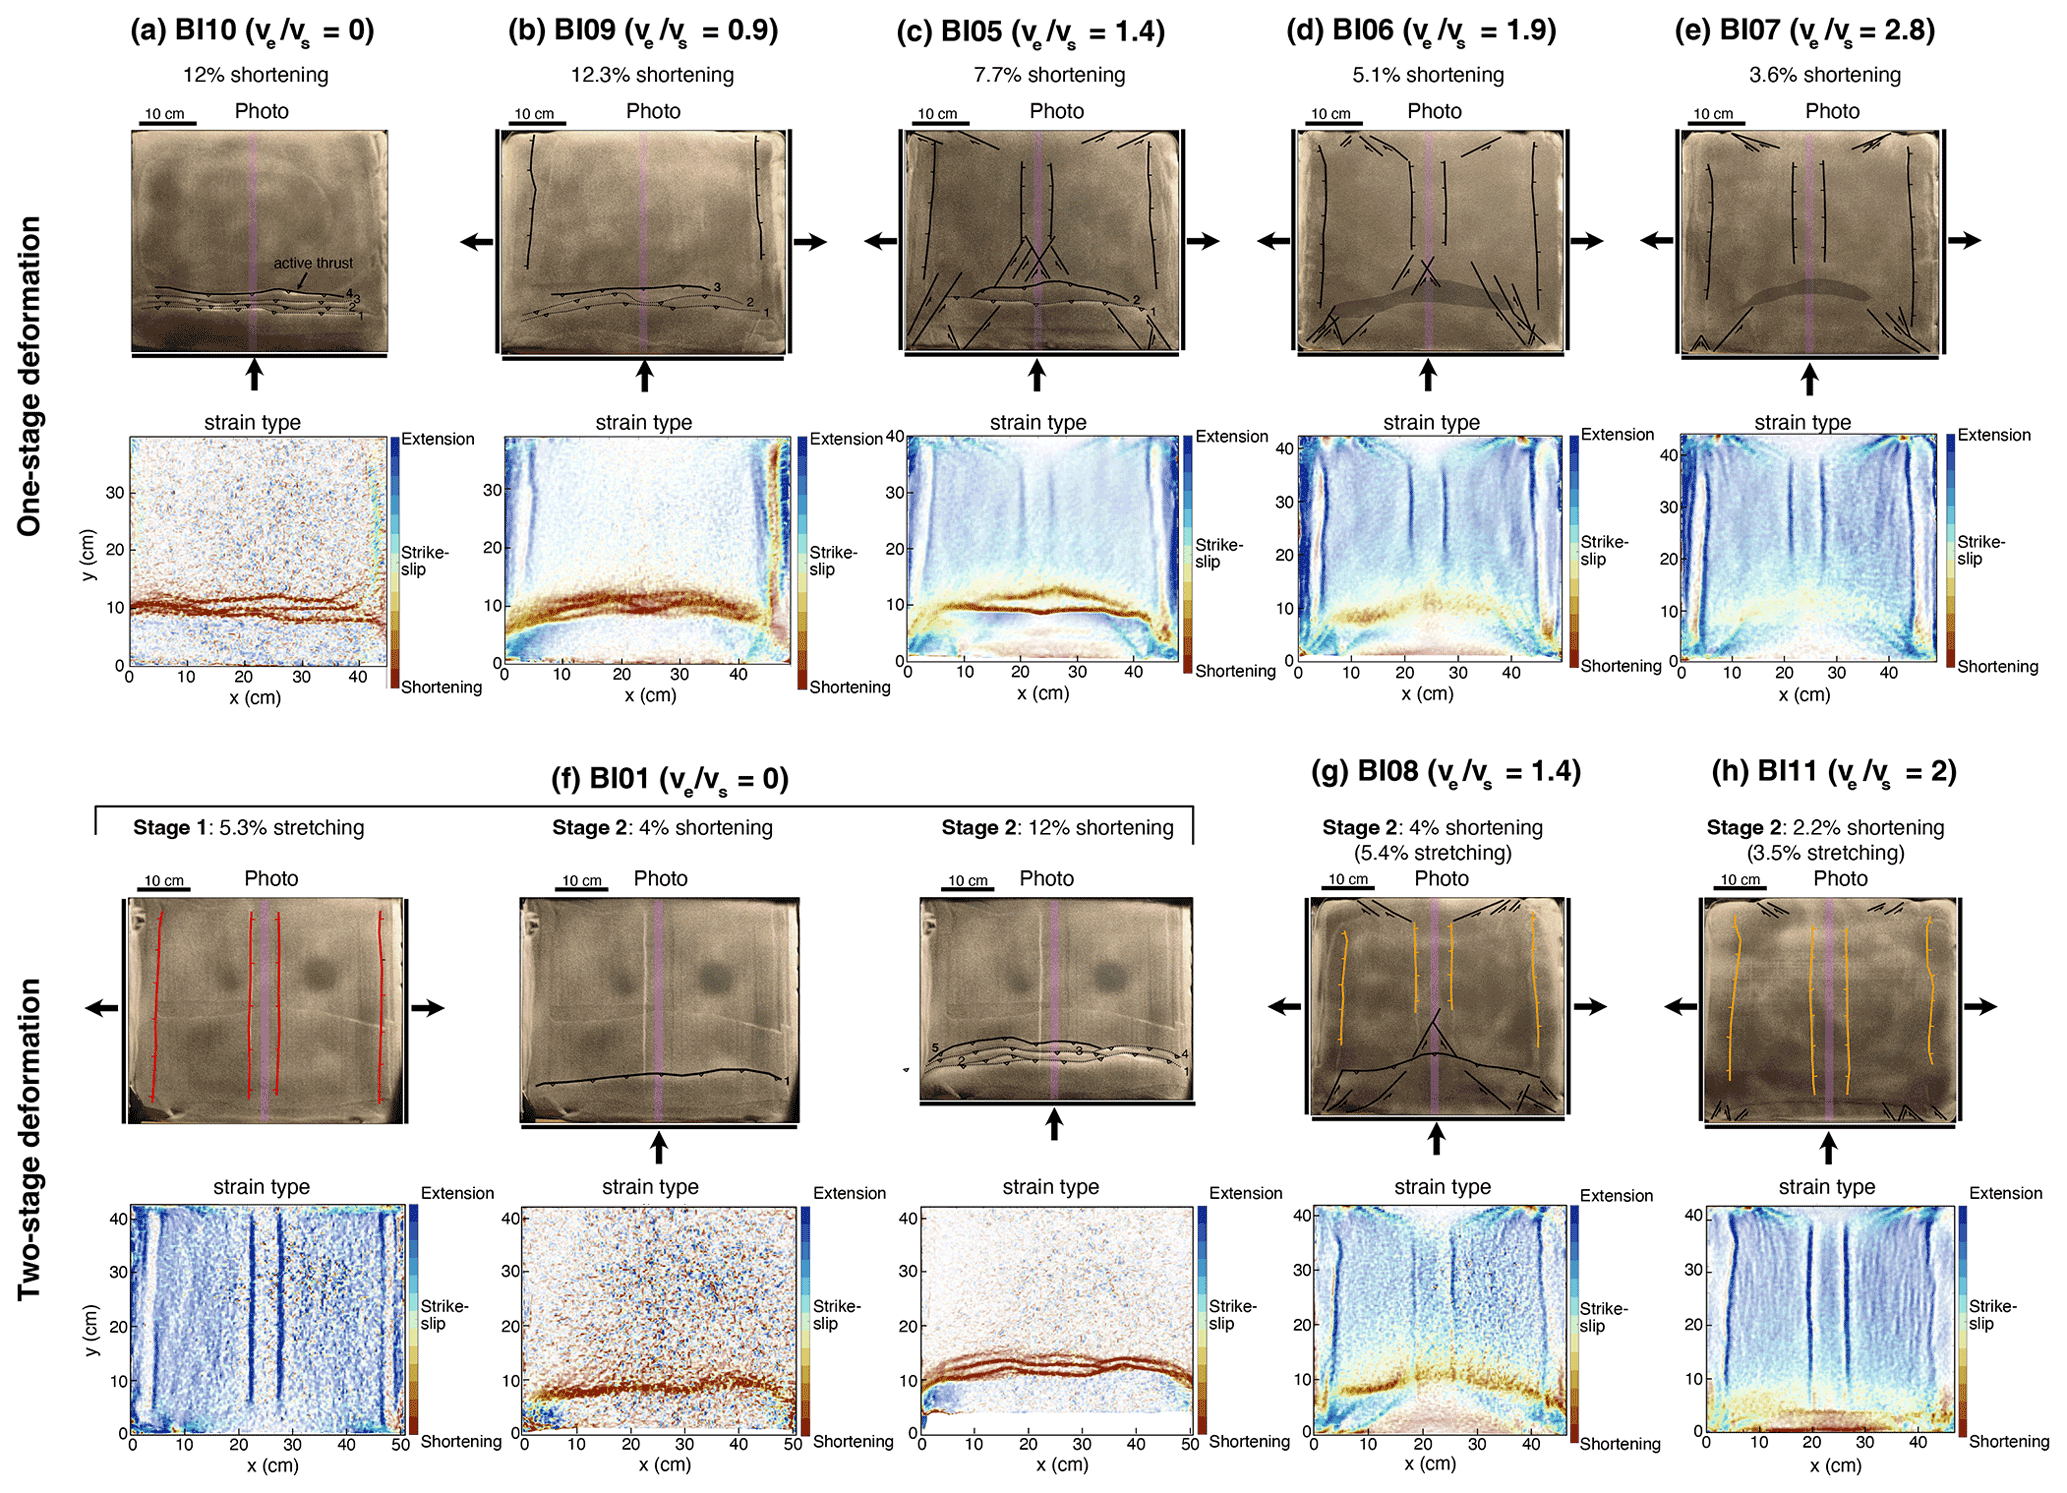
Figure 4Interpreted pictures and strain type for models with a brittle crust after 12 % of along-y shortening for (a) model BI10 and after 10 % of along-x stretching for models (b) BI09, (c) BI05, (d) BI06, and (e) BI07 and for models with a brittle crust and two-stage deformation: (f) model BI01, (g) model BI08, and (h) model BI11. Strain type maps show shortening (red), strike-slip (green), and stretching (blue), with intermediate, oblique deformation at intermediate colors. For the two-stage models, faults active only at the first stage of deformation are in red, faults forming and active only at the second stage are in black, and faults that formed at the first stage and are reactivated at the second stage are in orange. The initial location of the seed is indicated in purple. The corresponding amount of along-x stretching and/or along-y shortening is indicated at the top. Corresponding maps for principal stretches λmax, λmin are found in Fig. S2.
For the model with shortening only (BI10), deformation is first concentrated along an E–W-striking thrust fault located ∼10 cm from the moving piston (fault 1 in Figs. 4a and S1a). After 4 % of shortening, the thrust has a linear shape, orthogonal to the shortening direction (Fig. S1a). An increase in the amount of shortening leads to the activation of three successive thrusts in a prograde sequence (faults 2, 3, and 4 in Fig. 4a).
For the model with (BI09), deformation is also mainly accommodated by E–W thrust faults developing in a prograde sequence (Figs. S1b and 4b). However, unlike the previous model, the shape of the thrust front is not linear but rather slightly convex toward the north. In this model, deformation is also accommodated by N–S extensional faults located close to the edges of the model (Figs. S1b and 4b). There are no traces of significant extension above the central seed.
For the model with (BI05), after 4 % of shortening (5.5 % of stretching), deformation is partitioned between shortening that is accommodated along an E–W thrust fault, diffuse extension in the retrowedge, and strike-slip faults at the corners of the model (Fig. S1c). After 10 % of stretching (7.7 % of shortening), the pattern of deformation has evolved with (i) stretching in the center of the model accommodated by N–S conjugate normal faults forming a 5.2 cm large graben structure, (ii) shortening accommodated by a second thrust fault, and (iii) conjugate strike-slip structures that make the connection between the frontal thrust and the central graben but that also deform the southern wedge (Fig. 4c). In the distal part of the retrowedge, other strike-slip faults are visible with a sense of shear that is compatible with previous strike-slip faults but with orientations that largely differ (N66 and N114 in the northern sector vs. N25–40 and N145—150 in the south central sector) (Fig. 4c).
For the model with = 1.9 (BI06), the N–S-striking central graben is already formed after 4 % of shortening (7.6 % of stretching) and deformation is also localized along conjugate strike-slip faults (Fig. S1d). Instead, shortening is not accommodated by discrete E–W thrust faults but rather corresponds to a zone of diffuse deformation (shaded area in Fig. S1d). After 10 % of stretching (5.1 % of shortening), the normal faults remain active and strike-slip faults propagate toward the central graben (Fig. 4d). Like in the model BI05, a transition zone with strike-slip faults develops in between the wedge and the central graben.
For the model with (BI07), the evolution of deformation is almost similar to the previous experiment (Figs. S1e and 4e). The main difference is visible after 10 % of extension: there are no strike-slip faults in the zone between the mildly shortened area (shaded area in Fig. 4e) and the central graben.
3.1.2 Inheritance as a former extensional stage
In the following models, the setup is identical to previous models except that they undergo an initial stage of E–W extension with up to 5 %–5.3 % of stretching prior to a second stage of N–S shortening (and coeval E–W stretching for models BI08 and BI11). We test three kinematic boundary conditions for the second stage of deformation: (BI01), (BI08), and (BI11) (Fig. 4f to h) that should be compared with models BI10, BI05, and BI06, respectively.
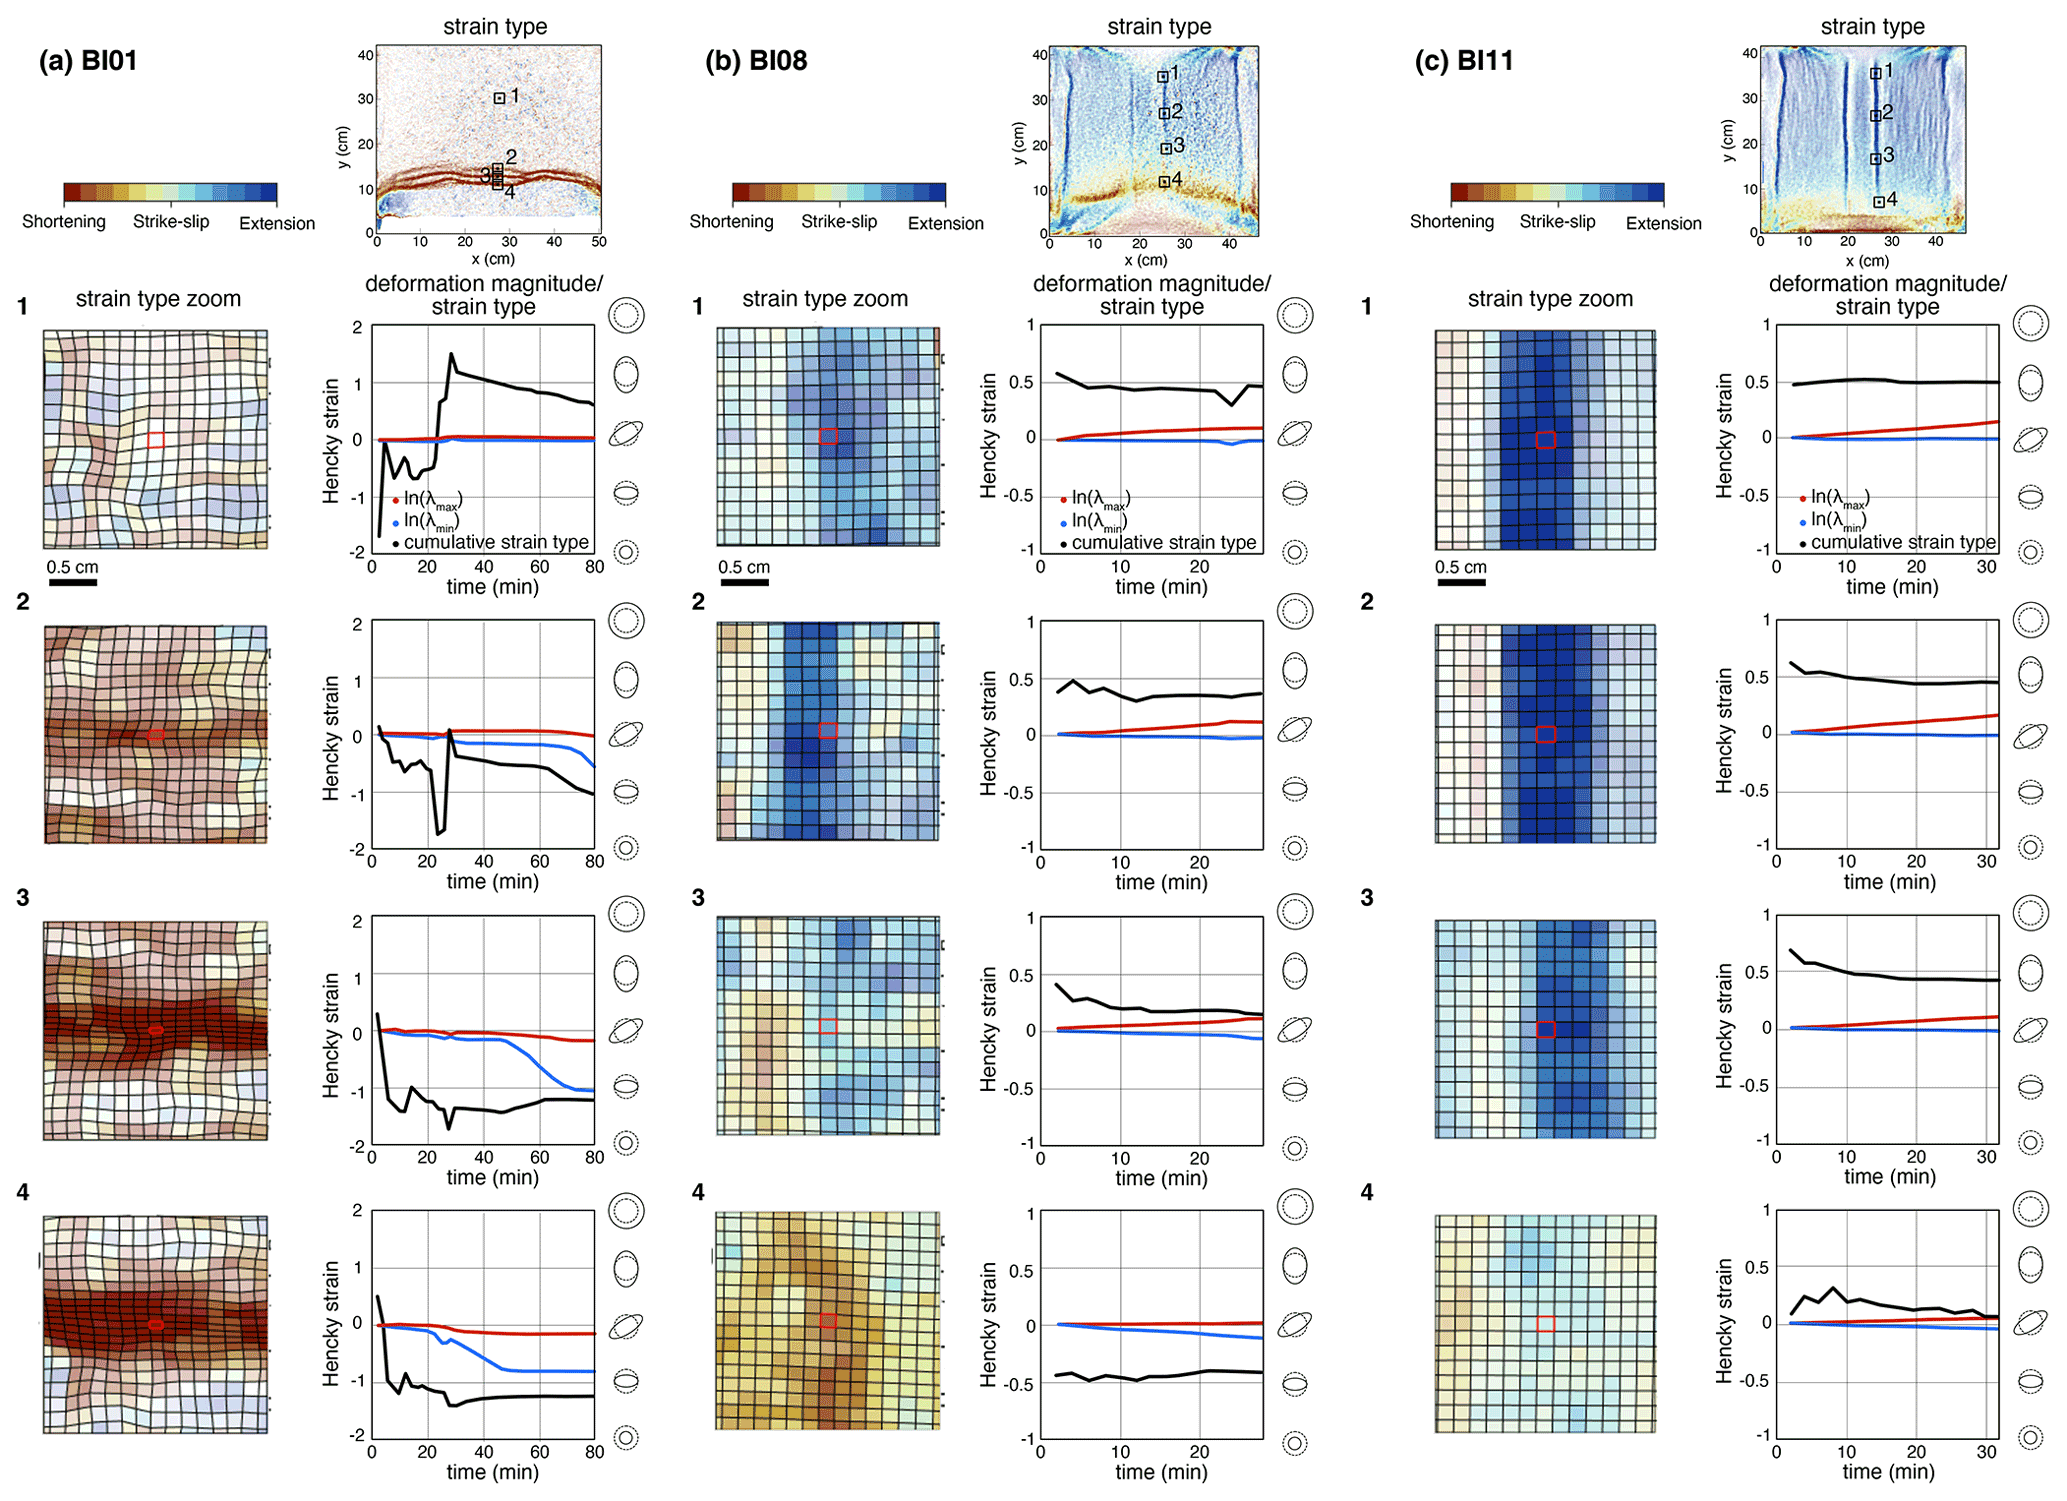
Figure 5Temporal evolution of principal stretches and strain type during the second stage of deformation for points 1, 2, 3, and 4 in models (a) BI01, (b) BI08, and (c) BI11 (brittle crust). Upper right-hand panel: strain type (final) and overview of the selected areas. Left column: zoom on the strain type and the selected grid cell (which is outlined in red, with neighboring cells outlined in black). Right column: time evolution of the logarithm of the two principal stretches (Hencky strain; blue and red curves) and associated strain type (cumulative; black curve, right axis).
For model BI01 with , the first stage of stretching results in the development of N–S conjugate normal faults and an associated 5.3 cm large graben (Fig. 4f). At the second stage of deformation with N–S shortening only, after 4 % of shortening, deformation is accommodated along a single thrust (Fig. 4f). In between 4 % and 12 % of shortening, deformation is accommodated along new thrusts in a prograde sequence (Figs. 4e and 5a). However, these thrusts do not cut through the entire width of the models like in model BI10 but rather branch off previous thrusts (Fig. 4e). Interestingly, the intersections between the new and former thrusts are close to but do not exactly coincide with the limits of the central graben.
For model BI08 with , the first stage of extension also results in the formation of a central N–S-striking graben, similar to model BI01. However, at the second stage of deformation, deformation is accommodated by the coeval activity of N–S normal faults, an E–W thrust fault, and NW–SE and NE–SW conjugate strike-slip faults that develop in the wedge, at the transition between the frontal thrust and the central graben and at the northern boundary of the model (Fig. 4g). The pattern of deformation after 4 % of shortening differs from model BI05 with similar boundary conditions but no initial stage of stretching (Fig. 4c). In model BI05, the localization of extensional structures and strike-slip faults is not yet achieved (Fig. S1c). In addition, the shape of the frontal thrust is convex toward the north in the model with an initial stage of stretching, while it is linear in the single-stage model (Figs. S1c and 4g). The overall pattern of deformation appears almost similar to the single-stage model (BI05) only after 10 % of stretching, showing the activity of strike-slip and normal faults, and a newly formed thrust adopting a convex toward the north shape (fault 2 in Fig. 4c). However, second-order differences remain because the strike-slip faults that develop in the wedge have orientations that differ slightly: N55 (sinistral) and N120 (dextral) in model BI08 instead of N40 and N140 in model BI05 (Fig. 4c and g).
For model BI11 with , stretching dominates in the model and is accommodated through N–S normal faults, whose activity persists during the second stage of deformation (Figs. 4h and 5c). Evidence of significant shortening localization is lacking, but the experiment stopped after only 2.2 % of shortening. The imposed kinematic boundary conditions also resulted in the development of conjugate strike-slip faults at the southern and northern boundaries of the model (Fig. 4h).

Figure 6Interpreted pictures and strain type for models with a brittle–ductile crust and one-stage deformation (a model CE16) and two-stage deformation (b model CE17, c model CE18, and d model CE20). Strain type maps show shortening (red), strike-slip (green), and stretching (blue), with intermediate, oblique deformation at intermediate colors. For the two-stage models, faults active only at the first stage of deformation are in red, faults forming and active only at the second stage are in black, and faults that formed at the first stage and are reactivated at the second stage are in orange. The initial location of the seed is indicated in purple. The corresponding amount of along-x stretching and/or along-y shortening is indicated at the top. Corresponding maps for principal stretches λmax, λmin are found in Fig. S3.
3.2 Brittle–ductile models: role of inheritance under varying stress fields
3.2.1 Inheritance as a crustal heterogeneity (seed)
The model CE16 has been performed to test how the deformation distribution evolves as a function of the strength of the crust, by including a ductile layer in the model (Fig. 2b). It is comparable with the brittle-only model BI09, which shares similar boundary conditions (). After 4 % of shortening (and 2.8 % of stretching), deformation is accommodated by a combination of diffuse shortening along a 4 cm large E–W band (Fig. 6a) and conjugate strike-slip faults at the corners of the models. Unlike model BI09, there are no N–S normal faults at this stage. After 10 % of stretching (and 14.2 % of shortening), the area of diffuse shortening has evolved into a localized thrust fault. In addition, N–S shortening is also accommodated along a northward-dipping back-thrust, forming an uplifted wedge (Fig. 6a).
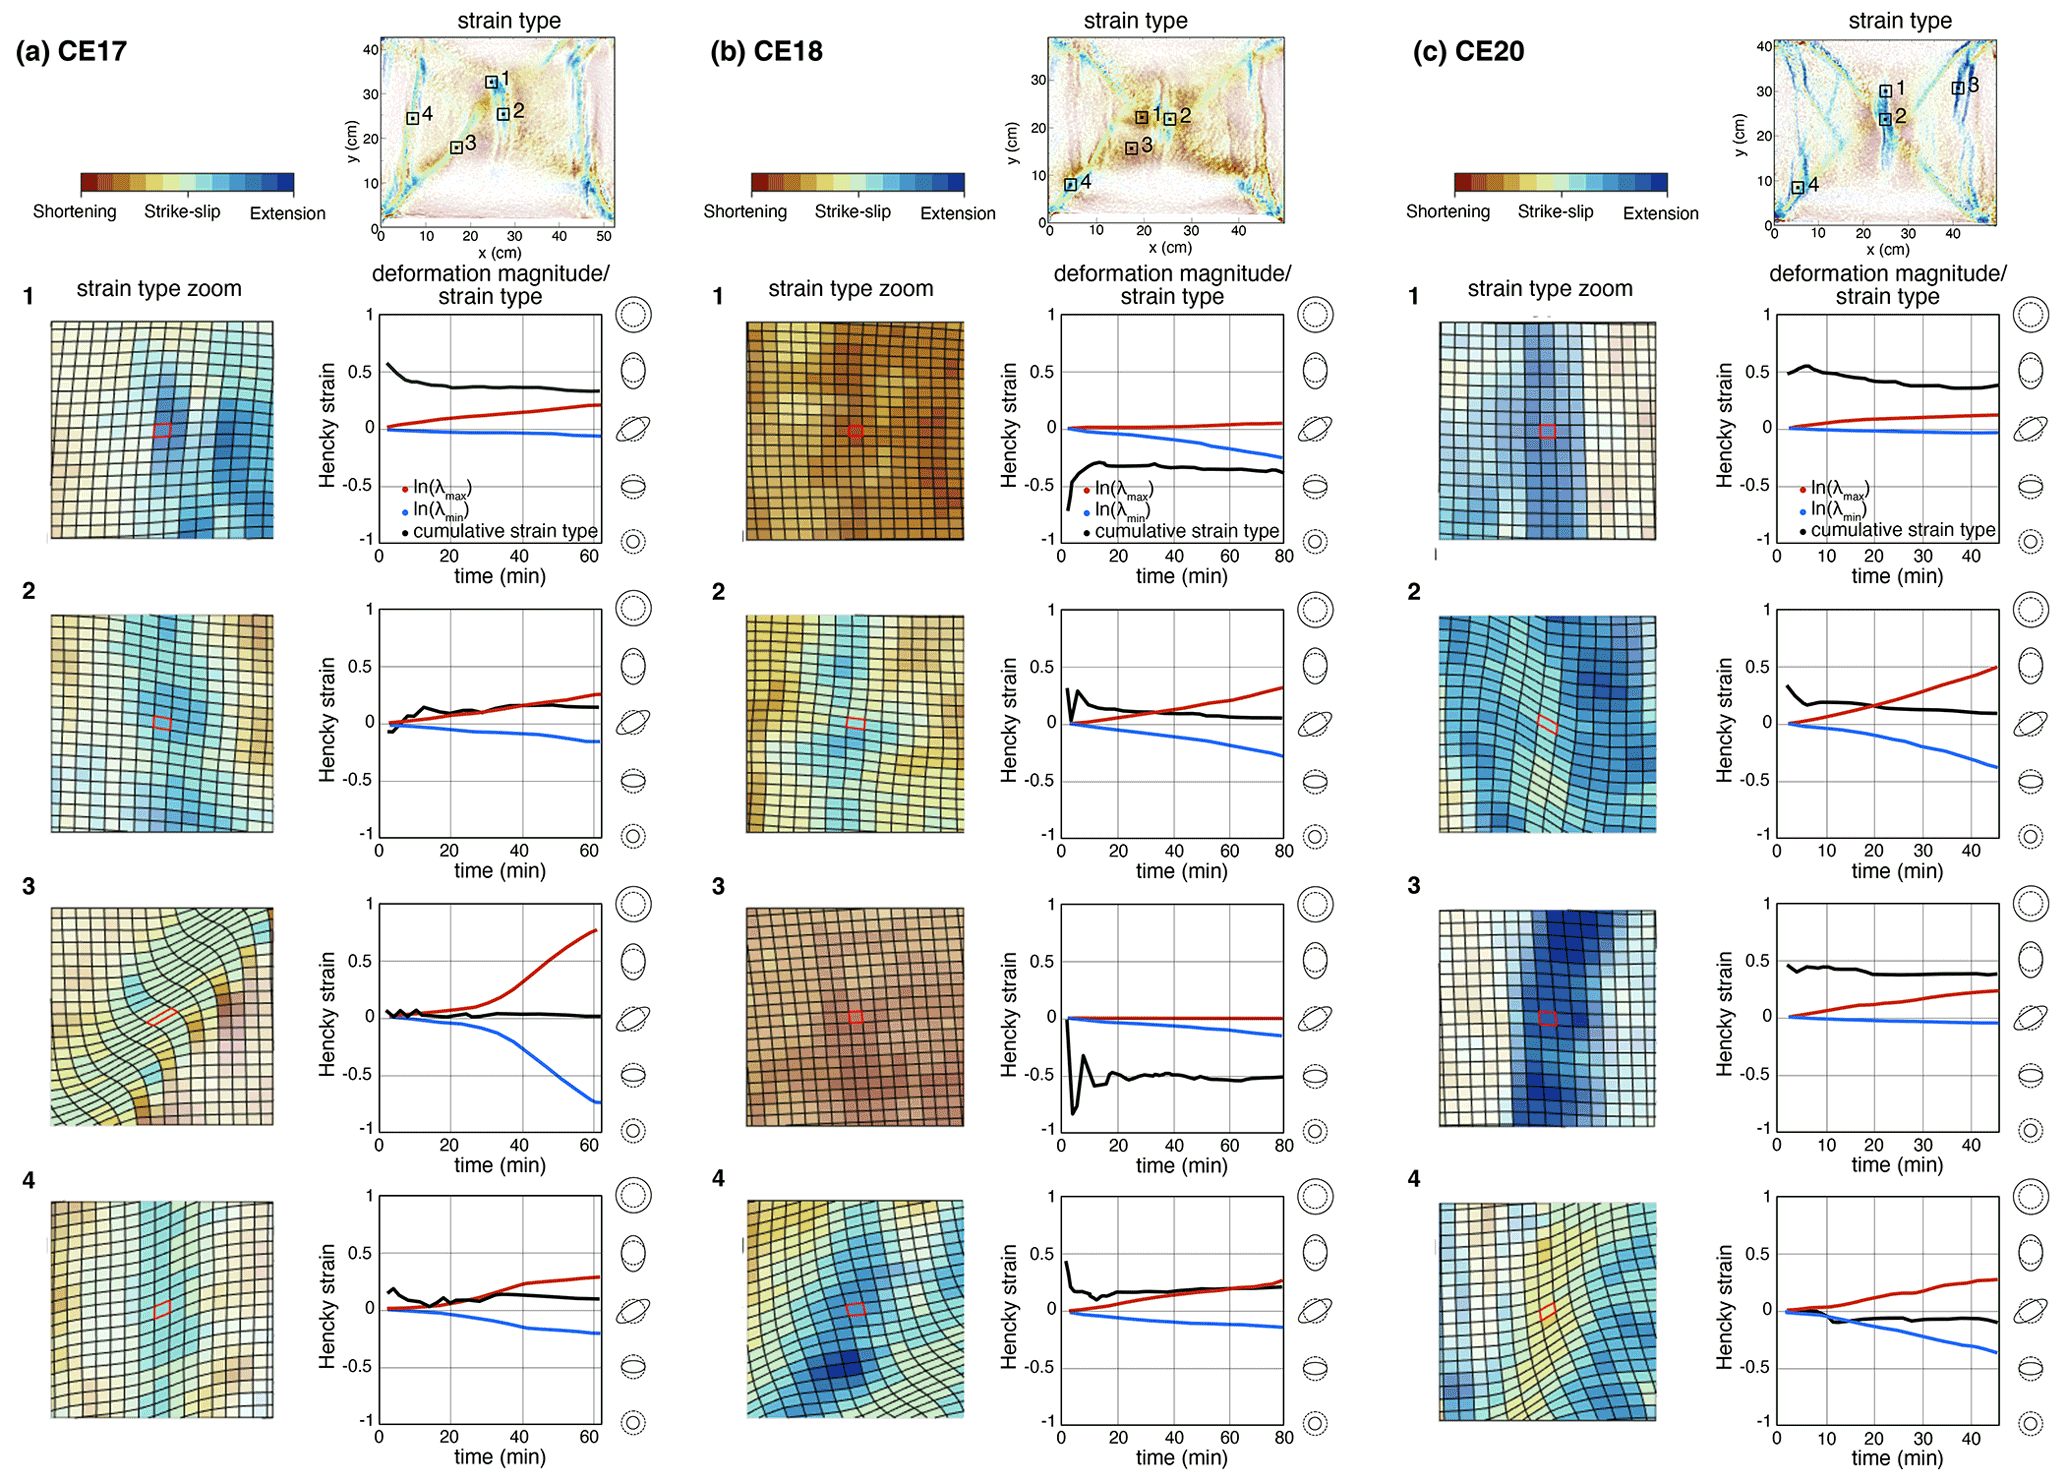
Figure 7Temporal evolution of principal stretches and strain type during the second stage of deformation for points 1, 2, 3, and 4 in models (a) CE17, (b) CE18, and (c) CE20 (brittle–ductile crust). Upper right-hand panel: strain type (final) and overview of the selected areas. Left column: zoom on the strain type and the selected grid cell (which is outlined in red, with neighboring cells outlined in black). Right column: time evolution of the logarithm of the two principal stretches (Hencky strain; blue and red curves) and associated strain type (cumulative; black curve, right axis).
3.2.2 Inheritance as a former extensional stage
The model CE17 is similar to model CE16 except that we impose an initial stage of 4.7 % E–W stretching. This first stage of stretching results in the coeval localization of strain along three pairs of N–S-trending conjugate normal faults in the western, eastern, and central parts of the model, the latter being located just above the seed (Fig. 6b). During the second stage of deformation with coeval shortening and stretching (), some of the pre-existing normal faults are reactivated as normal faults and others as shortening-parallel strike-slip faults, while additional conjugate strike-slip faults develop and branch to the corner of the models (Figs. 6b and 7a). An increase in the amount of shortening does not lead to significant localization of deformation on reverse faults but rather leads to the development of new strike-slip faults (Fig. 6b). The brittle-only model whose boundary conditions are the closest to model CE17 is model BI08 (Fig. 4g). Despite a larger ratio in model BI08 that should favor stretching over shortening, the brittle-only model exhibits a clear E–W thrust fault that is not observed in the brittle–ductile model.
Models CE18 and CE20 share a similar setup with CE17 but explore different boundary conditions during the second stage of deformation with (Fig. 6c) and =1.1 (Fig. 6d), respectively. We describe deformation after 5 % of stretching during the second stage of deformation (Fig. 6c and d). For the model dominated by shortening (CE18), the two main differences to model CE17 are (i) the largest extent of zones characterized by diffuse shortening (Fig. 6c) that is maintained during the entire second stage of deformation (Fig. 7b) and (ii) the limited sections of pre-existing normal faults that are reactivated as normal faults, which are only found in a restricted area over the central seed (Fig. 6c). In addition, in the eastern part of the model one of the N–S normal faults is reactivated as a dextral strike-slip fault (Fig. 6c). For the model dominated by stretching (CE20), the pattern of deformation is clearly different: large portions of the pre-existing western, eastern, and central normal faults are reactivated as normal faults during the second stage of deformation (Fig. 6d). Only in the central portions of the western and central faults is deformation accommodated along strike-slip faults that are aligned with the initial orientation of normal faults (point 2 in Fig. 7c).
4.1 Tectonic regime distribution under non-plane-strain conditions
Our models confirm that under plane-strain conditions, i.e., no strain in one of the horizontal directions (models BI01 and BI10 and first stage of models BI08, BI11, CE17, CE18, and CE20), the crust accommodates deformation through structures orthogonal to the direction of transport, i.e., either normal faults when the maximum principal stress (σ1) is vertical or thrust faults when the minimum principal stress (σ3) is vertical. However, when boundary conditions satisfy non-plane-strain conditions (i.e., strain occurs along the three principal axis), deformation is accommodated along a combination of normal faults, thrust faults, and strike-slip faults, whose location and presence/absence appear to depend on the applied boundary conditions, pre-existing heterogeneities, and possibly the amount of accumulated deformation.

Figure 8Interpreted distribution of structures for model BI05 after 7.7 % of shortening and corresponding principal stress axis and Mohr–Coulomb analysis for the areas with labels 1, 2, and 3 on the left figure.
Model BI05 (brittle model with = 1.4) exemplifies the possible coeval activity of N–S conjugate normal faults, E–W thrust faults, and NE–SW and NW–SE conjugate strike-slip faults (Fig. 8). After 10 % of E–W stretching and 7.7 % of N–S shortening, in the center of the model, the type of structure evolves from compressional structures to the south (close to the piston) to extensional structures to the north. The transition from one regime to another results from the permutation of one of the horizontal principal stress axes with the vertical one, controlled by the relative magnitude between the principal stresses as described by . The Mohr–Coulomb analysis for a frictional material like sand also implies that the differential stress necessary for material failure is maximal for thrust faults (Fig. 8). This could explain why thrust faults are only found close to the southern moving piston where the maximum horizontal stress is applied (zone 1). In this area, σ1 is horizontal and N–S oriented, while the minimum stress (σ3) is vertical. Going further north from the piston (zone 2), σ1 decreases, which implies a lower σ3 at failure and a vertical intermediate principal stress (σ2), favoring the development of strike-slip faults. Further north (zone 3), the normal faults that were created during the first stage of extension are reactivated as normal faults, thus indicating that σ1 is vertical. A progressive increase in the southern wedge thickness accompanying N–S shortening in the absence of erosion would imply an increase in the vertical stress. As a consequence, thrust faults would propagate toward the north (as evidenced between 4.2 % and 7.7 % of shortening for model BI05; Figs. S1c and 4c) and could possibly reach places where strike-slip faults and normal faults were previously active. Therefore, the redistribution of stress resulting from deformation could drive temporal variations in the tectonic regime at a specific location.
For brittle models, the coexistence of the three types of structures (after 10 % of E–W stretching) starts for ratios > 1.4 (Fig. 4). For lower , σ1 is horizontal and N–S oriented and maximal close to the piston applying shortening, favoring the development of thrust sequences in the southern part of the models. Close to the western and eastern pistons applying stretching, in the case where , the vertical stress becomes the maximum stress and N–S normal faults develop. For values of , the E–W horizontal stress is low enough in the entire model to maintain as the minimum stress σ3, which in turn implies that even if the N–S horizontal stress is the maximum stress σ1, the crust cannot fail along E–W thrust faults but fails along strike-slip faults. However, we cannot preclude that thrust faults could also develop at later stages for these models with high ratios, as experimental limitations prevent us from imposing large amounts of N–S shortening. In model BI07 for instance, it is at a maximum of 3.6 %, which may be insufficient to locate deformation along an E–W thrust fault.
For brittle–ductile models, over the range of tested , we do not observe the coexistence of the three types of structures within the same model (Fig. 6). We only observe E–W thrust faults associated with conjugate strike-slip faults for models with low and no initial E–W extensional stage. This implies that the stress conditions required to develop N–S normal faults (E–W horizontal stress is σ3 and vertical stress is σ1) are never encountered in the model. The first condition is met as testified by the presence of strike-slip faults. Instead, the second condition is not met, which could partly be explained by the limited thickness of the brittle portion of the crust, which is half that of the brittle-only models. For models with an initial E–W extensional stage, we observe at the final stage of deformation a combination of N–S normal faults and conjugate strike-slip faults and no clear E–W thrust faults, even when is low (model CE18). For the latter, shortening is active in some areas of the model (Fig. 6c and point 3 in Fig. 7b), but it does not localize along discrete structures. For weak crusts, crustal thinning associated with an initial stage of extension therefore appears to control the future development of thrusts during the subsequent stage of combined shortening/stretching. However, the amount of applied deformation remains limited with only 5 % of horizontal E–W stretching (and ∼10 % of horizontal N–S shortening), and we cannot preclude that further shortening would eventually result in thrust development.
4.2 Compatibility of the structures with principal stresses orientation
In the brittle-only models, a majority of the structures are consistent with the Coulomb fracture criterion considering either a N–S-oriented horizontal σ1 or an E–W-oriented horizontal σ3. In particular, thrust faults are E–W oriented, normal faults are N–S oriented, and strike-slip faults are generally oriented at ∼30∘ from a N–S σ1. However, in the northern part of the models, strike-slip faults do not obey this criterion and exhibit larger angles with respect to a N–S horizontal σ1, with values around 60–70∘ (e.g., model BI05, Figs. 4c and 9a). These anomalously oriented strike-slip faults could result from a combination of factors. As they nucleate from the edge of the model, we cannot exclude that they result from some unwanted boundary effects associated with the high friction wall–sand interface. As a result of the applied stretching and boundary effects, the maximum principal stress σ1 may have rotated from a N–S direction toward a NE–SW direction in the eastern part of the model and NW–SE direction in the western part of the model, possibly explaining why these strike-slip faults do not lie at 30∘ with respect to the imposed N–S shortening. However, one can also notice that not all of these strike-slip faults have the same exact orientation (Fig. 4d and e), some of them being directed toward the northward termination of the normal faults bounding the central graben. Their orientation therefore could also be controlled by the graben structure that forms in the center of the model above the crustal seed.
Interestingly, in brittle models with an initial stage of extension (e.g., model BI08, Figs. 4g and 9b), it is not only the northern strike-slip fault orientation that departs from the orientation expected from the Coulomb fracture criterion with a N–S shortening but also that of some of the strike-slip faults that develop above the wedge in the southern part of the model. While we cannot preclude some boundary effects here too, these faults with a larger than expected angle with respect to σ1 also connect with the normal faults bounding the central graben formed during the initial stage of stretching. In comparison, model BI05, which shares the same stretching / shortening ratio and almost the same amount of total stretching (∼10 %), does not show any anomalous strike-slip faults in the southern part of the model (Fig. 9a). Pre-existing structures may also exert a control on the geometry of subsequent structures even for areas close to where shortening is applied.
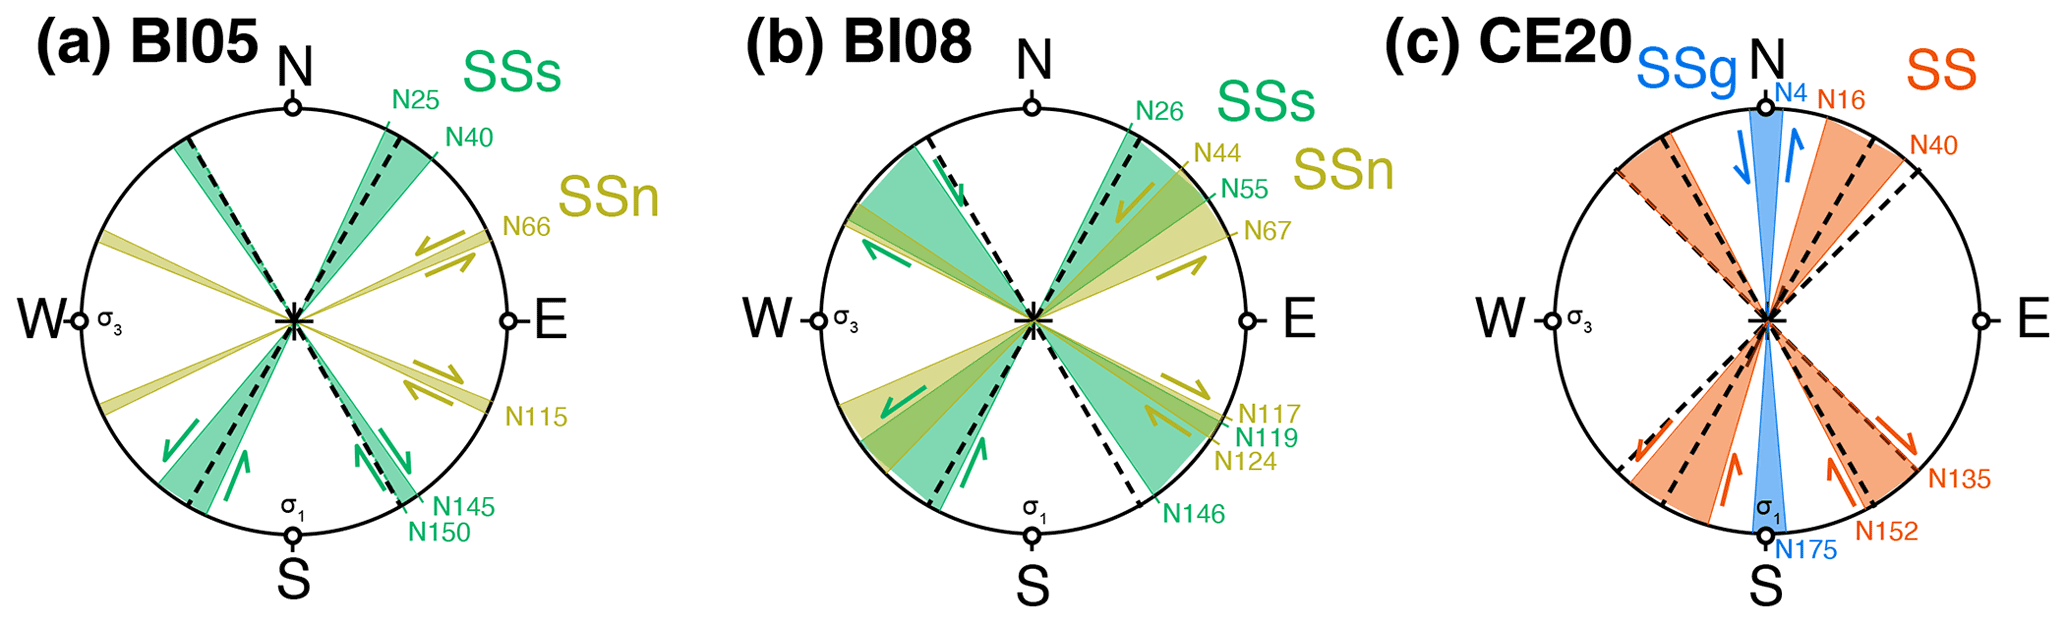
Figure 9Stereo plots showing the ranges of orientations and the relative motion of strike-slip faults located in the northern (SSn) and southern (SSs) parts of (a) model BI05 and (b) model BI08 , after a total of around 10 % of E–W stretching (see Fig. 4), and (c) in the underformed (SS) and previously deformed (SSg) parts of model CE20 (right) after 5 % of stretching (see Fig. 6). The black dotted lines indicate angles of 30∘ (for the three models) and 45∘ (for the brittle–ductile model CE20) with respect to a N–S σ1.
For models with a brittle–ductile crust, strike-slip faults are expected to range in between 30 and 45∘ following the Coulomb criterion and the slip-line theory (e.g., Anderson, 1905; Tapponnier and Molnar, 1976). Most of the strike-slip faults that crosscut the models do indeed show strikes compatible with the overall state of stress, i.e., N30–45 for left-lateral strike-slip faults and N135–150 for right-lateral strike-slip faults. However, in models with an initial stage of stretching (e.g., model CE20, Figs. 6d and 9c), strike-slip faults also develop with anomalous orientations. In particular, at model corners, strike-slip faults bend with angles that become larger with respect to the N–S shortening direction, possibly indicative of some boundary effects. More interestingly, some strike-slip faults are oriented almost parallel to the shortening direction in areas that were previously affected by normal faulting (Figs. 6 and 9c). This clearly indicates that inherited structures, here in the form of previously developed N–S normal faults, can control the subsequent location and geometry of structures.
Overall, our models show that whatever the strength of the crust, its past deformation history, and the relative ratio of stretching rate over shortening rate, both normal faults and thrust faults remain with similar orientations, i.e., N–S and E–W, respectively. Instead, strike-slip faults exhibit a wider range of possible orientations with respect to the shortening (or stretching) direction. As such they could give us insights into the tectonic context in which they formed. In particular, strike-slip faults with angles of up to ∼65∘ with respect to a N–S shortening direction are found for strong crusts. They particularly form far away from the shortening location when the crust has not been previously deformed, and their anomalous orientation may be indicative of a local perturbation of the stress field owing to a possible combination of boundary effect, dominance of stretching in this area, and coeval formation of a graben in the center of the domain. High-angle strike-slip faults can also be observed closer to the area where shortening is applied if the crust has been previously extended (and thus weakened). In this case, strike-slip faults branch to the former location of normal faults that bounded the central graben. For weak crusts, strike-slip faults can even be parallel to the shortening direction if they reactivate former extensional structures.
4.3 Role of crustal strength in distribution of crustal deformation
Under comparable boundary conditions, the strength of the crust plays a fundamental role in controlling the location of deformation and the types of structures that accommodate deformation. Models without initial stretching phase and similar (e.g., models BI09 and CE16, ) exhibit significantly different patterns of deformation (Fig. 10a and b). A strong crust (thick brittle part) favors the development of in-sequence E–W thrust faults verging to the north to accommodate shortening, while stretching is accommodated through N–S normal faults at the western and eastern boundaries of the model (Fig. 4b). Instead, when the entire model is made of a weak crust, shortening results in a doubly vergent system of conjugate E–W thrust faults and in large-scale conjugate strike-slip faults that also accommodate the stretching. The lack of normal faults indicate that the horizontal stress remains high enough in the entire model to prevent the vertical stress to become σ1. This can readily be explained by the decrease by a factor of 2 of the thickness of the brittle crust in the weak models. Interestingly, in the strong model (BI09), there is also a variation in the thickness of the brittle part of the crust owing to the presence of the viscous seed in the center of the model. However, it does not result in significant lateral variations in deformation style, due to the small variation in brittle thickness (decrease by 25 %) and/or to the fact that the area of relatively weak crust only represents a small fraction of the entire model (∼1.2 % of the crustal volume in model BI09 instead of 51.2 % in model CE16). A more systematic change in the width and thickness of the weak part of the crust would be required to isolate the main controlling parameter.
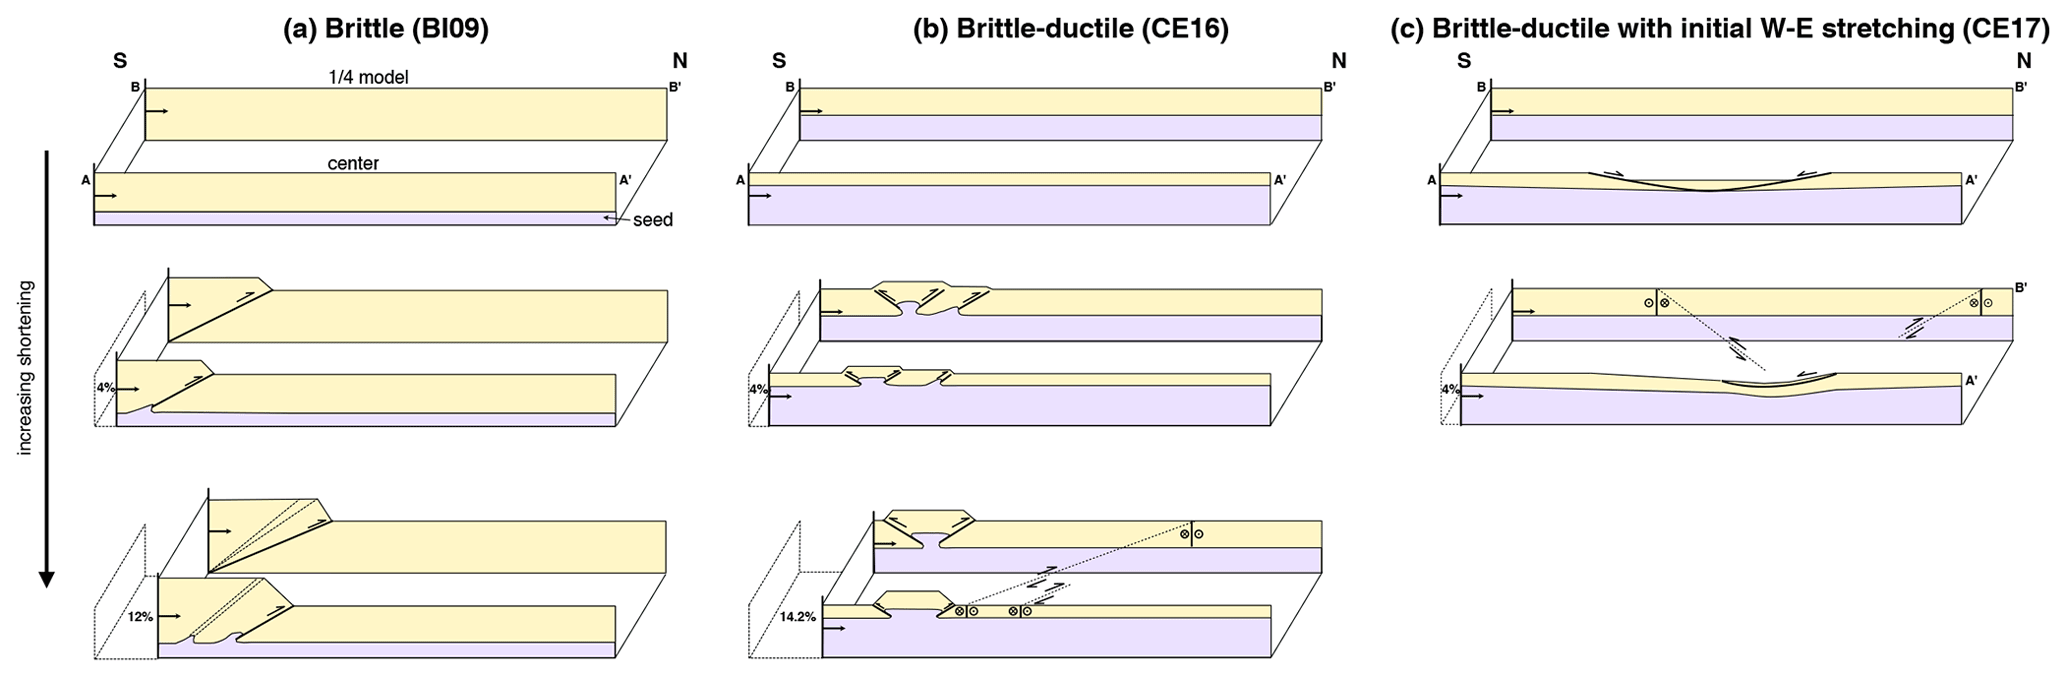
Figure 10N–S cross-sections interpreted from top pictures before deformation (top row), after 4 % of shortening (central row) and after 12 % to 14 % of shortening (bottom row) for models with (a) a brittle crust (BI09), (b) a brittle–ductile crust (CE16), and (c) a brittle–ductile crust and two-stage deformation (CE17). The three models share comparable ratios of stretching over shortening rates . For each model, section AA’ corresponds to the center of the model where the seed is located and B-B’ to the western quarter of the model. The brittle layer is indicated in yellow and the ductile layer in purple.
Interestingly, model CE17, which shares the same boundary conditions as model CE16 but with an initial stage of E–W stretching, exhibits a significantly different distribution of deformation during the second stage of deformation. This initial stage of stretching locally modifies the crustal strength by creating zones of thinned ductile and brittle portions of the crust accommodating the extension (Fig. 10c). These areas of even weaker crust concentrate deformation during the second stage through normal faulting or N–S strike-slip faulting that were both absent in model CE16. In turn, there are no thrust faults accommodating the shortening.
Experimental results again highlight the importance of past tectonic history and associated inherited structures and changes in crustal strength on the distribution of deformation and the types of structures that form during subsequent phases of deformation (Fig. 11). As such, the association of specific types of faults cannot be used as an indicator of the relative rate of shortening and stretching, unless previous history of deformation is properly constrained.
4.4 Basin reactivation under normal fault-parallel contraction
Many modeling studies have previously investigated deformation associated with the inversion of extensional half-grabens subject to subsequent contraction (e.g., McClay, 1995; Bonini et al., 2012; Zwaan et al., 2022, and references therein). In general, the applied directions of stretching and successive contraction are parallel (in 2D numerical or analog models) or oblique but at low angles. However, in nature this may not always be the case. In Patagonia for instance, Cretaceous extensional structures formed in the San Jorge basin as a response to N–S stretching. This area has subsequently undergone E–W Cenozoic contraction, parallel to the direction of the normal faults. We therefore more specifically explored the conditions leading to the reactivation of extensional structures under fault-parallel contraction (and possible fault-orthogonal extension).
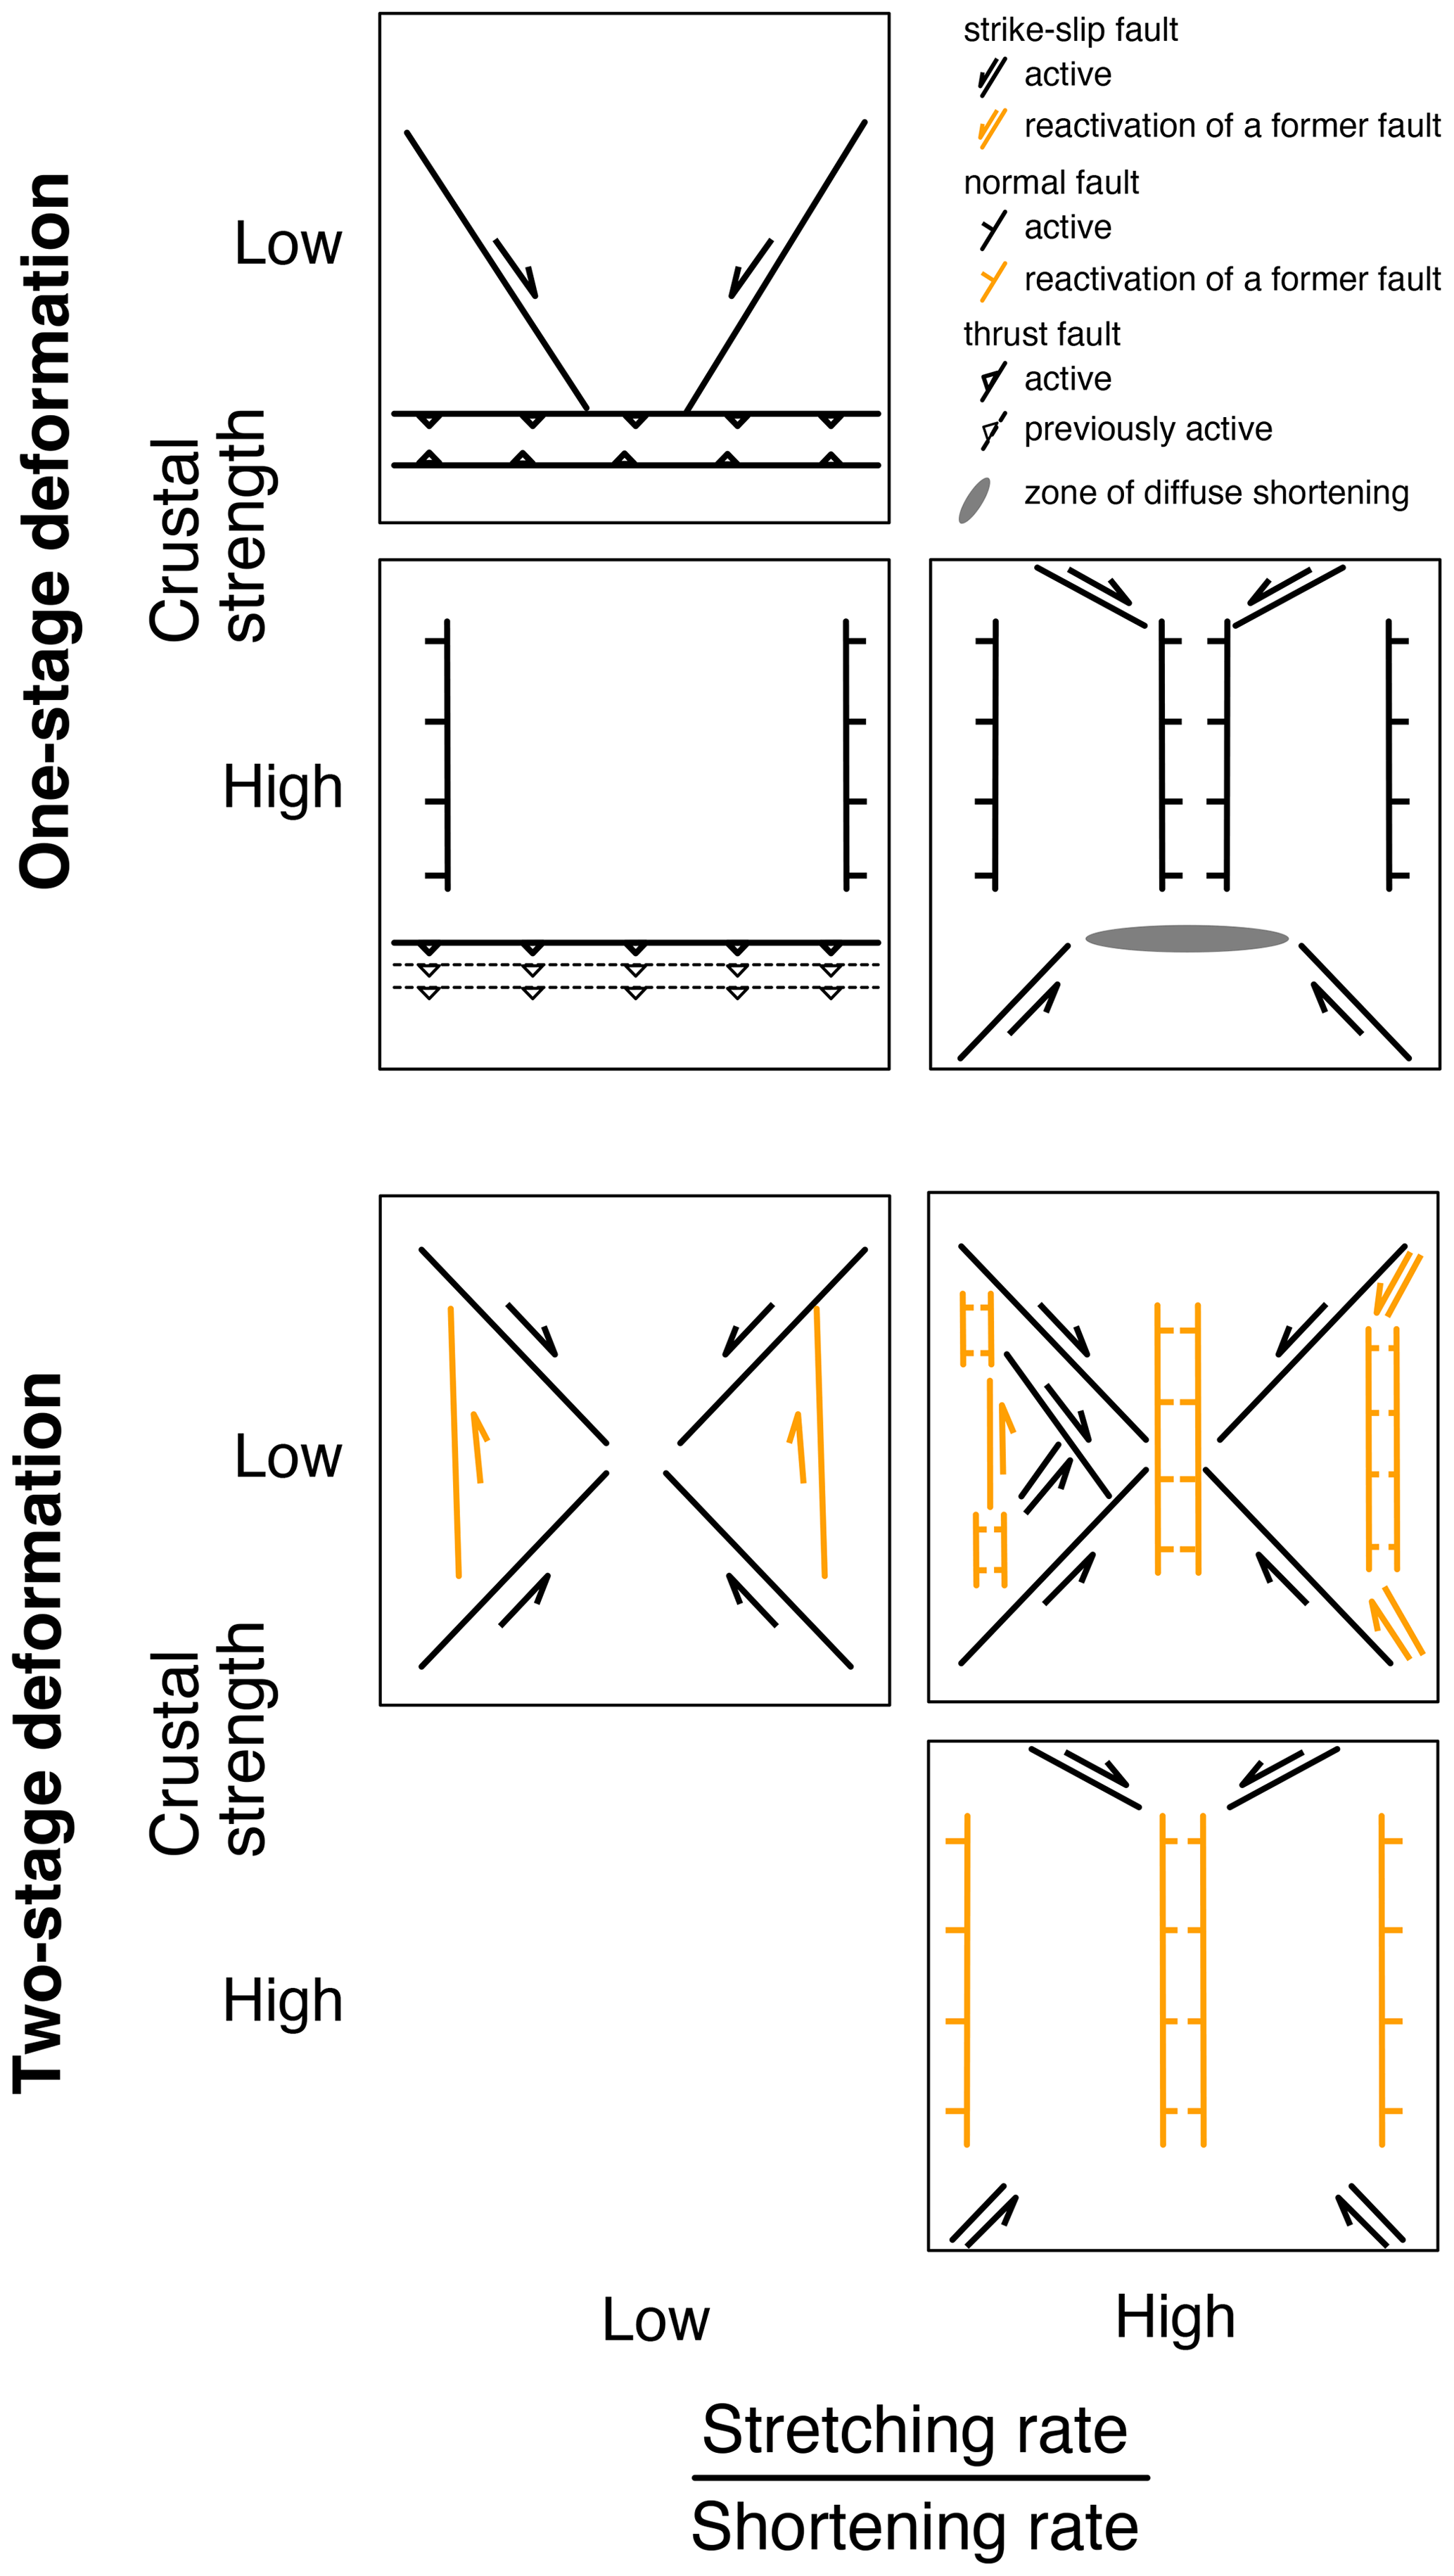
Figure 11Synthesis of map view structures observed as a function of crustal strength, ratio of stretching/shortening rates, and tectonic inheritance. For the two-stage deformation, newly formed faults are in black and reactivated faults are in orange.
From our experimental dataset, there is no clear evidence that normal faults lying parallel to the contraction direction are inverted as contractional structures during the second stage of deformation (Fig. 11). While these areas are favorable to further contraction owing to their thinned crust and associated low vertical stress, the angular relationship between pre-existing normal faults and the direction of contraction (∼0∘) prevents the normal faults from being inverted. We further show that if stretching orthogonal to the contraction direction is inhibited, there is no reactivation of pre-existing normal faults as normal faults or strike-slip faults (model BI01). Instead, allowing orthogonal stretching always results in the reactivation of normal faults. However, different regimes are found depending on the boundary conditions and crustal strength. In models with low and a weak crust (model CE18), extensional structures are preferentially reactivated as strike-slip faults, participating in the accommodation of the shortening that dominates. As increases and becomes closer to 1, pre-existing normal faults are reactivated as either normal faults or strike-slip faults (models CE17 and CE20). Both types of faults therefore develop and are juxtaposed as almost parallel structures without involving changes in boundary conditions. Finally, when stretching rate dominates over shortening rate, pre-existing normal faults are reactivated as normal faults (models BI08 and BI11).
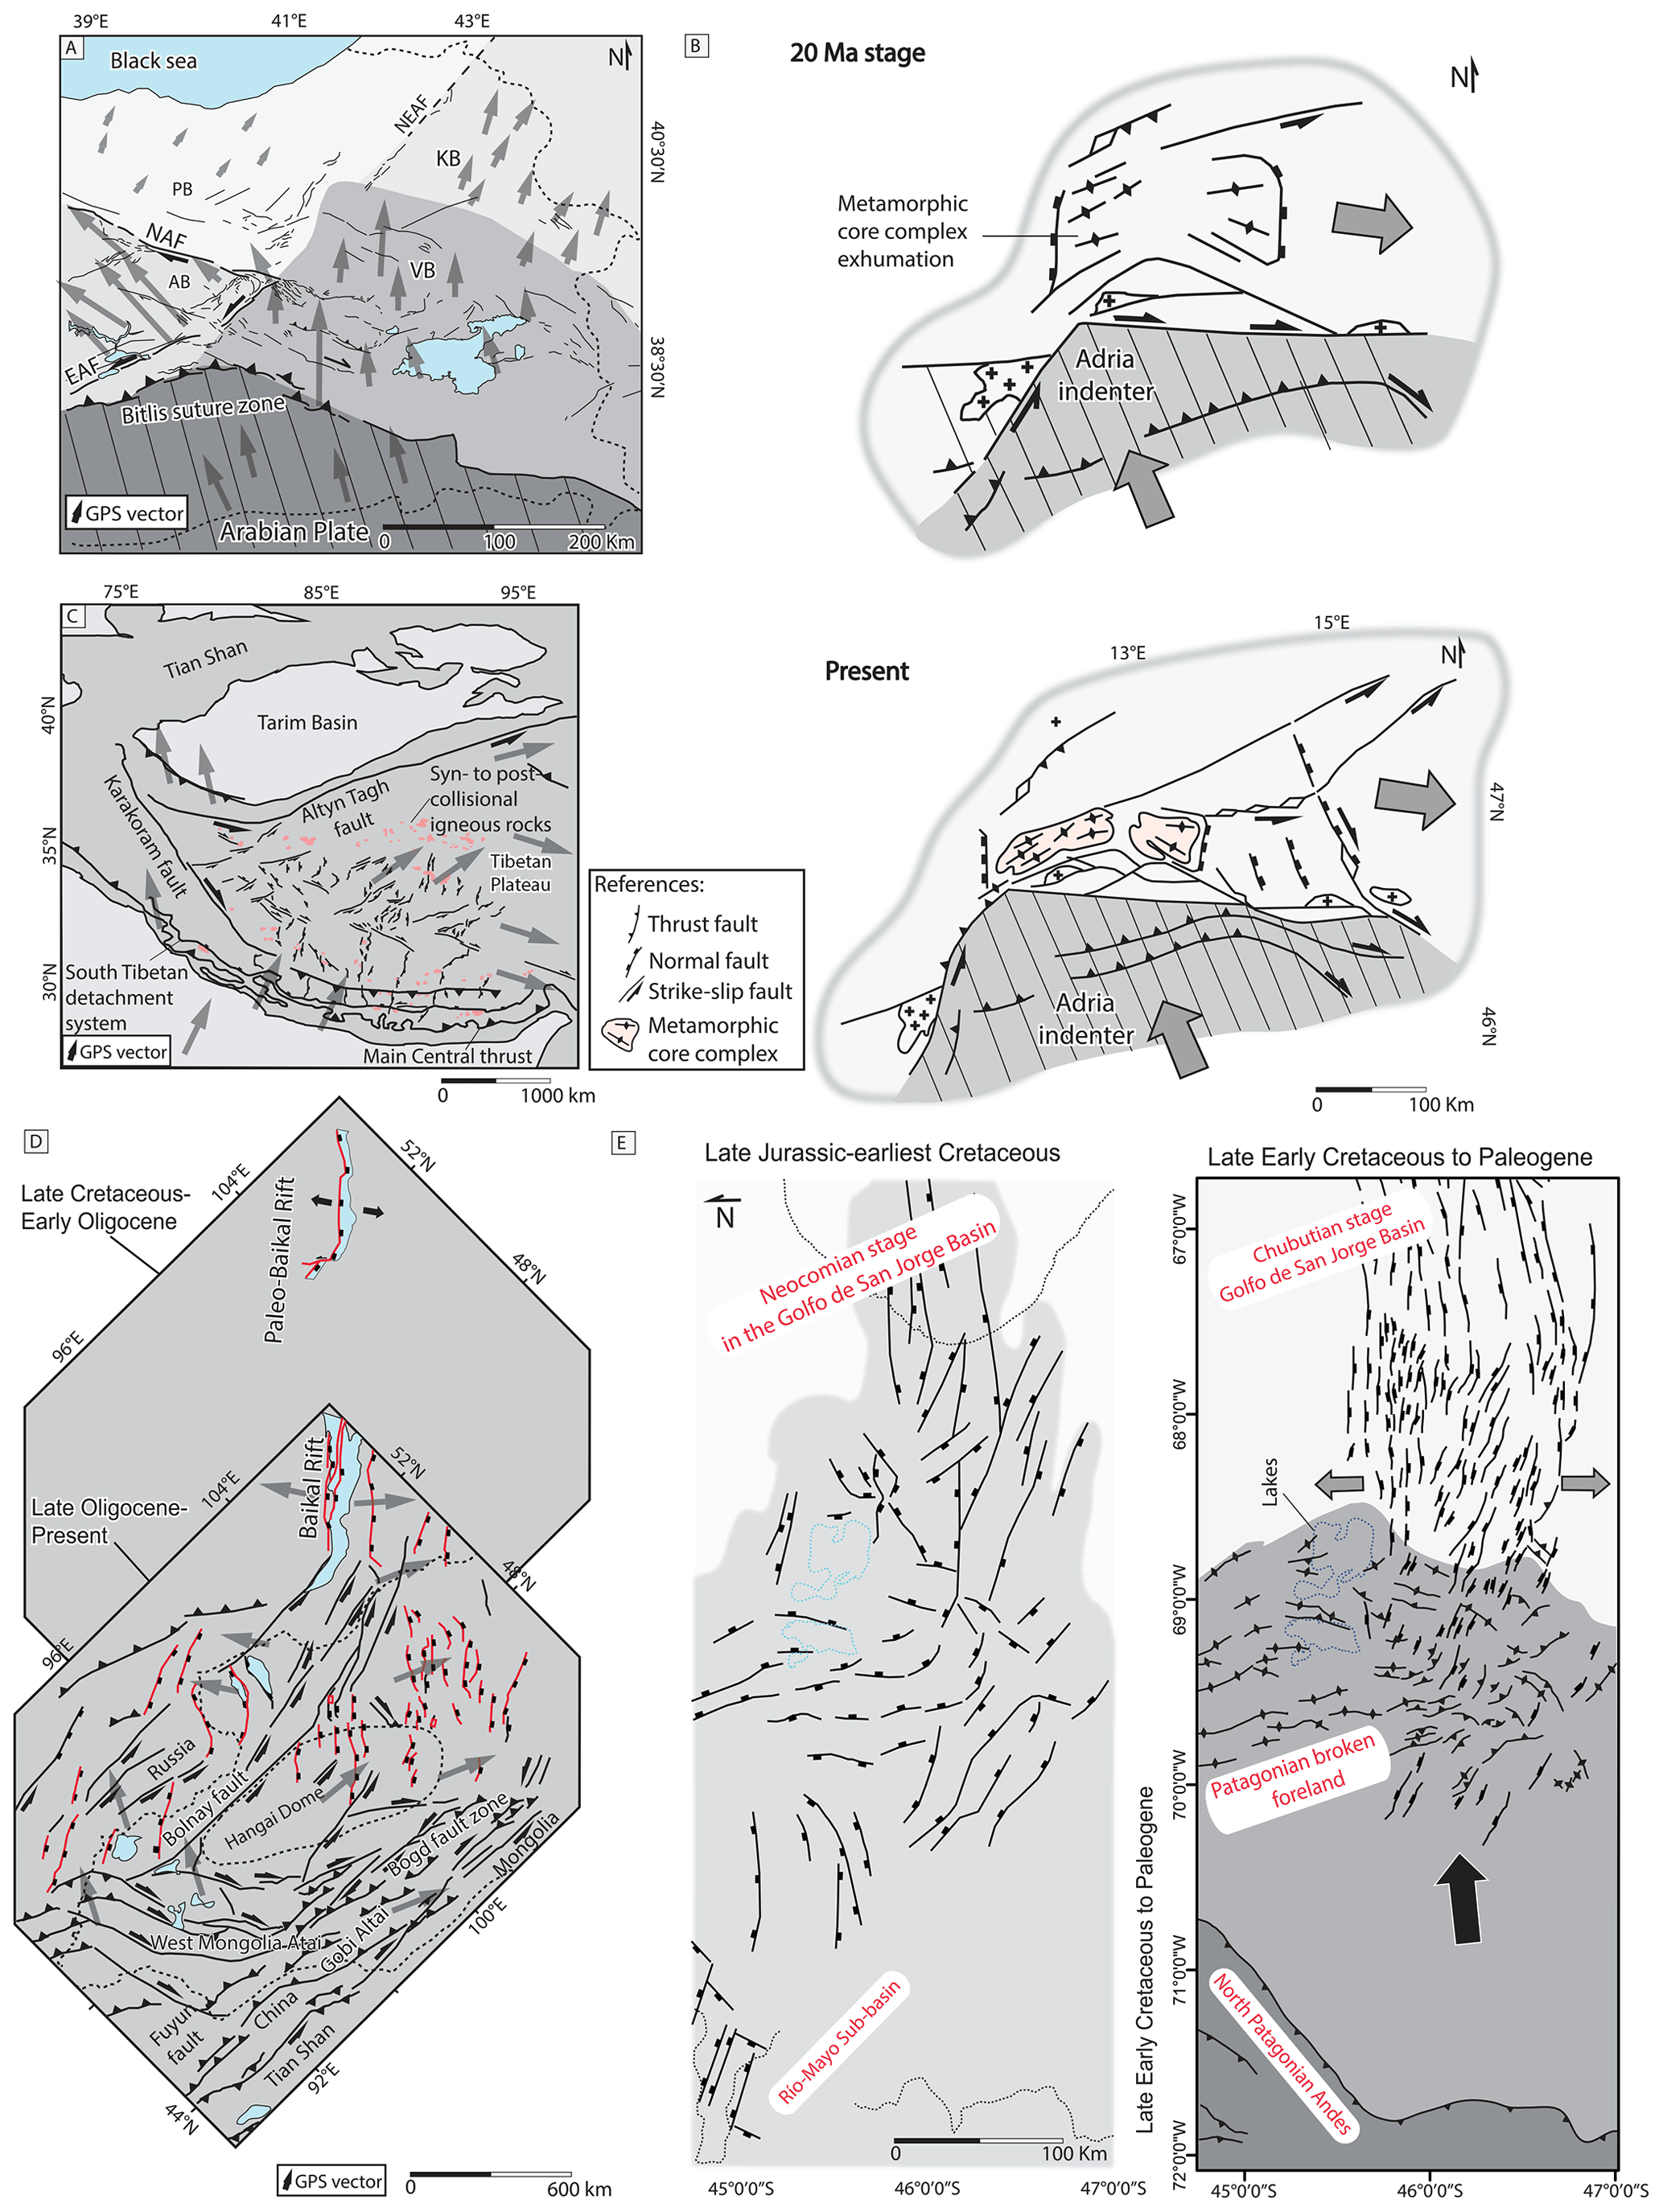
Figure 12(a) Structural map of the eastern Anatolia region with GPS vector indicating crustal blocks kinematics. AB: Anatolide Block; KB: Kars Block; PB: Pontide Block; VB: Van Block; EAF: East Anatolian Fault; NAF: North Anatolian Fault; NEAF: North-East Anatolian Fault. Map modified from Hisarlı et al. (2016). (b) Indentation and lateral extrusion in the Alps. At 20 Ma: onset of indentation, folding, and rapid extensional exhumation of thickening orogenic crust; fragmentation of wedge-shaped Austro-alpine units south of the Tauern Window (basement complex). At present day: oblique thrusting in southern Alps, dextral strike-slip in northern Dinarides, and eastward lateral crustal extrusion. Map modified from Scharf et al. (2013). (c) Structural sketch map of the Tibetan Plateau modified from Lu et al. (2018). (d) Latest Cretaceous–early Oligocene reconstruction of the paleo-Baikal lake rift from Mats and Perepelova (2011) and a map of active structures in the Central Asia region from Yin (2010). (e) Jurassic–Early Cretaceous extension and subsequent synorogenic foreland rifting reactivation stage of the late Early Cretaceous–Paleogene San Jorge Gulf basin in Patagonia. Map modified from Gianni et al. (2015).
4.5 Comparison with previous models and application to natural cases
While our experimental study was not initially designed to reproduce any specific natural case, the observed deformation patterns resemble those documented in certain areas where deformation is accommodated by different combinations of normal, thrust, and strike-slip faults. In general, these complex structural frameworks take place during continental plate convergence, indentation, and lateral escape of lithospheric blocks associated with continental collision (Tapponnier et al., 1982) (Fig. 12). From our models, we observe that at least two different deformation regimes coexist when and the three regimes operate simultaneously mostly when is ≥1.4 (Figs. 4 and 6). The latter could indicate a minimum value for this ratio for effective lateral escape to occur. In nature, the tectonic escape of crustal blocks takes place along conjugate strike-slip faults, commonly referred to as indent-linked strike-slip faults (Woodcock, 1986) or V-shaped conjugate strike-slip faults (e.g., Yin, 2010, and references therein) that take place along with variable degrees of crustal extension within the escaping crustal blocks. Typical V-shaped conjugate faults have been documented in the eastern Anatolia region (e.g., Şengör et al., 1985; Dhont et al., 2006; Hisarlı et al., 2016, Fig. 12a), the eastern Alps (e.g., Ratschbacher et al., 1991; Scharf et al., 2013, Fig. 12b), the Tibetan Plateau (e.g., Şengör and Kidd, 1979; Tapponnier et al., 1982, Fig. 12c), and the central Asian intraplate region (e.g., Cunningham, 2005; Yin, 2010, Fig. 12d). Previous mantle-scale brittle–ductile analog experiments successfully reproduced the formation of V-shaped conjugate faults during continental indentation (e.g., Davy and Cobbold, 1988; Ratschbacher et al., 1991; Martinod et al., 2000; Fournier et al., 2004; Schueller, 2004; Cruden et al., 2006; Rosenberg et al., 2007; van Gelder et al., 2017). However, a direct comparison with our models is difficult because these previous models were aimed at simulating larger domains (several hundreds of kilometers) and the lateral escape of material was not kinematically controlled. Instead, 3D lithospheric-scale numerical models by Le Pourhiet et al. (2014) imposing coeval orthogonal extension and shortening at the edges of the models also show that deformation is accommodated along strike-slip faults with a degree of localization that increases with a decrease in the viscous strength of the lower crust. Results obtained in our models at the crustal scale could therefore be possibly upscaled at the lithospheric scale.
In our models, whether brittle or brittle–ductile, we also observe the development of conjugate strike-slip faults that are accompanied by different degrees of normal faulting during compression, which are reminiscent of those structural systems seen in nature (BI05-08, Fig. 4c and g; CE16–20; Fig. 6). Our results are partly similar to those by Dhifaoui et al. (2021) (model M-3), in which crustal-scale brittle–ductile analog models were subjected to simultaneous shortening and orthogonal extension at imposed by one piston in each direction. Despite the slightly different boundary conditions (stretching being allowed only along one boundary), both approaches show crustal escape through a V-shaped strike-slip system. Instead, models by Corti et al. (2006) that used a similar setup than Dhifaoui et al. (2021) with extension applied to one wall during compression but with a brittle crust, do not show V-shaped conjugate strike-slip faults. Interestingly, in these experiments, the authors used a low value of 0.2. The absence of strike-slip faults is therefore consistent with our minimum value () for effective lateral crustal escape. Strike-slip fault systems active during compression have also been previously addressed by brittle analog models (Duarte et al., 2011; Rosas et al., 2012, 2015). However, in these studies, strike-slip fault strike and activity were constrained by the chosen setup that included confined walls and prescribed fault direction along a mobile pre-existing discontinuity. Because of these constraints, the experiments did not develop typical V-shaped strike-slip systems.
In our models, we did not include the effect of compression obliquity, which has been acknowledged as an important factor driving simultaneous conjugate strike-slip systems and orthogonal extension during indentation (Rosenberg et al., 2007). Also, we note that experiments including an overall weaker crust, simulated by adding a silicon layer as an analog for ductile lower-crust materials, are more prone to have well-developed conjugate strike-slip systems that crosscut the entire model (CE16–20; Fig. 6). This is compatible with previous findings from analog models by Cruden et al. (2006) that explored the role of orogen parallel flow and rheological stratification on vertical and lateral development of structures in hot orogens. These authors simulated a hot orogenic crust by including a weak lower crust with a variable buoyancy and a lithospheric mantle that jointly allowed orogen parallel flow during compression. In these experiments, the development of conjugate strike-slip faults within the orogen appeared to be a common feature in models with buoyant ductile lower crust, whereas in models with a non-buoyant lower crust, conjugate shear zones were generally absent, except in the outer regions of the extruding orogen.
In general, our results are compatible with natural examples analyzed in Fig. 12a–d, where Cenozoic conjugate strike-slip systems formed on board thick and hot and hence weak orogenic crusts of the Anatolian and Tibetan plateaus, Central Asian intraplate orogenic system, and the Alpine orogen. Therefore, a weak crust is an important factor contributing to lateral tectonic escape in those settings by allowing the formation of fault-bounded brittle upper-crust blocks translated laterally by strike-slip systems and constrictional ductile flow in the lower crust (Ratschbacher et al., 1991; Cruden et al., 2006; Scharf et al., 2013).
In models that include an initial stage of extension, and under the applied boundary conditions, we observe variable degrees of extensional to strike-slip reactivation of the previous extensional basins during basin-parallel shortening (BI08-11 and CE17–20, Figs. 4g, h, 6b, c, d). These results differ from previous basin inversion analog models by Del Ventisette et al. (2006), Sani et al. (2007), and Deng et al. (2020), which also applied a basin-parallel shortening after a first stage of orthogonal extension. In these models, despite the low angle between basin strike and shortening direction, thrust faults formed parallel or at a low angle with the shortening direction, ultimately producing basin inversion. This difference could result from the boundary conditions applied in our models BI08-11 and CE17–20, where shortening is accompanied by coeval orthogonal extension, which could explain why basin inversion does not occur in our models. However, this may not be the only controlling factor given that in model BI01, which does not have stretching applied during shortening, there is no evidence of shortening-parallel thrusting during the second stage of deformation (Fig. 4f). This implies that internal parameters are also crucial in allowing basin inversion during orthogonal shortening. In particular, the presence of a larger weak zone at the base of the model, a thinner rift basin crust, and inclusion of surface processes may yield a weaker crustal area leading to an easier localization of deformation during compression. Sokoutis et al. (2000) also showed that folding/thrusting parallel to the shortening direction can be achieved at the transition between crustal blocks with different thicknesses/strengths in models with isostatic compensation, showing that anisotropy and isostasy are two additional key ingredients that may favor basin inversion under parallel shortening. Besides these contrasting results, our models are compatible with natural cases of synorogenic foreland rifting–transtensional reactivations that are complex processes of basin reactivation during regional compression (Gianni et al., 2015). These cases have been well documented in the Baikal region in Central Asia (Mats and Perepelova, 2011; Mats, 2013) and in central Patagonia (Gianni et al., 2015) (Fig. 12d and e). In both cases, former extensional basins orthogonal to neighboring plate margins were subsequently reactivated in transtension by a distal basin-parallel compressional stress field (Fig. 12d and e).
Analog experiments involving simultaneous shortening and orthogonal extension under different boundary and rheological conditions and including the effect of crustal inheritance on fault reactivation allow us to gain new insights into geological areas recording the simultaneous activity of different deformation regimes. Our experiments show that crustal deformation takes place through a combination of normal faults, thrust faults, and strike-slip faults when boundary conditions satisfy non-plane-strain conditions. In this case, the type of structures and their location depend on the applied boundary conditions and the inclusion of pre-existing heterogeneities.
For brittle models, the coexistence of the three types of structures is possible for ratios of stretching rate over shortening rate . For lower , the larger principal stress (σ1) remains horizontal and parallel to the shortening direction, except at the edges of the model where it becomes vertical, producing shortening-parallel normal faults. For values of and for low amounts of shortening, failure of the crust along shortening-orthogonal thrust faults is inhibited. For brittle–ductile models, we do not observe the coexistence of the three types of structures. We observe either shortening-orthogonal thrust faults associated with conjugate strike-slip faults (model with low and no initial extensional stage) or shortening-parallel normal faults associated with conjugate strike-slip faults (model with high and initial extensional stage).
Our models also show that whatever the crustal strength, its past deformation history, and ratio, both normal and thrust faults remain with similar orientations, i.e., shortening-parallel and shortening-orthogonal, respectively. Instead, strike-slip faults exhibit a wide range of possible orientations with respect to the imposed shortening (or extension) direction. In particular, high-angle strike-slip faults with angles of up to ∼65∘ with respect to the shortening direction occur when deforming a strong crust. These faults develop far from the location where shortening is applied when the crust has not been previously deformed but can be also observed closer from the shortening location if the crust has been previously extended. Instead, for weaker crusts, strike-slip faults can be parallel to the shortening direction if they reactivate former extensional structures. Furthermore, we note that under comparable boundary conditions, the strength of the crust plays a fundamental role in controlling the location of deformation and the types of structures that accommodate deformation, highlighting the importance of inherited structures and changes in crustal strength on the distribution of deformation and the types of structures that form during subsequent phases of deformation.
Finally, our models reproduce some of the deformation patterns documented in natural cases where deformation took place through a complex combination of normal, thrust, and strike-slip faults. From these experiments, we observe that at least two different deformation regimes coexist when is ≥0.9 and the three regimes operate simultaneously when is ≥1.4, possibly indicating a minimum value in this ratio for effective lateral escape to take place. Independently of the crustal rheology or the presence of crustal weaknesses, we observe the development of conjugate strike-slip faults accompanied by variable normal faulting during shortening. This is reminiscent of those structural systems seen in nature accommodating tectonic escape of crustal blocks in Central Asia, the eastern Alps, eastern Anatolia, and the Tibetan Plateau. Our results indicate that the conjugate strike-slip systems are favored by an overall weaker crust, which is consistent with observations in the former orogenic areas. In models that include an initial stage of extension, we observe variable degrees of extensional to strike-slip reactivation of the previous extensional basins during basin-parallel shortening that are compatible with examples in the San Jorge basin in Patagonia and the Baikal rift.
Time series of top-view pictures and strain analysis in the form of movies for the 12 experiments are available through the GFZ Data Services (Guillaume et al., 2022): https://doi.org/10.5880/fidgeo.2022.011.
The supplement related to this article is available online at: https://doi.org/10.5194/se-13-1393-2022-supplement.
BG helped in the design of the experiments, participated in running the models, conducted the analysis of the experiments, and co-wrote the paper. GMG ran some of the experiments and co-wrote the paper. JJK designed the experiments, and KB conducted some of the experiments.
The contact author has declared that none of the authors has any competing interests.
Publisher’s note: Copernicus Publications remains neutral with regard to jurisdictional claims in published maps and institutional affiliations.
This article is part of the special issue “Analogue modelling of basin inversion”. It is not associated with a conference.
Guido M. Gianni acknowledges the support given by CONICET. We thank Nemanja Krstekanic and Marco Bonini for their constructive comments.
This paper was edited by Ernst Willingshofer and reviewed by Marco Bonini and Nemanja Krstekanic.
Allmendinger, R. W., Smalley Jr, R., Bevis, M., Caprio, H., and Brooks, B.: Bending the Bolivian orocline in real time, Geology, 33, 905–908, 2005. a
Anderson, E. M.: The Dynamics of Faulting, Transactions of the Edinburgh Geological Society, J. Geol. Soc. London, 8, 387–402, 1905. a, b
Barnes, J. B. and Ehlers, T. A.: End member models for Andean Plateau uplift, Earth-Sci. Rev., 97, 105–132, 2009. a
Berglar, K., Gaedicke, C., Franke, D., Ladage, S., Klingelhoefer, F., and Djajadihardja, Y. S.: Structural evolution and strike-slip tectonics off north-western Sumatra, Tectonophysics, 480, 119–132, 2010. a
Bonini, M., Sani, F., and Antonielli, B.: Basin inversion and contractional reactivation of inherited normal faults: A review based on previous and new experimental models, Tectonophysics, 522, 55–88, 2012. a, b
Broerse, T., Krstekanić, N., Kasbergen, C., and Willingshofer, E.: Mapping and classifying large deformation from digital imagery: application to analogue models of lithosphere deformation, Geophys. J. Int., 226, 984–1017, 2021. a
Brun, J.-P.: Narrow rifts versus wide rifts: inferences for the mechanics of rifting from laboratory experiments, Philos. T. Roy. Soc., 357, 695–712, 1999. a, b
Buck, W. R.: Models of Continental Lithospheric Extension, J. Geophys. Res., 96, 20161–20178, https://doi.org/10.1029/91JB01485, 1991. a
Buiter, S. J. and Adrian Pfiffner, O.: Numerical models of the inversion of half-graben basins, Tectonics, 22, https://doi.org/10.1029/2002TC001417, 2003. a
Burbidge, D. R. and Braun, J.: Numerical models of the evolution of accretionary wedges and fold-and-thrust belts using the distinct-element method, Geophys. J. Int., 148, 542–561, 2002. a
Bürgman, R. and Dresen, G.: Rheology of the Lower Crust and Upper Mantle: Evidence from Rock Mechanics, Geodesy, and Field Observations, Annu. Rev. Earth Pl. Sc., 36, 531–567, https://doi.org/10.1146/annurev.earth.36.031207.124326, 2008. a
Byerlee, J.: Friction of rocks. In Rock friction and earthquake prediction, Birkhäuser, Basel, 615–626, 1978. a
Cembrano, J., Hervé, F., and Lavenu, A.: The Liquiñe Ofqui fault zone: a long-lived intra-arc fault system in southern Chile, Tectonophysics, 259, 55–66, 1996. a
Chemenda, A., Lallemand, S., and Bokun, A.: Strain partitioning and interplate friction in oblique subduction zones: Constraints provided by experimental modelling, J. Geophys Res.-Sol. Ea., 105, 5567–5581, 2000. a
Chorowicz, J.: The east African rift system, J. African Earth Sci., 43, 379–410, 2005. a, b
Cruden, A. R., Nasseri, M. H., and Pysklywec, R.: Surface topography and internal strain variation in wide hot orogens from three-dimensional analogue and two-dimensional numerical vice models, Geol. Soc. Spec. Publ., 253, 79-104, 2006. a, b, c, d
Corti, G., Cuffaro, M., Doglioni, C., Innocenti, F., and Manetti, P.: Coexisting geodynamic processes in the Sicily Channel, in: Postcollisional tectonics and magmatism in the Mediterranean region and Asia, edited by: Dilek, Y. and Pavlides, S., Geol. S. Am. S., 409, 83–96, 2006. a, b, c
Cunningham, D.: Active intracontinental transpressional mountain building in the Mongolian Altai: defining a new class of orogen, Earth Planet. Sc. Lett., 240, 436–444, 2005. a
Davis, D., Suppe, J., and Dahlen, F. A.: Mechanics of fold‐and‐thrust belts and accretionary wedges, J. Geophys. Res-Sol. Ea., 88, 1153–1172, 1983. a
Davy, P. and Cobbold, P. R.: Indentation tectonics in nature and experiment, 1. Experiments scaled for gravity, Bull. Geol. Inst. Univ. Uppsala, 14, 129–141, 1988. a, b, c
Del Ventisette, C., Montanari, D., Sani, F., and Bonini, M.: Basin inversion and fault reactivation in laboratory experiments, J. Struct. Geol., 28, 2067–2083, 2006. a
Deng, H., Koyi, H. A., and Zhang, J.: Modelling oblique inversion of pre-existing grabens, Geol. Soc. Lon. Spec. Pub., 487, 263–290, 2020. a
Dèzes, P., Schmid, S. M., and Ziegler, P. A.: Evolution of the European Cenozoic Rift System: interaction of the Alpine and Pyrenean orogens with their foreland lithosphere, Tectonophysics, 389, 1–33, 2004. a, b
Dhifaoui, R., Strzerzynski, P., Mourgues, R., Rigane, A., Gourmelen, C., and Peigné, D.: Accommodation of compression and lateral extension in a continental crust: Analogical modeling of the Central Atlas (eastern Algeria, Tunisia) and Pelagian sea, Tectonophysics, 817, 229052, https://doi.org/10.1016/j.tecto.2021.229052, 2021. a, b, c
Dhont, D., Chorowicz, J., and Luxey, P.: Anatolian escape tectonics driven by Eocene crustal thickening and Neogene–Quaternary extensional collapse in the eastern Mediterranean region, in: Postcollisional tectonics and magmatism in the Mediterranean region and Asia, edited by: Dilet, Y. and Pavilides, S., Geol. Soc. Spec. Pap., 409, 331–462, 2006. a
Dooley, T. P. and Schreurs, G.: Analogue modelling of intraplate strike-slip tectonics: A review and new experimental results, Tectonophysics, 574, 1–71, 2012. a
Dickinson, W. R.: The Basin and Range Province as a composite extensional domain, Int. Geol. Rev., 44, 1–38, 2002. a
Duarte, J.C., Rosas, F.M., Terrinha, P., Gutscher M.-A., Malavieille, J., Silva, S., and Matias, L.: Thrust–wrench interference tectonics in the Gulf of Cadiz (Africa–Iberia plate boundary in the North-East Atlantic): Insights from analog models, Mar. Geol., 289, 135–149, 2011. a, b
Faccenna, C., Becker, T. W., Auer, L., Billi, A., Boschi, L., Brun, J. P., Capitanio, F.A., Horvàth, F., Jolivet, L., Piromallo, C., Royden, L., Rossetti, F., and Serpelloni, E.: Mantle dynamics in the Mediterranean, Rev. Geophys., 52, 283–332, 2014. a
Fedorik, J., Zwaan, F., Schreurs, G., Toscani, G., Bonini, L., and Seno, S.: The interaction between strike-slip dominated fault zones and thrust belt structures: Insights from 4D analogue models, J. Struct. Geol., 122, 89–105, 2019. a
Fournier, M., Jolivet, L., Davy, P., and Thomas, J. C.: Backarc extension and collision: an experimental approach to the tectonics of Asia, Geophys. J. Int., 157, 871–889, 2004. a, b, c
Giambiagi, L., Alvarez, P., and Spagnotto, S.: Temporal variation of the stress field during the construction of the central Andes: Constrains from the volcanic arc region (22–26∘ S), Western Cordillera, Chile, during the last 20 Ma, Tectonics, 35, 2014–2033, 2016. a
Gianni, G. M., Navarrete, C. G., and Folguera, A.: Synorogenic foreland rifts and transtensional basins: A review of Andean imprints on the evolution of the San Jorge Gulf, Salta Group and Taubaté Basins, J. S. Am. Earth Sci., 64, 288–306, 2015. a, b, c, d, e
Graveleau, F., Malavieille, J., and Dominguez, S.: Experimental modelling of orogenic wedges: A review, Tectonophysics, 538, 1–66, 2012. a
Guillaume, B., Funiciello, F., and Faccenna, C.: Interplays Between Mantle Flow and Slab Pull at Subduction Zones in 3D, J. Geophys. Res., 126, e2020JB021574, https://doi.org/10.1029/2020JB021574, 2021. a
Guillaume, B., Gianni, G. Kermarrec, J.-J., and Bock, K.: Experimental data of analogue models addressing the influence of crustal strength, tectonic inheritance and stretching/shortening rates on crustal deformation and basin reactivation, GFZ Data Services, [data set], https://doi.org/10.5880/fidgeo.2022.011, 2022. a, b
Gutiérrez Alonso, G., Johnston, S. T., Weil, A. B., Pastor Galán, D., and Fernández Suárez, J.: Buckling an orogen: the Cantabrian Orocline, GSA Today, 22, 4–9, 2012. a
Handin, J.: On the Coulomb–Mohr failure criterion, J. Geophys. Res., 74, 5343–5348, 1969. a
Harland, W. B. and Bayly, M. B.: Tectonic regimes, Geol. Mag., 95, 89–104, 1958. a
Hilde, T. W., Uyeda, S., and Kroenke, L.: Evolution of the western Pacific and its margin, Tectonophysics, 38, 145–165, 1977. a
Hisarlı, Z. M., Çinku, M. C., Ustaömer, T., Keskin, M., and Orbay, N. Neotectonic deformation in the Eurasia–Arabia collision zone, the East Anatolian Plateau, E Turkey: evidence from palaeomagnetic study of Neogene–Quaternary volcanic rocks, Int. J. Earth Sci., 105, 139–165, 2016. a, b
Hubbert, M. K.: Theory of scaled models as applied to the study of geological structures, Geol. Soc. Am. Bull., 48, 1459–1520, 1937. a
Jaeger, J. C. and Cook, N. G. W.: Fundamentals of Rock Mechanics, Chapman and Hall, Wiley, New York, 585 pp., 1976. a
Johnston, S. T. and Acton, S.: The Eocene southern Vancouver Island orocline – A response to seamount accretion and the cause of fold-and-thrust belt and extensional basin formation, Tectonophysics, 365, 165–183, 2003. a
Jourdon, A., Le Pourhiet, L., Mouthereau, F., and May, D.: Modes of propagation of continental breakup and associated oblique rift structures, J. Geophys. Res., 125, e2020JB019906, https://doi.org/10.1029/2020JB019906, 2020. a
Klinkmüller, M., Schreurs, G., Rosenau, M., and Kemnitz, H.: Properties of granular analogue model materials: A community wide survey, Tectonophysics, 684, 23–38, 2016. a, b
Koyi, H.: Mode of internal deformation in sand wedges, J. Struct. Geol., 17, 293–300, 1995. a
Krézsek, C., Lăpădata, A., Maţenco, L., Arnberger, K., Barbu, V., and Olarua, R.: Strain partitioning at orogenic contacts during rotation, strike–slip and oblique convergence: Paleogene–Early Miocene evolution of the contact between the South Carpathians and Moesia, Glob. Planet. Change, 103, 63–81, 2013. a
Krstekanić, N.,Willingshofer, E., Broerse, T., Matenco, L., Toljić, M., and Stojadinovic, U.: Analogue modelling of strain partitioning along a curved strike-slip fault system during backarc-convex orocline formation: implications for the Cerna-Timok fault system of the Carpatho-Balkanides, J. Struct. Geol., 149, 104386, https://doi.org/10.1016/j.jsg.2021.104386, 2021. a, b
Krstekanić, N., Willingshofer, E., Matenco, L., Toljić, M., and Stojadinovic, U.: The influence of back-arc extension direction on the strain partitioning associated with continental indentation: Analogue modelling and implications for the Circum-Moesian Fault System of South-Eastern Europe, J. Struct. Geol., 159, 104599, https://doi.org/10.1016/j.jsg.2022.104599, 2022. a, b
Le Pourhiet, L., Huet, B., and Traore, N.: Links between long-term and short-term rheology of the lithosphere: Insights from strike-slip fault modelling, Tectonophysics, 631, 146–159, 2014. a, b
Le Pourhiet, L., Chamot-Rooke, N., Delescluse, M., May, D. A., Watremez, L., and Pubellier, M.: Continental break-up of the South China Sea stalled by far-field compression, Nat. Geosci., 11, 605–609, 2018. a
Lohrmann, J., Kukowski, N., Adam, J., and Oncken, O.: The impact of analogue material properties on the geometry, kinematics, and dynamics of convergent sand wedges, J. Struct. Geol., 25, 1691–1711, 2003. a
Lu, H., Tian, X., Yun, K., and Li, H.: Convective removal of the Tibetan Plateau mantle lithosphere by ∼26 Ma, Tectonophysics, 731, 17–34, 2018. a
Martinod, J., Hatzfeld, D., Davy, P., Gautier, P., and Brun, J. P.: Continental collision, gravity spreading, and kinematics of Aegea and Anatolia, Tectonics, 1, 290–299, 2000. a, b, c
Mats, V. D.: Late cretaceous and cenozoic stratigraphy of the Baikal Rift sediments, Stratigr. Geol. Correl. 21, 637–651, 2013. a
Mats, V. D. and Perepelova, T. I.: A new perspective on evolution of the Baikal Rift, Geosci. Front. 2, 349–365, 2011. a, b
McClay, K.R.: The geometries and kinematics of inverted faults systems: a review of analogue modelling studies, Geol. Soc. Spec. Publ., 88, 97-118, 1995. a
McClay, K. and Bonora, M.: Analog models of restraining stepovers in strike-slip fault systems, AAPG Bull., 85, 233–260, 2001. a
Molnar, P. and Tapponnier, P.: Active tectonics of Tibet, J. Geophys. Res.-Sol. Ea., 83, 5361–5375, 1978. a
Molnar, P. and Dayem, K. E.: Major intracontinental strike-slip faults and contrasts in lithospheric strength, Geosphere, 6, 444–467, 2010. a
Mouthereau, F., Filleaudeau, P.-Y., Vacherat, A., Pik, R., Lacombe, O., Fellin, M. G., Castelltort, S., Christophoul, F., and Masini, E.: Placing limits to shortening evolution in the Pyrenees: Role of margin architecture and implications for the Iberia/Europe convergence, Tectonics, 33, 2283–2314, 2014. a
Mugnier, J. L., Baby, P., Colletta, B., Vinour, P., Bale, P., and Leturmy, P.: Thrust geometry controlled by erosion and sedimentation: A view from analogue models, Geology, 25, 427–430, 1997. a
Munteanu, I., Willingshofer, E., Sokoutis, D., Matenco, L., Dinu, C., and Cloetingh, S.: Transfer of deformation in back-arc basins with a laterally variable rheology: Constraints from analogue modelling of the Balkanides–Western Black Sea inversion, Tectonophysics, 602, 223–236, 2013. a
Oncken O., Hindle D., Kley J., Elger K., Victor P., and Schemmann K.: Deformation of the Central Andean Upper Plate System – Facts, Fiction, and Constraints for Plateau Models, in: The Andes, edited by: Oncken, O., Chong, G., Franz, G., Giese, P., Götze, H.-J., Ramos, V. A., Strecker, M. R., and Wigger, P., Springer, Berlin, Heidelberg, https://doi.org/10.1007/978-3-540-48684-8_1, 2006. a
Philippon, M., Brun, J.-P., Gueydan, F., and Sokoutis, D.: The interaction between Aegean back-arc extension and Anatolia escape since Middle Miocene, Tectonophysics, 631, 176–188, 2014. a
Pfiffner, O. A.: Thick-skinned and thin-skinned tectonics: a global perspective, Geosciences, 7, 71, https://doi.org/10.3390/geosciences7030071, 2017. a
Pinto, L., Muñoz, C., Nalpas, T., and Charrier, R.: Role of sedimentation during basin inversion in analogue modelling, J. Struct. Geol., 32, 554–565, 2010. a
Raleigh, C. B. and Paterson, M. S.: Experimental deformation of serpentinite and its tectonic implications, J. Geophys. Res.-Sol. Ea., 70, 3965–3985, 1965. a
Ramberg, H.: Gravity, deformation and the earth's crust: in theory, experiments and geological applications, Academic Press, London, ISBN: 0125768605 9780125768603, 1981. a
Ratschbacher, L., Merle, O., Davy, P., and Cobbold, P.: Lateral extrusion in the Eastern Alps, part 1: boundary conditions and experiments scaled for gravity, Tectonics, 10, 245–256, 1991. a, b, c, d, e
Rosas, F. M., Duarte, J. C., Neves, M. C., Terrinha, P., Silva, S., Matias, L., Gràcia, E., and Bartolome, R.: Thrust–wrench interference between major active faults in the Gulf of Cadiz (Africa–Eurasia plate boundary, offshore SW Iberia): Tectonic implications from coupled analog and numerical modeling, Tectonophysics, 548, 1–21, 2012. a, b
Rosas, F. M., Duarte, J. C., Schellart, W. P., Tomas, R., Grigorova, V., and Terrinha, P.: Analogue modelling of different angle thrust-wrench fault interference in a brittle medium, J. Struct. Geol., 74, 81–104, 2015. a, b
Rosenberg, C. L., Brun, J. P., Cagnard, F., and Gapais, D.: Oblique indentation in the Eastern Alps: Insights from laboratory experiments, Tectonics, 26, https://doi.org/10.1029/2006TC001960, 2007. a, b
Royden, L. H., Burchfiel, B. C., and van der Hilst, R. D.: The geological evolution of the Tibetan Plateau, Science, 321, 1054–1058, 2008. a
Rudolf, M., Boutelier, D., Roseneau, M., Schreurs, G., and Oncken, O.: Rheological benchmark of silicone oils used for analog modeling of short- and long-term lithospheric deformation, Tectonophysics, 684, 12–22, 2016. a
Rudolf, M., Rosenau, M., and Oncken, O.: Influence of Time-dependent Healing on Reactivation of Granular Shear Zones in analogue models: A Community Benchmark, EGU General Assembly 2022, Vienna, Austria, 23–27 May 2022, EGU22-1670, https://doi.org/10.5194/egusphere-egu22-1670, 202. a
Saint-Carlier, D., Charreau, J., Lavé, J., Blard, P. H., Dominguez, S., Avouac, J. P., and ASTER Team.: Major temporal variations in shortening rate absorbed along a large active fold of the southeastern Tianshan piedmont (China), Earth Planet. Sc. Lett., 434, 333–348, 2016. a
Sani, F., Del Ventisette, C., Montanari, D., Bendkik, A., and Chenakeb, M.: Structural evolution of the Rides Prerifaines (Morocco): structural and seismic interpretation and analogue modelling experiments, Int. J. Earth Sci., 96, 685–706, 2007. a
Saria, E., Calais, E., Stamps, D. S. Delvaux, D., and Hartnady, C. J. H.: Present-day kinematics of the East African Rift, J. Geophys. Res.-Sol. Ea., 119, 3584–3600, 2014. a
Scharf, A., Handy, M. R., Favaro, S., Schmid, S. M., and Bertrand, A.: Modes of orogen-parallel stretching and extensional exhumation in response to microplate indentation and roll-back subduction (Tauern Window, Eastern Alps), Int. J. Earth Sci., 102, 1627–1654, 2013. a, b, c, d
Schellart, W. P.: Shear test results for cohesion and friction coefficients for different granular materials: scaling implications for their usage in analogue modelling, Tectonophysics, 324, 1–16, 2000. a
Schellart, W. P., Chen, Z., Strak, V., Duarte, J. C., and Rosas, F. M.: Pacific subduction control on Asian continental deformation including Tibetan extension and eastward extrusion tectonics, Nat. Commun., 10, 4480, https://doi.org/10.1038/s41467-019-12337-9, 2019. a
Schreurs, G., Buiter, S. J. H., Boutelier, J., Burberry, C., Callot, J.-P., Cavozzi, C., Cerca, M., Chen, J.-H., Cristallini, E., Cruden, A. R., Cruz, L., Daniel, J.-M., Da Poian, G., Garcia, V. H., Gomes, C. J. S., Grall, C., Guillot, Y., Guzmán, C., Hidayah, T. N., Hilley, G., Klinkmüller, M., Koyi, H. A., Lu, C.-Y., Maillot, B., Meriaux, C., Nilfouroushan, F., Pan, C.-C., Pillot, D., Portillo, R., Rosenau, M., Schellart, W. P., Schlische, R. W., Take, A., Vendeville, B., Vergnaud, M., Vettori, M., Wang, S.-H., Withjack, M. O., Yagupsky, D., and Yamadaw, Y.: Benchmarking analogue models of brittle thrust wedges, J. Struct. Geol., 92, 116–139, 2016. a
Schueller, S.: Localisation de la déformation et fracturation associée, Etude expérimentale et numérique sur des analogues de la lithosphère continentale, PhD thesis, Université de Rennes 1, 250 pp., 2004. a
Sengör, A. M. C.: Collision of irregular continental margins: Implications for foreland deformation of Alpine-type orogens, Geology, 4, 779–782, 1976. a, b
Şengör, A. M. C. and Kidd, W. S. F.: Post-collisional tectonics of the Turkish–Iranian plateau and a comparison with Tibet, Tectonophysics, 55, 361–376, 1979. a
Şengör, A. M. C., Görür, N., and Şaroğlu, F.: Strike-Slip Faulting and Related Basin Formation in Zones of Tectonic Escape: Turkey as a Case Study, in: Strike-Slip Deformation, Basin Formation, and Sedimentation, edited by: Biddle, K. T., Christie-Blick, N., SEPM Special Publication, no. 37, 1985. a
Simpson, G.: Mechanics of non-critical fold–thrust belts based on finite element models, Tectonophysics, 499, 142–155, 2011. a
Sokoutis, D., Bonini, M., Medvedev, S., Boccaletti, M., Talbot, C. J., and Koyi, H.: Indentation of a continent with a built-in thickness change: experiment and nature, Tectonophysics, 320, 243–270, 2000. a
Sternai, P., Jolivet, L., Menant, A., and Gerya, T.: Driving the upper plate surface deformation by slab rollback and mantle flow, Earth Planet. Sc. Lett., 405, 110–118, 2014. a
Sternai, P., Sue, C., Husson, L., Serpelloni, E., Becker, T. W., Willett, S. D., Faccenna, C., Di Giulio, A., Spada, G., Jolivet, L., Valla, P., Petit, C., Nocquet, J.-M., Walpersdorf, A., and Castelltort, S.: Present-day uplift of the European Alps: Evaluating mechanisms and models of their relative contributions, Earth-Sci. Rev., 190, 589–604, 2019. a
Sutherland, R., Davey, F., and Beavan, J.: Plate boundary deformation in South Island, New Zealand, is related to inherited lithospheric structure, Earth Planet. Sc. Lett., 177, 141–151, 2000. a
Takagi, H.: Implications of mylonitic microstructures for the geotectonic evolution of the Median Tectonic Line, central Japan, J. Struct. Geol., 8, 3–14, 1986. a
Tapponnier, P. and Molnar, P.: Slip-line field theory and large-scale continental tectonics, Nature, 264, 319–324, 1976. a
Tapponnier, P., Peltzer, G. L. D. A. Y., Le Dain, A. Y., Armijo, R., and Cobbold, P.: Propagating extrusion tectonics in Asia: New insights from simple experiments with plasticine, Geology, 10, 611–616, 1982. a, b, c, d, e, f
Tapponnier, P., Zhiqin, X., Roger, F., Meyer, B., Arnaud, N., Wittlinger, G., and Jingsui, Y.: Oblique stepwise rise and growth of the Tibet Plateau, Science, 294, 1671–1677, 2001. a, b, c, d
Tatar, M., Hatzfeld, D., Martinod, J., Walpersdorf, A., Ghafori-Ashtiany, M., and Chéry, J.: The present-day deformation of the central Zagros from GPS measurements, Geophys. Res. Lett., 29, 1–4, 2002. a
Thielicke, W., and Sonntag, R.: Particle Image Velocimetry for MATLAB: Accuracy and Enhanced Algorithms in PIVlab, J. Open Res. Softw., 9, Ubiquity Press, Ltd., 2021, https://doi.org/10.5334/jors.334, 2021. a
Twiss, R. J. and Moores, E. M.: Structural Geology, W. H. Freeman and Company, New York, 532 pp., 1992. a
van Gelder, I. E., Willingshofer, E., Sokoutis, D., and Cloetingh, S. A. P. L.: The interplay between subduction and lateral extrusion: A case study for the European Eastern Alps based on analogue models, Earth Planet. Sc. Lett., 472, 82–94, 2017. a, b
Vendeville, B., Cobbold, P. R., Davy, P., Brun, J.-P., and Choukroune, P.: Physical models of extensional tectonics at various scales, in: Continental Extensional Tectonics, edited by: Coward, M. P., Dewey, J. F., and Hancock, P. L., Geol Soc. Spec. Publ., 28, 95–107, 1987. a
Weijermars, R. and Schmeling, H.: Scaling of Newtonian and non-Newtonian fluid dynamics without inertia for quantitative modelling of rock flow due to gravity (including the concept of rheological similarity), Phys. Earth Planet. In., 43, 316–330, 1986. a
Woodcock, N. H.: The role of strike-slip fault systems at plate boundaries, Philos. T. Roy. Soc., 317, 13–29, 1986. a, b, c
Yin, A.: Cenozoic tectonic evolution of Asia: A preliminary synthesis, Tectonophysics, 488, 293–325, 2010. a, b, c
Zoback, M. L.: First- and second- sorder patterns of stress in the lithosphere: The World Stress Map Project, J. Geophys. Res.-Sol. Ea., 97, 11703–11728, 1992. a
Zwaan, F., Schreurs, G., Naliboff, J., and Buiter, S. J. H.: Insights into the effects of oblique extension on continental rift interaction from 3D analogue and numerical models, Tectonophysics, 693, 239–260, https://doi.org/10.1016/j.tecto.2016.02.036, 2016. a
Zwaan, F., Schreurs, G., and Buiter, S. J. H.: A systematic comparison of experimental set-ups for modelling extensional tectonics, Solid Earth, 10, 1063–1097, https://doi.org/10.5194/se-10-1063-2019, 2019. a
Zwaan, F., Chenin, P., Erratt, D., Manatschal, G., and Schreurs, G.: Complex rift patterns, a result of interacting crustal and mantle weaknesses, or multiphase rifting? Insights from analogue models, Solid Earth, 12, 1473–1495, https://doi.org/10.5194/se-12-1473-2021, 2021. a, b
Zwaan, F., Schreurs, G., Buiter, S., Ferrer, O., Reitano, R., Rudolf, M., and Willingshofer, E.: Analogue modelling of basin inversion: a review and future perspectives, Solid Earth Discuss. [preprint], https://doi.org/10.5194/se-2022-8, in review, 2022. a