the Creative Commons Attribution 4.0 License.
the Creative Commons Attribution 4.0 License.
 | 08 Oct 2025
Numerical investigation of parameters influencing back-thrust development in outer wedge fronts of fold-and-thrust belt systems
Saeed Mahmoodpour
Florian Duschl
Michael C. Drews
Thrusting in fold-and-thrust belts can manifest in different styles. Here we investigate the parameters influencing back-thrust development over fore-thrust development at the frontal part of fold-and-thrust belts using numerical geomechanical forward modeling. We vary the strength of the material involved, the dip and friction of the décollement, and the displacing boundary conditions to examine the impact of these properties on back-thrust development. The results of this numerical sensitivity analysis reveal that back-thrusting mainly increases with increasing material strength and decreasing friction coefficient of the décollement. Décollement dip has a less prominent impact on back-thrusting, but decreasing the décollement's dip angle enhances back-thrusting likelihood. In summary, we find that the contrast between the work necessary to shear the wedge material and the work necessary to slide along the décollement is the main driver for initiating back-thrusting (high contrast) over fore-thrusting (low or even negative contrast), which compares well with field observations. In addition, we also investigate and discuss the effect of a pure lateral displacement rate boundary condition vs. a condition in which displacement along the décollement is coupled with the lateral displacement rate on numerical simulations of back-thrusting development.
- Article
(1414 KB) - Full-text XML
-
Supplement
(5208 KB) - BibTeX
- EndNote


-
Material strength is recognized as the most important factor for back-thrusting
-
Increasing the friction coefficient of the décollement decreases likelihood of back-thrusting
-
Strength contrast between taper and décollement is the main driver of back-thrusting and compares well with field observations
A fold-and-thrust belt is a geological feature which forms due to compression and is characterized by folded and thrusted rock layers. Resulting thrusts can be divided into fore-thrusts and back-thrusts based on their development directions relative to the layers' displacement. In this study, back-thrust is assumed as a vergence towards the rear of the wedge with a succession of faults that chronologically develop towards the back wall (displacing wall).
1.1 Geological and theoretical background
These structures are observed in major mountain ranges across the world, such as the European Alps (Brisson et al., 2023; McClay, 2011), the Himalayas (Mugnier et al., 2022), and the Rocky Mountains (McMechan, 2023), but also in sub-sea accretionary prisms and at frontal parts of deltaic and mass transport deposits (Bilotti and Shaw, 2005). Typically, the development of back-thrusts occurs between the axis of the main orogenic uplift zone and its foredeep; here, convergence is accommodated by thrust faults and folding. Analyzing the progressive development of fold-and-thrust belt systems provides essential insights into mountain-building processes, geological history, and the mechanisms which are shaping the Earth's crust in tectonic convergence zones.
Hubbert and Rubey (1959) were of the pioneers who examined the mechanisms behind the development of fold-and-thrust belt systems and built the basis for the development of the critical taper theory (Eq. 1 for the dry sand wedge), as formulated by Dahlen (1990). The critical taper theory examines the force balances to form a wedge (taper) through compression and provides an analytical tool which considers the relationship between pore pressure, stress, and the geometry of fold-and-thrust belts. Based on this approach, material strength and basal friction of a wedge are used to characterize critical taper development. Assuming the predefined material strength and basal friction in a wedge with known basal dip angle, minimum and maximum values are calculated as the critical taper angles (difference between surface slope and basal dip angle, α+β in Eq. 1). When the taper angle is equal to α+β, the wedge is assumed to be stable. When the taper angle is lower than the minimum value, the surface dip angle increases through thrusting, resulting in greater wedge thickness. This process continues until the taper angle reaches the minimum value, i.e., critical state. Accretion of new material at the toe of the wedge then keeps the surface angle stable. In cases where the taper angle exceeds the maximum value, the surface angle decreases through normal faulting at the wedge front (Ruh et al., 2012):
where α, β, φ, and μb are the surface dip angle, basal dip angle, angle of internal friction, and basal friction coefficient, respectively. The governing equations of the processes involved in the evolution of fold-and-thrust belt systems and their interactions are highly non-linear. Also, the boundary and displacement conditions are not the same for all cases. These are challenges for the unified analytical approaches, such as the critical taper theory.
Considering the critical taper theory in a system with predefined material properties (constant φ in Eq. 1), increasing basal friction coefficient (stronger décollement) results in a larger taper angle. This system will try to reach a stable condition through fore-thrust development at the front of the wedge. In contrast, decreasing the basal friction coefficient (weaker décollement) results in a smaller taper angle. In this system, back-thrusting at the rear of the wedge tries to increase the taper angle. These relationships have been extensively explored through numerical and analogous sandbox experiments.
1.2 Influencing factors on back-thrust development
Numerous factors, including the surface features (Marques and Cobbold, 2006), thickness and strength of the overburden layers (Lohrmann et al., 2003; Teixell and Koyi, 2003), material deposition or erosion (Cruz et al., 2010; Smit et al., 2010), properties of the basal décollement (Koyi and Vendeville, 2003; Smit et al., 2003), the presence of weak layers within the rock sequence (Ruh et al., 2012), and the difference in material strength of the top layers to basal décollement (Couzens-Schultz et al., 2003), have been identified as influencing factors for the development of back-thrusts (Zhou et al., 2016).
Seely (1977) explained the presence of the low basal friction through overpressure development and the presence of weak material in this zone. The idea of back-thrusting in a system with a weak décollement is confirmed through experimental investigations (Bonini, 2007; Couzens-Schultz et al., 2003; Gutscher et al., 2001). Likewise, Bilotti and Shaw (2005) attributed back-thrusting in the Niger Delta to the low basal friction which results from overpressure in this zone. Furthermore, the dip angle of the basal décollement can play a role in back-thrust development. MacKay (1995) examined this parameter and claimed that fore-thrusts develop in a system with a low basal angle. Based on this study, a system with higher basal angle will therefore favor back-thrusting. Albertz and Sanz (2012) used numerical simulation to examine fold-and-thrust belt systems and found that systems with over-consolidated material involved (high-strength materials) resulted in back-thrusting. Their findings suggested that rigid materials exhibit locally concentrated strain zones, whereas soft materials display diffusive plastic strain behavior. Similarly, Cubas et al. (2016), by using numerical simulation, mentioned that there is a chance of back-thrusting in systems with high pre-consolidated material, high basal dip angle, and low basal friction coefficient. Further numerical investigations by Del Castello and Cooke (2007) showed that the development of back-thrust requires more energy than fore-thrust formation and that overpressure development in the basal layer enhances the likelihood of back-thrusting.
Nevertheless, the conditions that lead to back-thrusting are not thoroughly examined in detail. Recently, von Hagke et al. (2024) investigated the friction coefficient and dip angle of the décollement in Coulomb wedges (a friction wedge used to convert forces) and observed that back-thrust-dominated wedges tend to develop in configurations with very low basal dip angle (less than 0.5°) and a low friction coefficient. Increasing the friction coefficient or dip angle of the décollement causes the development of pop-up structures so that fore-thrusting may finally be the dominate deformation style. However, the examination of the real field cases also suggests that the friction coefficient and basal décollement angle might not be the only reasons behind back-thrusting, highlighting the importance of a more systematic examination of back-thrust development, which addresses the different controlling parameters.
1.3 Geomechanical forward modeling and study goal
In this context, employing a large-strain geomechanical forward-modeling scheme combined with dynamic elasto-plastic behavior of the materials involved can offer valuable insights. The elasto-plastic behavior of the soil can be tracked through the critical state soil mechanics model (Roscoe et al., 1958; Wood, 1991). Models derived from critical state theory have proven highly successful in describing the mechanical behavior of geological formations, such as subduction zones and offshore accretionary prisms systems (Flemings and Saffer, 2018; Song et al., 2011), often achieving this through a finite set of inputs (Albertz and Lingrey, 2012; Albertz and Sanz, 2012). Thereby, critical state soil mechanics models create a relationship between the porosity changes and variation in the deviatoric and mean effective stresses through the numerical simulation of the subsurface deformation (Crook et al., 2006). Incorporation of critical state soil mechanics into numerical geomechanical forward modeling can help us understand the evolution of complex geological features and has been successfully employed in the past to study deformation in subduction zones, accretionary prisms (Gao et al., 2018; Nikolinakou et al., 2023; Obradors-Prats et al., 2017), and other compressive geological features (Heidari et al., 2020; Obradors-Prats et al., 2023). Limit analysis theory has also been applied in the literature to study fold-and-thrust belt systems. In this regard, Mary et al. (2013) demonstrated that the locations of faults and their lifetimes are governed by deterministic chaos. Robert et al. (2019) used this approach to investigate the impact of syn-tectonic sedimentation on stresses in a ramp propagation fold. These stress values are essential for examining fracture developments, their orientation, and the resulting fluid flow patterns in basin analysis. Adwan et al. (2024) applied the limit analysis approach to study stress distribution at the lateral termination of a thrust–fold system. The fast runtime of simulations using this approach enabled the authors to conduct a large number of simulations to analyze the effects of basement and fault friction angles on the failure pattern.
In the presented study, we narrow our focus to the limited controlling parameters of fore-thrust and back-thrust development at the frontal part of fold-and-thrust belts by performing a parametric study by the means of numerical geomechanical forward modeling. Thereby, we assume that a taper has already formed and is advancing over a total time span of 7 Ma. Our study also considers sedimentation during deformation by modeling a single depositional event. We use a constitutive law, which resembles critical state soil mechanics (Soft Rock SR3; Crook et al., 2006), and vary pre-consolidation pressure as a proxy for material strength, initial taper dips, friction coefficient of the décollement, and displacement boundary conditions to investigate their impact on the resulting shape and orientation of evolving thrusts. A sensitivity analysis is performed on these parameters to assess their influence on back-thrust development, and the results are discussed in the context of previous studies and real-world examples.
In this study, plane strain conditions are employed to model geomechanical processes through the Elfen software (Rockfield, 2017). To minimize potential boundary effects from additional sediment loading, a quasistatic criterion is considered during the modeling. Explicit and Lagrangian methods are utilized to discretize the equations, taking into account the finite strain nature of the system. The governing equations of geomechanical equilibrium are as follows (Gao et al., 2018):
in which , , τxz, ρb, and ρw show horizontal effective stress, vertical effective stress, shear stress, bulk density, and water density, respectively.
2.1 Meshing
Adaptive remeshing is employed to track the large-strain behavior efficiently within reasonable computational time. After each calculation step, element distortion in each area is compared with a predefined limit. If the distortion area error exceeds a critical value (here 20), remeshing is initiated, with the mesh size being a non-linear function of plastic strain through an interpolation function:
-
mesh size = 400 m for plastic strain = 0,
-
mesh size = 400 m for plastic strain = 0.1,
-
mesh size = 300 m for plastic strain = 0.2,
-
mesh size = 200 m for plastic strain > 0.5.
This adaptive remeshing prevents premature termination of the simulation and offers benefits such as reducing calculation errors, tracking deformation effectively, and accelerating calculations in low-affected areas with larger-sized elements.
2.2 Model setup and initiation
2.2.1 Geometry
The initial geometry presents the very frontal part of a fold-and-thrust belt in a generalized two-dimensional plane strain domain (Fig. 1a). In this geometry, six layers (layer 5 is at the bottom, with layer 1 being the topmost layer, while layer 0 is deposited during the simulation) are distinguished and characterized by homogeneous and isotropic material properties. The surface angle α of the initial geometry (layer 1) and the angle of the décollement β are varied in this study. The length of the system is 50 km, and layer thickness is 350 m for layer 5, 500 m for layer 4, 400 m for layer 3, 1000 m for layer 2, and for layer 1 based on Fig. 1. The top surface of layer 0 is flat and located 11 km above the lower boundary of the model. The décollement is defined by a frictional surface between the upper and lower sections and is placed between layers 2 and 3. The décollement is divided into areas of different friction by a discontinuity point, as illustrated in Fig. 1 (marked with X). The friction coefficient on the right side of the discontinuity point is varied in this study, while the left side is restricted from displacement (i.e., layer 2 = layer 3).
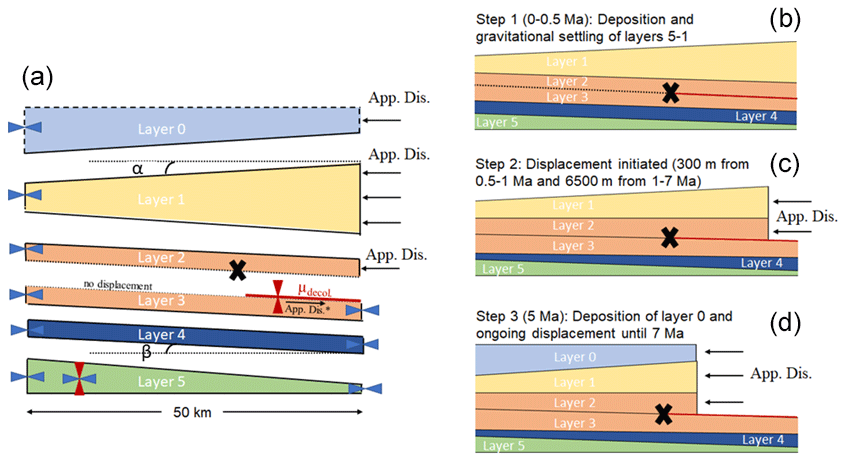
Figure 1Initial geometry, boundary conditions, displacement, and modeling steps which are used during simulation. (a) Initial model geometry and boundary conditions. μdecol. and App. Dis. stand for friction coefficient of the décollement and applied displacement, respectively, while β and α show the dip angle of the décollement and initial taper surface, respectively. App. Dis.* indicates the additionally tested displacement condition, where sliding across the décollement is fixed at the same rate as the lateral displacement. (b–d) Key modeling steps with initial gravitational settling (b), displacement at two different rates (c), and deposition of layer 0 (d). The black cross shows the initial location of the discontinuity point over the décollement.
2.2.2 Displacement conditions
A predefined movement boundary condition is assigned to the right boundary of the system (Fig. 1a). In the geomechanical analysis, the only criterion for the displacement rate is the quasistatic condition. This means that the loading is implemented so gently that, at each given time step, the deformation happens in a static condition and the inertia impacts are negligible. As long as this condition is not violated, the final result remains independent of the displacement rate. The right-hand section of the décollement is vertically constrained to avoid upward motion during the leftward displacement of the upper layers, ensuring no uplift due to vertical relaxation when the overburden load decreases to zero. This assumption causes high plastic strain development in this area during the initialization period, which disappears after horizontal shortening is initiated. Horizontal shortening is modeled with an equal displacement rate of layers 2, 1, and 0, whereas layer 0 is deposited after a prescribed time. The left boundary is restricted from horizontal movement. The bottom boundary remains restricted in all directions throughout the simulation (Fig. 1a). In addition, we also test an additional boundary condition where movement of the overburden layers along the décollement is fixed to the same rate as the movement of the right-hand side boundary (Fig. 1a). This boundary condition has been employed in other experimental and numerical studies (Obradors-Prats et al., 2017; Ruh et al., 2012; von Hagke et al., 2024) and may lead to differences in the style of deformation (Zhou et al., 2016). We implement the additional boundary condition by applying a constant displacement rate to the bottom surface of layer 2, rightward of the discontinuity point (Fig. 1a).
2.2.3 Model initiation and key modeling steps
Before horizontal shortening is initiated from the right-hand side of the model, the initial 0.5 million years (Ma) of the simulation is dedicated to allowing for gravitational settling of the system (Fig. 1b). Thereby, the total initial height of the model will decrease due to gravitational compaction, with horizontal stress being allowed to build up following an effective stress ratio, . Subsequently, horizontal displacement starts with two different movement rates: 300 m from 0.5 to 1 Ma, followed by 6500 m from 1 to 7 Ma (Fig. 1c). Initially, only pure horizontal displacement occurs, representing tectonic convergence. Starting from 5 Ma onward, horizontal displacement is coupled with simultaneous deposition and increased vertical loading to account for additional sedimentary deposition and its impact on deformation evolution (Fig. 1d). For deposition type, deposition by morphing is selected in two sublayers during 2 Ma. The top horizon for the deposition stage is assigned as the top surface of layer 0 in Fig. 1. Implementing deposition by morphing would insert the new sediment in such a way that its upper surface would be smoothly graded between the initial topographic profile (i.e., the original top of the domain) and a user-defined horizon.
The selection of time steps is crucial for successful simulation runs. While a large time step helps to reduce the simulation runtime, it may endanger the quasistatic state of the simulation. Therefore, through trial and error, the time steps are chosen to maintain the quasistatic state of the solution while being large enough to improve simulation speed. However, as shown in Fig. 1, the décollement is assumed to be a straight line in the initial geometry, while real field cases may exhibit some degree of elastic curvature. This curvature can influence stress orientation and deformation style (Willett and Schlunegger, 2010); however, for simplicity, it is assumed to be a straight line in this study.
2.3 Material constitutive behavior and properties
We use the SR3 constitutive model (Crook et al., 2006) which is based on critical state soil mechanics (Wood, 1991). Volumetric changes in critical state soil mechanics consider both mean effective stress p and deviatoric stress q in deformation-related sediment compaction (Fig. 2). Mean effective stress p is calculated as
and deviatoric stress q results from
In Eqs. (4) and (5), and represent the maximum, medium, and minimum principal stresses and principal effective stresses, which can be either the minimum horizontal stress σh, the vertical stress σv, or the maximum horizontal stress σH, respectively.
The SR3 yield surface is divided by the critical state line into a compaction side representing diffuse strain and a dilation part corresponding to strain localization. The dip angle of the critical state line is calculated as (Gao et al., 2018)
where ξ is a friction parameter which is closely related to the internal friction angle and nsr3 is a material constant.
The yield surface intersects the mean effective stress line at two points which define the tensile intersection (pt) and the pre-consolidation pressure (pc) of the material. On the yield surface, porosity is constant and can therefore change as a function of both mean effective stress and deviatoric stress.
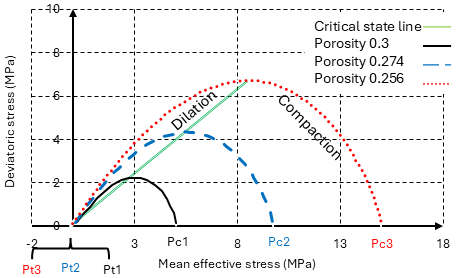
Figure 2Yield surface in the SR3 model (for the case with pre-consolidation pressure of 5 MPa). The dashed blue line and dotted red line indicate the change in the yield surface with mean effective stress increasing to 10 and 15 MPa, respectively.
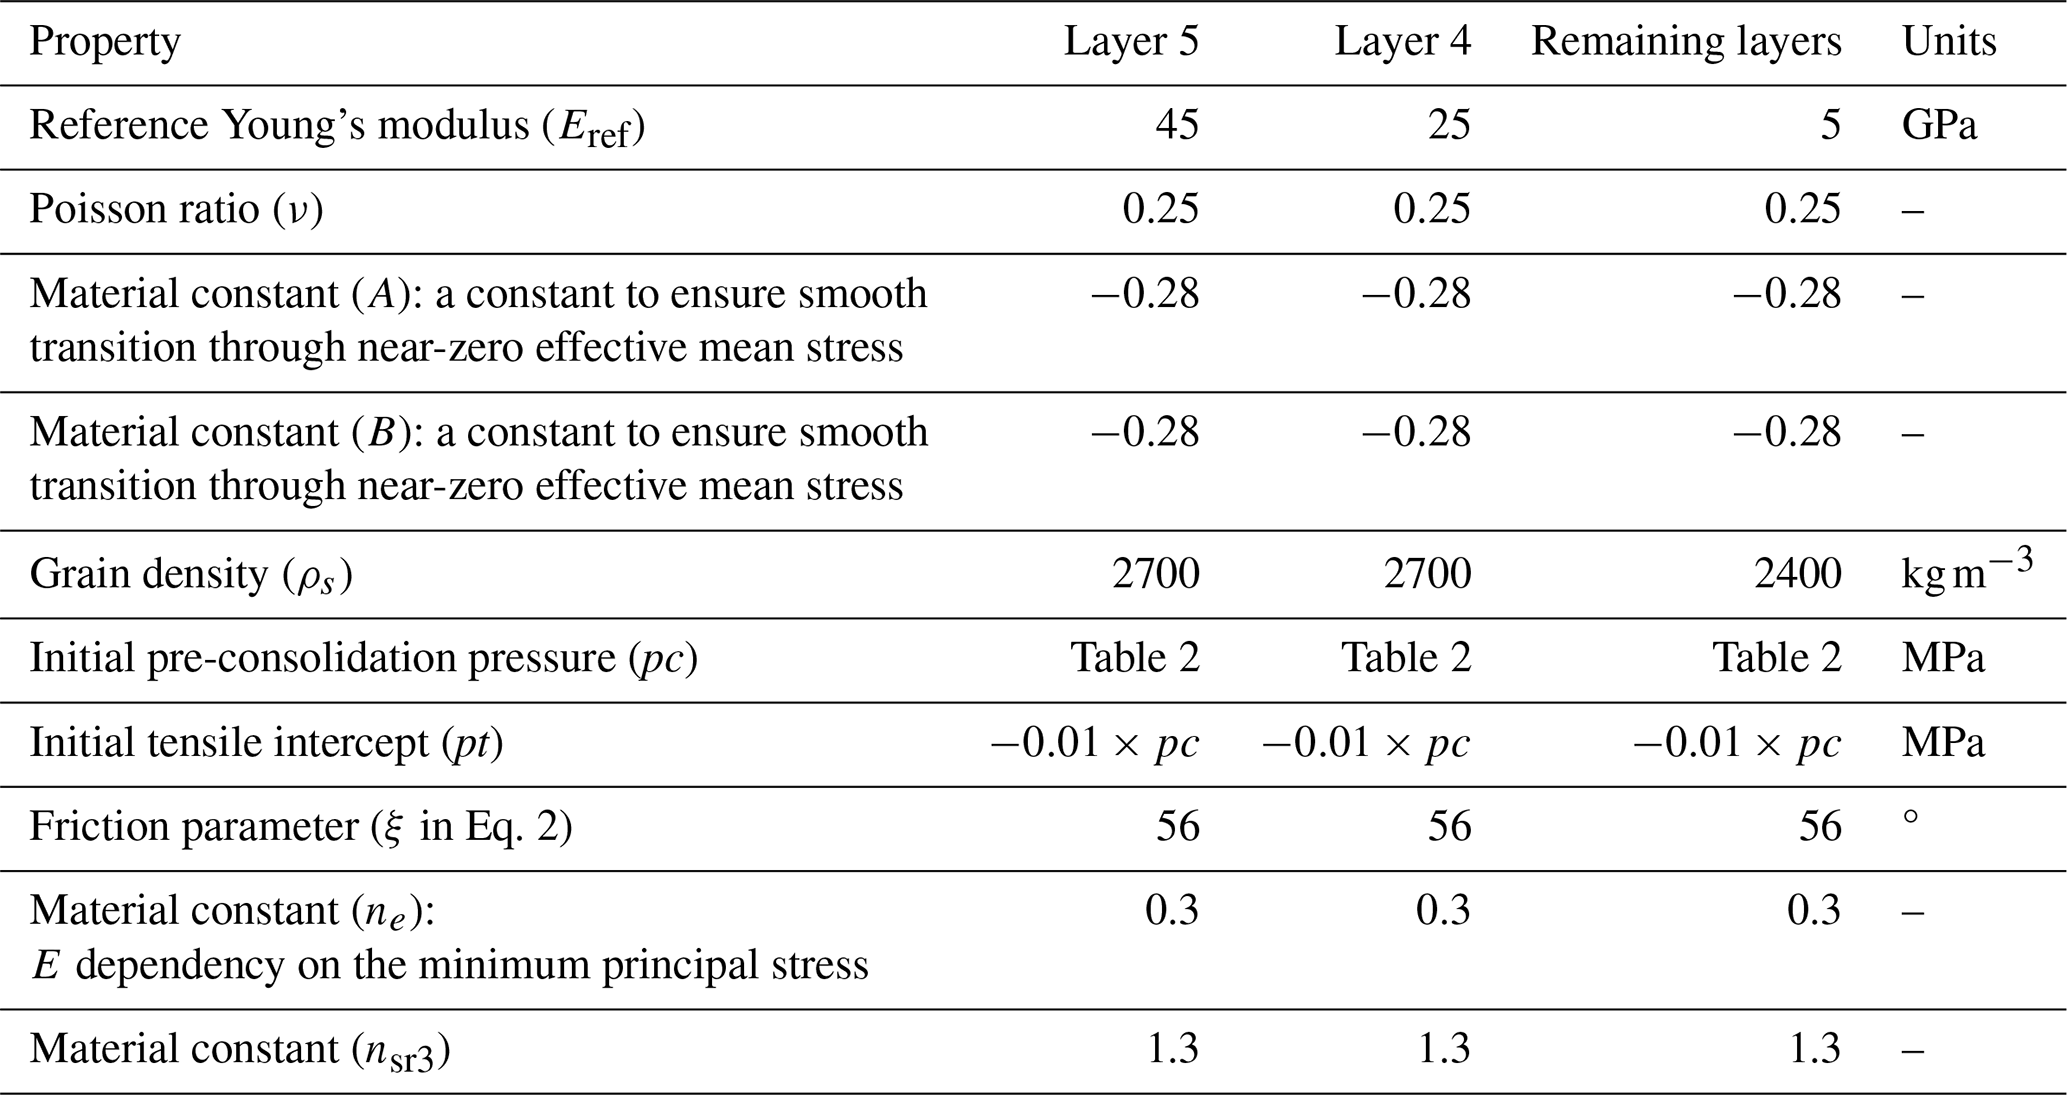
The deformation inside the yield surface follows an elastic behavior, which is dependent on Young's modulus and Poisson's ratio (ν, constant in this study), and the following equation is utilized to characterize this deformation:
where E, Eref, σ3, A, B, and ne show Young's modulus, the reference Young's modulus, the minimum principal stress, the first material constant, the second material constant, and the shape parameter, respectively.
In addition, we assign a constant grain density ρs to each layer, which constrains vertical stress evolution. Table 1 summarizes all constant material properties and the values used in each layer. More details on material properties are provided in Sect. S1 in the Supplement.
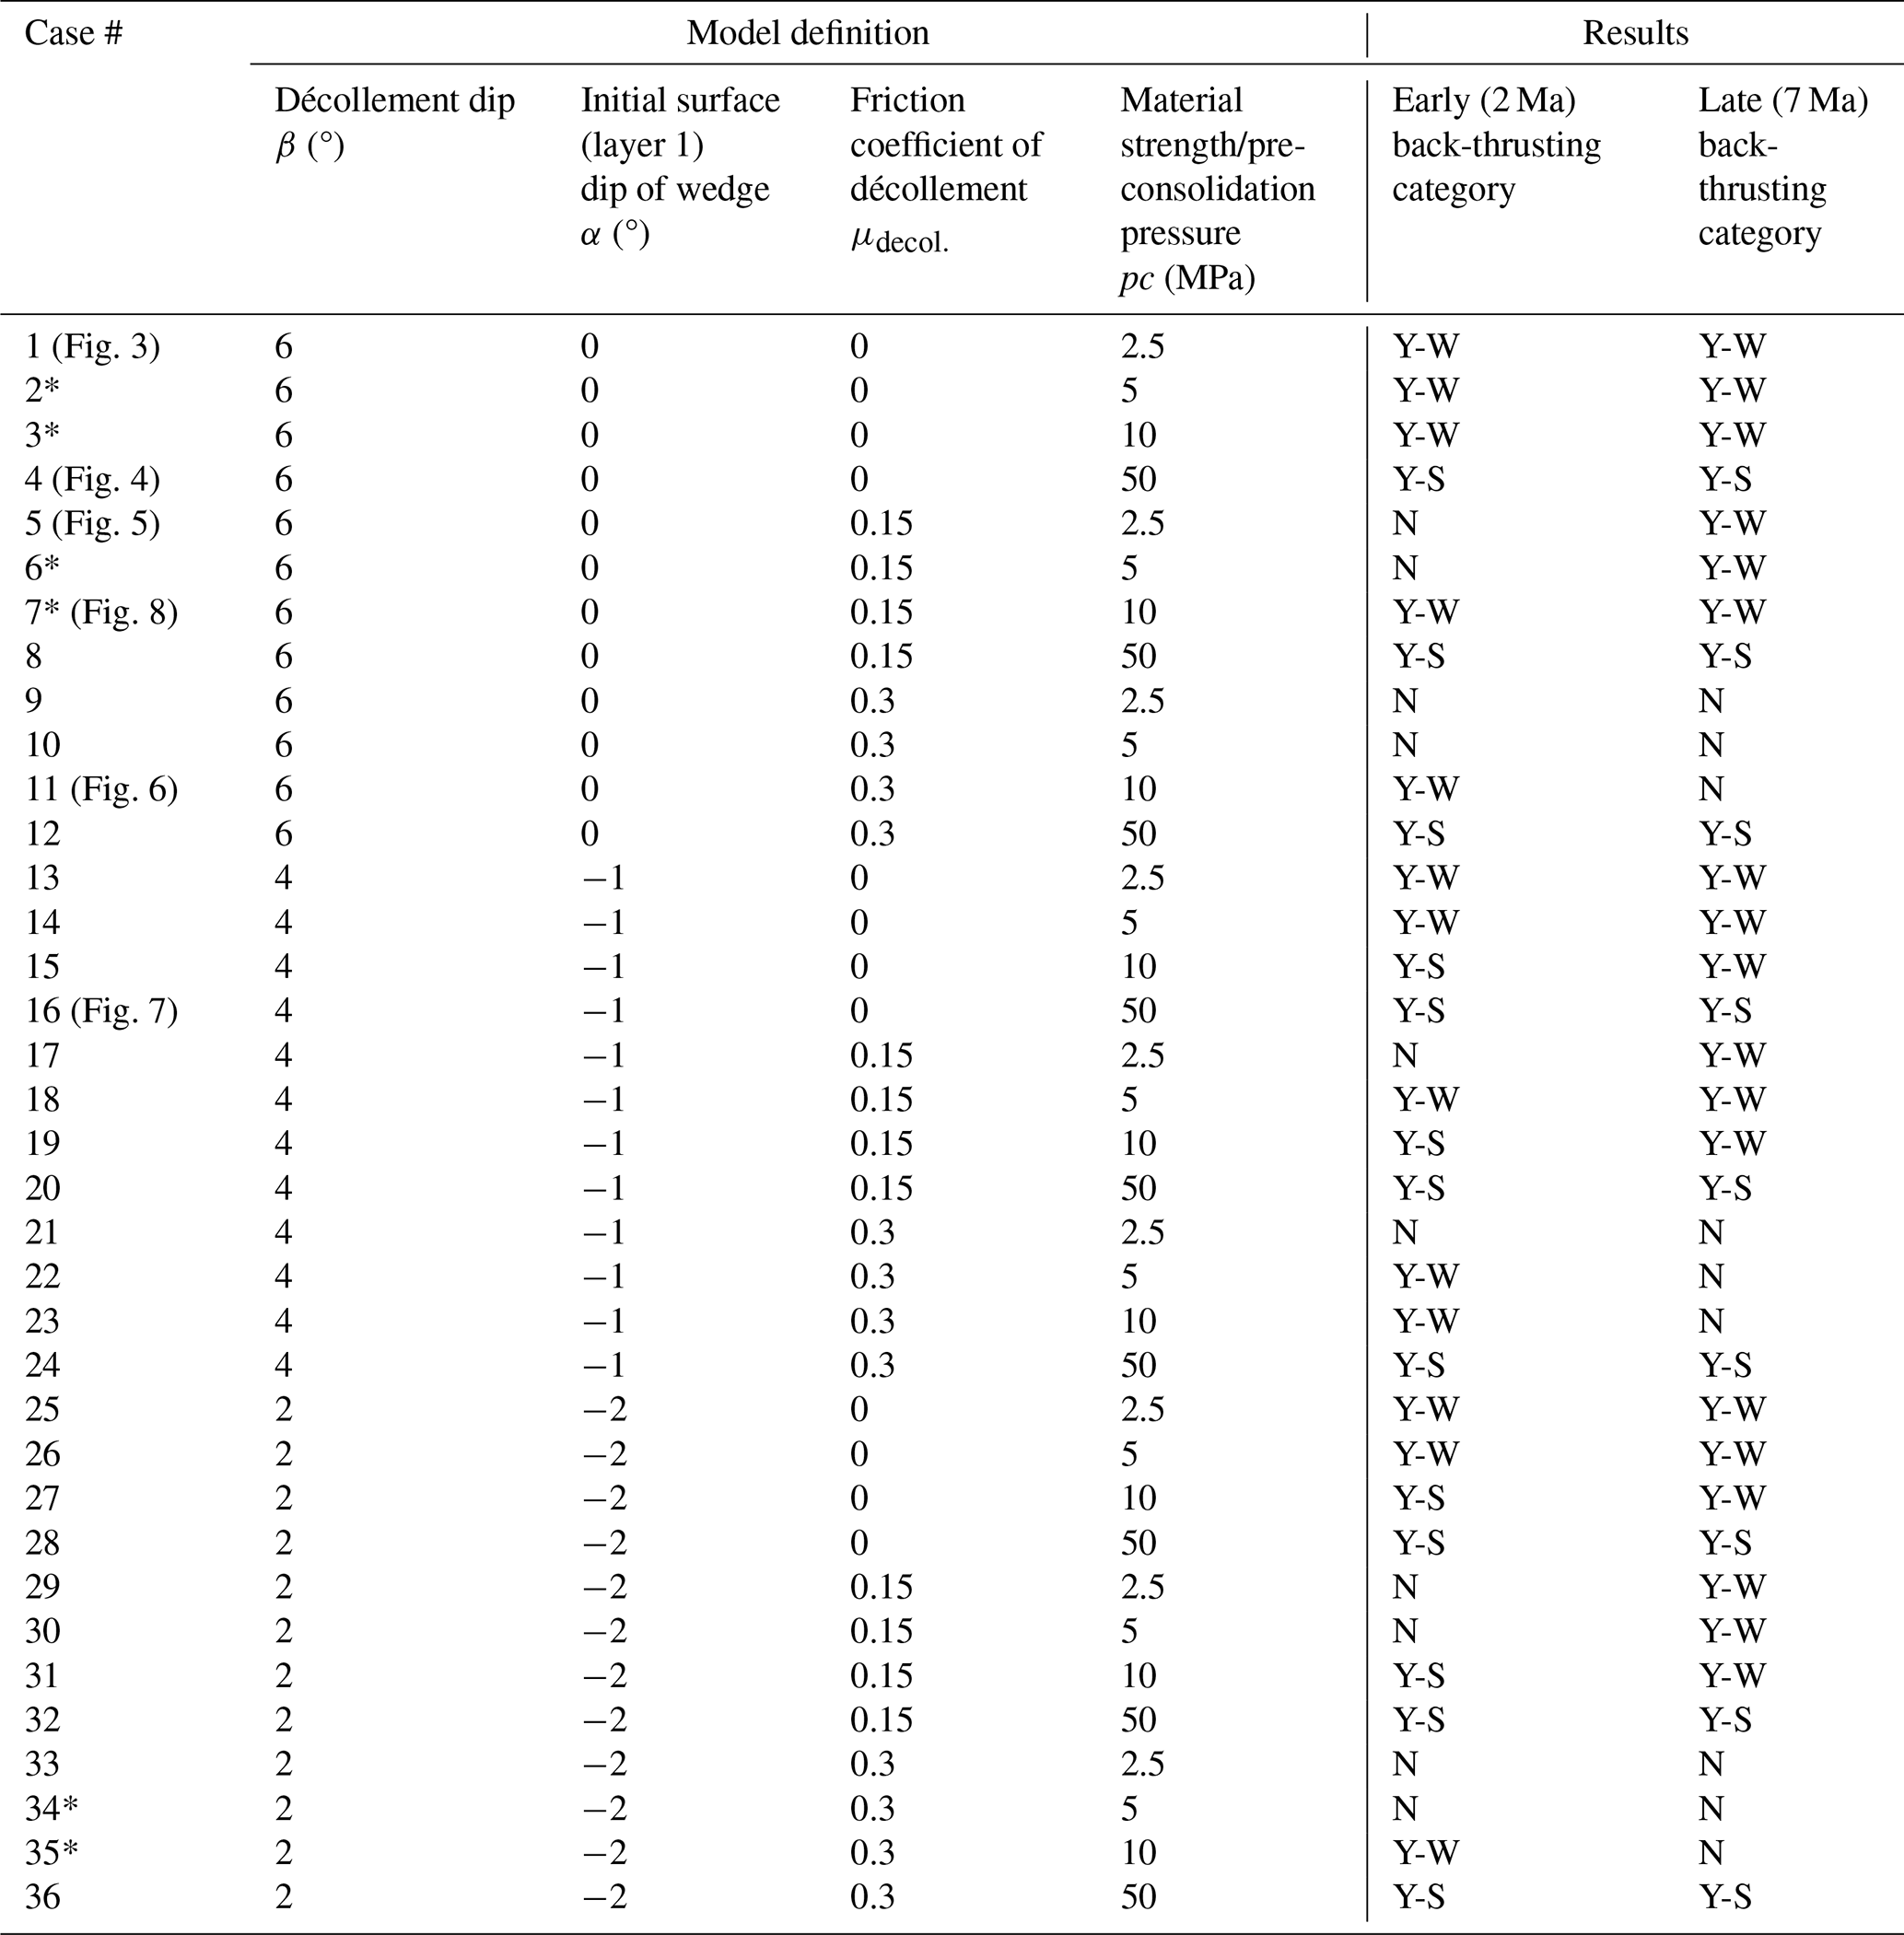
2.4 Sensitivity analysis cases
We investigate the impact of material strength, décollement dip angle, and décollement friction on back-thrust development in early (after 2 Ma) and late (after 7 Ma) deformation stages. We vary the initial pre-consolidation pressure pc between 2.5 and 50 MPa and the initial tensile intercept pt as a function of pc, with pt = pc as a proxy for material strength (higher pc = higher material strength). The friction coefficient of the décollement (μdecol. on the red line to the right of X in Fig. 1) is varied between 0 and 0.3. The taper angles (β= dip of décollement; α= initial dip of surface layer 1; cf. Fig. 1) are varied between 2 and 6° and between 0 and −2°, respectively. In total, the variations in the described parameters result in 36 models; however, 6 models are also run with a controlled displacement rate across the décollement coupled to the lateral displacement rate. Table 2 summarizes all model scenarios.
We then categorize the simulation results after 2 and 7 Ma into the formation of no/negligible (N, rank = 1), weak (Y-W, rank = 2), or strong back-thrusting (Y-S, rank = 3). To do so, maximum effective plastic strain (the plastic component of the rate of deformation tensor) in the back-thrust is used as the criterion for these categories. Maximum effective plastic values of 0.1 and 0.5 are used for boundaries between N, Y-W, and Y-S at early times (2 Ma), while values of 0.5 and 1 are used for these boundaries at late times (7 Ma). A Spearman rank correlation is then performed to assess the impact of the varied input parameters: décollement dip, décollement friction coefficient, and pre-consolidation pressure (material strength). Note that we do not assess the impact of the initial surface angle because we coupled it to the décollement dip (cf. Table 2). To perform the rank correlation, we also rank the input parameters décollement dip, décollement friction coefficient, and pre-consolidation pressure (material strength) in ascending order (e.g., a pre-consolidation pressure of 2.5 MPa becomes rank 1, while a pre-consolidation pressure of 50 MPa becomes rank 4; cf. Table 2) and then calculate Pearson's coefficient of correlation between the back-thrusting ranks and the ranks of the varied input parameters.
The results of all simulation cases in Table 2, along with the cases involving constant bottom boundary displacement, are analyzed at three time steps: 2, 4, and 7 Ma. Figures of these time steps showing the distribution of plastic strain, horizontal-to-vertical stress ratio , maximum shear stress–mean effective stress ratio , and porosity n for all modeled cases are provided in Sect. S2 in the Supplement. End-member cases are specifically selected for detailed examination.
Table 2Input parameters and results of the sensitivity analysis. In cases depicted with a star (*), additional simulations are conducted where the displacement along the décollement is coupled to the lateral displacement rate, which we apply at the right-hand side of the models. The notations Y-S, Y-W, and N represent the development of strong, weak, and no/negligible back-thrusts, respectively.
3.1 Material strength (pre-consolidation pressure) pc
Figure 3 illustrates the progressive development of plastic strain and the final values of and for Case #1 (, and pc=2.5 MPa), which represents a high décollement dip angle, a low décollement friction coefficient, and low material strength (Table 2).
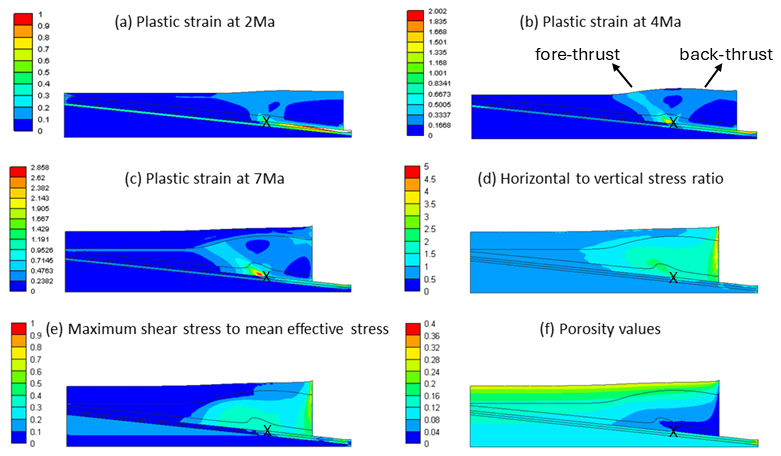
Figure 3Results of Case #1 (, and pc=2.5 MPa). (a–c) Progressive development of plastic strain at 2, 4, and 7 Ma, respectively. (d–f) Distribution of horizontal-to-vertical stress ratio , maximum shear stress–mean effective stress ratio , and porosity n at 7 Ma. The black cross shows the initial location of the discontinuity point over the décollement.
In Case #1, due to the assumed zero-friction coefficient along the décollement, fault initiation occurs from the discontinuity point, and, up to a certain point, overburden layers slide easily over the décollement. At 2 Ma (Fig. 3a), deformation is predominantly diffusive, resulting in a less efficient fore-thrust (it does not reach to the surface). Additional displacement up to 4 Ma (Fig. 3b) results in the development of a strong fore-thrust that reaches the surface, accompanied by a weak conjugated back-thrust. From 5 to 7 Ma, simultaneous sedimentation is implemented with displacement. The developed fore-thrust and back-thrust do not extend through the later sedimented materials (Fig. 3c). An elevated ratio is observed near the discontinuity point and areas close to the displacing boundary (Fig. 3e), while (Fig. 3d) reveals the dominance of horizontal stress in the wedge area. Since porosity is controlled by mean stress and deviatoric stress in critical state soil mechanics, and materials in Case #1 have a low pre-consolidation pressure (weak material), these areas show a higher porosity loss compared to their counterparts at the same depth in the foreland (Fig. 3f). Additionally, it should be noted that weak material and a low basal friction coefficient in this scenario result in a low final dip of the wedge surface.
From Case #1 to Case #4, the initial geometry and friction coefficients on the décollement remain constant, while the pre-consolidation pressure increases from 2.5 MPa in Case #1 to 5, 10, and 50 MPa in cases #2, #3, and #4, respectively (materials become stronger from a mechanical point of view). In all these cases, due to the zero-friction coefficient along the décollement, overburden layers slide over the décollement, and thrusting initiates from the discontinuity point. With an increase in material strength, thrusts become more defined. Additionally, the increasing material strength leads to a higher final dip angle of the wedge surface. Moreover, the area with higher increases in size. Comparing Case #1 (, , and pc=2.5 MPa) to Case #2 (, , and pc=5 MPa) reveals a more developed back-thrust in the latter. This trend continues, and Case #3 (, , and pc=10 MPa) shows a fully developed back-thrust and a weak second back-thrust at a later time. Figure 4 illustrates the results of Case #4 (, , and pc=50 MPa), where strong back-thrusts developed.
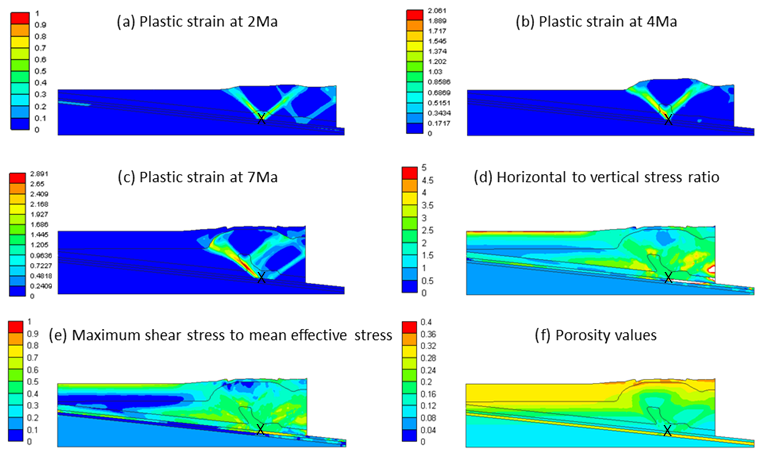
Figure 4Progressive development of plastic strain and the final values of the σxx/σzz , , and n for Case #4 (, , and pc=50 MPa). The black cross shows the initial location of the discontinuity point over the décollement.
Case #4 (, , and pc=50 MPa) exhibits two sets of conjugated fore-thrust and back-thrust development in early times (Fig. 4a–c). Similar behavior is observed in corresponding cases with different dip angles (Case #16:, , and pc=50 MPa; Case #18: , , and pc=5 MPa). Also, cases #11 (, , and pc=10 MPa), #23 (, , and pc=10 MPa), and #35 (, , and pc=10 MPa) show a similar deformation with weak thrusts, and these are corresponding cases that differ in dip angles as well. As the deformation progresses, one set of these conjugated thrusts develops further, and the other disappears. In late times, two back-thrusts and one fore-thrust are fully developed, and there is a weak back-thrust. High values of expand in larger areas of the model (Fig. 4e). The is higher than in Case #1 (β=6°, α=0°, , and pc=2.5 MPa), with lower pre-consolidation pressure (Fig. 4d). In this case, layers resist porosity loss, and porosity remains high in the thrusted area. Areas highly affected by horizontal stress are evident in Fig. 4f.
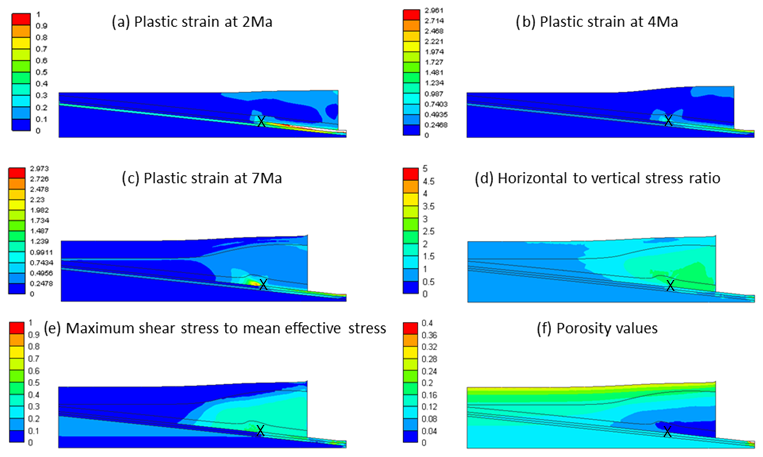
Figure 5Progressive development of plastic strain and the final values of the σxx/σzz, , and n for Case #5 (, and pc=2.5 MPa). The black cross shows the initial location of the discontinuity point over the décollement.
3.2 Friction coefficient of the décollement μdecol.
Cases #5–8 (β=6°, α=0°, are similar to cases #1–4 (, except for an increased friction coefficient of the décollement . The simulation results for Case #5 (, and pc=2.5 MPa) from this series are depicted in Fig. 5a–f. In the early stages, a weak thrust development near the displacing boundary condition is evident, accompanied by the initiation of a fore-thrust at the discontinuity (Fig. 5a–c). It should be noted that, in this case, friction along the décollement imposes restrictions on free sliding, resulting in deformations near the displacing boundary condition. As time progresses, the initiation of a weak back-thrust becomes visible near the discontinuity, although it disappears in the late stages. During this period, deformation is primarily controlled by diffusive plastic strain (Fig. 5a–c). Notably, the forces required to achieve the same displacement as in Case #1 (, , and pc=2.5 MPa) are higher, leading to increased (Fig. 5e). Porosity loss in areas unaffected by thrusting is more pronounced compared to Case #1 (Fig. 5f). This pattern is consistently observed across corresponding cases #5–8 and #1–4, with thrusts developed in cases #5–8 generally exhibiting weaker characteristics. The end-member of this series (Case #8: , and pc=50 MPa) exhibits the presence of two fully developed back-thrusts. In contrast, Case #4 (, and pc=50 MPa) displays two fully-developed back-thrusts alongside a weaker back-thrust.
In cases #9–12 (, the friction coefficient of the décollement is further increased to . Within this series, deformation is not restricted to the vicinity of the discontinuity point; also, a significant portion of it occurs near the displacing boundary (Fig. 6a–c as an example for Case #11: , and pc=10 MPa). This results in a steeper slope of deformation on the surface of the top layer. In contrast to the earlier series (cases #1–4: ; cases #5–8: , where fore-thrusting near the discontinuity point led to elevated features dipping towards the top in the direction of fore-thrusting (see Figs. 3d–5d), cases #9–12 ( exhibit horizontally aligned stress plumes. These cases demonstrate higher porosity loss in weak materials near the displacing boundary. Thrusting in this series is observed to be weaker compared to the previous two sets, and the likelihood of back-thrusting decreases. For instance, Case #10 (, and pc=5 MPa) displays two early-stage fore-thrusts, while Case #2 (, and pc=5 MPa) presents a set of conjugated fore-thrusts and back-thrusts. Figure 6 illustrates Case #11 (, and pc=10 MPa) from this series, clearly demonstrating the influence of the friction coefficient on deformation development near the displacing boundary. It exhibits one fully developed fore-thrust and another in the early stage of development. In contrast, Case #3 (, and pc=10 MPa) shows a fully developed back-thrust and a weak thrust at a later time.
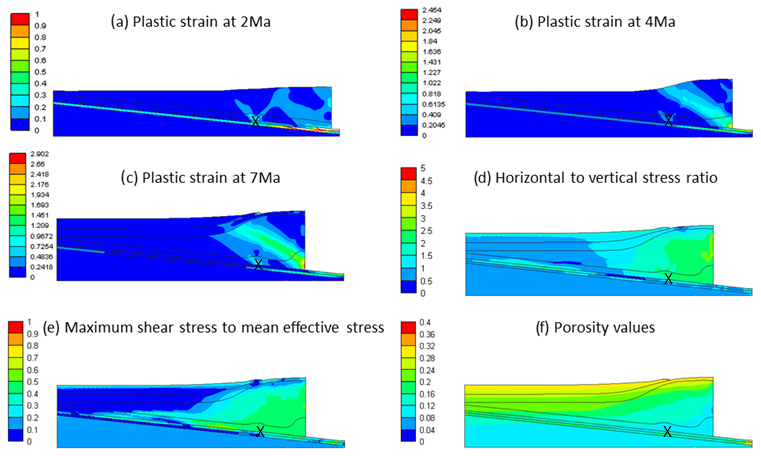
Figure 6Progressive development of plastic strain and the final values of , , and n for Case #11 (, and pc=10 MPa). The black cross shows the initial location of the discontinuity point over the décollement.
3.3 Décollement dip angle β
Cases #13–24 ( were designed to examine the influence of décollement dip angles (β) on deformation. When comparing the deformation results of cases #13–16 () with their corresponding counterparts in cases #1–4 (), minimal differences are observed in cases with weak material (#1–3 and #13–15). However, significant differences emerge between cases #4 (, and pc=50 MPa) and #16 (, and pc=50 MPa), with strong material. Figure 7 illustrates the deformation progression in Case #16 (, and pc=50 MPa). In comparison to Case #4 (, and pc=50 MPa), it shows three fully developed back-thrusts and a set of conjugated fore-thrusts and back-thrusts at a later time (Fig. 7c). Additionally, is higher near the discontinuity point. Similar behavior is noted for cases #17–24 ( when compared to their corresponding cases, #5–12 (). This implies that cases with weak material exhibit negligible differences, while end-members with strong material (Case #20: , and pc=50 MPa; Case #24: , and pc=50 MPa) display considerable differences in comparison to cases #8 (, and pc=50 MPa) and #12 (, and pc=50 MPa). Notably, back-thrusting in cases #20 (, and pc=50 MPa) and #24 (, and pc=50 MPa) is stronger.
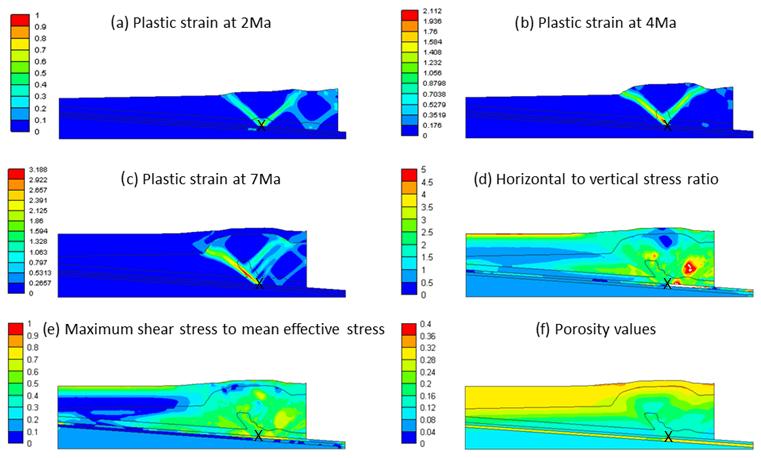
Figure 7Progressive development of plastic strain and the final values the σxx/σzz, , and n for Case #16 (, and pc=50 MPa). The black cross shows the initial location of the discontinuity point over the décollement.
Cases #25–36 () were designed to explore additional dip angle scenarios, wherein the décollement dip angle becomes even smoother and the dip angle of the top surface becomes even deeper. Similarly to cases #13–24 (, differences between this series and cases #1–12 ( are negligible for weak materials, while, for cases with strong material, differences are considerable. Case #28 (, and pc=50 MPa), for instance, reveals one fully developed fore-thrust with two back-thrusts intersecting it. Additionally, there is a set of conjugated fore-thrusts and back-thrusts within the distance between the displacing boundary and the discontinuity point. Cases #8 (, and pc=50 MPa) and #32 (, and pc=50 MPa) exhibit smaller differences. Notably, Case #36 (, and pc=50 MPa) illustrates the thrusts observed in Case #12 (, and pc=50 MPa) at a later time, along with a fore-thrust rooted from the displacing boundary.
3.4 Displacing boundary condition
Up to this point, the displacing boundary condition has been exclusively assigned to the right boundary of the overburden layers. To examine the impact of these boundary conditions on deformation development, certain cases (indicated with * in the Table 2) assume that the bottom of the overburden layers on the right section of the discontinuity point moves at the same displacement rate as the side wall. The results for these cases are presented in Sect. S2 in the Supplement, and Case #7* (, and pc=10 MPa) is chosen for discussion as a representative example (see Fig. 8). In these cases, a more pronounced back-thrust is observed compared to the developed fore-thrusts. Additionally, the dip of the highly deformed section in layer 2 is oriented towards the top and right, in contrast to the previous boundary condition where it dipped towards the left and top. Furthermore, areas characterized by high and propagate farther into the foreland, occupying larger areas. Despite the same material properties, porosity losses are comparable in both situations.
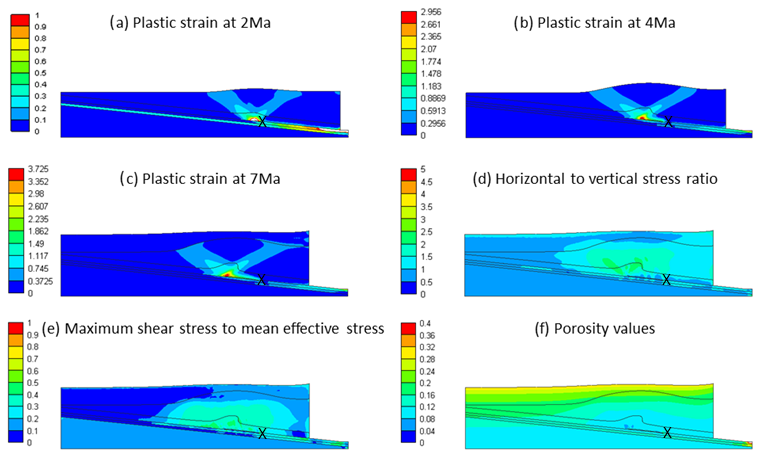
Figure 8Progressive development of plastic strain and the final values of , , and n for Case #7* (, and pc=10 MPa). The black cross shows the initial location of the discontinuity point over the décollement.
4.1 Impact of material strength
Starting with Case #1 (, and pc=2.5 MPa), which involves weak material and a low basal friction coefficient, the resulting low dip of the wedge at the surface aligns with critical taper theory. The progressive development of deformation in Case #1 (Fig. 3) reveals that thrusting cannot penetrate the late-sedimented material. This limitation can be explained by the fact that all late-sedimented materials can only undergo under-consolidation processes (or follow normal consolidation), restricting their deformation to a ductile manner. In this context and based on the SR3 model, thrusting in these sediments is plausible if other compaction mechanisms than the mechanical one contribute. These compaction mechanisms enhance the strength of the newly deposited material and bring them to the over-consolidated condition (Obradors-Prats et al., 2017).
Advancing from Case #1 (, and pc=2.5 MPa) to Case #4 (, and pc=50 MPa), the pre-consolidation pressure increases. As reported by Obradors-Prats et al. (2017), in a highly consolidated state, the likelihood of the stress path intersecting the yield curve on the shear section is higher. This intersection is crucial for modeling brittle deformation, a form of plastic deformation predictable with Cam clay-type models. Such models result in fast-softening materials, eventuating to localization behavior characterized by steep displacement gradients in thin zones of strong plastic strain. Furthermore, in accordance with critical taper theory, the increasing material strength results in a higher dip angle of the surface layer. The increase in the brings the system closer to the critical state. Consequently, with the rise in material strength, the areas of material in a critical state increase in size (refer to the figures in the Supplement). For cases #1–4, where the friction coefficient over the décollement is zero, and in cases with lower displacement resistance at the basal layer/overburden layer interface, a minor rise in shear stress causes deformation at areas close to the discontinuity. Therefore, deformation can happen at distances far away from the displacing boundary. Conversely, in cases with higher resistance to displacement, brittle deformation tends to develop near the moving side walls.
4.2 Impact of the décollement friction coefficient
As the friction coefficient increases in cases #5–8 ( and #9–12 ( in comparison to cases #1–4 (, the dip angle of the surface of the top layer increases, which is a phenomenon previously observed in a study by Gao et al. (2018). The results of cases #1–12 ( align with previous studies indicating that low basal friction coefficient facilitates back-thrusting, while high basal friction coefficient favors fore-thrusts (Davis and Engelder, 1985; Seely, 1977). The models proposed by von Hagke et al. (2024) also support this notion. Von Hagke et al. (2024) noted that low basal friction coefficient alone is insufficient to systematically describe back-thrusting. Additionally, they highlighted that a very low basal dip (less than 0.5°) is necessary for back-thrust dominance. Strong décollements (high basal friction coefficients), on the other hand, develop increased taper angles, changing the stress field in a way that fore-thrusting becomes more favorable. This observation aligns with sand-box experiments in which highly back-thrusted systems developed at a low basal angle with zero or low basal friction coefficients (Gutscher et al., 2001). However, other researchers argue that, for low-basal-angle décollement, fore-thrusts may dominate (Cotton and Koyi, 2000; MacKay, 1995). The work of fault growth is examined through the experimental and simulation tools to shed light on this issue (Herbert et al., 2015; McBeck et al., 2017). Results demonstrated the importance of the height of the sedimented layers and basal features, with fore-thrust slip influencing back-thrust development. The parametric study by von Hagke et al. (2024) showed that in flat, low-basal-angle settings, both back-thrusting and fore-thrusting are possible, and the basal friction coefficient controls the dominance of one over the other. They suggest that, for the low-friction basal, back-thrusting requires lower work than fore-thrusting. Therefore, the chance of back-thrust dominancy is higher in such systems.
The discovery of back-thrust dominance in systems with a weak décollement and a low basal dip is intriguing. Previously, it was suggested that the likelihood of back-thrusting is higher in high-basal-dip settings. Researchers claimed that, in such systems, the direction of the maximum stress component and the basal décollement are nearly parallel. The back-thrust dip is gentle and, therefore, develops more easily (Cubas et al., 2016; MacKay, 1995). It should be noted that, while these studies examine back-thrust dominance, the current study aims to identify the conditions that facilitate back-thrust development. Additionally, there is a difference in the displacing boundary conditions between the current study and that of von Hagke et al. (2024). Von Hagke et al. (2024) and other researchers (such as Obradors-Prats et al., 2017) assumed that the bottom of the top layers moves at the same displacement rate as the side wall, whereas the current study primarily focuses on side wall displacement. To investigate the impact of displacing boundary conditions, six additional simulations were conducted with a moving bottom boundary of the overburden layers. With these considerations, back-thrusting was observed at a dip angle of 6°; however, a sensitivity analysis was not conducted to determine the end-member dip angle.
4.3 Impact of the décollement dip angle
Upon analysis of the impact of the taper dip angle, while cases #1–3 ( and #13–15 ( exhibit similar deformation patterns, cases #4 (, and pc=50 MPa) and #16 (, and pc=50 MPa) display a distinct behavior. In these two cases, the material strength is high (50 MPa), and it appears that the top layers slide as a single solid part over the décollement. Consequently, the decrease in the dip angle of the décollement in Case #16 (, and pc=50 MPa) facilitates easier sliding over the décollement, with all restrictions concentrating on the discontinuity point, resulting in more pronounced deformation for this case. It's noteworthy that the decrease in the dip angle of the décollement favors back-thrusting (as suggested by von Hagke et al., 2024), while the dip angle of the top surface restricts back-thrust development (as previously demonstrated, top surface erosion and flattening facilitate back-thrusting conditions; McClay, 2011). Similarly to the comparison of cases #4 (, and pc=50 MPa) and #12 (, and pc=50 MPa), cases #20 (, and pc=50 MPa) and #24 (, and pc=50 MPa) exhibit stronger back-thrusting in comparison to cases #8 (, and pc=50 MPa) and #12 (, and pc=50 MPa), respectively. While weak materials are not highly sensitive to the dip angle, the observations thus far lead to the conclusion that decreasing the dip angle of the décollement contributes to facilitating back-thrusting.
In the next step, the dip angle of the décollement is decreased (β from 4 to 2°), while the dip of the surface is simultaneously increased (α from −1 to −2°), and the simulations are run as in cases #25–36 (. Examination of the results indicates that, while the decreasing décollement dip angle helps to enhance back-thrusting, the surface slope (top surface angle of layer 1) neutralizes some effects, resulting in weaker back-thrusting compared to the corresponding cases in cases #13–24 (). With the consideration of the higher surface dip, the system's activity in the hinterland, aimed at bringing the system to the critical taper state, decreases, leading to a decrease in the chance of back-thrusting.
In this research, the sedimentation and erosion processes are not examined in detail. However, McClay (2011) highlighted that a model excluding syn-contractional sedimentation or erosion demonstrated a general forward-breaking sequence with simultaneous thrust activity. The inclusion of syn-contractional sedimentation resulted in more extensive wedges characterized by reduced main forward-converging thrusts and reduced thrust activities in the foreland. Conversely, syn-contractional erosion impeded the forward propagation of the deformation front, decreased the quantity of main thrusts, and heightened thrust activities in the hinterland. When combined, the effects of syn-contractional sedimentation and erosion were found to be complementary. In the case of an eroded wedge approaching a subcritical taper state, shortening induces internal deformation, which results in a higher surface slope. This adjustment enables the wedge to regain the critical state. The internal structural deformation within the thrust wedge contributes to an increased wedge thickness in the hinterland and may furthermore favor processes such as normal faulting in the inner wedge, back-thrust development, thrust reactivation, out-of-sequence thrust development, or basal accretion through duplexing at the base of the wedge.
4.4 Sensitivity analysis
4.4.1 Impact of input décollement dip, décollement friction, and material strength on back-thrusting
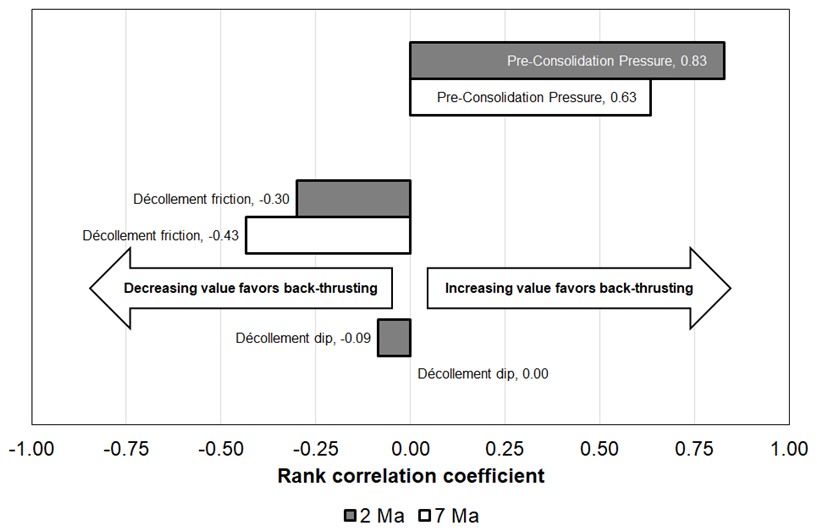
The rank correlation analysis shows that pre-consolidation pressure has the largest impact on back-thrust development, both in early (after 2 Ma) and late (after 7 Ma) years (Fig. 9). Thereby, the likelihood of back-thrusting increases with increasing pre-consolidation pressure, which we use as a proxy of material strength. Décollement friction coefficient is inversely related to back-thrust development. A weaker décollement increases the likelihood of back-thrust development, and this effect seems to be slightly more important during the late stage of our simulations. Décollement dip is also inversely related to back-thrust development but only appears to have a minor effect, which, in our simulations, only has an influence during the early stages of deformation.
In summary, back-thrusting occurs if the contrast between the bulk strength and décollement strength is high (taper strength ≫ décollement strength). In other words, back-thrusting occurs if sliding of the taper along the décollement is easy but if the material of the taper is strong and pushes back. Accordingly, fore-thrusting is favored if sliding the taper along the décollement requires more work than shearing the taper (the décollement detaches to a new décollement, resulting in a fore-thrust).
4.4.2 Geological processes influencing décollement dip, décollement friction, and material strength
Décollement dip angle probably is mostly controlled by pre-existing basement topography and the material strength of the footwall. In the course of ongoing deformation, the décollement dip probably loses its relevance to back-thrusting because, once the sliding of the taper is initiated, the rate of sliding is likely only a function of the frictional resistance along the décollement.
Décollement strength decreases if the resistance to slide along the décollement decreases, which is achieved if the décollement's friction coefficient and/or dip angle decrease. Factors controlling the décollement's friction coefficient are mainly the presence of low-friction minerals, such as clay minerals or evaporites (anhydrite, salt), and of pore pressure and diagenesis (e.g., Lebinson et al., 2020).
In our simulation, taper strength increases with its material strength (in our simulations = pre-consolidation pressure), similarly to real-world analogs. Geological processes which result in an increase in material strength or pre-consolidation pressure are burial and subsequent uplift or exhumation deposition of additional sediments during the deformation, resulting in an increase in vertical (effective) stress and compaction and diagenesis, which can reduce porosity and again increase material strength.
4.4.3 Limitations of the sensitivity analysis
It should be noted that, due to the computational cost of large-strain geomechanical forward modeling, the tested input parameter combinations are limited in this study. In addition, we categorized back-thrusting severity based on the maximum effective plastic strain, but future studies could and probably should also include other measures, such as displacement along fore- and back-thrusts and the number of back-thrusts developed.
Also, the performed rank correlation analysis only examines the individual influence of each individual input parameter on back-thrust formation. However, a multivariate analysis was deliberately avoided because the applied parameter combinations are probably not sufficient to allow quantitative statements regarding the parameter dependencies on back-thrusting. The rank correlation results should therefore be understood as general trends regarding each input parameter's impact on back-thrusting and not as actual correlation coefficients.
The above-mentioned limitations point to a general lack of a standardized statistical approach to analyze modeling results of geodynamic modeling. Future studies should therefore aim at developing a standardized sensitivity analysis approach to allow comparability between different studies and modeling methodologies.
4.5 The role of boundary conditions in modeling back-thrust formation
Fore- and back-thrusts are elementary structural components of fold-and-thrust belts and accretionary wedges; their formation has been intensively analyzed using numerical simulation (Buiter et al., 2016), analogue modeling (Schreurs et al., 2006), and structural field analysis (Lebinson et al., 2020). However, the main research focus has often been on fore-thrust formation as the main mechanism of hanging-wall accommodation. Although back-thrusts are very common in fold-and-thrust belts, they apparently account much less for total shortening compared to fore-thrusts. Buiter et al. (2016) show that, in numerical simulations, back-thrust formation is often associated with either a pop-up structure (one fore-thrust vs. one back-thrust) or the stacking of fore-thrusts, where a back-thrust forms a steep antithetic ramp during stacking (fore-thrust ≫ back-thrust); the authors also explain the role of basal friction on back-thrust formation, where higher friction results in more fore-thrusts and vice versa (cf. Davis and Engelder, 1985), which is in good agreement with our results. This observation is supported by Maillot and Leroy (2003), who explain how the dip of the ramp, in combination with the friction coefficients of shear zones and back-thrusts, controls back-thrusting. Von Hagke et al. (2024) reached similar conclusions in their literature review, highlighting that critical wedge experiments commonly exhibit fore-thrusts, with less frequent documentation of back-thrusting. When back-thrusts are present, they tend to form conjugates to fore-thrusts (Ellis et al., 2004). Field examinations on the fold-and-thrust belt systems often show dominancy of fore-thrusts. Transitions from regions dominated by back-thrusts to those dominated by fore-thrusts can be observed in various geological settings, such as the European Alps (Ortner et al., 2023) or the Niger Delta (Higgins et al., 2009).
In real-world cases, the Cascadia fold-and-thrust belt (USA) could be an example of this category, where back-thrusts are the dominant form of deformation (Gutscher et al., 2001). To gain insights into the conditions leading to stronger back-thrusts than fore-thrusts, this study examines a different type of boundary condition, where the bottom boundary of the overburden layers moves at the same rate as the side boundary across the lower-friction décollement. In this scenario, the strongest developed thrust is the back-thrust. In this condition, deformations mainly occur near the discontinuity point. The dominancy of the back-thrust is visible in the deformation style, which is dipped toward the displacing side wall. However, in the previous cases with only side wall displacing, deformation is dipped in the same direction of the displacement. This variation in the dominancy of the back-thrusts or fore-thrusts and the shape of the deformation can be used as valuable insights for assigning the correct boundary condition. Additionally, discrepancies between previous studies can be clarified by examining the differences in their assigned boundary conditions.
A parameter that has been considered only to a minor degree in the modeling of back-thrust formation so far is the pre-consolidation pressure (i.e., material strength). Its effect on back-thrust formation apparently predominates other parameters, such as basal friction, material properties, or loading, which therefore stresses the need for a better understanding of its significance in geologic settings.
This study systematically investigates the results of 42 numerical simulations to changes in material properties, taper angle, friction coefficient, and boundary conditions, with a specific focus on back-thrust development. The results highlight the significance of material strength (as the most important factor) and emphasize the hindering impact of increased friction along the décollement (as the second factor). The taper angles also play a role, with reduced décollement dip angles facilitating back-thrusting, while surface dip angles tend to impede this behavior. The research categorizes scenarios indicating the presence or absence of back-thrusts based on the sensitivity parameters mentioned. The occurrence of back-thrusting depends on the contrast between the taper strength and décollement strength. If sliding the taper along the décollement is easy but the material of the taper is strong and pushes back, back-thrusting is likely to occur. However, if sliding the taper along the décollement requires more work than shearing the taper, the décollement detaches to a new décollement, resulting in fore-thrust formation. A constant displacement rate along the décollement as an additional boundary condition increases this effect and therefore yields more pronounced back-thrust development. Key findings of our research not only confirm previous studies, with special emphasis on the influence of material strength and basal friction in general. Our study also provides new evidence and practical rule-of-thumb guidelines to explain and understand the formation of back-thrusts in the frontal part of fold-and-thrust belt systems, and it points at additional studies, which address the effect of pore pressure, diagenesis, and sedimentation on the tectonic style of compressive settings.
The developed model for Case #1 is provided in the Supplement. The other models can be reproduced by changing parameter values in this model.
The supplement related to this article is available online at https://doi.org/10.5194/se-16-1041-2025-supplement.
Conceptualization: SM, FD, MCD. Data curation: SM. Formal analysis: SM, FD, MCD. Funding acquisition: MCD. Investigation: SM, FD, MCD. Methodology: SM. Project administration: MCD. Resources: MCD. Software: SM. Supervision: SM, FD, MCD. Validation: SM. Visualization: SM. Writing (original draft preparation): SM. Writing (review and editing): SM, FD, MCD.
The contact author has declared that none of the authors has any competing interests.
Publisher’s note: Copernicus Publications remains neutral with regard to jurisdictional claims made in the text, published maps, institutional affiliations, or any other geographical representation in this paper. While Copernicus Publications makes every effort to include appropriate place names, the final responsibility lies with the authors.
This research has been supported by the Bayerisches Staatsministerium für Wissenschaft, Forschung und Kunst (grant no. Geothermal Alliance Bavaria (GAB-2)).
This paper was edited by Susanne Buiter and reviewed by Pauline Souloumiac and David Hindle.
The authors would like thank to the Rockfield team (especially William Ferguson) for providing the Elfen software package and technical discussions. The authors sincerely thank the editor (Susanne Buiter) and reviewers (David Hindle and Pauline Souloumiac) for taking the time to review our paper, particularly David Hindle for his useful help regarding the sensitivity analysis, and providing constructive feedback to improve our paper.
Adwan, A., Maillot, B., Souloumiac, P., Barnes, C., Nussbaum, C., Rahn, M., and Van Stiphout, T.: Understanding the stress field at the lateral termination of a thrust fold using generic geomechanical models and clustering methods, Solid Earth, 15, 1445–1463, https://doi.org/10.5194/se-15-1445-2024, 2024.
Albertz, M. and Lingrey, S.: Critical state finite element models of contractional fault-related folding: Part 1. Structural analysis, Tectonophysics, 576, 133–149, https://doi.org/10.1016/j.tecto.2012.05.015, 2012.
Albertz, M. and Sanz, P. F.: Critical state finite element models of contractional fault-related folding: Part 2. Mechanical analysis, Tectonophysics, 576, 150–170, https://doi.org/10.1016/j.tecto.2012.06.016, 2012.
Bilotti, F. and Shaw, J. H.: Deep-water Niger Delta fold and thrust belt modeled as a critical-taper wedge: The influence of elevated basal fluid pressure on structural styles, Aapg. Bull., 89, 1475–1491, https://doi.org/10.1306/06130505002, 2005.
Bonini, M.: Deformation patterns and structural vergence in brittle-ductile thrust wedges: An additional analogue modelling perspective, J. Struct. Geol., 29, 141–158, https://doi.org/10.1016/j.jsg.2006.06.012, 2007.
Brisson, S., Wellmann, F., Chudalla, N., von Harten, J., and von Hagke, C.: Estimating uncertainties in 3-D models of complex fold-and-thrust belts: A case study of the Eastern Alps triangle zone, Applied Computing and Geosciences, 18, 100115, https://doi.org/10.1016/j.acags.2023.100115, 2023.
Buiter, S. J. H., Schreurs, G., Albertz, M., Gerya, T. V., Kaus, B., Landry, W., le Pourhiet, L., Mishin, Y., Egholm, D. L., Cooke, M., Maillot, B., Thieulot, C., Crook, T., May, D., Souloumiac, P., and Beaumont, C.: Benchmarking numerical models of brittle thrust wedges, J. Struct. Geol., 92, 140–177, https://doi.org/10.1016/j.jsg.2016.03.003, 2016.
Cotton, J. T. and Koyi, H. A.: Modeling of thrust fronts above ductile and frictional detachments: Application to structures in the Salt Range and Potwar Plateau, Pakistan, Geol. Soc. Am. Bull., 112, 351–363, https://doi.org/10.1130/0016-7606(2000)112<0351:Motfad>2.3.Co;2, 2000.
Couzens-Schultz, B. A., Vendeville, B. C., and Wiltschko, D. V.: Duplex style and triangle zone formation: insights from physical modeling, J. Struct. Geol., 25, 1623–1644, https://doi.org/10.1016/S0191-8141(03)00004-X, 2003.
Crook, A. J. L., Willson, S. M., Yu, J. G., and Owen, D. R. J.: Predictive modelling of structure evolution in sandbox experiments, J. Struct. Geol., 28, 729–744, https://doi.org/10.1016/j.jsg.2006.02.002, 2006.
Cruz, L., Malinski, J., Wilson, A., Take, W. A., and Hilley, G.: Erosional control of the kinematics and geometry of fold-and-thrust belts imaged in a physical and numerical sandbox, J. Geophys. Res.-Sol. Ea., 115, B09404, https://doi.org/10.1029/2010jb007472, 2010.
Cubas, N., Souloumiac, P., and Singh, S. C.: Relationship link between landward vergence in accretionary prisms and tsunami generation, Geology, 44, 787–790, https://doi.org/10.1130/G38019.1, 2016.
Dahlen, F. A.: Critical Taper Model of Fold-and-Thrust Belts and Accretionary Wedges, Annu. Rev. Earth Pl. Sc., 18, 55–99, https://doi.org/10.1146/annurev.ea.18.050190.000415, 1990.
Davis, D. M. and Engelder, T.: The Role of Salt in Fold-and-Thrust Belts, Tectonophysics, 119, 67–88, https://doi.org/10.1016/0040-1951(85)90033-2, 1985.
Del Castello, M. and Cooke, M. L.: Underthrusting-accretion cycle: Work budget as revealed by the boundary element method, J. Geophys. Res.-Sol. Ea., 112, B12404, https://doi.org/10.1029/2007jb004997, 2007.
Ellis, S., Schreurs, G., and Panien, M.: Comparisons between analogue and numerical models of thrust wedge development, J. Struct. Geol., 26, 1659–1675, https://doi.org/10.1016/j.jsg.2004.02.012, 2004.
Flemings, P. B. and Saffer, D. M.: Pressure and Stress Prediction in the Nankai Accretionary Prism: A Critical State Soil Mechanics Porosity-Based Approach, J. Geophys. Res.-Sol. Ea., 123, 1089–1115, https://doi.org/10.1002/2017jb015025, 2018.
Gao, B., Flemings, P. B., Nikolinakou, M. A., Saffer, D. M., and Heidari, M.: Mechanics of Fold-and-Thrust Belts Based on Geomechanical Modeling, J Geophys. Res.-Sol. Ea., 123, 4454–4474, https://doi.org/10.1029/2018jb015434, 2018.
Gutscher, M. A., Klaeschen, D., Flueh, E., and Malavieille, J.: Non-Coulomb wedges, wrong-way thrusting, and natural hazards in Cascadia, Geology, 29, 379–382, https://doi.org/10.1130/0091-7613(2001)029<0379:Ncwwwt>2.0.Co;2, 2001.
Heidari, M., Nikolinakou, M. A., and Flemings, P. B.: Modified Cam-Clay Model for Large Stress Ranges and Its Predictions for Geological and Drilling Processes, J. Geophys. Res.-Sol. Ea., 125, e2020JB019500, https://doi.org/10.1029/2020JB019500, 2020.
Herbert, J. W., Cooke, M. L., Souloumiac, P., Madden, E. H., Mary, B. C. L., and Maillot, B.: The work of fault growth in laboratory sandbox experiments, Earth Planet Sc. Lett., 432, 95–102, https://doi.org/10.1016/j.epsl.2015.09.046, 2015.
Higgins, S., Clarke, B., Davies, R. J., and Cartwright, J.: Internal geometry and growth history of a thrust-related anticline in a deep water fold belt, J. Struct. Geol., 31, 1597–1611, https://doi.org/10.1016/j.jsg.2009.07.006, 2009.
Hubbert, M. K. and Rubey, W. W.: Role of Fluid Pressure in Mechanics of Overthrust Faulting .1. Mechanics of Fluid-Filled Porous Solids and Its Application to Overthrust Faulting, Geol. Soc. Am. Bull., 70, 115–166, 1959.
Koyi, H. A. and Vendeville, B. C.: The effect of decollement dip on geometry and kinematics of model accretionary wedges, J. Struct. Geol., 25, 1445–1450, https://doi.org/10.1016/S0191-8141(02)00202-X, 2003.
Lebinson, F., Turienzo, M., Sánchez, N., Cristallini, E., Araujo, V., and Dimieri, L.: Kinematics of a backthrust system in the Agrio fold and thrust belt, Argentina: Insights from structural analysis and analogue models, J. S. Am. Earth Sci., 100, 102594, https://doi.org/10.1016/j.jsames.2020.102594, 2020.
Lohrmann, J., Kukowski, N., Adam, J., and Oncken, O.: The impact of analogue material properties on the geometry, kinematics, and dynamics of convergent sand wedges, J. Struct. Geol., 25, 1691–1711, https://doi.org/10.1016/S0191-8141(03)00005-1, 2003.
MacKay, M. E.: Structural variation and landward vergence at the toe of the Oregon accretionary prism, Tectonics, 14, 1309–1320, https://doi.org/10.1029/95tc02320, 1995.
Maillot, B. and Leroy, Y. M.: Optimal dip based on dissipation of back thrusts and hinges in fold-and-thrust belts, J. Geophys. Res.-Sol. Ea., 108, 2320, https://doi.org/10.1029/2002jb002199, 2003.
Marques, F. O. and Cobbold, P. R.: Effects of topography on the curvature of fold-and-thrust belts during shortening of a 2-layer model of continental lithosphere, Tectonophysics, 415, 65–80, https://doi.org/10.1016/j.tecto.2005.12.001, 2006.
Mary, B. C. L., Maillot, B., and Leroy, Y. M.: Deterministic chaos in frictional wedges revealed by convergence analysis, Int. J. Numer. Anal. Met., 37, 3036–3051, https://doi.org/10.1002/nag.2177, 2013.
McBeck, J. A., Cooke, M. L., Herbert, J. W., Maillot, B., and Souloumiac, P.: Work Optimization Predicts Accretionary Faulting: An Integration of Physical and Numerical Experiments, J. Geophys. Res.-Sol. Ea., 122, 7485–7505, https://doi.org/10.1002/2017jb013931, 2017.
McClay, K.: Introduction to Thrust Fault-related Folding, in: Thrust Fault-Related Folding, edited by: McClay, K., Shaw, J., and Suppe, J., American Association of Petroleum Geologists, https://doi.org/10.1306/13251330M9450, 2011.
McMechan, M. E.: Structural geometry and kinematic evolution of the central Canadian Rocky Mountain Foothills fold-and-thrust belt: Complex kinematic relationships controlled by detachment utilization, Geosphere, 19, 1690–1708, https://doi.org/10.1130/Ges02623.1, 2023.
Mugnier, J. L., Huyghe, P., Large, E., Jouanne, F., Guillier, B., and Chakraborty, T.: An embryonic fold and thrust belt south of the Himalayan morphological front: Examples from the Central Nepal and Darjeeling piedmonts, Earth-Sci. Rev., 230, 104061, https://doi.org/10.1016/j.earscirev.2022.104061, 2022.
Nikolinakou, M. A., Flemings, P. B., Gao, B., and Saffer, D. M.: The Evolution of Pore Pressure, Stress, and Physical Properties During Sediment Accretion at Subduction Zones, J. Geophys. Res.-Sol. Ea., 128, e2022JB025504, https://doi.org/10.1029/2022JB025504, 2023.
Obradors-Prats, J., Rouainia, M., Aplin, A. C., and Crook, A. J. L.: Hydromechanical Modeling of Stress, Pore Pressure, and Porosity Evolution in Fold-and-Thrust Belt Systems, J. Geophys. Res.-Sol. Ea, 122, 9383–9403, https://doi.org/10.1002/2017jb014074, 2017.
Obradors-Prats, J., Medina, E. E. C., Jones, S. J., Rouainia, M., Aplin, A. C., and Crook, A. J. L.: Integrating petrophysical, geological and geomechanical modelling to assess stress states, overpressure development and compartmentalisation adjacent to a salt wall, gulf of Mexico, Mar. Petrol. Geol., 155, 106352, https://doi.org/10.1016/j.marpetgeo.2023.106352, 2023.
Ortner, H., von Hagke, C., Sommaruga, A., Mosar, J., Beidinger, A., and Hinsch, R.: The deformation front of the alps, in: Geodynamics of the Alps 3, edited by: Bellahsen, N. and Rosenberg, C., ISTE – Wiley, London, 2023.
Robert, R., Souloumiac, P., Robion, P., and David, C.: Numerical simulation of deformation band occurrence and the associated stress field during the growth of a fault-propagation fold, Geosciences, 9, https://doi.org/10.3390/geosciences9060257, 2019.
Rockfield: Elfen explicit manual (4.10), Rockfield [code], 2017.
Roscoe, K. H., Schofield, A. N., and Wroth, C. P.: On the Yielding of Soils, Geotechnique, 8, 32, https://doi.org/10.1680/geot.1958.8.1.22, 1958.
Ruh, J. B., Kaus, B. J. P., and Burg, J. P.: Numerical investigation of deformation mechanics in fold-and-thrust belts: Influence of rheology of single and multiple decollements, Tectonics, 31, Tc3005, https://doi.org/10.1029/2011tc003047, 2012.
Schreurs, G., Buiter, S. J. H., Boutelier, D., Corti, G., Costa, E., Cruden, A. R., Daniel, J. M., Hoth, S., Koyi, H. A., Kukowski, N., Lohrmann, J., Ravaglia, A., Schlische, R. W., Withjack, M. O., Yamada, Y., Cavozzi, C., Delventisette, C., Elder Brady, J. A., Hoffmann-Rothe, A., Mengus, J. M., Montanari, D., and Nilforoushan, F.: Analogue benchmarks of shortening and extension experiments, in: Analogue and Numerical Modelling of Crustalscale Processes, edited by: Buiter, S. J. H. and Schreurs, G., Geological Society of London, 440, https://doi.org/10.1144/GSL.SP.2006.253.01.01, 2006.
Seely, D. R.: The significance of landward vergence and oblique structural trends on trench inner slopes, in: Island arcs, deep sea trenches and back-arc basins, edited by: Talwani, M. and Pitman III, W. C., American Geophysical Union, 470, https://doi.org/10.1029/ME001, 1977.
Smit, J., Burg, J. P., Dolati, A., and Sokoutis, D.: Effects of mass waste events on thrust wedges: Analogue experiments and application to the Makran accretionary wedge, Tectonics, 29, Tc3003, https://doi.org/10.1029/2009tc002526, 2010.
Smit, J. H. W., Brun, J. P., and Sokoutis, D.: Deformation of brittle-ductile thrust wedges in experiments and nature, J. Geophys. Res.-Sol. Ea., 108, 2480, https://doi.org/10.1029/2002jb002190, 2003.
Song, I., Saffer, D. M., and Flemings, P. B.: Mechanical characterization of slope sediments: Constraints on in situ stress and pore pressure near the tip of the megasplay fault in the Nankai accretionary complex, Geochem. Geophy. Geosy., 12, 20, https://doi.org/10.1029/2011GC003556, 2011.
Teixell, A. and Koyi, H. A.: Experimental and field study of the effects of lithological contrasts on thrust-related deformation, Tectonics, 22, 1054, https://doi.org/10.1029/2002tc001407, 2003.
von Hagke, C., Bauville, A., and Chudalla, N.: Control of décollement strength and dip on fault vergence in fold-thrust belts and accretionary prisms, Tectonophysics, 870, 230172, https://doi.org/10.1016/j.tecto.2023.230172, 2024.
Willett, S. D. and Schlunegger, F.: The last phase of deposition in the Swiss Molasse Basin: from foredeep to negative-alpha basin, Basin Res., 22, 623–639, https://doi.org/10.1111/j.1365-2117.2009.00435.x, 2010.
Wood, D. M.: Soil Behaviour and Critical State Soil Mechanics, Cambridge University Press, 462 pp., https://doi.org/10.1017/CBO9781139878272, 1991.
Zhou, J., Zhang, B., and Xu, Q.: Effects of lateral friction on the structural evolution of fold-and-thrust belts: Insights from sandbox experiments with implications for the origin of landward-vergent thrust wedges in Cascadia, GSA Bulletin, 128, 15, https://doi.org/10.1130/B31320.1, 2016.