the Creative Commons Attribution 4.0 License.
the Creative Commons Attribution 4.0 License.
 | 03 Nov 2025
Hyperspectral mapping of density, porosity, stiffness, and strength in hydrothermally altered volcanic rocks
Samuel T. Thiele
Gabor Kereszturi
Michael J. Heap
Andréa de Lima Ribeiro
Akshay V. Kamath
Maia Kidd
Matías Tramontini
Marina Rosas-Carbajal
Richard Gloaguen
Heterogeneous structures and diverse volcanic, hydrothermal, and geomorphological processes hinder characterisation of the mechanical properties of volcanic rock masses. Laboratory experiments can provide accurate rock property measurements, but are limited by sample scale and labor-intensive procedures. In this contribution, we expand on previous research linking the hyperspectral fingerprints of rocks to their physical and mechanical properties. We acquired a unique dataset characterising the visible-near (VNIR), shortwave (SWIR), midwave (MWIR), and longwave (LWIR) infrared reflectance of samples from eight basaltic to andesitic volcanoes. Several machine learning models were then trained to predict density, porosity, uniaxial compressive strength (UCS), and Young's modulus (E) from these spectral data. Significantly, nonlinear techniques such as multilayer perceptron (MLP) models were able to explain up to 80 % of the variance in density and porosity, and 65 %–70 % of the variance in UCS and E. Shapley value analysis, a tool from explainable AI, highlights the dominant contribution of VNIR-SWIR absorptions that can be attributed to hydrothermal alteration, and MWIR-LWIR features sensitive to volcanic glass content, fabric, and/or surface roughness. These results demonstrate that hyperspectral imaging can serve as a robust proxy for rock physical and mechanical properties, potentially offering an efficient, scalable method for characterising large areas of exposed volcanic rock. The integration of these data with geomechanical models could enhance hazard assessment, infrastructure development, and resource utilisation in volcanic regions.
- Article
(7613 KB) - Full-text XML
-
Supplement
(13889 KB) - BibTeX
- EndNote


Society is dependent on subsurface resources, including groundwater (Foster et al., 2013), low-carbon energy (Lund and Toth, 2021; Soltani et al., 2019) and critical raw materials (Lewicka et al., 2021). Simultaneously, population growth and increasingly extreme weather (Aubry et al., 2022; Farquharson et al., 2015) expose a growing number of people to geological hazards, including rock falls, landslides, and volcanic eruptions. Effective management of these resources and hazards requires detailed characterisation of the subsurface geology, its physical properties (e.g., density and permeability), and its mechanical behaviour (e.g., strength and deformability).
Volcanic regions commonly host mineral, water, and geothermal resources, and are also extremely prone to geological hazards. However, the mechanical behavior of volcanic rock masses remains challenging to characterize, due to the diverse volcanic, hydrothermal, sedimentological and geomorphological processes that shape and reshape them (Heap and Violay, 2021). Although mechanical properties can be accurately and routinely measured in the laboratory, samples are typically limited to the centimeter- to decimeter-scale, which is several orders of magnitude smaller than is required to predict surface deformation or reservoir behavior. Obtaining sufficient measurements to statistically characterize large-scale mechanical variability thus remains a challenge, given the laborious mechanical tests required to measure e.g., strength, stiffness, and hydraulic properties.
Several proxy measures have been developed to help mitigate sampling limitations, including field measurements of porosity and permeability (Farquharson et al., 2015; Mordensky et al., 2018), Schmidt hardness (del Potro and Hürlimann, 2009; Dinçer et al., 2004; Harnett et al., 2019; Mordensky et al., 2018), point-load strength (Poganj et al., 2025), reflectance spectroscopy (Kamath et al., 2025; Bakun-Mazor et al., 2024; Kereszturi et al., 2023; Schaefer et al., 2021), and thermal inertia (Franzosi et al., 2023; Loche et al., 2021; Mineo and Pappalardo, 2016). These proxies are easier to obtain than many mechanical test results, and often correlate well with important laboratory-measured properties like strength and stiffness after calibration for specific geological contexts or settings.
Hyperspectral reflectance data could provide an especially useful proxy for mechanical properties, as they can be collected rapidly and, potentially, acquired remotely using imaging sensors. This approach could make use of the latent influence that lithological properties like mineralogy, fabric, and porosity have on both the hyperspectral and mechanical response. For instance, Schaefer et al. (2021) used visible-near (VNIR; 350–900 nm) and shortwave (SWIR; 900–2500 nm) infrared reflectance spectroscopy to correlate spectral features and mineralogy with porosity and strength, and identified moderate Spearman rank correlation with 390, 2207, and 2325 nm features. Kereszturi et al. (2023) also used VNIR and SWIR hyperspectral data to predict porosity and unconfined compressive strength (UCS) in volcanic rocks, explaining 40 %–50 % of the mechanical variance. Lee et al. (2023) applied VNIR, SWIR, and midwave infrared (MWIR; 3000–5200 nm) data to predict the dynamic elastic moduli of finely laminated shales, with R2 scores between 0.4 and 0.8, but across a small sample set. Most recently, Bakun-Mazor et al. (2024) used VNIR-SWIR and longwave infrared (LWIR; 7000–12 000 nm) spectra to estimate several mechanical properties, including UCS, in carbonate rocks, with generally high (0.8 to 0.9) R2 scores. However, further research is needed to understand the relationships between hyperspectral data and the mechanical properties of volcanic rocks, due to their complex microstructures and mineralogies, as well as the impact of hydrothermal alteration.
In this contribution we investigate the relationships between hyperspectral data and the mechanical properties of volcanic rocks, specifically focusing on density, porosity, UCS, and Young's modulus (E). E is of particular interest, as it has not previously been linked to hyperspectral data and is crucial to predict surface deformation occurring during e.g. construction or tunnelling works, mining, and volcanic unrest (Arens et al., 2022; Harnett and Heap, 2021; Heap et al., 2020b, 2021b; Hickey et al., 2022; Hoek and Diederichs, 2006; Strehlow et al., 2015; Vrakas et al., 2018).
We therefore expanded the dataset presented by Kereszturi et al. (2023) to include samples from more volcanoes, and cover an extended spectral range (VNIR-SWIR-MWIR-LWIR). This dataset is then leveraged to:
-
Train machine learning models to predict density, porosity, UCS, and E.
-
Identify hyperspectral indicators for hydrothermal alteration, and explore how these are linked to the measured and predicted mechanical properties.
-
Quantify the influence of different spectral ranges on each predicted property, to explore the spectral features that inform our model.
By advancing our understanding of the correlations between hyperspectral and mechanical properties, we ultimately aim to improve our ability to characterise complex and heterogeneous volcanic rock masses.
2.1 Light-matter interactions: reflection and scattering
Light-matter interactions are complex, and governed by multiple interacting optical phenomena. Reflectance is a dimensionless expression of these interactions, defined by the ratio between the excitation signal (illumination or irradiance, W m−2) and signals emitted back towards a sensor (radiance, W m−2 sr−1). Hyperspectral sensors measure this returned radiance, and split it into many narrow but contiguous wavelength ranges to derive a radiance spectra that, after correction to derive reflectance, contains information on the target material.
Links between hyperspectral reflectance spectra and mineralogy are well established, as reviewed by Laukamp et al. (2021) and Williams and Ramsey (2024). Specific spectral ranges can be used to identify certain elements, due to the absorption of VNIR range light during electronic transitions in metals like Fe, and covalent bonds that absorb energy at specific wavelengths by stretching and bending activity. Compounds containing O-H, C-O and S-O bonds tend to have diagnostic absorption features in the SWIR and MWIR ranges, while stretching and bending vibrations of Si-O bonds cause absorption in the upper MWIR and LWIR ranges.
In volcanic contexts (Fig. 1a), electronic transition absorptions in the VNIR range can be used to detect common Fe3+ and Fe2+ rich minerals, including hematite, goethite, and jarosite. SWIR range data are sensitive to hydroxylated silicates, including clay minerals, sulphates, and carbonates. The MWIR range (Fig 1b) is less widely used, but also includes diagnostic absorption features for hydroxylate silicate and carbonate minerals (Fig 1b). Finally, the upper MWIR and LWIR range is strongly influenced by absorptions from the Si-O bonds in silicate minerals and glasses, and can be used to characterise the extent of silica polymerization and to identify most rock-forming silicates (e.g., quartz, feldspars, pyroxene) (Fig 1c).
Regardless of the spectral range, features observed in reflectance spectra are determined by a combination of refraction, absorption and scattering characteristics inherent to each material, and abide by Snell's law (Kirkland et al., 2003; Rost et al., 2018). The expected positions of absorption features are well-established, including subtle variations caused by differences in crystal structure that often allow precise identification of specific minerals (Laukamp et al., 2021). However, spectral characteristics like overall albedo, broad fluctuations in reflectance intensity, and the depth and asymmetry of absorption modes (spectral contrast), can vary significantly between rocks with the same mineralogy. These wavelength-dependent variations derive from processes occurring as light interacts with the surface of a rock and while traveling through its solid constituents (and pore spaces), carrying information linked to surface and bulk physical properties. For consistency, we refer to changes in the direction and intensity of light which are directly dependent on the surface characteristics as “surface scattering”, and as “volume scattering” when these changes are linked to processes occurring below the surface. Accordingly, light-matter interactions in natural minerals can be understood through the combination of two optical scattering components: surface and volume (Osterloo et al., 2012; Rost et al., 2018; Vincent and Hunt, 1968).
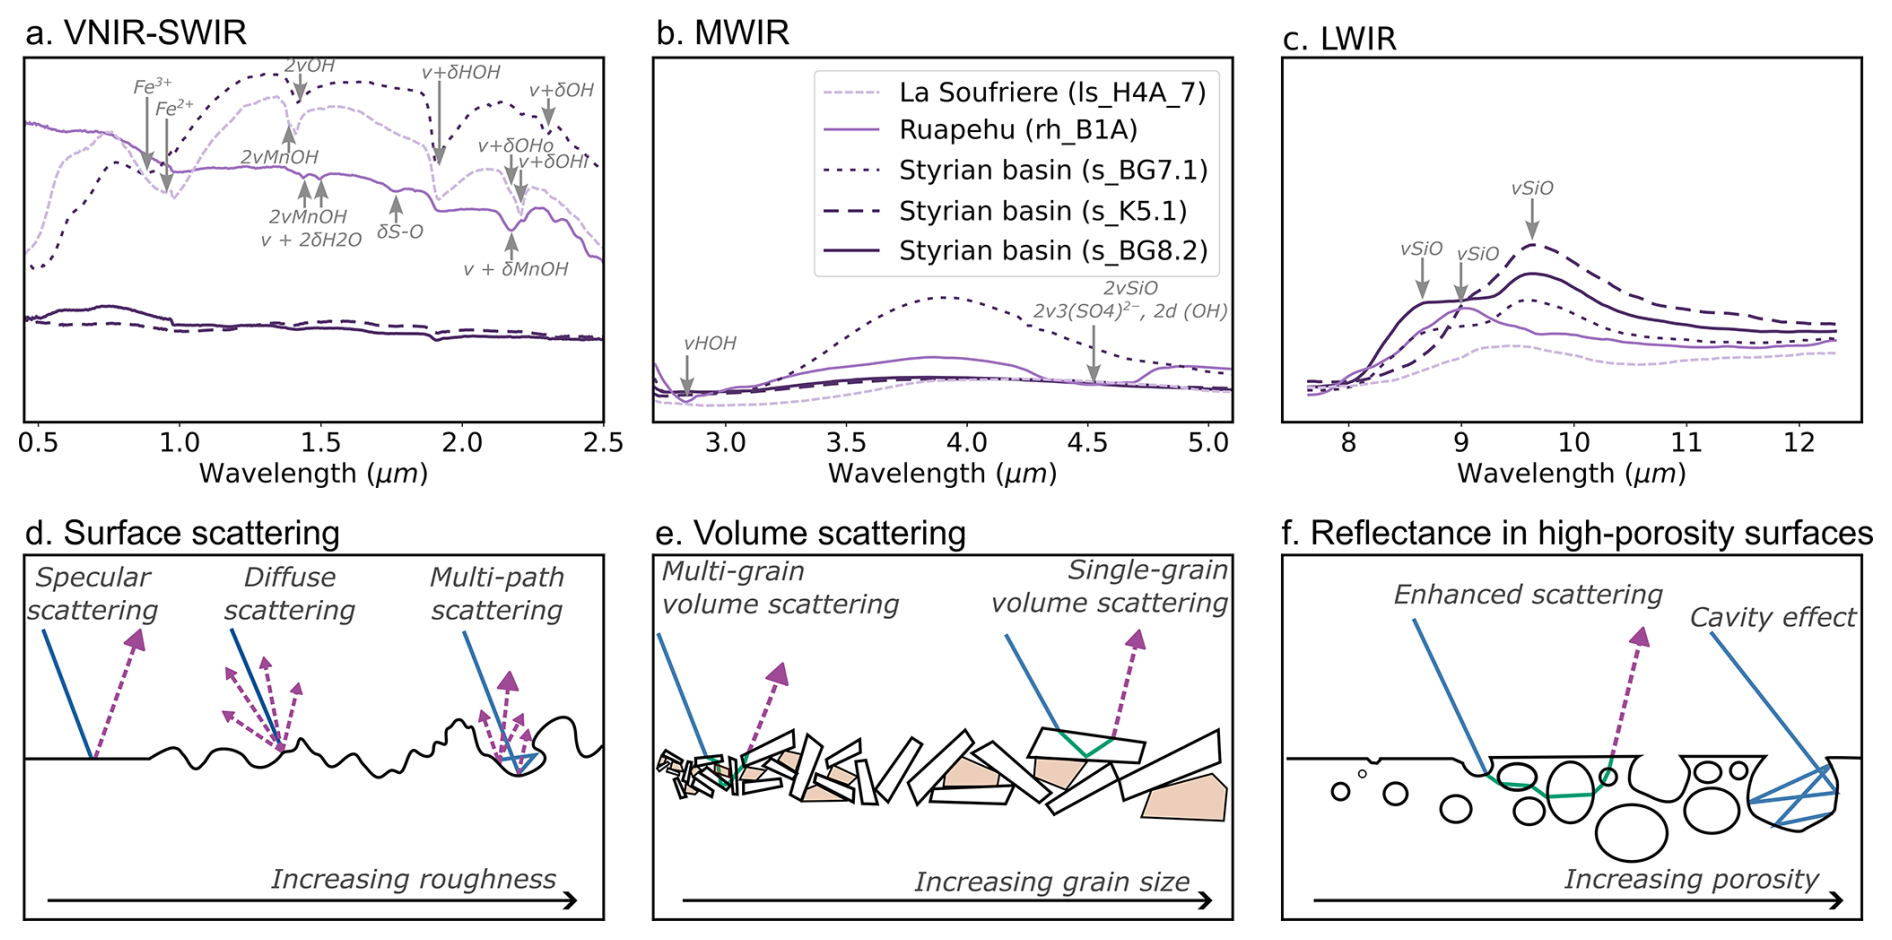
Figure 1Mineralogical and physical controls on hyperspectral reflectance spectra. Examples of absorption features caused by minerals commonly found in volcanic rocks are shown for the VNIR-SWIR (a), MWIR (b) and LWIR (c) ranges, as described in depth by Laukamp et al. (2021). Typical surface (d) and volume scattering (e) interactions are shown, highlighting the effect of increasing surface roughness and grain size. An example of how these processes operate simultaneously, and are both strongly influenced by porosity, is shown in (f). Note that these are all wavelength dependent, especially where the wavelength of light approaches the scale of variation.
Surface scattering occurs when light interacts mostly with the superficial layer of a mineral, which acts as a mirror-like interface and reflects light without transmitting it to the internal constituents of a rock (hereafter referred to as grains, although we use this term inclusively of crystals, clasts and fragments) (Fig. 1d). This happens when the extinction coefficient of light in a medium (k) is larger than its refractive index (n); as most of the incident radiation is absorbed at the surface and not transmitted to higher depths (Hardgrove et al., 2016). The magnitude of surface scattering can vary with wavelength (as n and k are both wavelength dependent), and is highly sensitive to the scale of surface topography relative to the wavelength (Rayleigh's criterion; Hapke, 2012, 1981). A surface is considered perfectly smooth when its average roughness is smaller than the wavelength of the incident light, with the outcoming light being reflected at the same angle as the incoming radiation. This phenomenon, known as specular reflection, is particularly important in the LWIR region (5000–50 000 nm) (Fig. 1d). As roughness increases, surface irregularities serve as points for the incoming light to scatter into several directions, spreading the total reflected energy in a Lambertian-like process known as diffuse scattering (Fig. 1d). Diffuse scattering is particularly important in the VNIR-SWIR analysis of rough surfaces in which asperities are oriented towards different directions. In extreme cases, multiple diffuse patterns can occur within a small area, leading to a multi-path scattering pattern (Fig. 1d).
In addition to impacting surface scattering, increased roughness enhances the transmission of incoming light through grains at the sample surface, even when k is larger than n. This process, known as volume scattering, introduces longer paths and changes in direction for light travelling within the medium leading to partial energy loss and reduced spectral contrast (Kirkland et al., 2003, 2001; Osterloo et al., 2012; Rost et al., 2018) due to light undergoing absorption within the medium prior to being scattered back to the surface (Fig. 1e). Increased volume scattering is also linked to the grain size, and observed especially in the presence of smaller grains (Hunt and Vincent, 1968; Lyon, 1965; Mustard and Hays, 1997; Salisbury and Wald, 1992). It is important to note that although the impact of volume scattering on the reflectance spectrum is dependent on the inherent optical properties of the mineral, roughness, and the wavelength of the incoming light, these relationships are highly non-linear and difficult to characterise for real multi-phase materials (i.e. rocks). In the LWIR, both increased and decreased spectral contrast have been associated with volume scattering, highlighting the complexity of these interactions (Osterloo et al., 2012).
For most real materials and mineral mixtures, both surface and volume scattering influence the reflectance spectra, with different contributions depending (again) on the surface roughness, grain size, and wavelength range. An exemplary case of surface and volume processes acting simultaneously is encountered for porous materials (Fig. 1f). Pore size, shape and distribution are directly linked to surface roughness, impacting the light-matter interaction dynamics by: (i) enhancing the volume scattering by transmitting light through regions with different k and n (e.g. mineral/air/mineral interfaces), leading to longer travel paths; and (ii) by trapping light at pores with high depth-to-width ratios, causing multiple surface reflection paths (cavity effect) and, in extreme cases, leading to total absorption of light before it can be reflected out of the cavity (Hardgrove et al., 2016; Huang et al., 2021; Kirkland et al., 2001). Ultimately, increased porosity may lead to important changes in the reflectance spectrum, particularly in the thermal region (5000–50 000 nm), and is associated with reduced spectral contrast and inhibition of diagnostic mineralogical absorption features (Osterloo et al., 2012; Rost et al., 2018; Salisbury and Eastes, 1985).
2.2 Hapke's model
Hyperspectral cameras operate as fixed-position external-reflectance sensors, collecting the radiation scattered in a specific direction from a material excited by a light source of known characteristics. Hence, material properties which affect the amount of radiation scattered towards a detector influence the measured spectra. Several models (broadly known as the Hapke model) have been proposed to investigate these light-mineral interaction dynamics, initially in the context of extraterrestrial remote sensing (Hapke, 2012, 2008, 2002, 1984, 1981). Hapke's models aim to estimate bidirectional reflectance signals collected by external-reflectance sensors. They are based on radiative transfer theory and on the works from Chandrasekhar (1960), and form an important theoretical basis for hyperspectral imaging applications. The core premise of Hapke's models is that reflectance spectra can be parameterised as a function of material type and morphological properties (Hapke, 1993).
While a detailed examination of Hapke's model(s) is beyond the scope of this contribution, we aim here to identify several key elements that link reflectance signals with roughness, grain size and porosity. These effects are highlighted using the following formula,
where is the scattering intensity (radiance); K is the filling factor (linked to porosity; Hapke, 2008); ω (λ) is the average single scattering albedo (SSA; linked to absorption and scattering at particle level and dependent on the wavelength λ); B(α) is the opposition surge function (Hapke, 1993, 1986); P(α) is the average single scattering function for the phase angle α; i and e are the angles of incidence and emission; represents the wavelength-dependent multiple scattering effect (MSE). It is important to note that Hapke's refers to `scattering' as an integration of all radiation emitted by a surface following interactions with an excitation source, with no distinction between surface and volume processes. Instead, the models provide a holistic approach in which multiple terms are influenced by both surface and volume processes. In this context, radiance is thus the total signal scattered by an object towards a detector. In hyperspectral remote sensing, the distinction between surface and volume scattering contributions is important, as surface and subsurface rock characteristics are linked to changes in the reflectance spectra (cf., Sect. 2.1).
The single and multiple scattering terms (SSA and MSE) are the primary contributors to the reflectance estimated by the model. Whilst SSA represents the probability of light being scattered or absorbed by a single grain, MSE (derived from Ambartsumian-Chandrasekhar H-function and dependent on SSA) accounts for multiple scattering prior to its emission towards a detector. Both parameters are material-specific, and vary according to changes in roughness, grain size, and wavelength of light. Another core term is the phase function P(α), which estimates how much light is scattered in a given direction relative to the direction of incoming light as a function of the angle between the illumination direction and the viewing direction (phase angle, α). The intensity and direction of the phase function are not material-specific, but α also depends on roughness, grain size and wavelength. The opposition surge term B(α) is also linked to α, and introduces a surface brightening effect as it decreases (Hapke, 2002). Finally, the porosity parameter K accounts for changes in scattered signals due to increasing porosity and/or decreasing density (Hapke, 2008).
To summarise, Hapke's models provide an important tool to understand the link between hyperspectral reflectance spectra and sample roughness, grain size, porosity and composition. It is based on radiative transfer theory and traditionally used to describe the scattering of light by planetary surfaces. It estimates the bidirectional reflectance of a surface, considering both single and multiple scattering of light. The model can be tuned for specific applications, and generally incorporates parameters such as single-scattering albedo, phase function, and surface roughness which have a direct impact on the bidirectional reflectance signals. Hapke's model is therefore a strong basis for understanding the interaction of light with rock surfaces, aiding in the interpretation of remote sensing data. While the complexity of real samples typically limits the model's practical application, it provides a useful theoretical framework that will help us to understand and interpret hyperspectral reflectance spectra.
3.1 Sample database
For this study, we compiled a new database of 332 well-characterised core samples that have been subjected to laboratory rock deformation experiments (Heap et al., 2021a, 2020a; Leiter et al., 2024; Schaefer et al., 2023; Tramontini et al., 2024; Vairé et al., 2024). These samples were collected in the scope of previous studies from eight basaltic to rhyolitic composite volcanoes, including Cracked Mountain (Canada; Leiter et al., 2024), Ruapehu (New Zealand; Schaefer et al., 2023), La Soufrière de Guadeloupe (Eastern Caribbean; Heap et al., 2021b, a), Ohakuri (New Zealand; Heap et al., 2020a), Chaîne des Puys (France; Vairé et al., 2024), Copahue (Argentina/Chile; Tramontini et al., 2024), Tongariro (New Zealand; Kidd et al., 2024), and Whakaari (New Zealand; Kidd et al., 2024).
Most of the sampled rocks are basaltic to andesitic in composition, and cover a range of textures (breccias, pyroclastic, and coherent lava rocks). A breadth of hydrothermal alteration is also covered, ranging from dominantly fresh rocks (e.g., from Chaîne des Puys; Vairé et al., 2024) through to intense hydrothermal alteration (e.g., some samples from Ruapehu and Whakaari; Schaefer et al., 2023). Altered samples in our sample set were subject to acid-sulphate related mineralogical changes, including the formation of sulphates (e.g., jarosite, alunite and anhydrite), phyllosilicates (e.g., kaolinite and montmorillonite), and various polymorphs of quartz (Heap et al., 2021a; Kereszturi et al., 2020). This diversity of alteration is intended to help our machine learning models to learn some of the alteration systematics and capture how these can influence the physical and mechanical properties of volcanic rocks.
3.2 Laboratory testing
Mechanical test cores were prepared with a diameter of 20 mm and a length of ca. 40 mm. Measurements and experiments were either performed at University of Strasbourg (France) or University of Canterbury (New Zealand). Prior to testing, the samples were dried in a vacuum oven at 40 °C for a minimum of 48 h (Strasbourg) or oven-dried at 60 °C for a minimum of 48 h (Canterbury). Dry bulk density was calculated using the dry mass and bulk volume of each sample. Connected porosity was calculated using the skeletal volume, measured using an AccuPyc II 1340 pycnometer (Strasbourg and Canterbury), and the bulk volume of each sample.
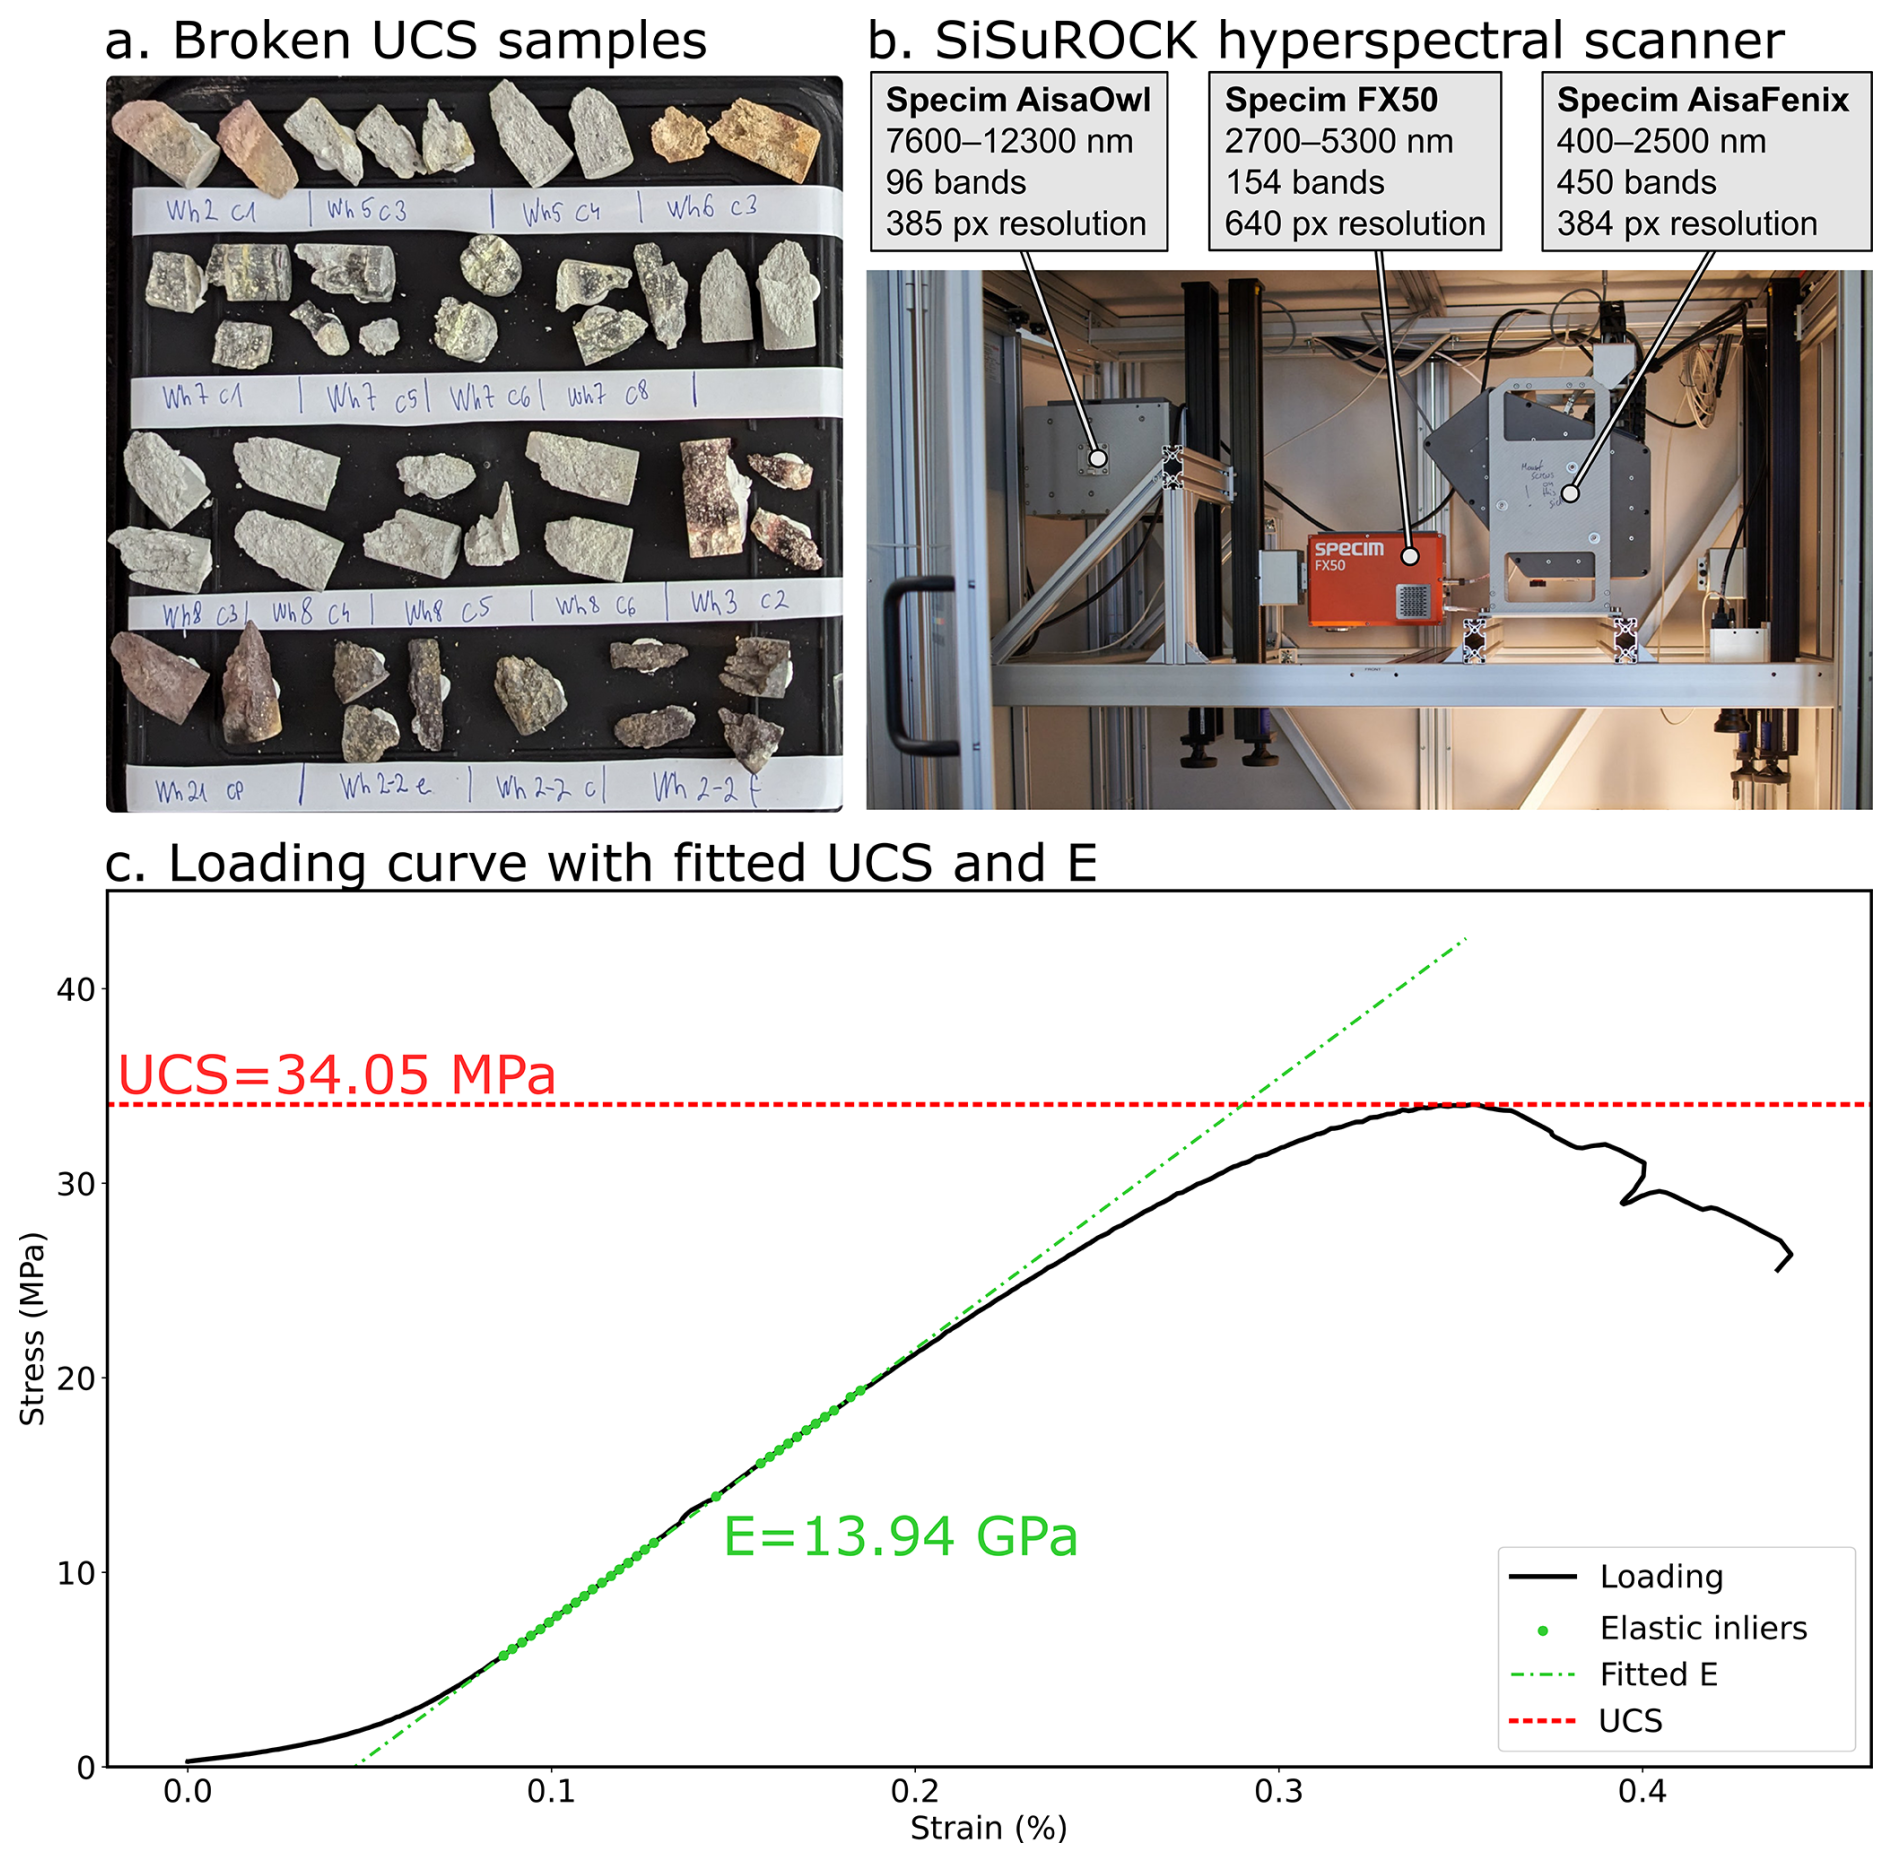
Figure 2Post-failure uniaxial compressive strength (UCS) test cores (a) prior to scanning in a SiSuROCK hyperspectral drillcore scanner (b). UCS and Young's modulus (E) were extracted from the corresponding stress-strain curves (c) using an automated RANSAC-based procedure, for direct comparison with the (averaged) sample spectra.
Uniaxial compressive strength (UCS) experiments were performed using a uniaxial load frame supplied by Schenk (Strasbourg) or a 3000 kN Technotest uniaxial load frame (Canterbury). All experiments were performed on dry samples at ambient laboratory temperatures. Samples were deformed at a constant strain rate of 10−5 s−1 until macroscopic sample failure (Fig. 2a). Axial displacement and axial force were measured by a linear variable differential transducer and a load cell, respectively, and were converted to axial strain and axial stress using the initial length and radius of the sample, respectively. More information, as well as schematic diagrams of the devices, can be found in Heap et al. (2014) and Mordensky et al. (2018).
The maximum stress of each loading curve was identified as the UCS. The pre-failure loading curve was then smoothed slightly using a Savitzky–Golay filter and resampled to regular stress increments using a linear interpolation. The slope of the most linear part of the resampled loading curve was then identified to calculate E, using the random sample and consensus (RANSAC) algorithm. This regression technique iteratively fits data with a function (in this case linear) using random minimal subsets (two points) and maximises the number of inliers within a threshold distance. This approach successfully identifies the linear part of each loading curve while remaining robust to outliers caused by pre-failure inelastic deformation (Fig. 2c), allowing robust and objective measurement of E.
3.3 Hyperspectral data acquisition
The core samples were arranged on non-reflective sample trays (Fig. 2a), grouped by size to limit focal blur, leveled and fixed in place using plasticine to reduce illumination artifacts. Each tray was then scanned using a Specim SiSuROCK drill core scanner, which contains Specim AisaFENIX, FX50 and AisaOWL hyperspectral sensors and a high spatial resolution Specim RGB-Jai camera (Fig. 2b). The workflow described by Thiele et al. (2024) was used to coregister data from each of the sensors and to convert from measured radiance to relative reflectance.
Each sample was then extracted from the coregistered stack of hyperspectral (and RGB) imagery using napari-hippo (Thiele et al., 2024), and stored as a separate set of images. The spectra of each image was smoothed slightly with a Savitzky–Golay filter (using a 1st order polynomial and window size of 5 bands), and hull-corrected using hylite (Thiele et al., 2021) to amplify spectral absorption features and reduce illumination artifacts caused by non-planar sample geometries. VNIR to MWIR spectra were corrected using an upper hull correction, while a lower hull correction was applied to the LWIR range data.
Median spectra from each mechanical test sample were then compiled into a spectral library covering the VNIR-SWIR-MWIR-LWIR range. These were combined with the corresponding mechanical property measurements to derive a training dataset.
Table 1Spectral indices used to spectrally characterize our samples. Absorption features are classified according to the notation of Laukamp et al. (2021), denoting stretching-related absorptions with v and bending-related absorptions with δ, and were quantified by fitting an asymmetric gaussian to the specified spectral range and recording its amplitude as a measure of absorption depth. This fitting was conducted using hylite (Thiele et al., 2021), and included a hull correction step to remove spectral features broader than the target range.
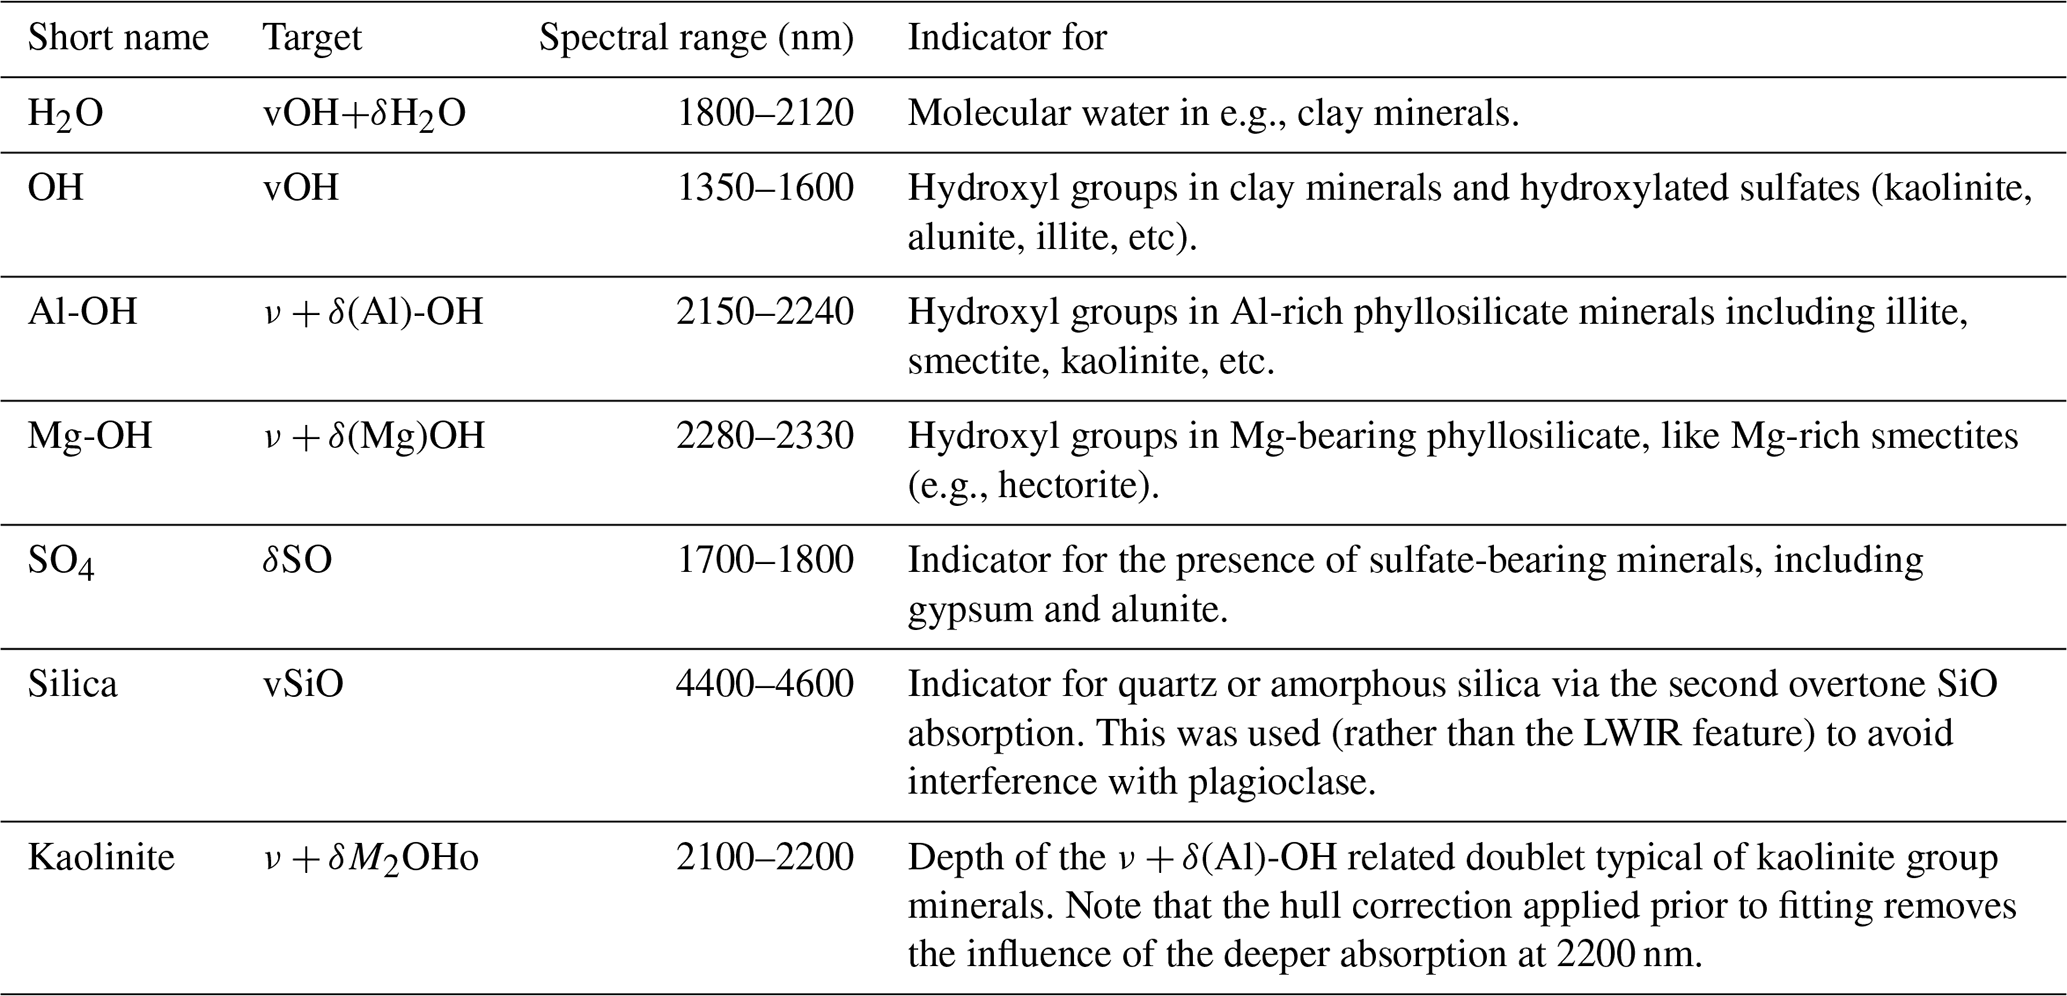
Mineralogy was characterised with indices extracted from the spectra of each sample using the minimum wavelength mapping approach (van der Meer et al., 2018) implemented in hylite (Thiele et al., 2021). These indices (Table 1) quantify specific spectral absorptions resulting from vibrational and bending vibrations associated with water, sulfate, hydroxylated phyllosilicates, and silicate minerals (Laukamp et al., 2021; Schodlok et al., 2016). Two composite indices were also calculated, to characterize bulk-composition and the extent of hydrothermal alteration. The first is the Mafic-Felsic Index of Schodlok et al. (2016), which distinguishes samples with basaltic compositions from those that are more evolved. This index, hereafter referred to as MFI, was computed by applying a lower-hull correction to the LWIR spectra between 7640 and 10 620 nm and identifying the general position (wavelength) of the reflection peak within this range, using the polynomial fitting approach implemented in hylite (Thiele et al., 2021). The results were then normalized to range between 0 (maxima at 10 620 nm, indicating mafic compositions) and 1 (maxima at 7640 nm, indicating felsic compositions).
The second bulk index was derived by averaging the H2O and OH absorptions at ∼1900 and 1400 nm (Table 1), to track the total amount of water (as H2O, in e.g. quartz-hosted fluid inclusions, and as -OH groups in e.g., clay minerals). Because most of the measured volcanic rocks are initially dry (with some exceptions, e.g., phreatomagmatic tuff), this water often indicates hydrothermal alteration. We thus use this index as a rough proxy for hydrothermal alteration (and weathering) processes. The presence of hydrated (alteration) minerals has been shown to correlate with mechanical response (Heap et al., 2022).
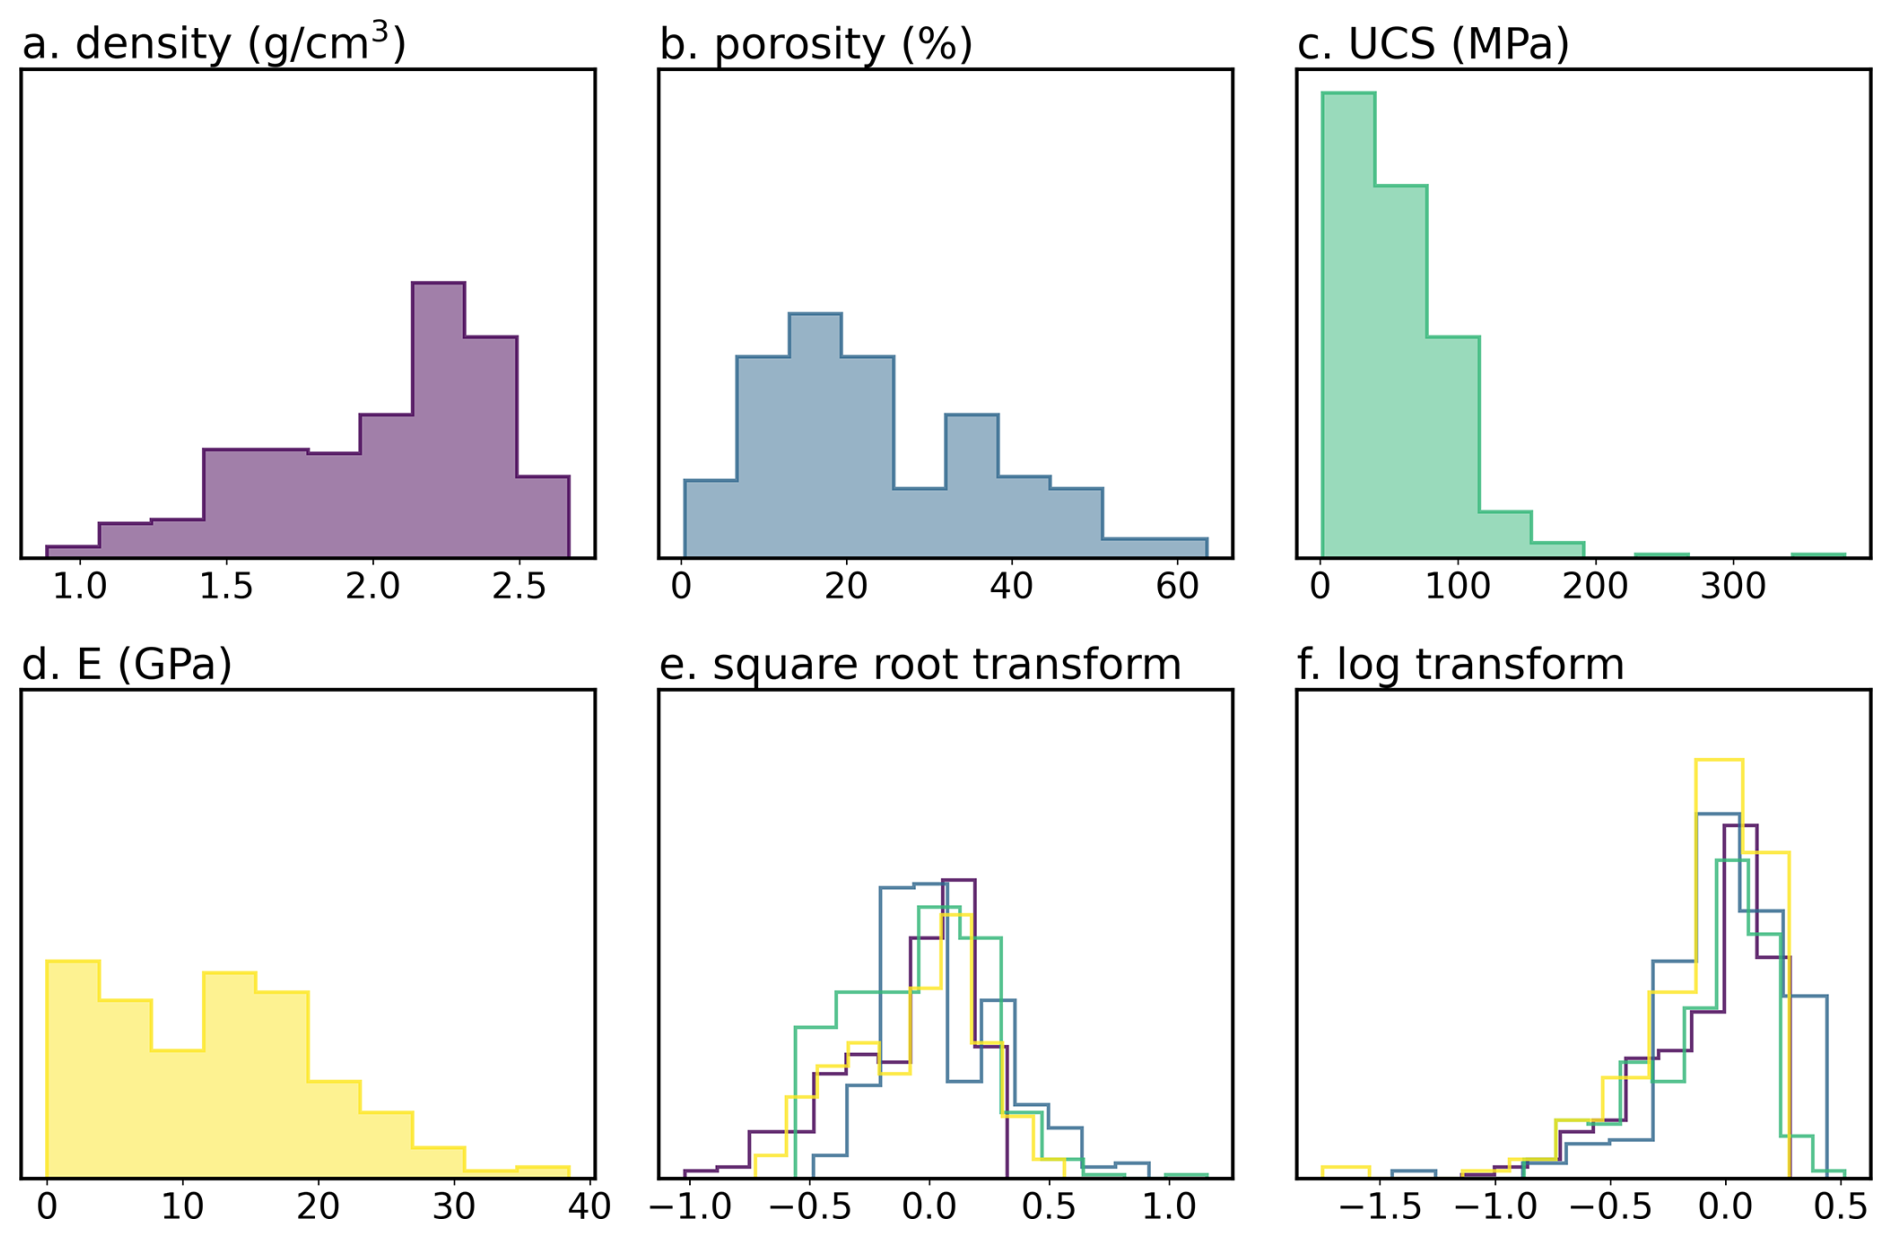
Figure 3Distributions of the training data before (a–d) and after square root (e) and log (f) transformation. Note that transformed data was normalised to have a median of 0 and 2nd to 98th percentile range of 1. The square root transform (e) resulted in approximately normal distributions.
3.4 Regression models
Each target variable (density, porosity, UCS, and E) required transformation prior to model fitting, to reduce skew (Fig. 3) and ensure the back-transformed predictions are correctly scaled (non-negative and, in the case of porosity, between 0 and 1). A square root transform (Fig. 3e) was found to perform better than a log-transform (Fig. 3f), likely as it resulted in more normally distributed data. Porosity was converted to a ratio of voids to solids (1 – porosity) prior to the square root transform, mitigating challenges fitting regressions to closed data.
We ensure a robust calibration/validation by defining five folds using a stratified split with respect to porosity, to ensure that each fold contains diverse mechanical properties. Several machine learning approaches (lasso regression, partial least square regression, support vector regression, and multilayer perceptron regression), known to be adapted to this genre of tasks, were then evaluated using the R2 metric and 5-fold cross validation (to account for potential overfitting). Model hyperparameters were optimised to maximise the training R2 score, as documented in the Jupyter notebooks included in the Supplement. Five models of each type were trained, each setting aside a single fold (20 % of the data) as a test set. Each trained model was then used to predict its unseen test-set, and the results compiled for a robust assessment of model accuracy. Finally, the best performing models (of different types) were combined into an ensemble, allowing prediction variance to be used as a measure of uncertainty.
3.5 SHAP analysis
Shapley values (Shapley, 1973) have recently been adapted to help understand the predictions made by deep learning models. Based on cooperative game theory, Shapley values quantify the contribution of individual features to output predictions, providing a theoretically grounded measure of the average marginal contribution of each input feature across all possible feature subsets (Lundberg and Lee, 2017). This allows a more detailed interpretation than other explanation approaches, and in this case helps link model predictions to specific hyperspectral bands.
We used the python package SHAP (Shapley Additive Explanations; Lundberg and Lee, 2017) to compute Shapley values for our ensemble models. Due to the various types of models included in these ensembles, a stochastic estimation approach (KernelSHAP) was used. KernelSHAP is a model-agnostic algorithm that estimates Shapley values by systematically perturbing input variables and measuring the resulting changes. The perturbative nature of this algorithm makes it computationally expensive, requiring us to compute Shapley values only for a subset of our test dataset. This subset was selected using k-means clustering, such that 16 representative data points (cluster centroids) could be selected for use by the Kernel Explainer.
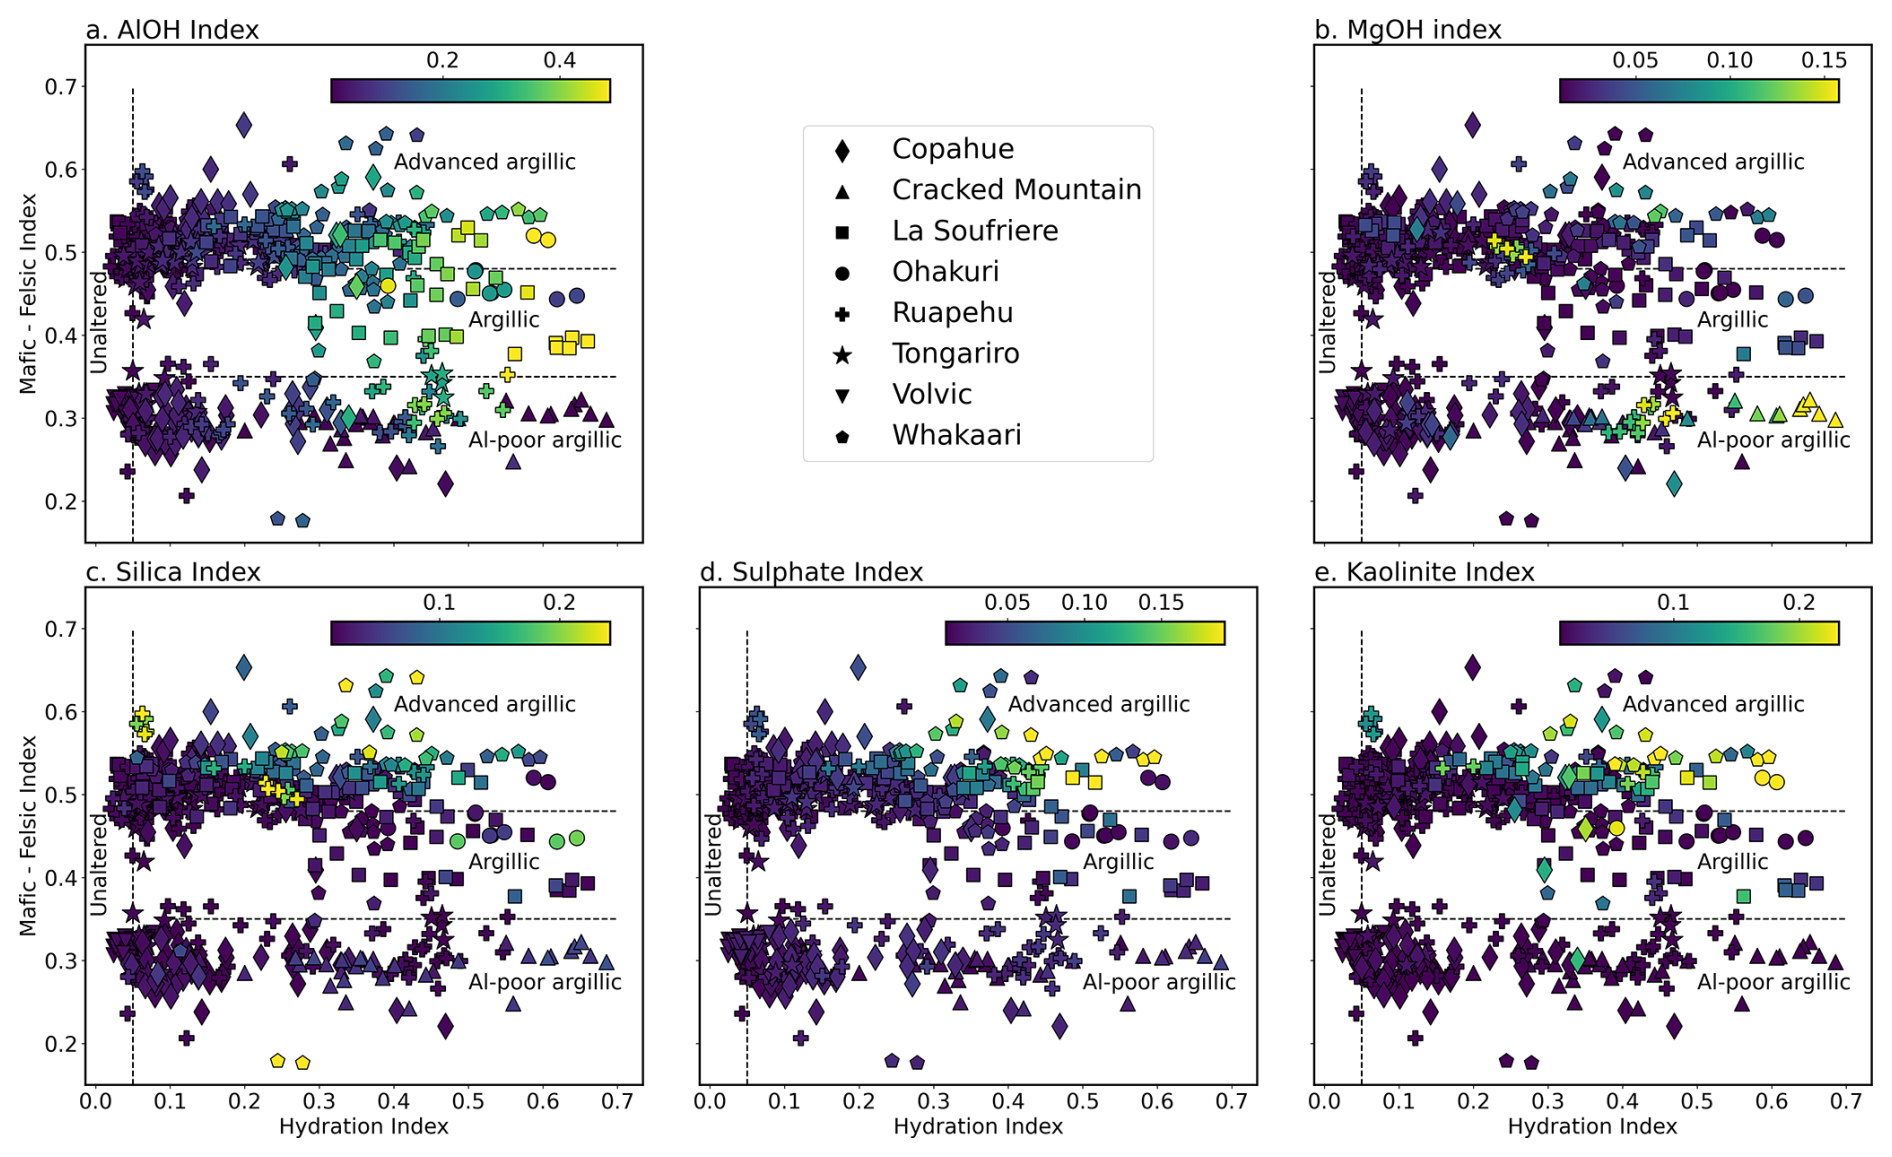
Figure 4Measured hydration index (x axis) and Mafic-Felsic Index (MFI; y axis), coloured by hyperspectral indices for Al-OH bearing phyllosilicates (a), Mg-OH bearing phyllosilicates such as hectorite (b), quartz (c), sulfate (d), and kaolinite (e). The two main clusters indicate the broadly basaltic (lower) or andesitic (upper) composition of the samples, while hydrothermal alteration (and/or surface weathering) results in significant scatter along the x axis. Distinctive Al-OH and Mg-OH (clay) rich zones indicate argillic alteration, while samples with elevated sulfate and kaolinite indices were likely subject to advanced argillic alteration.
4.1 Spectral response of hydrothermal alteration
A comparison of MFI, a proxy for composition, and hydration index, a proxy for hydrothermal alteration, highlights the spectral diversity of our dataset (Fig. 4). Two broad populations of basalt (lower) and andesite (upper) form clear horizontal “bands”, each of which contains variable amounts of hydration. The MFI results broadly match the expected composition of each volcano, albeit with exceptions including two altered samples from Whakaari with anomalously low MFI (due to the confounding influence of non-silicate alteration minerals like jarosite or sulphur, rather than a mafic composition).
Diagnostic absorption features for kaolinite (ν+δM2OHo) and other clay minerals (ν+δ(Al)-OH and ν+δ(Mg)-OH) are prominent in many altered samples. Of these, the kaolinite-rich samples (Fig. 4e) tended to be associated with deeper 2vSi-O absorptions in the MWIR range (at ∼4500 nm) or δS-O absorptions in the SWIR range (at ∼1750 nm), indicating silicification and/or the presence of sulphate minerals like jarosite and alunite. In combination, these spectral features indicate advanced argillic alteration, and are mostly associated with higher (andesitic) values of MFI as our dataset currently lacks basaltic examples of advanced argillic alteration.
Many samples also contain well defined ν+δ(Al)-OH absorption features (Fig. 4a), but without the previously mentioned kaolinite, sulphate, or quartz-related absorption features. These are indicative of illite and smectite group clay minerals formed by lower-temperature (<120 °C) and/or higher pH hydrothermal alteration or weathering. Many of the basaltic samples (lower MFI) also contain distinctive ν+δ(Mg)OH absorption features at 2300 nm, while lacking the ν+δ(Al)-OH feature (Fig. 4b). We interpret this as either primary Al-poor clays (e.g., in palagonite tuffs), or as the result of argillic alteration or weathering in Al-poor primary lithologies to form Fe- and Mg- rich clay minerals, like nontronite and hectorite.
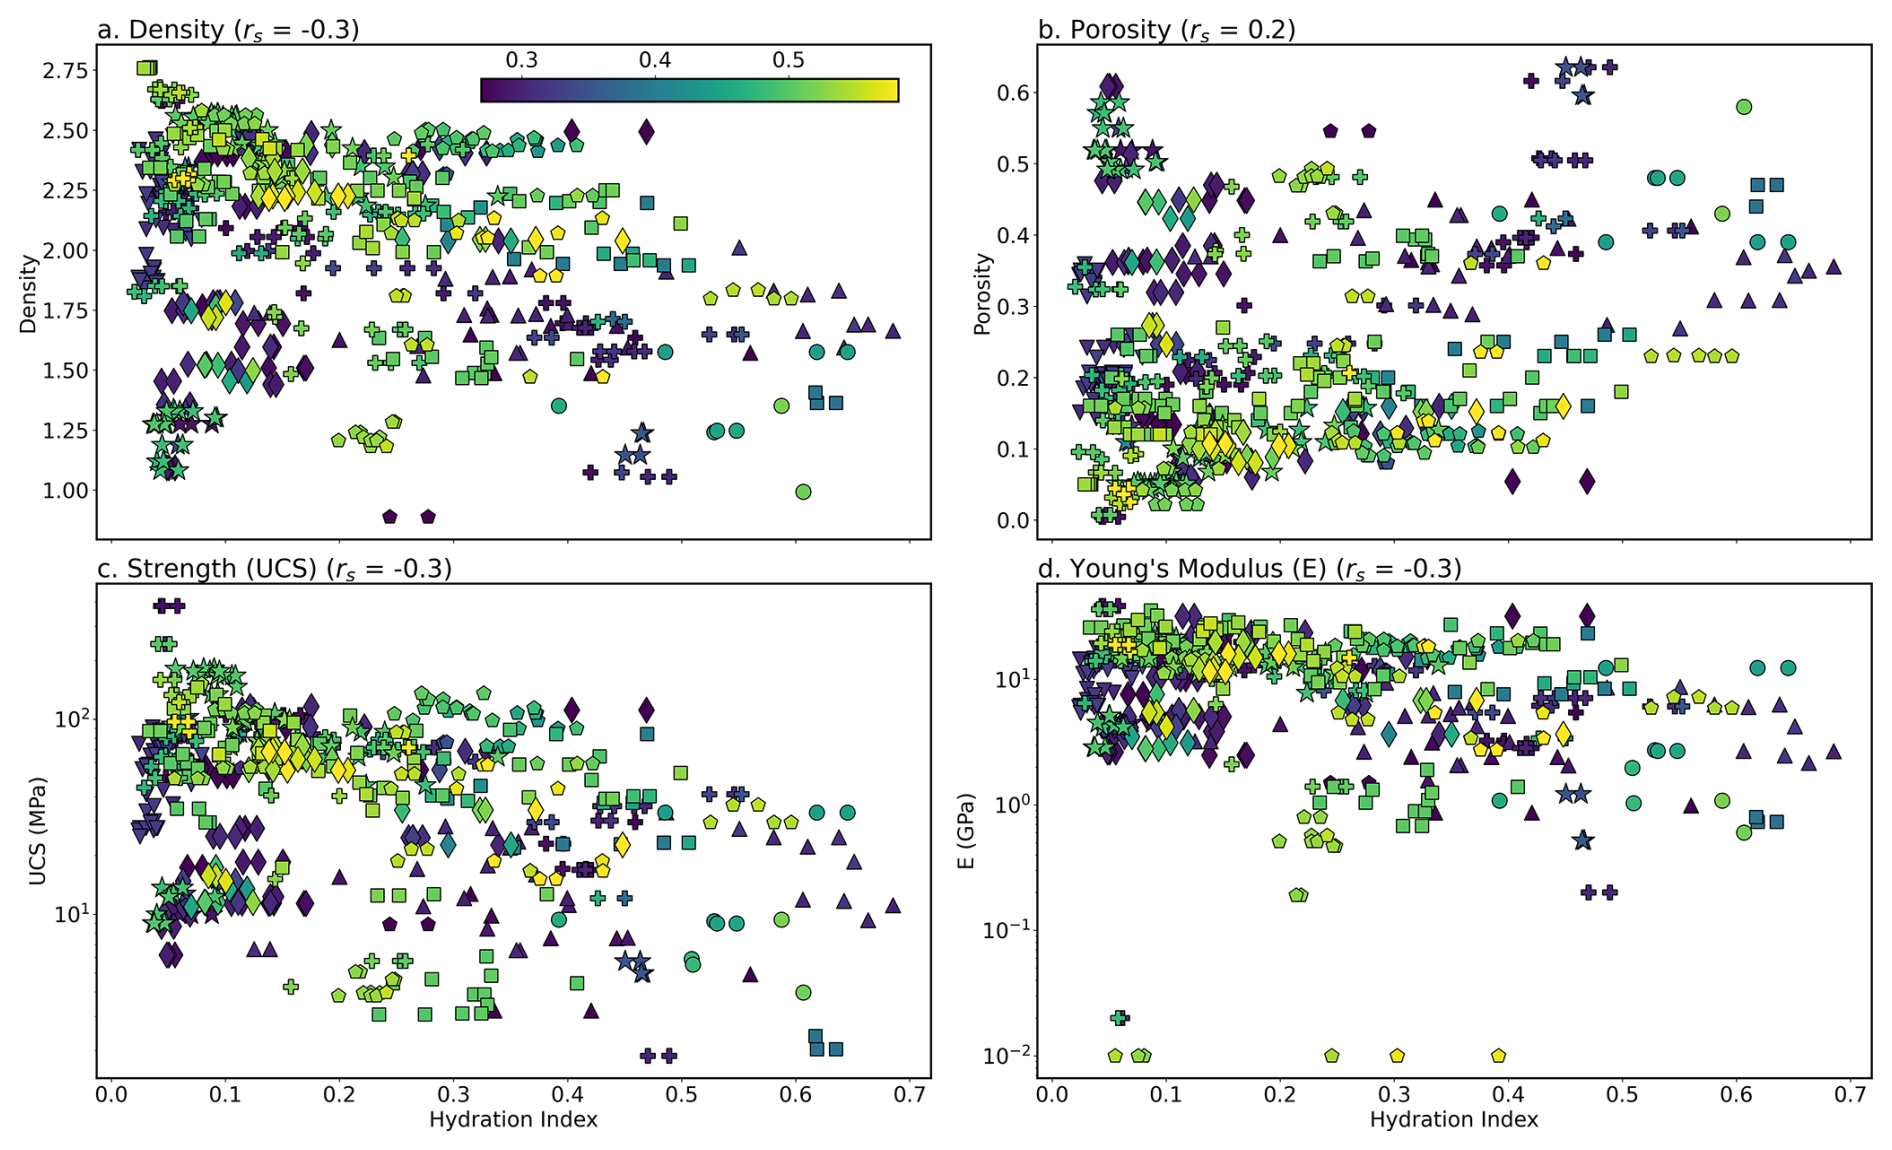
Figure 5Biplots of our hydration index and density (a), porosity (b), uniaxial compressive strength (UCS) (c) and Young's modulus (E) (d). These indicate that increasing hydration due to hydrothermal alteration and/or weathering tends to decrease density, UCS and E and slightly increase porosity. These trends are (unsurprisingly) quite weak, with Spearman rank correlation coefficients of 0.2–0.3. Colours indicate each sample's MFI, such that basalts are blue and andesites are red. Please refer to the legend of Fig. 3 for the symbols indicating each volcano.
Notably, all samples with spectral absorptions indicative of hydrothermal alteration also had prominent vOH and vOH+δH2O absorptions at ∼1400 and 1900 nm. This suggests that these combined features (our hydration index) can be used to broadly quantify the intensity of hydrothermal alteration, because primary volcanic lithologies tend not to contain hydrated or hydroxylated phases. Samples with higher hydration indices tended to be less dense (Fig. 5a) and have lower UCS and E (Fig. 5c–d) than counterparts with lower hydration indices. Porosity showed a more complex relationship to the hydration index (Fig. 5b), with a distinctive set of highly porous but non-hydrated samples (vesiculated lavas), and highly porous and hydrated samples.
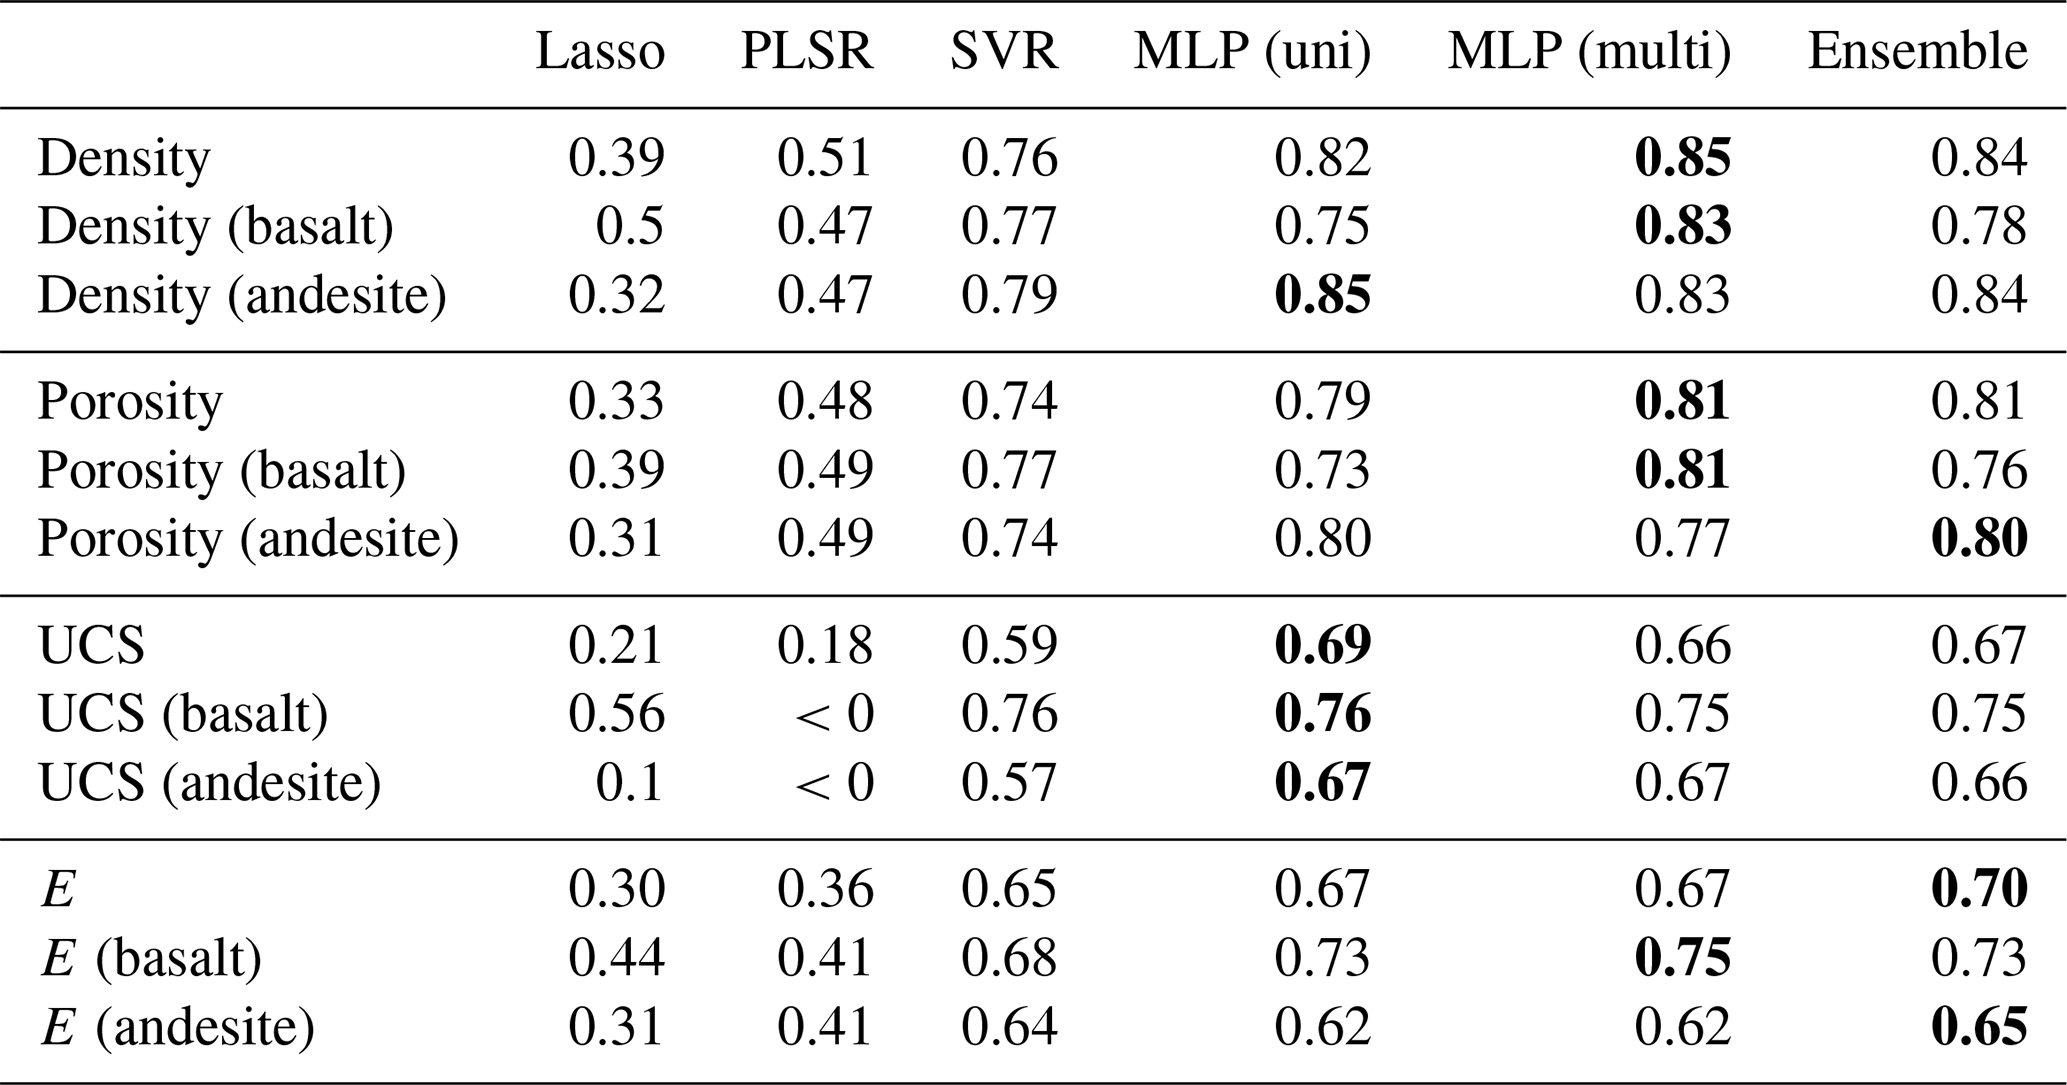
Table 2Five-fold cross validated R2 scores for the machine learning approaches trained and tested on: (1) basaltic (MFI <0.4), (2) andesitic (MFI >0.4), and (3) combined subsets. The best R2 scores for each property are indicated in bold. The ensemble models were constructed by combining the best-performing SVR and MLP models.
4.2 Rock property prediction
The tested machine learning models gave a wide range of prediction accuracies, with highly varied 5-fold cross-validation R2 scores (Table 2). Linear models (PLSR and Lasso) performed poorly, suggesting a highly non-linear relationship between spectral response and rock properties (Table 2). Support Vector Regression (SVR) and Multilayer Perceptron (MLP) models were able to learn the nonlinear relations, yielding 5-fold cross validated R2 scores between 0.5 and 0.85 for each of the rock properties. Deeper multilayer perceptrons (with 8 to 16 fully connected layers) performed best. The need for depth further emphasises the need to capture nonlinear links in the underlying data structure and modelling.
Models fit to principal component (PCA) transformed inputs (retaining 25 independent features), including the MLP models that theoretically work well with high-dimensionality input, performed better than models fit directly to concatenated spectra.
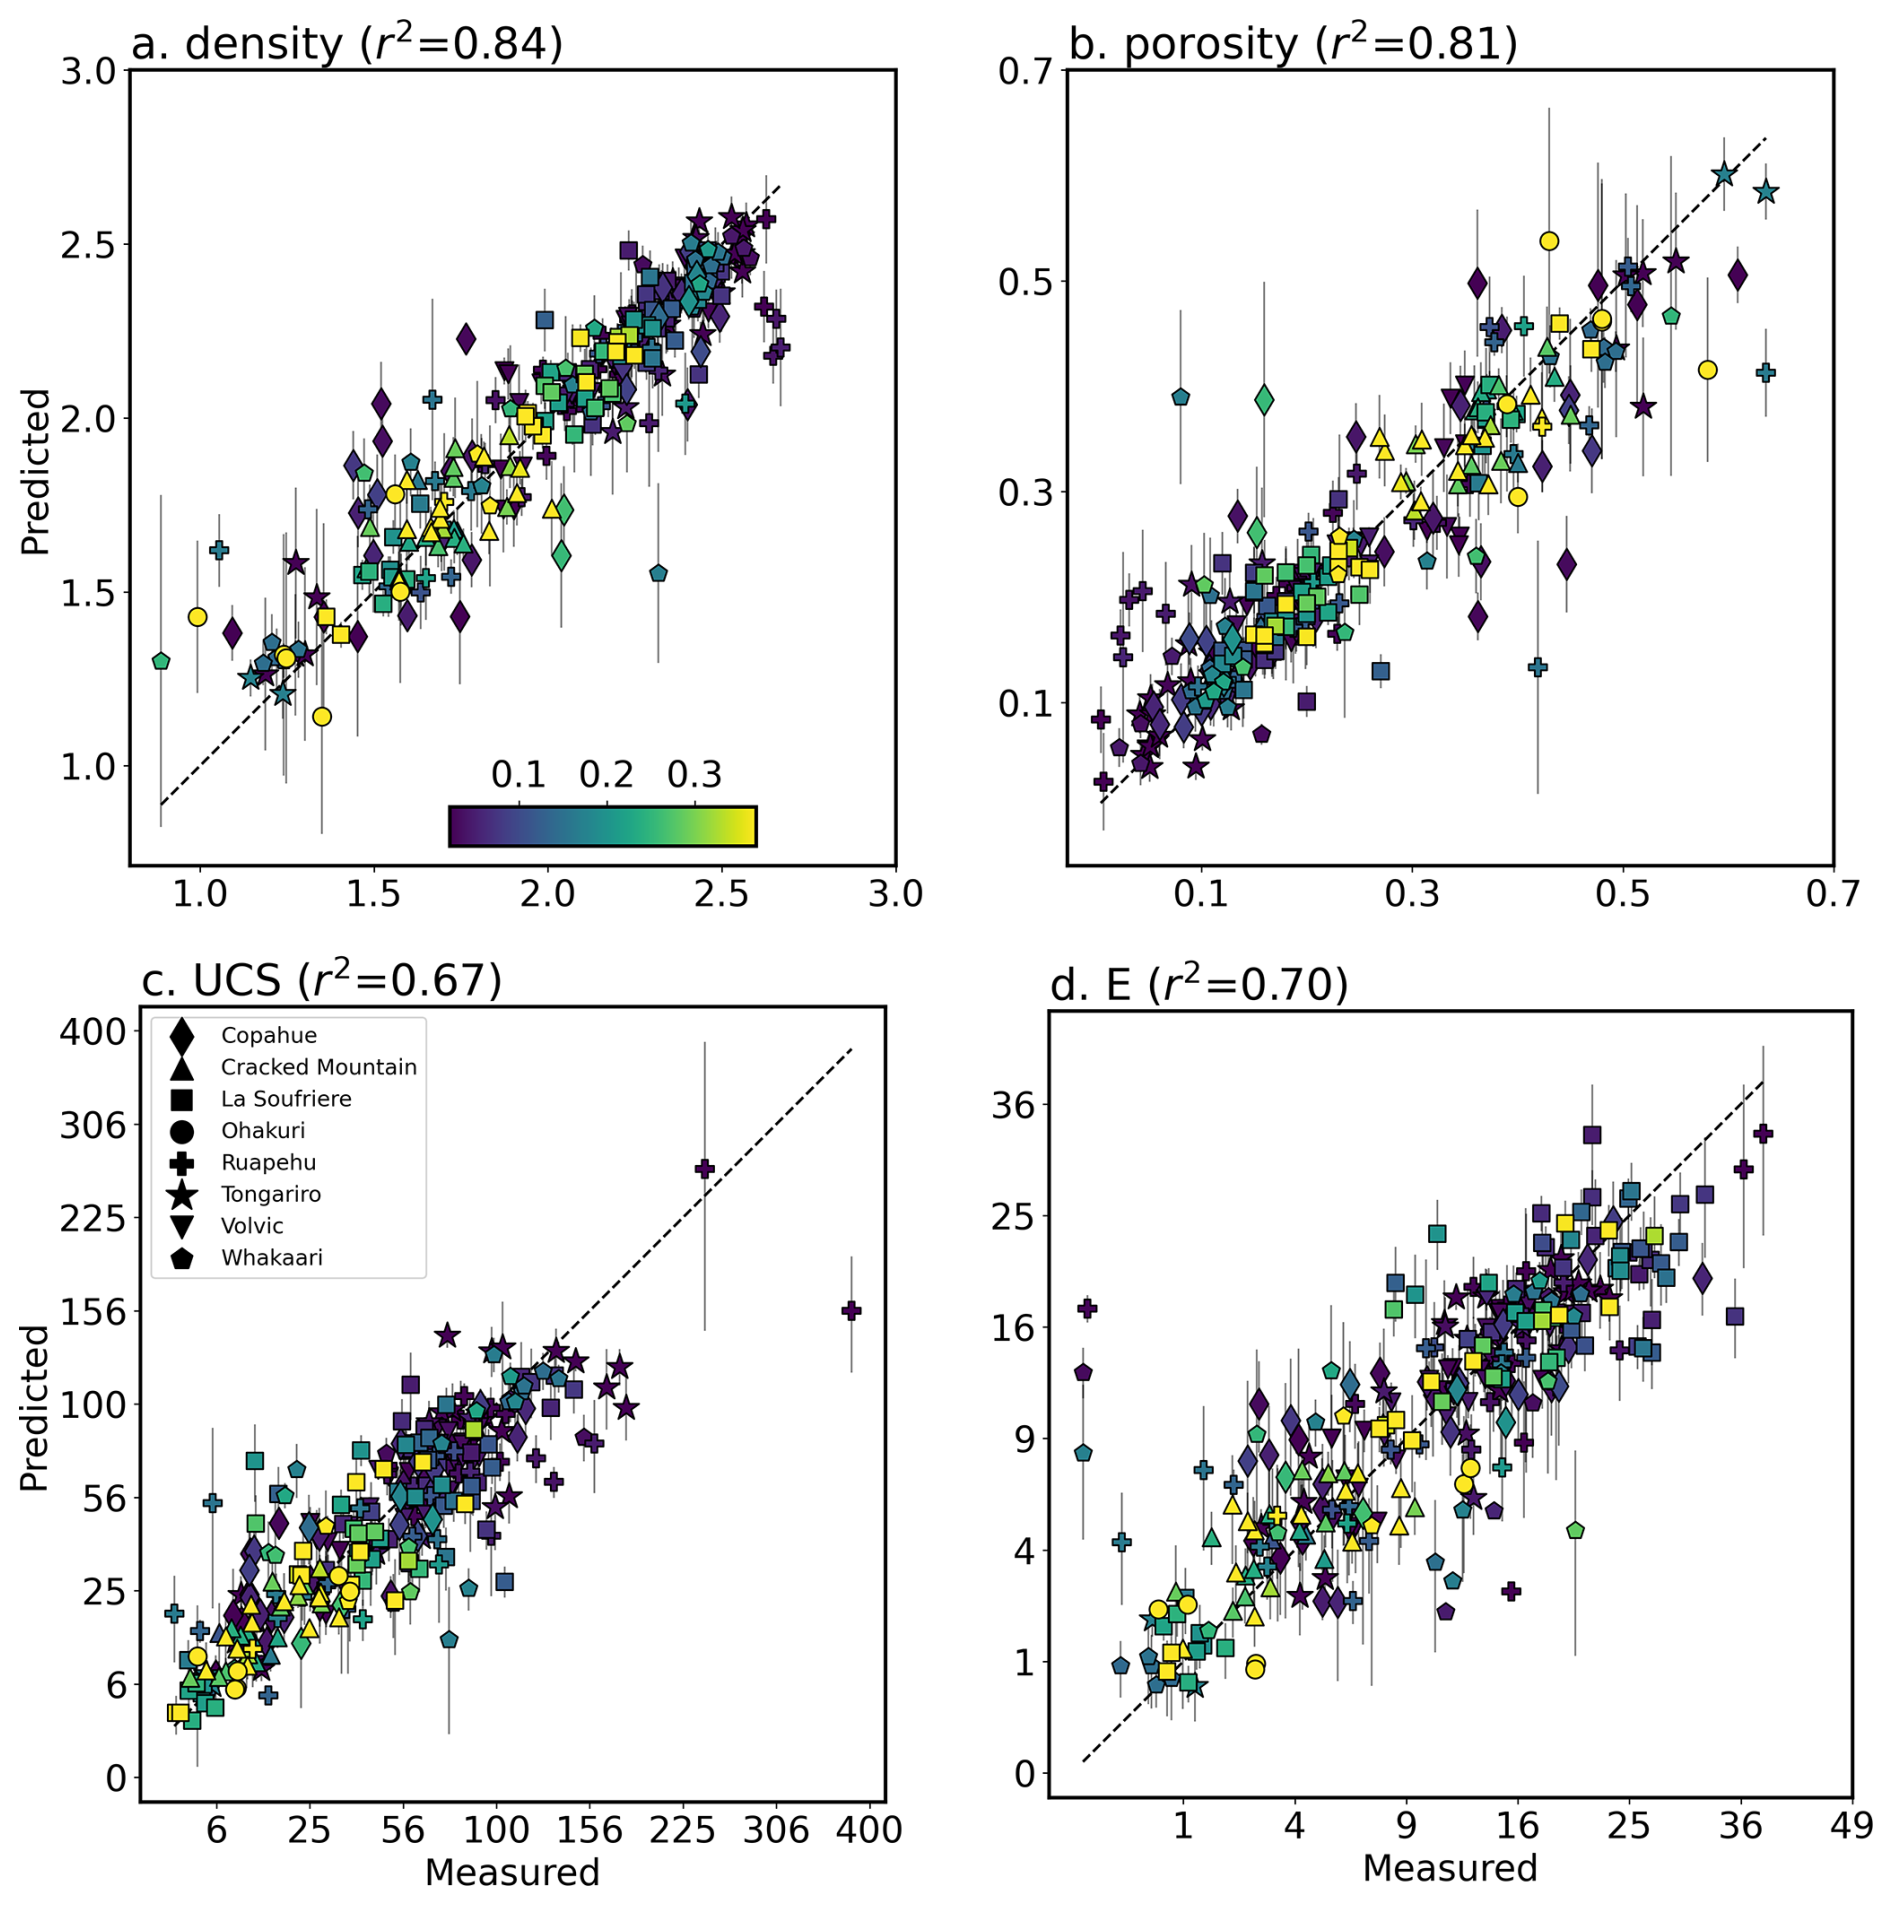
Figure 6Five-fold cross validation predictions (test-fold predictions for each of the five models) for density (a), porosity (b), uniaxial compressive strength (UCS) (c) and Young's modulus (E) (d) derived using our ensemble of SVM and multilayer perceptron models. The consistency of the ensemble predictions, quantified as the standard deviation of model predictions, are shown as 2σ error bars. The majority of the predictions are thus within error of the measured values, although there are also several notable outliers. Symbols denote the different volcanoes included in the dataset, and colours reflect the hydration index (Fig. 3). Note that the x and y axes in (c) and (d) use a square-root scale to better visualise data clustered around lower values of UCS and E.
No substantial difference in accuracy was observed between MLP models predicting a single output (i.e. univariate MLP models that predict a single rock property) and multivariate MLP models (that predict each of the four rock properties together). Ensemble predictions computed by averaging outputs from a set of nine manually selected (best-performing) SVM and MLP models show similar or slightly improved R2 scores (relative to the individual models). However, these ensemble models allow an estimate of prediction uncertainty (Fig. 6), based on the standard deviation (σ) of the individual model predictions. In most cases the measured rock property was within 2σ of the ensemble mean, though several notable outliers can also be identified. These include the prominently under-predicted UCS for one sample from Ruapehu (156 rather than 380 MPa), and over-estimated E for several samples from Ruapehu and Whakaari.
Interestingly, models trained and tested on the basaltic samples achieved higher R2 scores than equivalents trained and tested on andesitic ones (Table 2). This implies that the rock properties of basalts (in our dataset) were easier to predict than andesites, possibly due to the variability of the hydrothermally altered andesite relative to the basalts (which were mostly fresh or palagonitized).
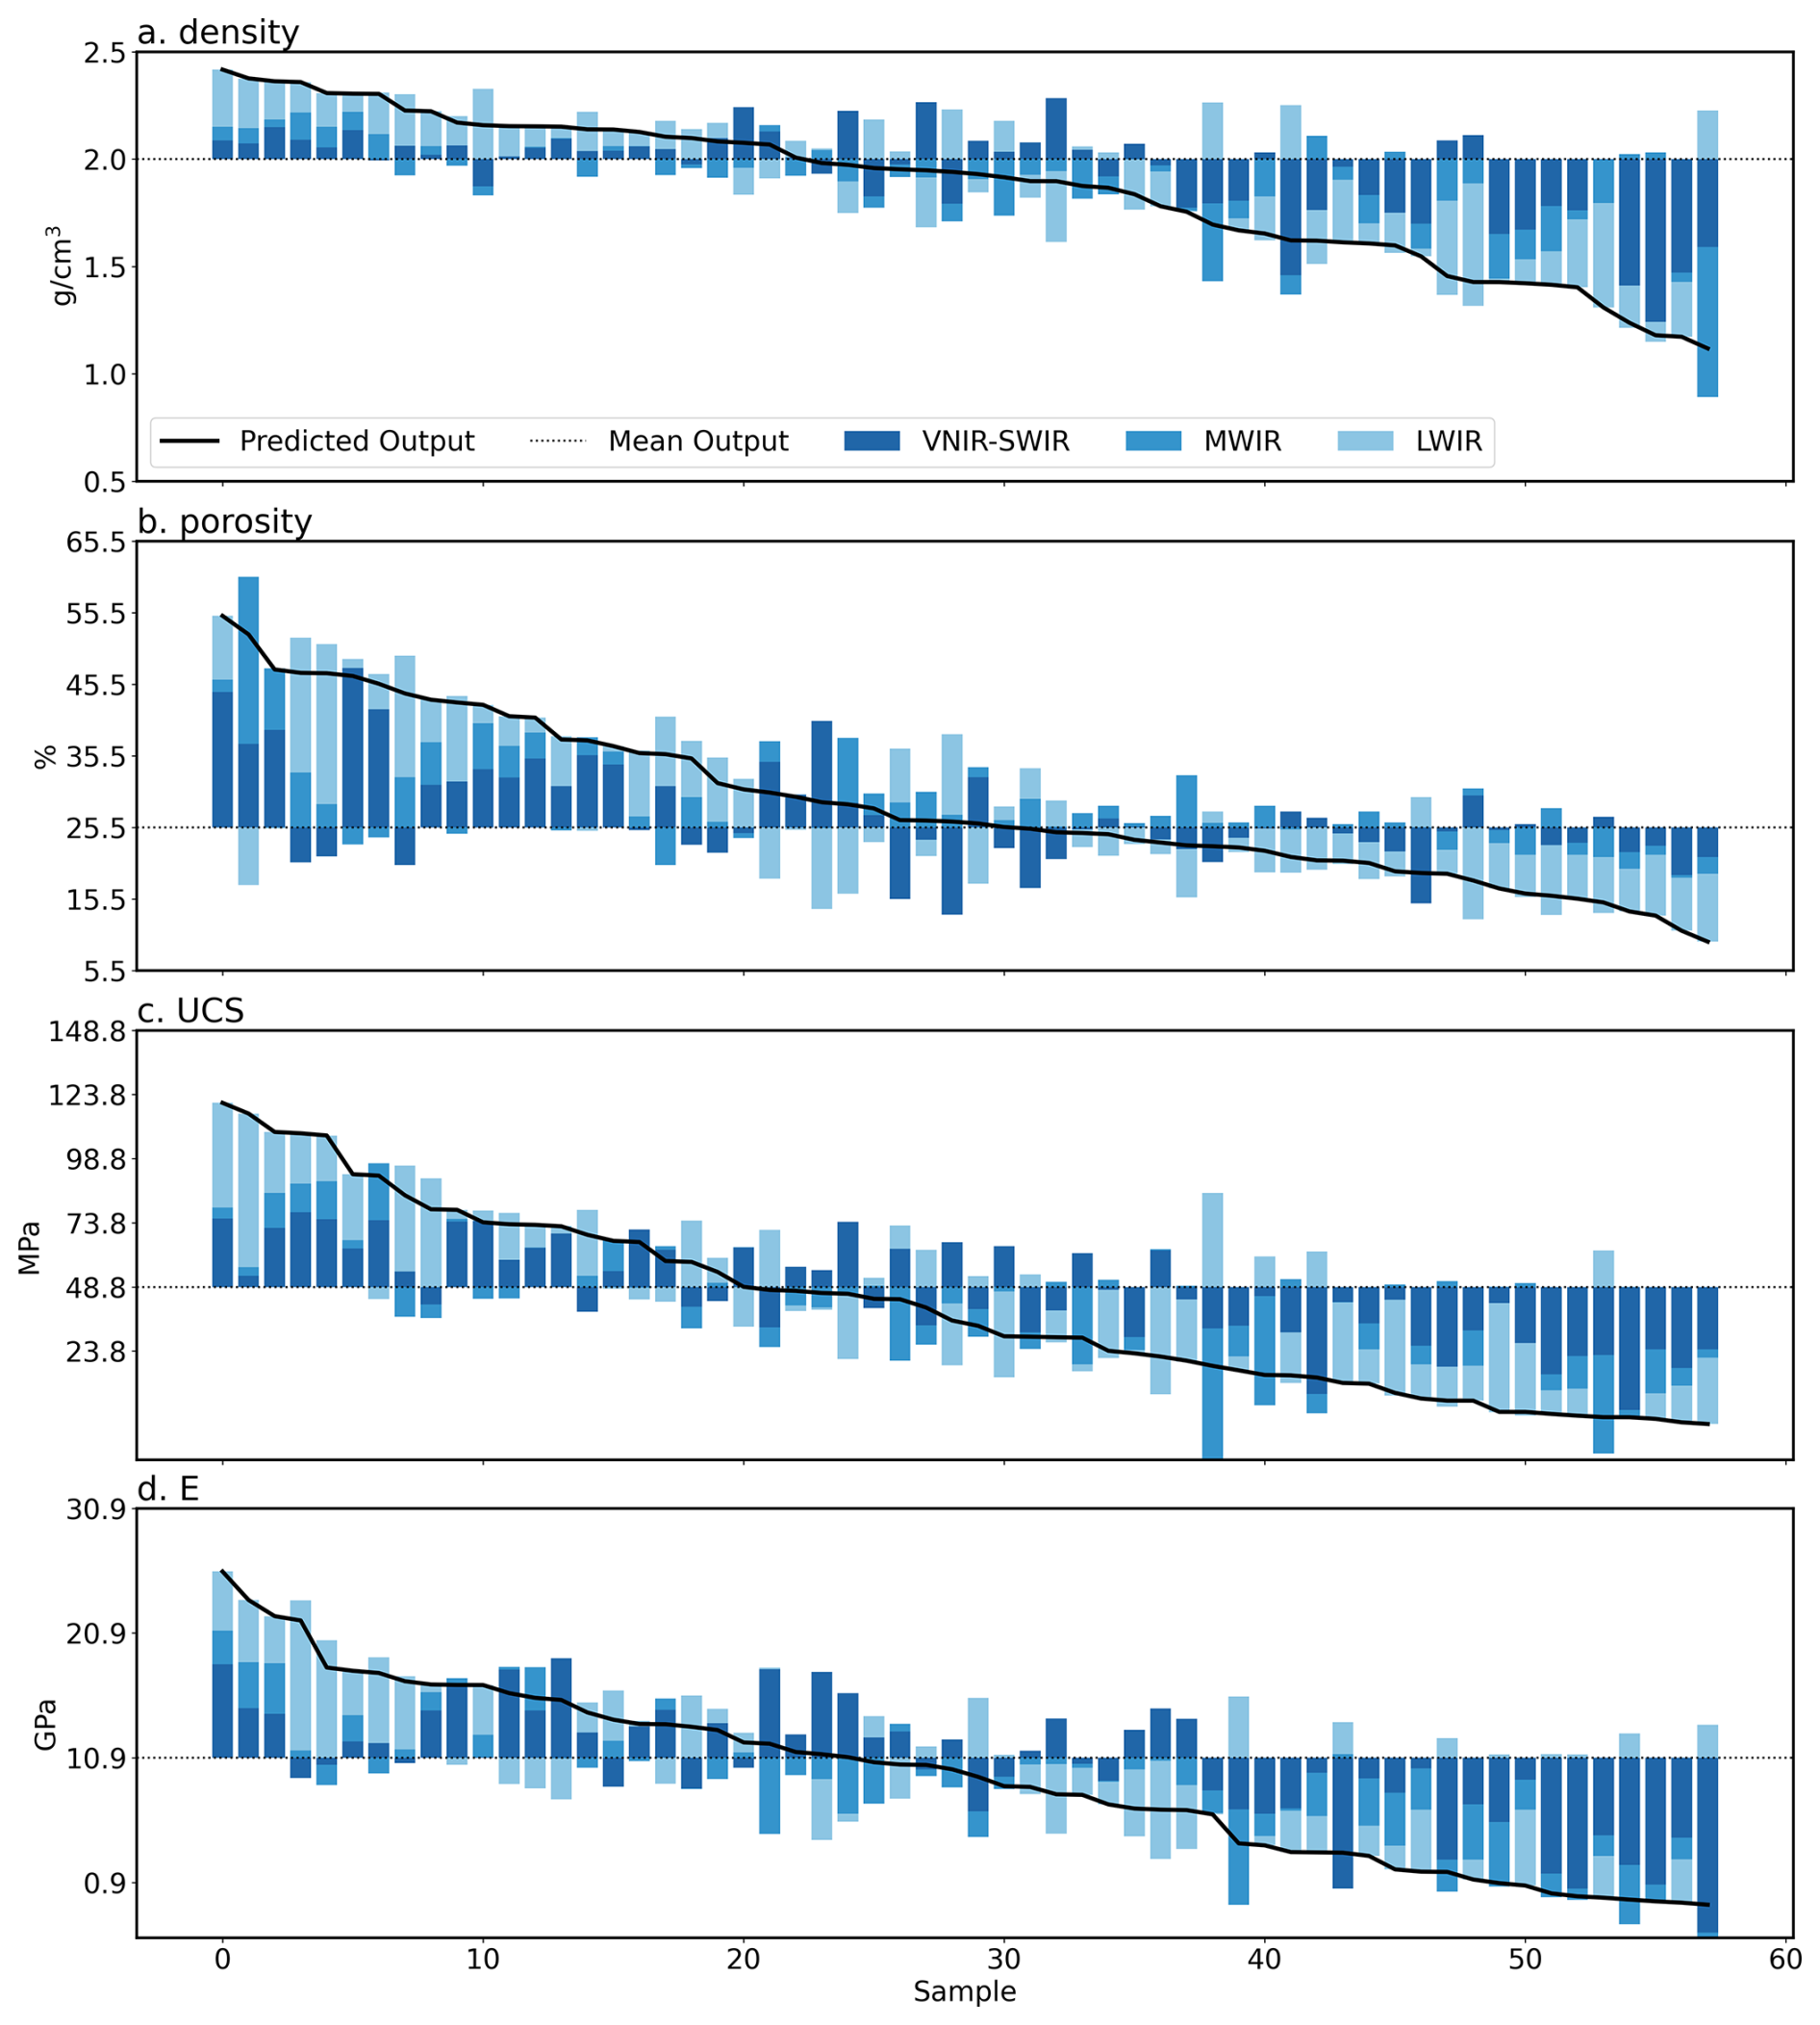
Figure 7Shapley values summed for each spectral range (VNIR-SWIR, MWIR, and LWIR) from the joint model (trained on both basalt and andesite) ensemble, indicating the cumulative contribution of each spectral range to predicted density (a), porosity (b), uniaxial compressive strength (UCS) (c) and Young's modulus (E) (d). Values for each property are sorted from high to low predicted value along the x axis. Higher predictions relative to the mean prediction (dotted line) for density, UCS, and E appear largely driven by LWIR features, while lower values are associated with strong negative contributions from the VNIR-SWIR range. These VNIR-SWIR bands push the predicted value down, and likely indicate the influence of SWIR active hydrated alteration minerals.
4.3 Important spectral ranges
Shapley values calculated for our ensemble predictions were aggregated to explore the contribution of each spectral range. This result exploits the additive nature of Shapley values: values derived for bands in the VNIR, SWIR, MWIR and LWIR ranges (respectively) can be summed to quantify the aggregate effect of each spectral range on each model prediction (Fig. 7). The results suggest the VNIR-SWIR range contributes most to predictions of density, UCS, and E that are below the expected (average) prediction, while the LWIR range makes a substantial contribution for above-average predictions. The opposite can be seen for porosity, where VNIR-SWIR bands mostly drive above average predictions. This pattern suggests the models learn to associate SWIR-active alteration minerals with reduced UCS, E, and density (and increased porosity).
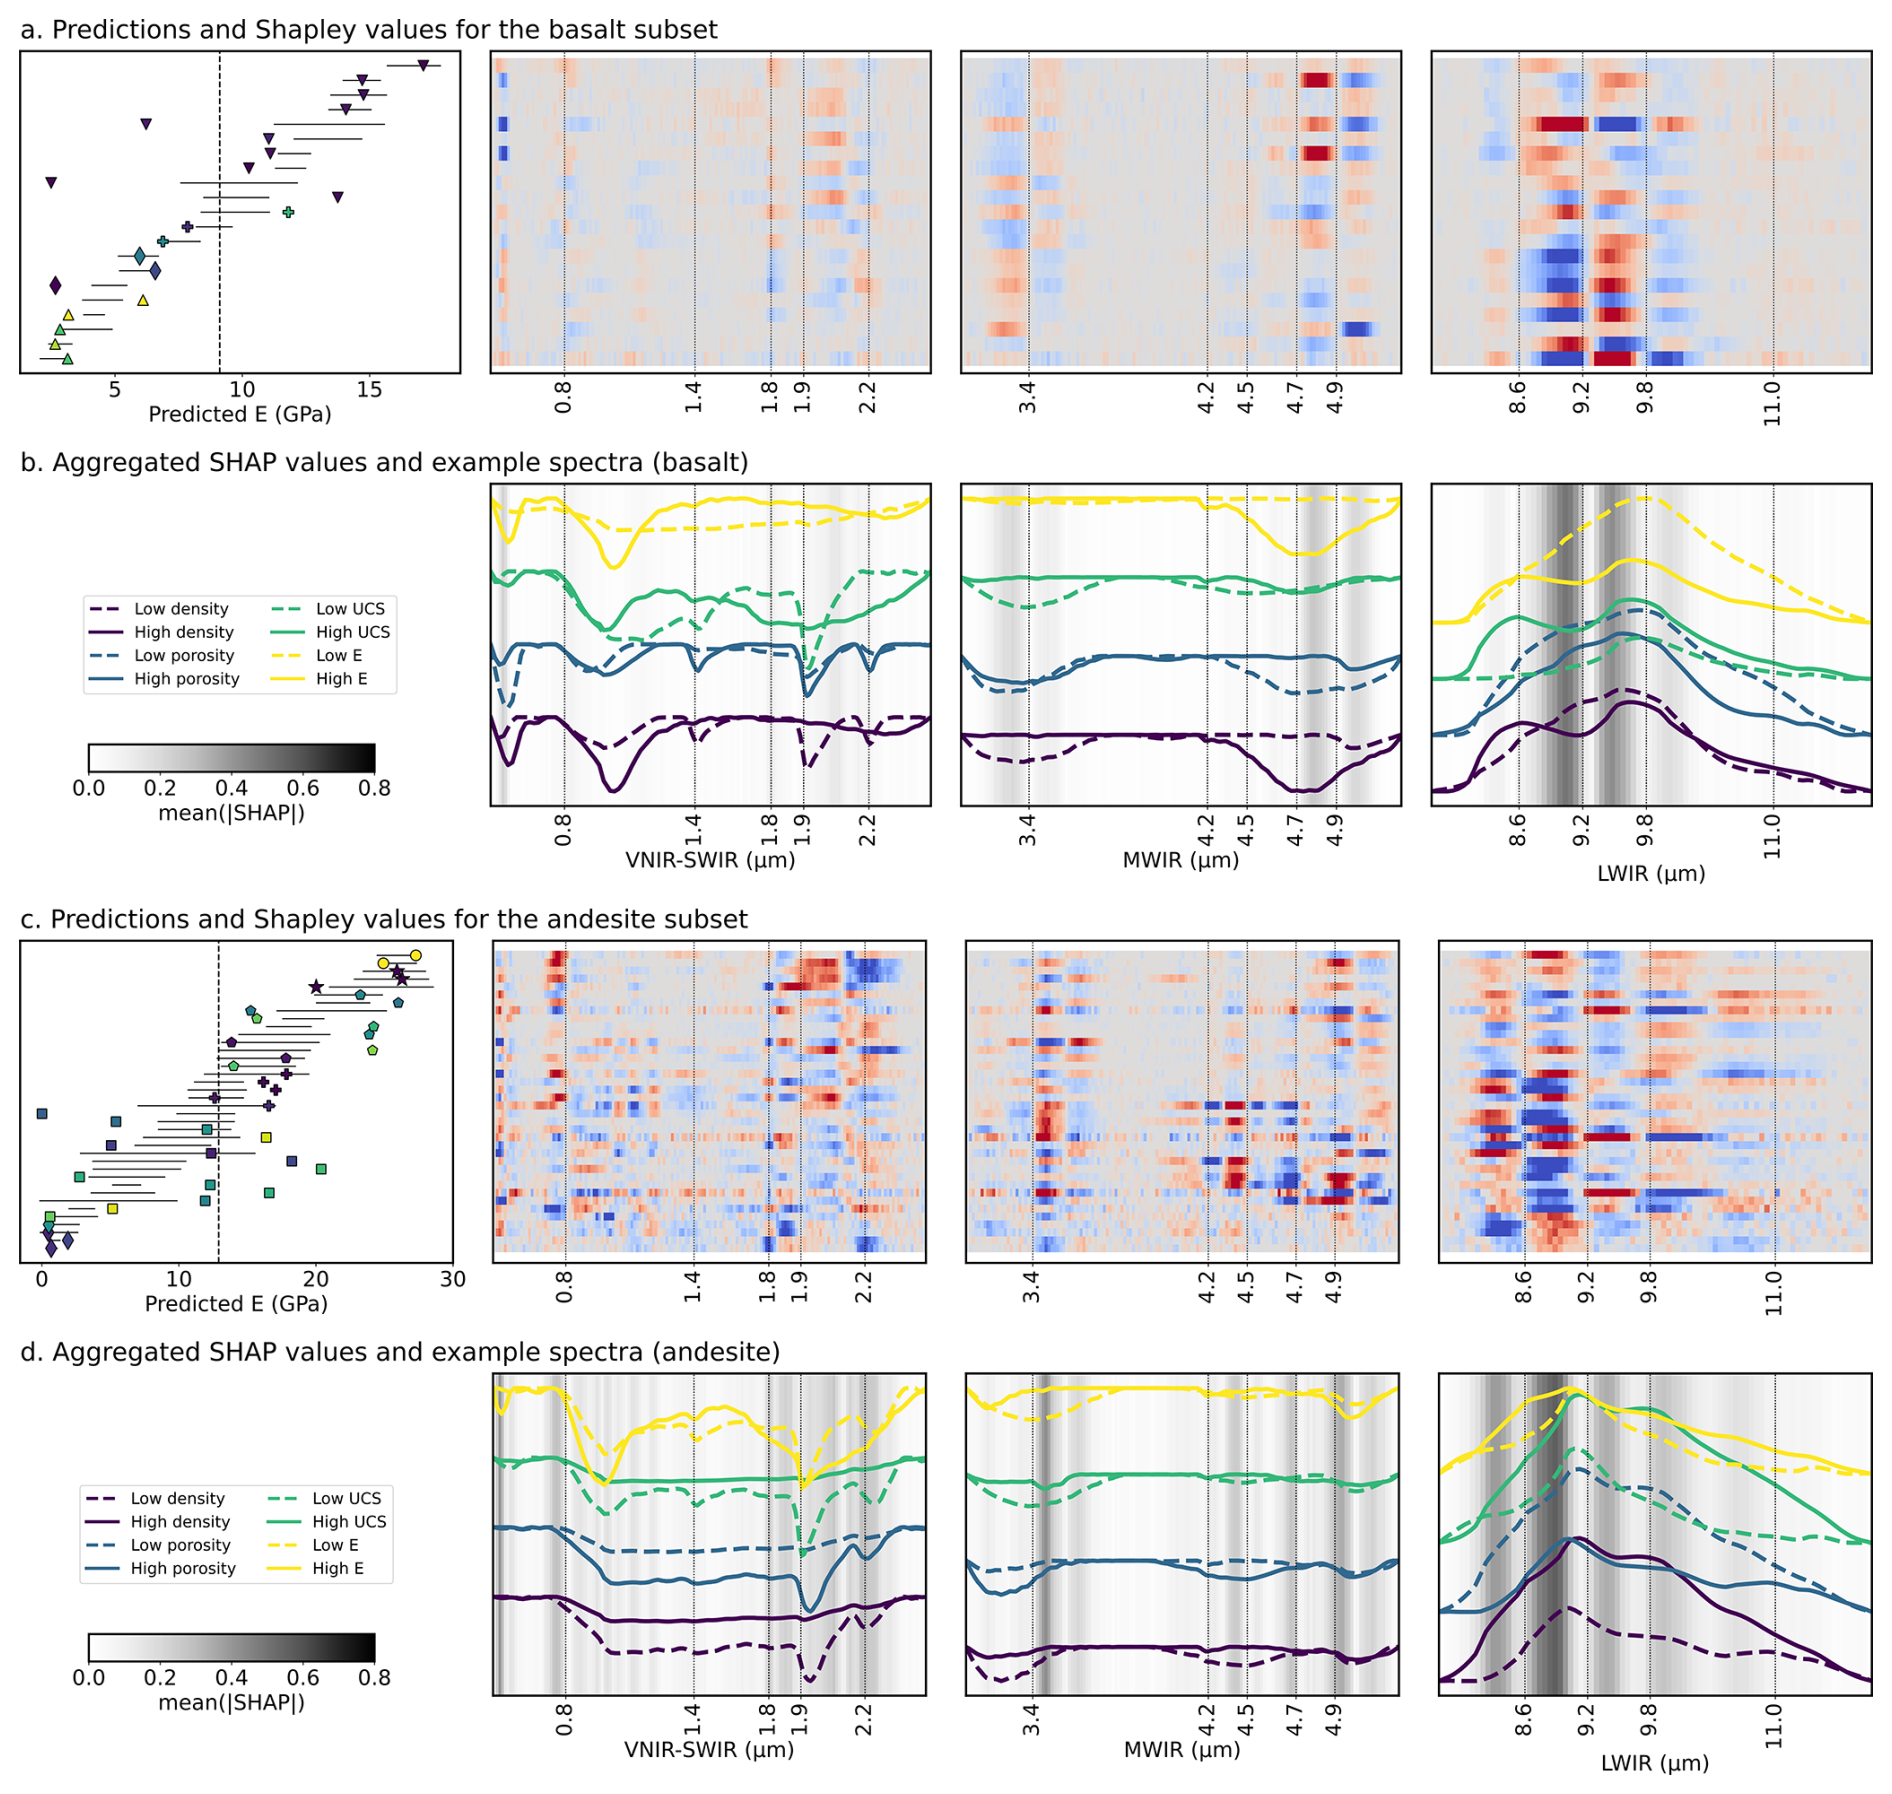
Figure 8Shapley values for our predictions of Young's modulus (E) in the basaltic (a, b) and andesitic (c, d) subsets. These were calculated using the ensemble models trained specifically on each subset (to remove aspects of the joint model focused on lithological distinction). Symbols in the left column indicate the measured property values from each volcano (cf. Fig. 3), while the black solid lines show the (2σ) range of values predicted by the ensemble. Deviations of model predictions from the mean (black dashed line) are the sum of the Shapley values along each row, such that blue values indicate bands that decreased the prediction, while red values indicate bands that increased it. Mean absolute SHAP values (b, d), summarising the sensitivity of the model to specific bands are also shown, with spectra from samples with high (solid) and low (dashed) property values for reference. These Shapley values highlight the correspondence of informative bands and inflection points (“shoulders”) in the spectra. Shapley value plots for the other mechanical properties can be found in the Supplement.
The non-aggregated (per-band) Shapley values can also constrain the specific spectral features that, in combination, contribute to increase or decrease each prediction relative to the mean. These values are shown in Fig. 8, though only for models trained on the basaltic (Fig. 8a) and andesitic (Fig. 8c) subsets separately (to reduce the influence of lithological effects). The results are difficult to interpret specifically because the predictions result from a complex balance between positive contributions from some bands (red) and negative contributions (blue) from others. Strongly negative Shapley values are often associated with 1800, 1900, and 2200 nm bands, which contain absorptions characteristic of hydrothermal alteration minerals (Table 1) for samples with low predicted E. Higher predictions also appear driven by these same bands, possibly due to an absence of absorption features in these wavelengths for these samples. In the MWIR, features at ∼3400 and between 4200 and 4900 nm appear important, with several “doublets” (spectrally adjacent high and low Shapley values) indicating a sensitivity to absorption shape (asymmetry) or position. The first of these bands (3400 nm) is likely related to v2HOH absorptions (though this absorption will have been heavily distorted by the hull correction applied during pre-processing). The latter bands (4200–4900 nm) are interpreted to relate to 2vSi-O absorptions from silicate minerals or 2vS-O absorptions from sulphates (Laukamp et al., 2021). The last of these (4900) may also have been shifted by the hull correction.
The Shapley values are easier to interpret after averaging their absolute value across all samples, to broadly highlight important spectral ranges. As mentioned also above, these ranges (Fig. 8b and d) match several expected mineralogical absorptions but, interestingly, also suggest that the model tends to focus on absorption “shoulders” rather than their centres, which we speculate could be due to a higher sensitivity of absorption shoulders to complex scattering effects.
Notably, many more VNIR, SWIR, and MWIR bands appear important for predictions made by the andesitic model than the basaltic one, presumably due to the more complex mineralogy of these samples. Informative bands between 8500 and 11 000 nm likely relate to vSiO absorptions, though the mixtures of silicate minerals and glassy matrix make these difficult to interpret specifically (Laukamp et al., 2021; Leight et al., 2024; Williams and Ramsey, 2024). Informative bands for the andesite model are lower wavelength (8500–9200 nm) than those for the basaltic model (8800–9800 nm), corroborating the change in silica polymerization between these sample sets.
Our five-fold cross validated ensemble predictions show that hyperspectral data can be used to explain ∼80 % of the variance in density and porosity and 65 %–70 % of the variance in strength (UCS) and Young's modulus (E), at least for the investigated basaltic and andesitic volcanic lithologies. The rapid acquisition and imaging abilities of hyperspectral sensors could thus be leveraged to better characterise complex volcanic rock masses, by extending laborious rock property measurements across large datasets from point spectrometers, hyperspectral core scanners and, potentially, outcrop hyperclouds (e.g., Thiele et al., 2024, 2022). The resulting thousands to millions of (ideally spatially continuous) property estimates would allow robust characterisation of the variability in volcanic rock matrix properties and, if combined with digitally mapped fracture information, provide some of the information needed to numerically predict larger-scale rock-mass properties (e.g., Cundall et al., 2008).
5.1 Predicting density and porosity
Our predictions of density and porosity were remarkably accurate (5-fold CV R2 score of 0.81 and 0.84 respectively), especially given the complex volcanic processes that influence these properties (vesiculation, pyroclastic processes, alteration, and fracturing). Interestingly, linear methods such as LASSO and PLSR predicted density and porosity poorly (Table 2), while the non-linear methods (MLP and SVR) achieved R2 scores >0.8. This suggests an inherently non-linear relationship between reflectance, density, and porosity. The high accuracies of the non-linear models also indicate that they are able to learn more than just the link between the hyperspectral data and mineralogy, as composition alone is expected to be a poor predictor of porosity (Pola et al., 2012). We thus suggest that the hyperspectral data contain information on porosity and density via the sensitivity of volume and surface scattering processes to pores at or near the sample's surface (Fig. 1). As described by the Hapke model, such wavelength-dependent scattering effects are likely especially relevant for longer wavelengths, supporting the Shapley values that show the LWIR data contributed significantly to many predictions (Fig. 7). Larger vesicles could also influence the spectra via the cavity effect (Fig. 1), especially in the LWIR infrared range (where they are expected to reduce reflectivity and increase the emissivity).
Our Shapley values highlight the important role of MWIR and LWIR bands, especially for high-density and low-porosity samples (Fig. 7). It is also striking that the VNIR-SWIR and LWIR ranges tend to be in opposition (cancelling each other out) for less extreme predictions (Fig. 7), emphasising the importance of the broad spectral range (VNIR-SWIR-MWIR-LWIR) covered by the dataset. The special attention our machine learning models appear to be giving to the shoulders of mineralogical absorption features (rather than their minima, which are typically related to composition) is also noteworthy. We tentatively suggest that this highlights the sensitivity of our models to the shape and asymmetry of absorption features, properties that are more significantly influenced by surface reflection and volume scattering processes that likely give information on surface roughness, grain size, and porosity.
5.2 Predicting uniaxial compressive strength and Young's modulus
The lower, but still informative, predictive power of our models for UCS and E indicates a complex relationship between spectral response, porosity, density, and alteration-related weakening (Heap et al., 2020a, or possibly strengthening in the case of silicification; Heap et al., 2021a). These non-linear models can explain ∼70 % of the total variance, noting that the R2 scores are likely substantially reduced by a small number of outliers (Fig. 6). This result is consistent with the combined models of Kereszturi et al. (2023), in which externally measured porosity and VNIR-SWIR information (characterising alteration mineralogy) explained 80 % of the variance in UCS. We suggest that externally measured porosity was needed by Kereszturi et al. (2023) due the lack of LWIR information, which limited their ability to directly predict porosity from the hyperspectral data (R2=0.4). Our dataset clearly did not have this limitation (Sect. 5.1), indirectly improving also our predictions of UCS.
Theoretical links between reflectance spectra and grain size properties could further influence our machine learning models, although we are unable to distinguish these effects from the previously discussed sensitivity to porosity. We also speculate that it is likely the model is learning to distinguish glass-rich (and hence stiff and brittle) samples from more crystallised ones, based on their distinctive LWIR expression (Williams and Ramsey, 2024). The sensitivity to glass could explain the broad informative wavelength range indicated by the Shapley values in the LWIR (Fig. 8).
The remaining (unpredicted) variance in UCS and E could be attributed to micro-fractures, which will serve to reduce E and UCS (Griffiths et al., 2017; Swanson et al., 2020; Takemura et al., 2003) with negligible spectral effect. Such fractures could, for example, explain overpredicted outliers in Figs. 6 and 8. Micro-fractures are less likely to explain cases where our model makes under-predictions however, including the notable outlier in Fig. 6c where the predicted UCS is ∼250 MPa too low.
5.3 Hyperspectral quantification of hydrothermal alteration
VNIR-SWIR hyperspectral data are particularly useful for identifying hydrothermal alteration, discriminating between different alteration types, and vectoring towards mineral deposits (e.g., Cudahy et al., 2008; Laukamp et al., 2021, 2011; Portela et al., 2021). Argillic and advanced argillic alteration can be characterised based on the distinctive spectral signature of sulphates, kaolinite, and other clay minerals (Fig. 4). This could be further refined by detailed investigation of the position of these respective absorption features, to distinguish between e.g., kaolinite and dickite or illite and smectite (e.g., Kereszturi et al., 2020; Simpson and Rae, 2018).
Our results also show that the combined depth of v-OH and v+δH-O-H absorptions can be used as a broad but useful proxy for hydrothermal alteration in non-weathered crystallised volcanic rocks, as these lithologies tend to be initially water poor. That said, this index likely cannot identify hydrothermal alteration in tuff units, which can be hydrated during or shortly after formation (e.g., palagonite). Our hydration index shows a weak correlation with physical and mechanical properties (Fig. 5), with substantial unexplained variance that emphasises the important additional influence of microstructure (porosity, grain-size, glass content, and micro-fractures).
5.4 Applications and future directions
Unlike other commonly applied proxies for physical and mechanical rock properties (e.g., Schmidt hardness, field estimates for porosity, etc.), hyperspectral data can be collected remotely using imaging techniques. This imaging capability unlocks several intriguing possibilities.
Firstly, our machine learning models could be applied to hyperspectral imagery of hand-sample sized specimens acquired during geotechnical fieldwork to create prior predictions of their physical and mechanical property variability. The locations of extracted mechanical test cores could then be optimized to cover the range of expected variability, improving the statistical representativity of the resulting data. Such an approach would provide an opportunity to independently validate our model predictions, and provide training data for future refinements, while helping ensure statistically representative characterisation of heterogeneous rock masses.
Secondly, imaging hyperspectral sensors can also be deployed on tripod, crewed, and uncrewed aircraft to remotely capture ∼1 to 10 cm resolution data over large areas of exposed rock. This resolution is comparable to the scale of laboratory tests for physical and mechanical properties, but with a large spatial extent that could enable detailed rock-mass characterisation, through the integration of remotely estimated physical and mechanical property estimates, remotely mapped fracture information (e.g., Dewez et al., 2016; Thiele et al., 2017), and numerical simulation techniques (e.g., Cundall et al., 2008; Ivars et al., 2011).
Finally, we caution that further development and the acquisition of a larger, more diverse training database is undoubtedly needed before this approach can be confidently applied to industrial applications, especially for outcrop mapping. The lower-quality of hyperspectral data acquired outside of laboratory conditions and the variety of weathering processes that can influence outcrop surfaces, require approaches that are robust and carefully validated. However the required sensors and acquisition techniques already exist, suggesting cm-scale mapping of outcrop physical and mechanical properties is achievable, with appropriate site-specific calibration and validation.
Our machine learning models demonstrate that hyperspectral data can be used as a proxy for the physical and mechanical properties of the sampled andesitic and basaltic volcanic rocks, with cross validated R2 scores of 0.7 to 0.8. Physical properties, mechanical behaviour, and reflection spectra are influenced by a complex combination of primary and secondary (alteration or weathering) mineralogy, glass content, porosity, grain size, and surface roughness. Disentangling the influence of these properties on spectral reflectance (for complex mixtures; i.e. rocks) remains challenging, but our findings demonstrate that machine learning techniques can be used to find informative relationships between spectral and physical and mechanical properties. Further work is required to assess how robust these predictions are, and if they can be generalised or are best applied after site-specific training. We are confident that our results (and other recent work by e.g., Bakun-Mazor et al., 2024; Kereszturi et al., 2023) show how hyperspectral data can serve as an informative and easy-to-acquire proxy for the physical and mechanical properties of volcanic rocks.
The data and code used for this study are available in the Supplement.
The supplement related to this article is available online at https://doi.org/10.5194/se-16-1249-2025-supplement.
ST, GK, RG and MH all took part in the conceptualization and data collection for this paper. MK, MT and MRC also helped with data collection. ST and AVK built the machine learning models and performed the associated Shapley analyses, while ALR helped establish the underlying theory. ST wrote the initial manuscript draft, with support from ALR and AVK. All authors contributed to the subsequent editing and review.
Publisher's note: Copernicus Publications remains neutral with regard to jurisdictional claims made in the text, published maps, institutional affiliations, or any other geographical representation in this paper. While Copernicus Publications makes every effort to include appropriate place names, the final responsibility lies with the authors. Views expressed in the text are those of the authors and do not necessarily reflect the views of the publisher.
Samuel T. Thiele and Akshay V. Kamath were supported by funding from the European Union's Horizon Europe research and innovation programme under grant agreement no. 101058483 and from UK Research and Innovation. Gabor Kereszturi was supported by the Rutherford Discovery Fellowship of the Royal Society of New Zealand – Te Aparangi (“Caught in action – volcano surveillance with hyperspectral remote sensing”; RDF-MAU2003). Michael J. Heap was supported by ANR grant MYGALE (“Modelling the phYsical and chemical Gradients of hydrothermal ALteration for warning systems of flank collapse at Explosive volcanoes”; ANR-21-CE49-0010) and a European Research Council Synergy Grant (ERC-ROTTnROCK-101118491). Michael J. Heap also acknowledges support from the Institut Universitaire de France (IUF). Marina Rosas-Carbajal and Matías Tramontini were supported by the TelluS Program of INSU-CNRS (“Edifice structure and rock strength assessment of Copahue volcano (Argentina/Chile): the role of hyperACidic hydrothermal alteration in VolCano stability (AC/VC))”. The hyperspectral sensors used for this study were acquired through funding from the Helmholtz Institute Freiberg for Resource Technology, European Regional Development Fund and the Land of Saxony.
This paper was edited by Sylvie Demouchy and reviewed by McLean Trott and Dagan Bakun-Mazor.
Arens, F., Coco, A., Gottsmann, J., Hickey, J., and Kilgour, G.: Multiphysics modeling of volcanic unrest at Mt. Ruapehu (New Zealand), Geochem. Geophys. Geosystems, 23, e2022GC010572, https://doi.org/10.1029/2022GC010572, 2022.
Aubry, T. J., Farquharson, J. I., Rowell, C. R., Watt, S. F. L., Pinel, V., Beckett, F., Fasullo, J., Hopcroft, P. O., Pyle, D. M., Schmidt, A., and Sykes, J. S.: Impact of climate change on volcanic processes: current understanding and future challenges, Bull. Volcanol., 84, 58, https://doi.org/10.1007/s00445-022-01562-8, 2022.
Bakun-Mazor, D., Ben-Ari, Y., Marco, S., and Ben-Dor, E.: Predicting mechanical properties of carbonate rocks using spectroscopy across 0.4–12 µm, Rock Mech. Rock Eng., 57, 8951–8968, https://doi.org/10.1007/s00603-024-04035-w, 2024.
Chandrasekhar, S.: Radiative transfer, Dover Publications, New York, ISBN 978-0-486-60590-6, 1960.
Cudahy, T., Jones, M., Thomas, M., Laukamp, C., Caccetta, M., Hewson, R., Rodger, A., and Verrall, M.: Next generation mineral mapping: Queensland airborne HyMap and satellite ASTER surveys 2006–2008, Publicly Available Rep. P2007364, Perth, 152, 2008.
Cundall, P. A., Pierce, M. E., and Mas Ivars, D.: Quantifying the size effect of rock mass strength, in: SHIRMS 2008: Proceedings of the First Southern Hemisphere International Rock Mechanics Symposium, Australian Centre for Geomechanics, 3–15, 2008.
del Potro, R. and Hürlimann, M.: A comparison of different indirect techniques to evaluate volcanic intact rock strength, Rock Mech. Rock Eng., 42, 931–938, https://doi.org/10.1007/s00603-008-0001-5, 2009.
Dewez, T. J. B., Girardeau-Montaut, D., Allanic, C., and Rohmer, J.: Facets: a cloudcompare plugin to extract geological planes from unstructured 3D point clouds, ISPRS Int. Arch. Photogramm. Remote Sens. Spat. Inf. Sci., XLI-B5, 799, https://doi.org/10.5194/isprsarchives-xli-b5-799-2016, 2016.
Dinçer, I., Acar, A., Çobanoğlu, I., and Uras, Y.: Correlation between Schmidt hardness, uniaxial compressive strength and Young's modulus for andesites, basalts and tuffs, Bull. Eng. Geol. Environ., 63, 141–148, https://doi.org/10.1007/s10064-004-0230-0, 2004.
Farquharson, J., Heap, M. J., Varley, N. R., Baud, P., and Reuschlé, T.: Permeability and porosity relationships of edifice-forming andesites: a combined field and laboratory study, J. Volcanol. Geotherm. Res., 297, 52–68, https://doi.org/10.1016/j.jvolgeores.2015.03.016, 2015.
Foster, S., Chilton, J., Nijsten, G. J., and Richts, A.: Groundwater – a global focus on the local resource, Curr. Opin. Environ. Sustain., 5, 685–695, https://doi.org/10.1016/j.cosust.2013.10.010, 2013.
Franzosi, F., Crippa, C., Derron, M. H., Jaboyedoff, M., and Agliardi, F.: Slope-scale remote mapping of rock mass fracturing by modeling cooling trends derived from infrared thermography, Remote Sens., 15, 4525, https://doi.org/10.3390/rs15184525, 2023.
Griffiths, L., Heap, M.J., Baud, P., and Schmittbuhl, J.: Quantification of microcrack characteristics and implications for stiffness and strength of granite, Int. J. Rock Mech. Min. Sci., 100, 138–150, https://doi.org/10.1016/j.ijrmms.2017.10.013, 2017.
Hapke, B.: Bidirectional reflectance spectroscopy: 1. Theory, J. Geophys. Res.-Solid Earth, 86, 3039–3054, https://doi.org/10.1029/JB086iB04p03039, 1981.
Hapke, B.: Bidirectional reflectance spectroscopy: 3. Correction for macroscopic roughness, Icarus, 59, 41–59, https://doi.org/10.1016/0019-1035(84)90054-X, 1984.
Hapke, B.: Bidirectional reflectance spectroscopy: 4. The extinction coefficient and the opposition effect, Icarus, 67, 264–280, https://doi.org/10.1016/0019-1035(86)90108-9, 1986.
Hapke, B.: Theory of reflectance and emittance spectroscopy, Topics in Remote Sensing, Cambridge University Press, Cambridge, https://doi.org/10.1017/CBO9780511524998, 1993.
Hapke, B.: Bidirectional reflectance spectroscopy: 5. The coherent backscatter opposition effect and anisotropic scattering, Icarus, 157, 523–534, https://doi.org/10.1006/icar.2002.6853, 2002.
Hapke, B.: Bidirectional reflectance spectroscopy: 6. Effects of porosity, Icarus, 195, 918–926, https://doi.org/10.1016/j.icarus.2008.01.003, 2008.
Hapke, B.: Theory of reflectance and emittance spectroscopy, Cambridge University Press, 2012.
Hardgrove, C. J., Rogers, A. D., Glotch, T. D., and Arnold, J. A.: Thermal emission spectroscopy of microcrystalline sedimentary phases: effects of natural surface roughness on spectral feature shape, J. Geophys. Res.-Planets, 121, 542–555, https://doi.org/10.1002/2015JE004919, 2016.
Harnett, C. E. and Heap, M. J.: Mechanical and topographic factors influencing lava dome growth and collapse, J. Volcanol. Geotherm. Res., 420, 107398, https://doi.org/10.1016/j.jvolgeores.2021.107398, 2021.
Harnett, C. E., Kendrick, J. E., Lamur, A., Thomas, M. E., Stinton, A., Wallace, P. A., Utley, J. E. P., Murphy, W., Neuberg, J., and Lavallée, Y.: Evolution of mechanical properties of lava dome rocks across the 1995–2010 eruption of Soufrière Hills volcano, Montserrat, Front. Earth Sci., 7, https://doi.org/10.3389/feart.2019.00007, 2019.
Heap, M. J. and Violay, M. E. S.: The mechanical behaviour and failure modes of volcanic rocks: a review, Bull. Volcanol., 83, 33, https://doi.org/10.1007/s00445-021-01447-2, 2021.
Heap, M. J., Gravley, D. M., Kennedy, B. M., Gilg, H. A., Bertolett, E., and Barker, S. L. L.: Quantifying the role of hydrothermal alteration in creating geothermal and epithermal mineral resources: the Ohakuri ignimbrite (Taupō Volcanic Zone, New Zealand), J. Volcanol. Geotherm. Res., 390, 106703, https://doi.org/10.1016/j.jvolgeores.2019.106703, 2020a.
Heap, M. J., Villeneuve, M., Albino, F., Farquharson, J. I., Brothelande, E., Amelung, F., Got, J. L., and Baud, P.: Towards more realistic values of elastic moduli for volcano modelling, J. Volcanol. Geotherm. Res., 390, 106684, https://doi.org/10.1016/j.jvolgeores.2019.106684, 2020b.
Heap, M. J., Baumann, T., Gilg, H. A., Kolzenburg, S., Ryan, A. G., Villeneuve, M., Russell, J. K., Kennedy, L. A., Rosas-Carbajal, M., and Clynne, M. A.: Hydrothermal alteration can result in pore pressurization and volcano instability, Geology, 49, 1348–1352, https://doi.org/10.1130/G49063.1, 2021a.
Heap, M. J., Baumann, T. S., Rosas-Carbajal, M., Komorowski, J. C., Gilg, H. A., Villeneuve, M., Moretti, R., Baud, P., Carbillet, L., Harnett, C., and Reuschlé, T.: Alteration-induced volcano instability at La Soufrière de Guadeloupe (Eastern Caribbean), J. Geophys. Res.-Solid Earth, 126, e2021JB022514, https://doi.org/10.1029/2021JB022514, 2021b.
Heap, M. J., Lavallée, Y., Petrakova, L., Baud, P., Reuschlé, T., Varley, N. R., and Dingwell, D. B.: Microstructural controls on the physical and mechanical properties of edifice‐forming andesites at Volcán de Colima, Mexico, Journal of Geophysical Research: Solid Earth, 119, 2925–2963, 2014.
Heap, M. J., Troll, V. R., Harris, C., Gilg, H. A., Moretti, R., Rosas-Carbajal, M., Komorowski, J. C., and Baud, P.: Whole-rock oxygen isotope ratios as a proxy for the strength and stiffness of hydrothermally altered volcanic rocks, Bull. Volcanol., 84, 74, https://doi.org/10.1007/s00445-022-01588-y, 2022.
Hickey, J., Pascal, K., Head, M., Gottsmann, J., Fournier, N., Hreinsdottir, S., and Syers, R.: Magma pressurization sustains ongoing eruptive episode at dome-building Soufrière Hills volcano, Montserrat, Geology, 50, 1261–1265, https://doi.org/10.1130/G50239.1, 2022.
Hoek, E. and Diederichs, M. S.: Empirical estimation of rock mass modulus, Int. J. Rock Mech. Min. Sci., 43, 203–215, 2006.
Huang, J., Liu, S., Liu, W., Zhang, C., Li, S., Yu, M., and Wu, L.: Experimental study on the thermal infrared spectral variation of fractured rock, Remote Sens., 13, 1191, https://doi.org/10.3390/rs13061191, 2021.
Hunt, G. R. and Vincent, R. K.: The behavior of spectral features in the infrared emission from particulate surfaces of various grain sizes, J. Geophys. Res., 1896–1977, 73, 6039–6046, https://doi.org/10.1029/JB073i018p06039, 1968. Ivars, D. M., Pierce, M. E., Darcel, C., Reyes-Montes, J., Potyondy, D. O., Young, R. P., and Cundall, P. A.: The synthetic rock mass approach for jointed rock mass modelling, International Journal of Rock Mechanics and Mining Sciences, 48, 219–244, https://doi.org/10.1016/j.ijrmms.2010.11.014, 2011.
Kamath, A. V., Thiele, S. T., Kirsch, M., and Gloaguen, R.: Multiphysics property prediction from hyperspectral drill core data, Solid Earth, 16, 351–365, https://doi.org/10.5194/se-16-351-2025, 2025.
Kereszturi, G., Heap, M., Schaefer, L. N., Darmawan, H., Deegan, F. M., Kennedy, B., Komorowski, J. C., Mead, S., Rosas-Carbajal, M., Ryan, A., Troll, V. R., Villeneuve, M., and Walter, T. R.: Porosity, strength, and alteration – towards a new volcano stability assessment tool using VNIR-SWIR reflectance spectroscopy, Earth Planet. Sci. Lett., 602, 117929, https://doi.org/10.1016/j.epsl.2022.117929, 2023.
Kereszturi, G., Schaefer, L. N., Miller, C., and Mead, S.: Hydrothermal alteration on composite volcanoes: mineralogy, hyperspectral imaging, and aeromagnetic study of Mt Ruapehu, New Zealand, Geochem. Geophys. Geosystems, 21, e2020GC009270, https://doi.org/10.1029/2020GC009270, 2020.
Kidd, M., Kereszturi, G., Heap, M., Kennedy, B., and Procter, J.: Linking hydrothermal alteration and volcanic rock mechanics through VNIR-SWIR spectroscopy, EGU General Assembly 2024, Vienna, Austria, 14–19 April 2024, EGU24-6858, https://doi.org/10.5194/egusphere-egu24-6858, 2024.
Kirkland, L. E., Herr, K. C., and Salisbury, J. W.: Thermal infrared spectral band detection limits for unidentified surface materials, Appl. Optics, 40, 4852–4862, https://doi.org/10.1364/AO.40.004852, 2001.
Kirkland, L. E., Herr, K. C., and Adams, P. M.: Infrared stealthy surfaces: why TES and THEMIS may miss some substantial mineral deposits on Mars and implications for remote sensing of planetary surfaces, J. Geophys. Res.-Planets, 108, https://doi.org/10.1029/2003JE002105, 2003.
Laukamp, C., Cudahy, T., Cleverley, J. S., Oliver, N. H. S., and Hewson, R.: Airborne hyperspectral imaging of hydrothermal alteration zones in granitoids of the Eastern Fold Belt, Mount Isa Inlier, Australia, Geochem. Explor. Environ. Anal., 11, 3–24, https://doi.org/10.1144/1467-7873/09-231, 2011.
Laukamp, C., Rodger, A., LeGras, M., Lampinen, H., Lau, I. C., Pejcic, B., Stromberg, J., Francis, N., and Ramanaidou, E.: Mineral physicochemistry underlying feature-based extraction of mineral abundance and composition from shortwave, mid and thermal infrared reflectance spectra, Minerals, 11, 347, https://doi.org/10.3390/min11040347, 2021.
Lee, J., Cook, O. J., Argüelles, A. P., and Mehmani, Y.: Imaging geomechanical properties of shales with infrared light, Fuel, 334, 126467, https://doi.org/10.1016/j.fuel.2022.126467, 2023.
Leight, C. J., Ytsma, C., McCanta, M. C., Dyar, M. D., and Glotch, T. D.: Compositional Characterization of Glassy Volcanic Material From VSWIR and MIR Spectra Using Partial Least Squares Regression Models, Earth Space Sci., 11, e2023EA003439, https://doi.org/10.1029/2023EA003439, 2024.
Leiter, S., Russell, J. K., Heap, M. J., Barendregt, R. W., Wilson, S., and Edwards, B.: Distribution, intensity, and timing of palagonitization in glaciovolcanic deposits, Cracked Mountain volcano, Canada, Bull. Volcanol., 86, 32, https://doi.org/10.1007/s00445-024-01724-w, 2024.
Lewicka, E., Guzik, K., and Galos, K.: On the Possibilities of Critical Raw Materials Production from the EU's Primary Sources, Resources, 10, 50, https://doi.org/10.3390/resources10050050, 2021.
Loche, M., Scaringi, G., Blahůt, J., Melis, M. T., Funedda, A., Da Pelo, S., Erbì, I., Deiana, G., Meloni, M. A., and Cocco, F.: An Infrared Thermography Approach to Evaluate the Strength of a Rock Cliff, Remote Sens., 13, 1265, https://doi.org/10.3390/rs13071265, 2021.
Lund, J. W. and Toth, A. N.: Direct utilization of geothermal energy 2020 worldwide review, Geothermics, 90, 101915, https://doi.org/10.1016/j.geothermics.2020.101915, 2021.
Lundberg, S.M., Lee, S.-I.,: A unified approach to interpreting model predictions, in: Advances in Neural Information Processing Systems, Presented at the 31st Conference on Neural Information Processing Systems (NIPS), Long Beach, CA, USA, https://doi.org/10.48550/arXiv.1705.07874, 2017.
Lyon, R. J. P.: Analysis of rocks by spectral infrared emission (8 to 25 microns), Econ. Geol., 60, 715–736, https://doi.org/10.2113/gsecongeo.60.4.715, 1965.
Mineo, S. and Pappalardo, G.: The Use of Infrared Thermography for Porosity Assessment of Intact Rock, Rock Mech. Rock Eng., 49, 3027–3039, https://doi.org/10.1007/s00603-016-0992-2, 2016.
Mordensky, S. P., Villeneuve, M. C., Farquharson, J. I., Kennedy, B. M., Heap, M. J., and Gravley, D. M.: Rock mass properties and edifice strength data from Pinnacle Ridge, Mt. Ruapehu, New Zealand, J. Volcanol. Geotherm. Res., 367, 46–62, https://doi.org/10.1016/j.jvolgeores.2018.09.012, 2018.
Mustard, J. F. and Hays, J. E.: Effects of Hyperfine Particles on Reflectance Spectra from 0.3 to 25 µm, Icarus, 125, 145–163, https://doi.org/10.1006/icar.1996.5583, 1997.
Osterloo, M. M., Hamilton, V. E., and Anderson, F. S.: A laboratory study of the effects of roughness on the thermal infrared spectra of rock surfaces, Icarus, 220, 404–426, https://doi.org/10.1016/j.icarus.2012.04.020, 2012.
Poganj, A., Heap, M. J., and Baud, P.: Spatial distribution of alteration and strength in a lava dome: Implications for large-scale volcano stability modelling, J. Volcanol. Geotherm. Res., 463, 108344, https://doi.org/10.1016/j.jvolgeores.2025.108344, 2025.
Pola, A., Crosta, G., Fusi, N., Barberini, V., and Norini, G.: Influence of alteration on physical properties of volcanic rocks, Tectonophysics, 566–567, 67–86, https://doi.org/10.1016/j.tecto.2012.07.017, 2012.
Portela, B., Sepp, M. D., van Ruitenbeek, F. J. A., Hecker, C., and Dilles, J. H.: Using hyperspectral imagery for identification of pyrophyllite-muscovite intergrowths and alunite in the shallow epithermal environment of the Yerington porphyry copper district, Ore Geol. Rev., 131, 104012, https://doi.org/10.1016/j.oregeorev.2021.104012, 2021.
Rost, E., Hecker, C., Schodlok, M. C., and van der Meer, F. D.: Rock Sample Surface Preparation Influences Thermal Infrared Spectra, Minerals, 8, 475, https://doi.org/10.3390/min8110475, 2018.
Salisbury, J. W. and Eastes, J. W.: The effect of particle size and porosity on spectral contrast in the mid-infrared, Icarus, 64, 586–588, https://doi.org/10.1016/0019-1035(85)90078-8, 1985.
Salisbury, J. W. and Wald, A.: The role of volume scattering in reducing spectral contrast of reststrahlen bands in spectra of powdered minerals, Icarus, 96, 121–128, https://doi.org/10.1016/0019-1035(92)90009-V, 1992.
Schaefer, L. N., Kereszturi, G., Villeneuve, M., and Kennedy, B.: Determining physical and mechanical volcanic rock properties via reflectance spectroscopy, J. Volcanol. Geotherm. Res., 420, 107393, https://doi.org/10.1016/j.jvolgeores.2021.107393, 2021.
Schaefer, L. N., Kereszturi, G., Kennedy, B. M., and Villeneuve, M.: Characterizing lithological, weathering, and hydrothermal alteration influences on volcanic rock properties via spectroscopy and laboratory testing, a case study of Mount Ruapehu volcano, New Zealand, Bull. Volcanol., 85, 43, https://doi.org/10.1007/s00445-023-01657-w, 2023.
Schodlok, M. C., Whitbourn, L., Huntington, J., Mason, P., Green, A., Berman, M., Coward, D., Connor, P., Wright, W., Jolivet, M., and Martinez, R.: HyLogger-3, a visible to shortwave and thermal infrared reflectance spectrometer system for drill core logging, functional description, Aust. J. Earth Sci., 63, 929–940, https://doi.org/10.1080/08120099.2016.1231133, 2016.
Shapley, L. S.: On Balanced Games without Side Payments, in: Mathematical Programming, edited by: Hu, T. C. and Robinson, S. M., Academic Press, 261–290, https://doi.org/10.1016/B978-0-12-358350-5.50012-9, 1973.
Simpson, M. P. and Rae, A. J.: Short-wave infrared (SWIR) reflectance spectrometric characterisation of clays from geothermal systems of the Taupō Volcanic Zone, New Zealand, Geothermics, 73, 74–90, https://doi.org/10.1016/j.geothermics.2018.01.006, 2018.
Soltani, M., Moradi Kashkooli, F., Dehghani-Sanij, A. R., Nokhosteen, A., Ahmadi-Joughi, A., Gharali, K., Mahbaz, S. B., and Dusseault, M. B.: A comprehensive review of geothermal energy evolution and development, Int. J. Green Energy, 16, 971–1009, https://doi.org/10.1080/15435075.2019.1650047, 2019.
Strehlow, K., Gottsmann, J. H., and Rust, A. C.: Poroelastic responses of confined aquifers to subsurface strain and their use for volcano monitoring, Solid Earth, 6, 1207–1229, https://doi.org/10.5194/se-6-1207-2015, 2015.
Swanson, E., Wilson, J., Broome, S., and Sussman, A.: The Complicated Link Between Material Properties and Microfracture Density for an Underground Explosion in Granite, J. Geophys. Res.-Solid Earth, 125, e2020JB019894, https://doi.org/10.1029/2020JB019894, 2020.
Takemura, T., Golshani, A., Oda, M., and Suzuki, K.: Preferred orientations of open microcracks in granite and their relation with anisotropic elasticity, Int. J. Rock Mech. Min. Sci., 40, 443–454, https://doi.org/10.1016/S1365-1609(03)00014-5, 2003.
Thiele, S. T., Grose, L., Samsu, A., Micklethwaite, S., Vollgger, S. A., and Cruden, A. R.: Rapid, semi-automatic fracture and contact mapping for point clouds, images and geophysical data, Solid Earth, 8, 1241–1253, https://doi.org/10.5194/se-8-1241-2017, 2017.
Thiele, S. T., Lorenz, S., Kirsch, M., Acosta, I. C. C., Tusa, L., Hermann, E., Möckel, R., and Gloaguen, R.: Multi-scale, multi-sensor data integration for automated 3-D geological mapping using hylite, Ore Geol. Rev., 136, https://doi.org/10.1016/j.oregeorev.2021.104252, 2021.
Thiele, S. T., Bnoulkacem, Z., Lorenz, S., Bordenave, A., Menegoni, N., Madriz, Y., Dujoncquoy, E., Gloaguen, R., and Kenter, J.: Mineralogical Mapping with Accurately Corrected Shortwave Infrared Hyperspectral Data Acquired Obliquely from UAVs, Remote Sens., 14, 5, https://doi.org/10.3390/rs14010005, 2022.
Thiele, S. T., Kirsch, M., Lorenz, S., Saffi, H., El Alami, S., Contreras Acosta, I. C., Madriz, Y., and Gloaguen, R.: Maximising the value of hyperspectral drill core scanning through real-time processing and analysis, Front. Earth Sci., 12, https://doi.org/10.3389/feart.2024.1433662, 2024.
Tramontini, M., Rosas-Carbajal, M., Zyserman, F. I., Besson, P., Marteau, J., and Heap, M.: Investigating hydrothermal alteration in Copahue volcano (Argentina/Chile) using muography and laboratory measurements on rock samples, EGU General Assembly 2024, Vienna, Austria, 14–19 Apr 2024, EGU24-6565, https://doi.org/10.5194/egusphere-egu24-6565, 2024.
Vairé, E., Heap, M. J., Baud, P., and van Wyk de Vries, B.: Quantifying the physical and mechanical heterogeneity of porous volcanic rocks from the Chaîne des Puys (Massif Central, France), Bull. Volcanol., 86, 49, https://doi.org/10.1007/s00445-024-01742-8, 2024.
van der Meer, F., Kopačková, V., Koucká, L., van der Werff, H. M. A., van Ruitenbeek, F. J. A., and Bakker, W. H.: Wavelength feature mapping as a proxy to mineral chemistry for investigating geologic systems: An example from the Rodalquilar epithermal system, Int. J. Appl. Earth Obs. Geoinformation, 64, 237–248, https://doi.org/10.1016/j.jag.2017.09.008, 2018.
Vincent, R. K. and Hunt, G. R.: Infrared reflectance from mat surfaces, Appl. Optics, 7, 53–59, https://doi.org/10.1364/AO.7.000053, 1968.
Vrakas, A., Dong, W., and Anagnostou, G.: Elastic deformation modulus for estimating convergence when tunnelling through squeezing ground, Géotechnique, 68, 713–728, https://doi.org/10.1680/jgeot.17.P.008, 2018.
Williams, D. B. and Ramsey, M. S.: Infrared spectroscopy of volcanoes: from laboratory to orbital scale, Front. Earth Sci., 12, https://doi.org/10.3389/feart.2024.1308103, 2024.