the Creative Commons Attribution 4.0 License.
the Creative Commons Attribution 4.0 License.
Structure of massively dilatant faults in Iceland: lessons learned from high-resolution unmanned aerial vehicle data
Christopher Weismüller
Janos L. Urai
Michael Kettermann
Christoph von Hagke
Klaus Reicherter
Normal faults in basalts develop massive dilatancy in the upper few hundred meters below the Earth's surface with corresponding interactions with groundwater and lava flow. These massively dilatant faults (MDFs) are widespread in Iceland and the East African Rift, but the details of their geometry are not well documented, despite their importance for fluid flow in the subsurface, geohazard assessment and geothermal energy. We present a large set of digital elevation models (DEMs) of the surface geometries of MDFs with 5–15 cm resolution, acquired along the Icelandic rift zone using unmanned aerial vehicles (UAVs). Our data present a representative set of outcrops of MDFs in Iceland, formed in basaltic sequences linked to the mid-ocean ridge.
UAVs provide a much higher resolution than aerial/satellite imagery and a much better overview than ground-based fieldwork, bridging the gap between outcrop-scale observations and remote sensing. We acquired photosets of overlapping images along about 20 km of MDFs and processed these using photogrammetry to create high-resolution DEMs and orthorectified images. We use this dataset to map the faults and their damage zones to measure length, opening width and vertical offset of the faults and identify surface tilt in the damage zones. Ground truthing of the data was done by field observations.
Mapped vertical offsets show typical trends of normal fault growth by segment coalescence. However, opening widths in map view show variations at much higher frequency, caused by segmentation, collapsed relays and tilted blocks. These effects commonly cause a higher-than-expected ratio of vertical offset and opening width for a steep normal fault at depth.
Based on field observations and the relationships of opening width and vertical offset, we define three endmember morphologies of MDFs: (i) dilatant faults with opening width and vertical offset, (ii) tilted blocks (TBs) and (iii) opening-mode (mode I) fissures. Field observation of normal faults without visible opening invariably shows that these have an opening filled with recent sediment. TB-dominated normal faults tend to have the largest ratio of opening width and vertical offset. Fissures have opening widths up to 15 m with throw below a 2 m threshold. Plotting opening width versus vertical offset shows that there is a continuous transition between the endmembers. We conclude that for these endmembers, the ratio between opening width and vertical offset R can be reliably used to predict fault structures at depth. However, fractures associated with MDFs belong to one larger continuum and, consequently, where different endmembers coexist, a clear identification of structures solely via the determination of R is impossible.
- Article
(28354 KB) - Full-text XML
-
Supplement
(49563 KB) - BibTeX
- EndNote
Extensional faults in cohesive rocks can develop massive dilatancy (several tens of meters) at shallow levels in the crust (Abe et al., 2011; Acocella et al., 2003; van Gent et al., 2010; Gudmundsson, 1987a, b; Holland et al., 2006; Kettermann et al., 2015; Opheim and Gudmundsson, 1989; Rowland et al., 2007; Trippanera et al., 2015). These massively dilatant faults (MDFs) are common in rift zones such as the Icelandic rift and the East African Rift or in active volcanic systems such as Hawaii (Acocella et al., 2003; Gudmundsson, 1987b; Martel and Langley, 2006; Rowland et al., 2007). MDFs guide the flux of water, magma or hydrocarbons and are therefore of interest for applications such as geohazard assessment, hydrocarbon exploration and geothermal energy production (Crider and Peacock, 2004; Faulkner et al., 2010; Ferrill and Morris, 2003; Grant and Kattenhorn, 2004; Gudmundsson, 1987a; Kettermann et al., 2015, 2016; Rowland et al., 2007).
During the past decades, MDFs have been studied in the field (Bubeck et al., 2018; Gudmundsson, 1987a, b; Hjartardóttir et al., 2012; Sonnette et al., 2010; Tibaldi et al., 2016; Trippanera et al., 2015) and using analog and numerical models (Abe et al., 2011; van Gent et al., 2010; Grant and Kattenhorn, 2004; von Hagke et al., 2019; Holland et al., 2006; Kettermann et al., 2015, 2016, 2019; Martel and Langley, 2006; Smart and Ferrill, 2018). The surface geometries have been described including dilatancy, tilted blocks (i.e., rigid, detached blocks tilted towards the hanging wall of a fault) and extension fractures. However, many of the observations are based on local measurements considered representative of the regional structures.
In this study, we investigate the structure and evolution of massively dilatant faults in Iceland (Figs. 1, 2) by identifying and characterizing surface geometries at the regional scale at centimeter resolution. We achieve this by extracting data of MDFs from high-resolution maps generated from unmanned aerial vehicle (UAV)-based photogrammetry. Mapping faults in centimeter resolution over kilometer lengths allows for bridging the gap between outcrop-scale and regional observations. This enables us to quantify the geometry of the studied faults at high detail over the entire fault lengths. The ultimate goal of this work is to introduce a new classification scheme that correlates a ratio of measured fault aperture and fault throw with actual underlying fault structures that are often overprinted by sedimentation or erosion. To describe different types of discontinuities, we use the terminology of Peacock et al. (2016).
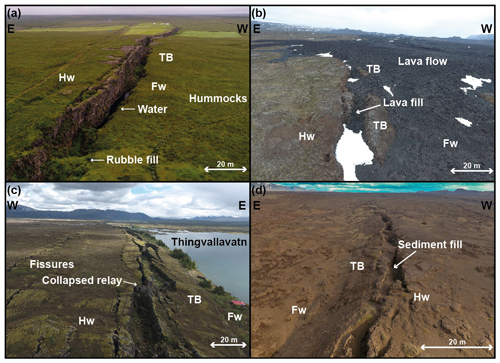
Figure 1(a) MDF close to the Ásbyrgi canyon in Kelduhverfi (cf. Hatton et al., 1994). Along this fault segment, opening widths reach up to 20 m and vertical offsets up to approximately 15 m of displacement. Hw: hanging wall, Fw: footwall, TB: tilted block; 66∘2′14′′ N, 16∘34′15′′ W. (b) MDF of the Krafla fissure swarm. The hanging wall has been covered by a lava flow from the Krafla fires, also surrounding the tilted blocks; 65∘48′44′′ N, 16∘44′32′′ W. (c) Southern part of the Almannagjá fault in Thingvellir. A prominent tilted block is dipping eastwards and fault segments are linked by a collapsed relay; 64∘14′42′′ N, 21∘8′30′′ W. (d) Fault segment of the Theistareykir fissure swarm. The opening of the dilatant fault (footwall in the west) with an eastward-dipping tilted block is being filled by sands and aeolian sediments; 65∘50′50.38′′ N, 17∘0′20′′ W.
1.1 Massively dilatant faults
MDFs (Fig. 1) with several meters' to tens of meters' aperture can form close to the surface in cohesive rocks. They are characterized by distinct geometries such as subvertical fault scarps, rotating blocks and fractures that remain open (or often filled with sediment or rubble) up to hundreds of meters deep (Acocella et al., 2000; Grant and Kattenhorn, 2004). Existing studies of MDFs in outcrops (Holland et al., 2006) and analogue models show that MDFs form in layers where the ratio of rock strength to effective stress is sufficiently high (van Gent et al., 2010). With depth, MDFs transition to shear faults due to the increase of effective stress.
Geometries of MDFs have been described for several sites in Iceland with respect to fracture length, opening, throw, obliquity and segment linkage (Acocella et al., 2000; Bonali et al., 2019b; Bubeck et al., 2017; Gudmundsson, 1987a, b; von Hagke et al., 2019; Tentler and Mazzoli, 2005; Trippanera et al., 2015). Relationships of length and opening are complex (Hatton et al., 1994), with the largest openings at the fault center (Gudmundsson, 1987a) and smaller opening and throw closer to the fault tips (Tentler and Mazzoli, 2005). Correlations of opening and throw are weak but show different distributions at fault tips and centers, possibly reflecting different stages of fault growth (Gudmundsson, 1987a; Tentler and Mazzoli, 2005). However, a direct relation of larger vertical offsets and larger dilatancy has been suggested by Acocella et al. (2003) and Trippanera et al. (2015).
Several models explaining the growth of MDFs exist, ranging from (1) upwards propagation of the fault (Grant and Kattenhorn, 2004), perhaps linked to dike intrusion (Trippanera et al., 2015) over (2) linkage of shear faults at depth with tensile fractures at the surface (Abe et al., 2011; Hardy, 2013; Vitale and Isaia, 2014) to (3) nucleation at the surface and downward propagation of the fault until tensile failure is no longer possible (Acocella et al., 2003; van Gent et al., 2010). The transition from tensile to shear fractures can be envisioned as a broad zone reaching down to depths of more than 1000 m, depending on the mechanical stratigraphy of the fractured units, as well as on fault kinematics (von Hagke et al., 2019; Kettermann et al., 2019; Gudmundsson and Bäckström, 1991). In the following, we quantify the surface geometry of MDFs along a representative set of faults. We develop a method to distinguish different characteristic surface structures and show that it is possible to make inferences on fault processes and geometries in the shallow subsurface based on analysis of surface data only.
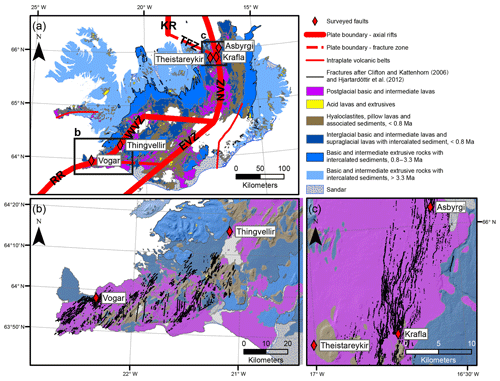
Figure 2(a) Geological overview of Iceland, simplified from 1 December 1989. Jarðfræðikort af Íslandi – Berggrunnur – 1:600 000 – NI_J600v_berg_2.utg https://gatt.lmi.is:/geonetwork/srv/api/records/\{005FFDAD-69A1-4385-B16F-FD31B960FE33\} (last access: 4 June 2019). Rift zones after Thordarson and Larsen (2007) and the study areas with the surveyed faults are indicated. EVZ: east volcanic zone; KR: Kolbeinsey Ridge; NVZ: north volcanic zone; RR: Reykjanes Ridge; TFZ: Tjörnes Fracture Zone; WVZ: west volcanic zone. (b) Detailed view of the Reykjanes Peninsula and WVZ; the presented faults are taken from Clifton and Kattenhorn (2006). (c) Detailed view of the geology and study areas in the NVZ. The mapped faults are taken from Hjartardóttir et al. (2012). Projection: WGS1984 UTM 27N and 28N.
1.2 Geological background and study sites
Iceland is a volcanic island in the Atlantic Ocean on the Mid-Atlantic Ridge separating the Eurasian and North American plates. It is linked to a deep mantle plume (Einarsson, 1991; Lawver and Muller, 1994; Vink, 1984; Wolfe et al., 1997), with associated melt production forming the Icelandic shelf (Brandsdóttir et al., 2015) with a local crustal thickness of at least 25 km (Allen et al., 2002). It is located between the Reykjanes Ridge segment in the SW and the Kolbeinsey Ridge in the north (Fig. 2). Minimum horizontal stresses in Iceland are oriented orthogonal to the rift axes (Ziegler et al., 2016), with a NW–SE trend on the Reykjanes Peninsula ridge and E–W trend in the north volcanic zone. The orientation of the faults, fissures and dikes follows the trend of the rift axes (Fig. 2; e.g., Grant and Kattenhorn, 2004; Gudmundsson, 1983, 1987a, b; Hjartardóttir et al., 2012; Opheim and Gudmundsson, 1989). The bedrock is mostly of volcanic origin, with ages increasing with distance from the rift (Fig. 2). The succession of lava flows with cooling joints, paleosoils and hyaloclastite results in a complex mechanical stratigraphy. Faults and fissures crosscutting these mechanically heterogeneous sections reactivate the pre-existing cooling joints close to the surface, leading to complex geometries (Forslund and Gudmundsson, 1991; Gudmundsson, 1987a; Gudmundsson and Bäckström, 1991; Hatton et al., 1994).
The sites chosen for this project include the west volcanic zone (WVZ) and north volcanic zone (NVZ) (Fig. 2). The less than 8 Ma old NVZ (Sæmundsson, 1974) is composed of seven volcanic systems, each with a central volcano and associated N–NNE-striking fault and fissure swarms (Gudmundsson, 1995; Hjartardóttir et al., 2015; Sæmundsson, 1974). We selected these sites because they are representative of the variability of faults on Iceland, as they include faults in purely extensional but also in oblique rift kinematics. They offer the best outcrop conditions with well-defined structures with only minimal vegetation, soil cover or erosion. Associated with the Krafla volcano in the NVZ, the Krafla fissure swarm stretches approximately 40 km south and 50 km north, mostly in postglacial lava flows (Hjartardóttir et al., 2012), with faults and fissures reaching a maximum opening width of 40 m and vertical offsets up to 42 m (Opheim and Gudmundsson, 1989). Two recent rifting episodes are documented, with eruptions in 1724–1729 (the Mývatn fires) and 1975–1984 (Krafla fires), both accompanied by strong earthquakes and movement along active faults. The horizontal displacement of the rift system during the Krafla fires was about 8 m, equal to approximately 500 years of plate divergence (Hollingsworth et al., 2012; Tryggvason, 1994).
The Theistareykir fissure swarm is located in the rift zone within the NVZ and composed of N–S-striking Holocene fissures and normal faults (Gudmundsson et al., 1993). The westernmost normal fault of the Theistareykir fissure swarm, known as the Gudfinnugja fault, connects with the Húsavik–Flatley fault which also offsets the Kolbeinsey Ridge in the north (Fig. 2) (Gudmundsson et al., 1993; Pasquarè Mariotto et al., 2015; Tibaldi et al., 2016). Further interactions of the Theistareykir fissure swarm with the Tjörnes fracture zone have been suggested by Bonali et al. (2019b) due to variations in strike direction.
The Thingvellir fissure swarm is linked to the Pleistocene Hengill volcanic system by the continuity of the faults and the documented ground movement during the last rifting episode in 1789 (Saemundsson and Saemundsson, 1992). The volcanic system includes approximately 100 associated fissures and faults, of which some reach opening widths >60 m and vertical offsets of 40 m, representing the largest postglacial structures of Icelandic rift zones (Gudmundsson, 1987b). The fissure swarm consists of two Holocene main faults, known as Hrafnagjá and Almannagjá, that envelop lake Thingvallavatn. Almannagjá, which is the subject of this study, has been described by Gudmundsson (1987b) as 7.7 km long and locally up to 64 m wide. The southern tip consists of several en échelon extension fractures, which are interpreted to be related to an older weakness, e.g., a Pleistocene fault underneath (Gudmundsson, 1987b), as further north the fault consists of several parallel fractures and parallel extension fractures at the northern tip (Gudmundsson, 1987b).
The Vogar fissure swarm is located in the NE of the Reykjanes Peninsula in postglacial lava flows (Fig. 2a, b). Here, fissures present 75 % of the structural discontinuities (Gudmundsson, 1987a). The Vogar fissure swarm has been the scope of several field studies (Clifton and Schlische, 2003; Grant and Kattenhorn, 2004; Gudmundsson, 1986, 1987a) and a remote sensing study, introducing a post-coalescence model for fault growth (Villemin and Bergerat, 2013). The geometry of the fractures of the fissure swarm has been characterized as anastomosing or sinuous (Clifton and Kattenhorn, 2006; Clifton and Schlische, 2003; Gudmundsson, 1987a).
We combined satellite and airborne imagery and used drone imagery to create 3-D surface models and digital elevation models (DEMs). These different methods focus on different scales to acquire data, thus making it possible to bridge the gap between centimeter- and kilometer-scale observations.
2.1 Satellite-borne data
To identify areas of interest, we used published datasets of satellite and airborne imagery. Google Earth was used in combination with the aerial photographs from Loftmyndir Inc. that are freely accessible via https://www.map.is/base/ (last access: 20 June 2019) (MAP.IS Loftmyndir ehf, 2019). As Iceland has been subject to several landscape-shaping volcanic eruptions during the time span that is covered by remote sensing data, we included aerial imagery dating back to the 1950s provided by the National Land Survey of Iceland in our preliminary remote sensing. Some examples of young volcanic eruptions include the Krafla fires (Hjartardóttir et al., 2012; Tryggvason, 1986) with nine eruptions between 1975 and 1984 (Thordarson and Larsen, 2007), the 1991 and 2000 eruptions of Hekla (Gudmundsson et al., 1992; Rose et al., 2003) or the Holuhraun eruption during 2014–2015, the largest Icelandic eruption in more than two centuries (Geiger et al., 2016; Müller et al., 2017; Schmidt et al., 2015). Published mappings of faults and fissures of the NVZ (Hjartardóttir et al., 2012) and the Reykjanes Peninsula (Clifton and Kattenhorn, 2006) were further used to identify possible sites. TanDEM-X WorldDEM™ tiles with a resolution of 12 m were used at a later stage to complement our own DEMs, which are highly resolved but only able to cover respectively smaller areas. With TanDEM-X WorldDEM™, general surface slopes were identified to quality check our own models in order to avoid typical error sources such as doming (James and Robson, 2014) known to possibly accompany structure-from-motion-based DEMs. Furthermore, the elevation models were used to aid and back the interpretations in areas where we do not have coverage with its own spatial data.
2.2 Unmanned aerial vehicle photogrammetry
Unmanned aerial vehicles (UAVs) have been used increasingly in geosciences within the last years, using commercial ready to fly sets or self-made products. They have been applied successfully to, e.g., aid the mapping of faults and joints (Bonali et al., 2019a; Trippanera et al., 2019; Vasuki et al., 2014), landslides (Niethammer et al., 2012) or moss beds (Lucieer et al., 2014). The data for this study were acquired using three different UAVs: the DJI Phantom 4 and Mavic pro with 12 MP sensors and the Phantom 4 Advanced, with a 20 MP sensor. We took front and sideways overlapping photographs of the faults with the cameras facing 90∘ downwards, covering the area to be mapped, and added oblique photographs to reduce possible “doming” effects as suggested by James and Robson (2014). Due to the large distances we covered, most flights to acquire the photographs were undertaken manually. For later processing in Agisoft Photoscan, we aimed for a frontal overlap of at least 70 % and a sidelap of at least 50 %, being much higher in practice, especially at the fractures where >9 perspectives are achieved for most cases. We varied the altitude from which the photographs were taken between 30 and 70 m above ground according to the estimated accuracy of the resulting DEM and the general dimension of the area to be mapped. We thereby kept the flight altitudes as low as possible, depending on the dimension of the survey area. The focus of our photographs was set on the fractures and the adjacent areas to capture structures linked to the fracture geometry, such as TBs or the damage zone, and identify possible surface variations such as topographic slopes.
Our method is similar the one used by Bonali et al. (2019a), who collected data from 50 and 100 m altitude and have shown that with these setting one obtains sufficient resolution for detailed analysis of faults and fissures. We did not place further ground control points (GCPs) and relied on the integrated GPS receiver of the UAV in favor of time efficiency, since absolute elevations are not relevant to our research goals. We used Agisoft Photoscan as processing tool to align the photographs on high settings and create a sparse 3-D point cloud. As second step, a dense point cloud was created, that also served as basis for the DEM, at medium or high resolution, in the event that the medium setting resulted in DEMs with resolutions >15 cm per pixel. The resulting DEMs were further used as basis for orthomosaics with half the spatial resolution, thus representing the lower threshold of the accuracy of our measurements. The combination of our UAV images and the processing software allowed us to create digital elevation models and orthorectified mosaics with a resolution varying between 5 and 15 cm per pixel, depending on the (i) the altitude the photographs were taken from, (ii) the count of perspectives achieved per object and (iii) the quality settings used during the processing.
GPS tags by the UAV onboard receiver led to an absolute horizontal accuracy of ∼5 m per photograph and a vertical error in the magnitude of several tens of meters. To account for the vertical error of the UAV onboard GPS, we used relative elevations in our DEMs, assigning 0 m elevation to the lowest point in the model, respectively. With the large amounts of photographs taken, the horizontal error is further reduced during processing, so that we cannot identify an offset in the horizontal orientation of our models compared to, e.g., the lower-resolved TanDEM-X WorldDEM™. Therefor we assume a horizontal error in the range of our onboard GPS receiver, as previously explained. To avoid misinterpretations stemming from model tilt, possible slopes and artefacts have been ruled out by comparison with TanDEM-X WorldDEM™ data. To more carefully review the point clouds created during the process and to take first test measurements, we used the Compass plugin (Thiele et al., 2017) for CloudCompare.
Ground truthing and quality control of the resulting DEMs was acquired by including reference objects of known dimensions in our models. Our model accuracy lies within the same error range as in Bonali et al. (2019a), who achieved accuracies between 0.04 and 0.07 m for 50–100 m flight altitude horizontally and up to approximately 20 cm vertically, thus below and within the same order of magnitude as our accuracy.
2.3 Data extraction
The DEMs and orthomosaics were imported in Esri ArcMap to map the fractures manually as polylines on a scale of 1:100. The chosen mapping scale represents the middle ground between a more time-consuming, high-accuracy or a fast, but low-accuracy, mapping scale still enabling us to accurately map details of few tens of centimeters such as the edges of cooling columns. With a manual mapping accuracy of a few millimeters using GIS for the interpretation in the DEM and orthomosaic at a 1:100 scale, the mapping error of the interpretation is in the same order of magnitude as our spatial resolution. We traced all observable fractures along their surface expressions, including the surface traces of faults, the foot- and hanging wall of dilatant faults as well as the adjacent fracture traces of dilatant joints. In a later step, the polylines were merged to polygons, representing the opening of the fracture on the surface. The strike directions of the fractures were measured as represented by a straight line from tip to tip.
2.3.1 Opening width and vertical offset
To extract the opening widths, parallel scanlines with 1 m spacing were created orthogonally to the average strike direction. Small deviations in strike were found to have no significant impact on the results, as the relative error is below 1 % for deviations <60∘ (Fig. S2 in the Supplement). The scanlines were subsequently clipped with the polygons of the faults to measure opening width (e.g., Fig. S6). The overall dilatancy of a fault is defined as the summed opening width of subparallel faults and fissures.
Vertical offset was measured on the same scanlines along which the opening width was determined. One measurement point was created along the scanline on the hanging wall and on the footwall (Fig. S6). The vertical offset was calculated from the elevation difference and linked to the opening width measurement and the associated scanline. To prevent errors caused by local variations of surface elevation associated with the damage zone, the elevation data were extracted a few meters away from the fracture, if possible, without crossing another fracture. In this process, we also tried to avoid areas of rough surface with wavelengths of a few meters (large vegetation or lava blocks). To extract geometries of fractures in single models, these methods of opening width and vertical offset extraction are viable. To compare absolute elevations in several DEMs; however, the use of GCP and the correction of the elevations is suggested.
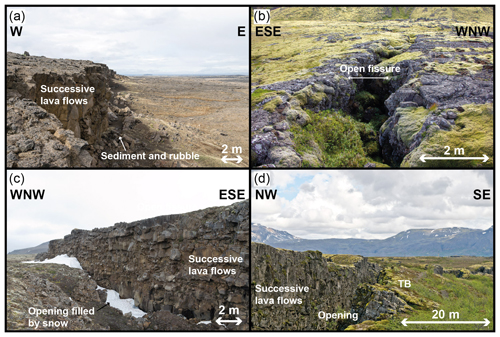
Figure 3(a) Normal fault with no visible opening width but a clear scarp with vertical offset. Aeolian sediments and rubble form at the bottom of the scarp, forming a colluvial wedge; 65∘32′12′′ N, 16∘17′27′′ W. (b) Fissure with no vertical offset but a prominent opening width; 64∘00′11′′ N, 21∘43′20′′ W. (c) Dilatant fault, combining opening width with vertical offset. The free face of the fracture shows a succession of lava flows; 65∘48′43′′ N, 16∘44′3′′ W. (d) Tilted block on a dilatant fault; note the slope on the right side of the image dipping away from the main fault; 64∘14′33′′ N, 21∘8′37′′ W.
2.3.2 Ground truthing and field observations
Ground based observations were used to complement the airborne datasets and interpretations. Vertical fracture walls, which are not as well resolved as horizontal surfaces in the top-down UAV photographs, mostly consist of successive lava flows (Figs. 3, S5). The thickness of the lava flows varies between few centimeters to several meters. Contacts of the lava flows can be smooth transitions or sharp edges, locally with remains of volcanic glass, millimeters to a few centimeters thick. The different morphology of the contacts is interpreted to influence the cohesion between the layers. Patterns of cooling joints may vary strongly between the layers, resulting in columns of a few centimeters to several meters in length and diameter.
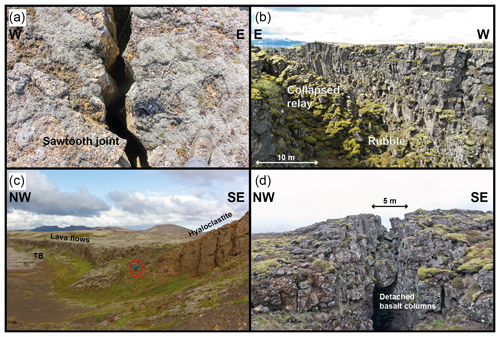
Figure 4(a) Cooling joint with the typical sawtooth pattern; 66∘2′55′′ N, 16∘37′48′′ W. (b) MDF in Thingvellir. The relay has collapsed, filling the opening of the fault with rubble; 64∘14′34′′ N, 21∘8′38′′ W. (c) A fault that dissects different material developed tilted blocks: lava flows on the left and softer hyaloclastite on the right. Person for scale; 63∘51′48′′ N, 22∘11′41′′ W. (d) Side view inside a dilatant fault. Note the detached basalt columns that are stuck between the fracture walls, preventing the cavity beneath from being filled by further rubble from above; 63∘57′58′′ N, 22∘20′13′′ W.
The correlation of piercing points of adjacent fracture walls as presented in Bonali et al. (2019a) is more accurate for fissures with small opening width with respect to larger opening widths. More correlation points can be found directly on the fracture walls. Thus, we experienced the identification of reliable piercing points to be increasingly challenging with increasing opening width and vertical offset. We attribute this to the observation of rubble and disintegrated columns within larger fractures, indicating the advanced erosion of the fracture wall. This is supported by the observations that small fissures may remain unfilled to large depths, while faults are filled with broken columns, typically a few meters under the hanging wall cutoff (Fig. 4b, d). Maximum depths for accessible (larger) fractures and faults show peaks at 30 m up to 50 m in Thingvellir. The true depth of the opening is not observable, as the voids are filled with rubble, disintegrated columns and sediment. The filling of the voids can reach up to the fracture edges at the surface, also covering these (Fig. 3a). This leads to the observation of a single scarp with no distinguishable opening from the elevated perspective of an UAV.
The apparent opening width of fissures at the surface can be strongly misestimated when not directly measured at the rock surface: erosion of soil-cover into the fracture leads to funnel shape on the surface, causing overestimation of the opening as also described in Bonali et al. (2019a). We further observed the reduction of visible opening width by vegetation that (i) is large enough to prevent a clear line of sight on the fracture when seen from above and (ii) moss and lichen patches that grow over the edges, thus reducing the visible opening (Fig. 5). As the thickness of the moss patches observed can vary between centimeters to decimeters, the relative error becomes larger for overall small opening widths, eventually covering the whole opening on the surface. For opening widths summed over several small fractures, e.g., en échelon arrangements of early stages of oblique faults, this error will sum up, leading to a large underestimation of the true opening width at the surface.
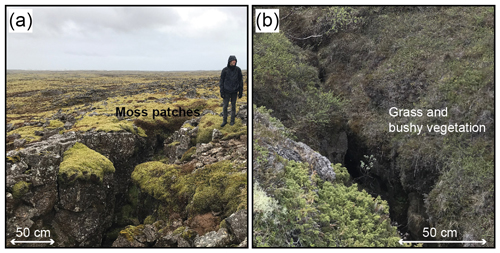
Figure 5(a) Moss patches have grown over the edges of the fractures, reducing the visible opening locally by the thickness of the moss patch (front) and also completely as visible left of the person; 63∘54′27′′ N, 22∘33′41′′ W. (b) Grass and bushy vegetation can also cover the edges of fractures in areas with soil on top of the bedrock, reducing the visible opening width when viewed from top and impair a clear line of sight from an UAV; 66∘1′24′′ N, 16∘35′13′′ W.
3.1 Digital elevation models
Here, we focus on several representative DEMs of our dataset that were used to map the faults in detail and to quantify their geometries. A direct comparison between the resolution of our high-resolution DEMs and the ones provided by TanDEM-X WorldDEM™ is provided in Fig. 6. To simplify and visualize the fracture geometries, measurements of opening width and vertical offset were sorted according to position along strike and plotted as an x–y scatterplot, with the position along strike in meters on the x axis and the extracted value (opening width, vertical offset) on the y axis, scaling with the DEM above (Figs. 7–11).
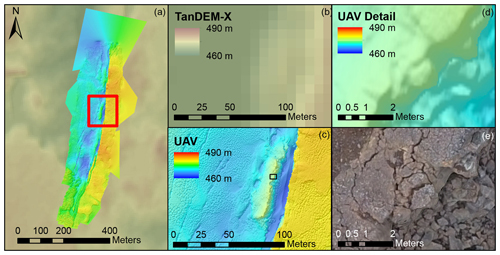
Figure 6(a) Drone-based high-resolution DEM of fault belonging to the Krafla fissure swarm, projected on TanDEM-X WorldDEM™. (b) Detailed view on the TanDEM-X WorldDEM™ tile of the area marked in panel (a). (c) High-resolution DEM analogue to panel (b). (d) Detailed view of area marked in panel (c) of the high-resolution DEM. (e) Orthorectified UAV-photography analogue to panel (d). Location of the DEM: 65∘51′19′′ N, 16∘43′12′′ W. Projection of the DEM and orthomosaics: WGS1984 UTM 28N.
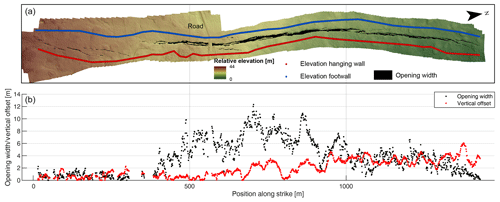
Figure 7To simplify and visualize the fracture geometries, measurements of opening width and vertical offset were sorted according to position along strike (scanline count) and plotted as an x–y scatterplot, with the position along strike in meters on the x axis and the extracted value (opening width, vertical offset) on the y axis, scaling with the DEM above. Here, we show a fracture close to the Ásbyrgi canyon. (a) DEM with the mapped opening width of the fractures and elevation extraction points (blue points on hanging wall; red points on footwall; points were selected on a line placed such that local topographic variations are avoided or at a minimum). (b) Opening width (black) and vertical offset (red) plotted along strike. The x-axis scale is analogous to the scale in the DEM in panel (a); 66∘01′21′′ N, 16∘35′14′′ W. Projection of the DEM: WGS1984 UTM 28N.
3.1.1 Ásbyrgi
The field area Ásbyrgi is a fracture accumulation in the center of a large graben in the Kelduhverfi area (Fig. 7), part of the northern rift zone close to the Ásbyrgi canyon tourist spot. The size of the DEM covers approximately 1500 m in length and 100–150 m in width. The DEM shows a maximum elevation difference of 44 m from the highest to the lowest point in the model. The surface is dipping towards the north at 3∘ with a N–S-striking fracture in the center. A W–E topographic gradient of approximately 5 %, with an increased surface dip towards the east and locally steeper dips east of the fault can be observed. The fissures in the south (0–350 m) are left-stepping en échelon fractures with vertical offsets and opening widths below 2 m. They are underlapping a structure that can be traced from approximately 450 to 1400 m, consisting of at least three segments of similar size, from (i) 450 to 700 m, (ii) left stepping from 700 to 1100 m and (iii) right stepping from 1100 to 1400 m. The opening width of the larger structure reaches its maximum values around 10–12 m, close to its center between 700 and 900 m along strike (al.st.), and decreases towards the tips, with a steeper gradient towards the south than towards the north. The vertical offsets are <2 m in (i) and increase to 3.5 m in (ii), where they reach a local minimum in the center but again increase towards segment (iii), in which the vertical offset remains between 2 and 4 m.
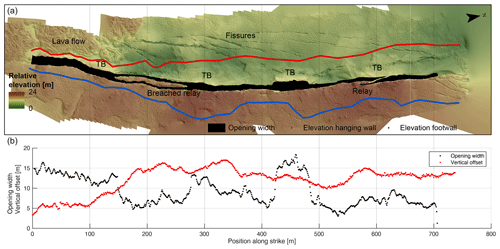
Figure 8Fracture associated with the Krafla fissure swarm. Red dots: elevation extraction points on the hanging wall; blue dots: elevation extraction points on the footwall. (a) DEM with the mapped opening width of the fractures and elevation extraction points. (b) Opening width (black) and vertical offset (red) plotted along strike. The x-axis scale is analogous to the scale in the DEM in panel (a); 65∘51′19′′ N, 16∘43′21′′ W. Projection of the DEM: WGS1984 UTM 28N.
3.1.2 Krafla north
Figure 8 depicts a N–S-striking fault associated with the Krafla fissure swarm (cf. Kettermann et al., 2019, their Fig. 2). The DEM covers approximately 800 m×200 m, with an elevation difference of 24 m. The rough surface in the SW is caused by a comparably young lava flow, associated with the Krafla fires. The center of the DEM shows a approximately 700 m long stretch of a fault which is accompanied by smaller fractures on the hanging wall. Along the main fault, the vertical offset of 15 m remains constant from 150 m to the end of the DEM in the north, after increasing from 5 m in the south, close to the lava flow. In this section (0–150 m al.st.), a tilt of the hanging wall away from the footwall is visible; thus, the vertical offset is underestimated, since the elevations have either to be taken on top of the younger lava flow or on the tilted hanging wall, which is most likely a TB, which has not been covered by younger lava. The opening width has a maximum of 17 m and a minimum of 5 m. Sections of large opening width are linked to tilted hanging walls, possibly TBs, facing away from the footwall, while areas with smaller opening show no significant slope. Starting from 150 m al.st., a breached relay of 100 m length indicates the linkage of two segments, as well as another, smaller lower ramp breach at 580 m.
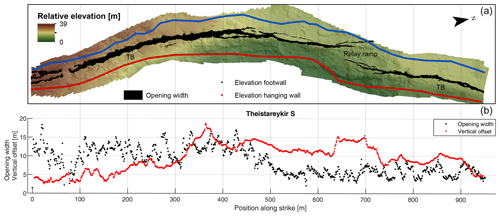
Figure 9Fracture associated with the Theistareykir fissure swarm. (a) DEM with the mapped opening width of the fractures and elevation extraction points. (b) Opening width (black) and vertical offset (red) plotted along strike. The x-axis scale is analogous to the scale in the DEM in panel (a); 65∘50′45′′ N, 17∘00′23′′ W. Projection of the DEM: WGS1984 UTM 28N.
3.1.3 Theistareykir south
The DEM of Theistareykir south (Fig. 9) covers approximately 950 m length and 120 m width, with a maximum elevation difference of 39 m. The surface is free of vegetation and has a general slope towards the north. Across the fault, tilted surfaces are located on the hanging wall from 0 to 500 m and 700 m al.st. onwards. The area in between the tilted hanging walls is the lowest area in the DEM. The tips of two overlapping segments of a larger N–S-striking fault structure associated with the Theistareykir fissure swarm are the essential part in the shown stretch. The fault strike of the single segments slightly varies: N–S from 0 to 450 m al.st., bending approximately 30∘ towards the east further north. Measurements of the opening width along strike undulate around 12 m in the south (0–480 m) and decrease towards the northern tip of the southern segment to ∼5 m until the northern end of the mapped area. The vertical offset shows less variations, with smaller amplitude and larger wavelengths, as compared to the opening width, gently increasing from 4 m in the south towards 6 m at 300 m al.st. Over 50 m distance, the vertical offset then rapidly increases to its measured maximum of 17 m at 360 m al.st., from where it shows a general decreasing trend towards the north, interrupted by a local maximum from 640 to 700 m al.st. However, in this DEM, a reliable measurement of the vertical offset can only be taken in the central part around 500 m al.st., since measurements in the north and the south can only be taken on the surface of the TBs and not the horizontal hanging wall, thus leading to an underestimation of the vertical offset.

Figure 10Fracture associated with the Thingvellir (Hengill) fissure swarm, also known as the Almannagjá fault. (a) DEM with the mapped opening width of the fractures. (b) Opening width (black) and vertical offset (red) plotted along strike. The x-axis scale is analogous to the scale in the DEM in panel (a); 64∘14′33′′ N, 21∘8′37′′ W. Projection of the DEM: WGS1984 UTM 27N.
3.1.4 Thingvellir (Almannagjá)
With almost 7 km length, on average 200 m width and a relative elevation difference up to 53 m, the DEM of the NNE–SSW-striking Almannagjá fault in Thingvellir is one of our largest high-resolution datasets (Fig. 10). Bounded by Lake Thingvallavatn in the east, the DEM includes the western main fault of the postglacial graben. It covers the en échelon extension fractures in the south, which connect to larger, segmented fault structures towards the north. The western footwall is characterized by several fault parallel fractures and breached relays, while the hanging wall in the east is accompanied along strike by an up to 50 m wide, eastward-sloping structure. The measurements of the opening widths are largest at the center of the mapped faults, reaching values up to ∼64 m, and decline towards the fault tips. Smaller variations in opening width undulate ±5 m with larger, local maxima in relay zones, e.g., at 1100, 2600, 4000 and 5200 m al.st. The vertical offset shows a similar trend: maximum values up to 40 m close to the center of the superordinate fault with decreasing vertical offsets towards the tips in the north and south. Local variations are in the magnitude of few meters, while the general trend is less susceptible to local undulations. Measurements of vertical offsets in the periphery of 5500 m al.st. are missing, because we were not able to reconstruct a digital elevation model in this area due to an insufficient amount of photographs. Measurements of opening width, however, could be performed based on the orthomosaic.
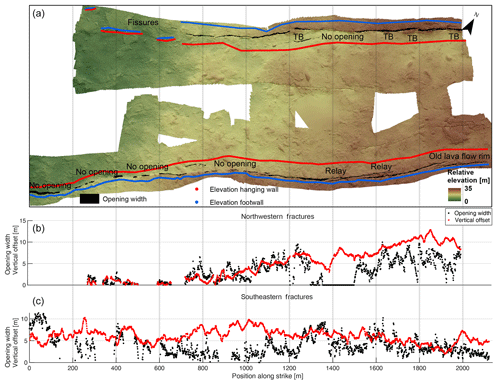
Figure 11Fractures of the Vogar fissure swarm. (a) DEM with the mapped opening width of the fractures and elevation extraction points. The elevation extraction points of the fissures in the NW are not shown due to the scale. (b) Opening width (black) and vertical offset (red) plotted along strike of the northern fracture. (c) Opening width (black) and vertical offset (red) plotted along strike of the southern fracture. The x-axis scale of both plots is analogous to the scale in the DEM in panel (a); 63∘58′0′′ N, 22∘20′40′′ W. Projection of the DEM: WGS1984 UTM 27N.
3.1.5 Vogar
This DEM covers the adjacent shoulders of a graben associated with the Vogar fissure swarm (Fig. 11). Our focus while capturing the drone photographs was on the two NE–SW-striking main faults of the graben. We were able to connect the two photosets by including several traverses orthogonal to the fault strike. Thus, we were also able to cover several smaller fractures in the graben center. The maximum extent of the resulting DEM is more than 2 km in length and approximately 700 m width, neglecting the void areas in the graben center. The relative elevation difference in the DEM is 35 m, with the surface sloping towards SW. The northern fracture shows several smaller fractures in the west, with opening widths of 1–2 m and vertical offsets in the range of few decimeters up to 2 m (300–550 m and 650–700 m al.st.). The small, isolated fractures are followed by a larger, connected fault segment from 780 m al.st. on, with opening widths up to 5 m and vertical offsets that increase from <1 m to several meters towards the east. The following segment from 1200 m al.st. on continues the trend of an increasing vertical offset up to 12 m despite a local minimum at 1400 m al.st. The opening width undulates around 5 m and includes several sections with no measurable opening width, despite a clear vertical offset (e.g., 1400–1550 m al.st.). Areas with a prominent local slope on the hanging wall are located at, e.g., 1300, 1650 m and 1700–1900 m al.st.
The tip of the southern fracture is not covered in the DEM. Towards the north, the structure continues as several overlapping fractures with relays at 1400, 1600 and 1900 m al.st. The vertical offsets of the southern fracture show less significant changes, with local extrema of 10 and 3 m, but mainly undulating around 6 m. Opening widths vary strongly, from areas with no measurable openings (e.g., 140–210, 310–390 and 870–930 m al.st.) up to locally >10 m in the first 1000 m al.st. In the following stretch, the fractures remain open, while still varying strongly between <1 m and up to 10 m.
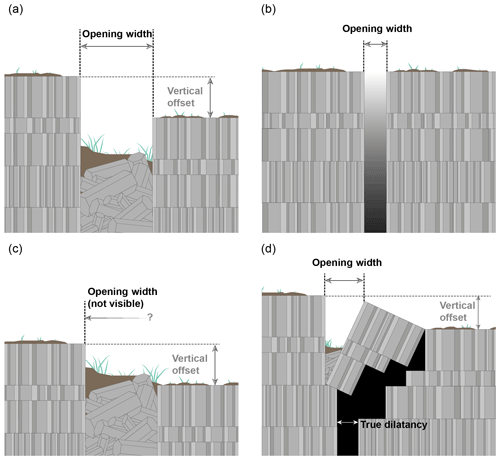
Figure 12(a) Dilatant fault. The opening is filled by detached columns, rubble and sediment. The opening width is measured from edge to edge, vertical offset from the top of the footwall to the top of the hanging wall with a distance to the opening. (b) Fissure: the opening is measured from edge to edge and can remain open (unfilled) to uncertain depth. (c) Dilatant fault with the opening filled to the surface, thus preventing accurate measurements. Vertical offset is measured from the top of the footwall to the top of the hanging wall. (d) Tilted block (Type I of Kettermann et al., 2019). The opening width is measured from edge to edge and can be filled with detached columns, rubble or sediment. The opening on the surface is larger than the true dilatancy at depth. Vertical offset is measured from the top of the footwall to the top of the hanging wall with a distance to the TB. Not to scale.
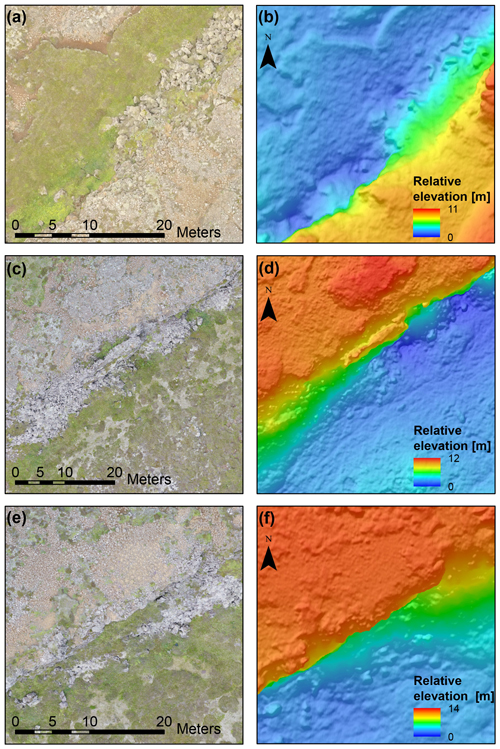
Figure 13Samples showing the resolution of our DEMs and orthomosaics on dilatant faults with filled openings in Vogar: (a, c, e) orthorectified mosaics and (b, d, f) DEMs. (a, b) Vogar; the opening is still visible in the south but completely filled by basalt rubble in the north of the image; 63∘57′30′′ N, 22∘21′47′′ W. (c–f) Rubble and vegetation covering the openings; 63∘58′11′′ N, 22∘20′59′′ W, and 63∘58′12′′ N, 22∘20′52′′ W. Projection: WGS1984 UTM 27N and 28N.
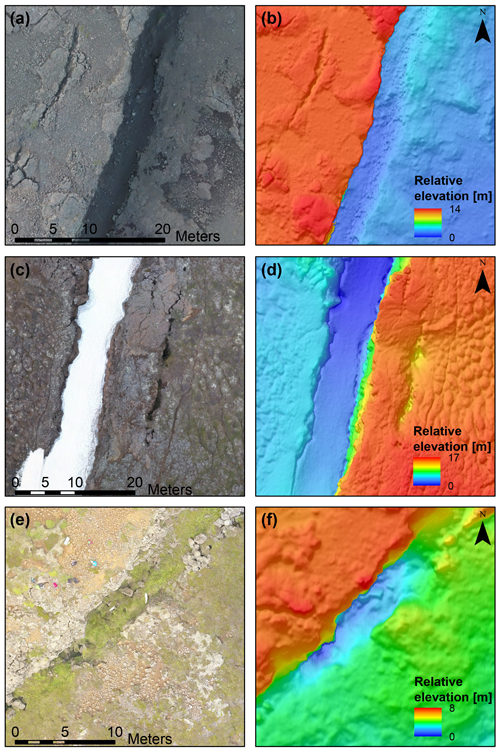
Figure 14Samples showing the resolution of our DEMs and orthomosaics on dilatant faults: (a, c, e) orthorectified mosaics and (b, d, f) DEMs. (a, b) Theistareykir; the opening is not yet completely filled by sediment; 65∘50′50′′ N, 17∘0′19′′ W. (c, d) Krafla; the opening is partly and temporarily filled by ice; 65∘51′17′′ N, 16∘43′23′′ W. (e, f) Vogar; the opening is partly filed by rubble and vegetation; strong erosion is apparent; 63∘58′5′′ N, 22∘21′16′′ W. Projection: WGS1984 UTM 27N and 28N.
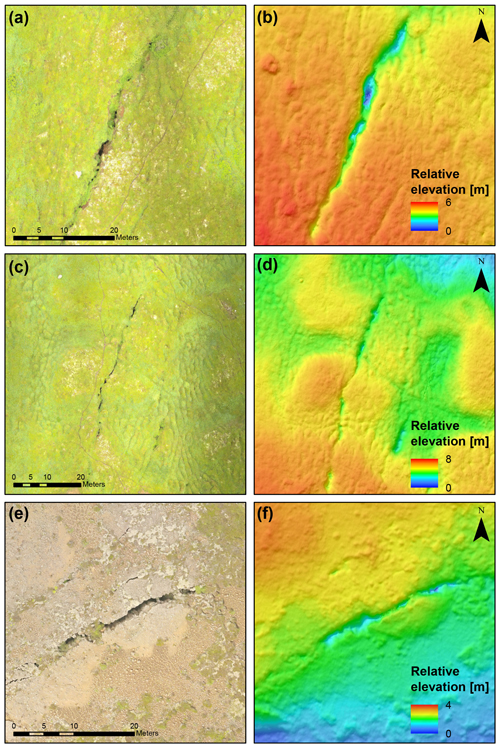
Figure 15Samples showing the resolution of our DEMs and orthomosaics on fissures: (a, c, e) orthorectified mosaics and (b, d, f) DEMs. (a)–(d) Ásbyrgi; strong vegetation and soil cover the clear edges of the fissures. Erosion of soil into the fissure leads to a funnel-shaped opening at the surface; 66∘1′8′′ N, 16∘35′20′′ W, and 66∘1′10′′ N, 16∘35′19′′ W. (e, f) Vogar, where less soil and vegetation allow a more accurate mapping of the opening; 63∘57′55′′ N, 22∘21′59′′ W. Projection: WGS1984 UTM 27N and 28N.
3.2 General observations
Comparing the four field areas and the observed fracture geometries therein, no major differences in structure are observable. Fractures and faults in all areas can be described according to opening width, filled or covered openings, vertical offset and associated structures such as tilted blocks (Fig. 12). In each of the field areas, we can define the following endmember structures associated with MDF from field observations and insights from our DEMs:
-
Dilatant faults. Dilatant faults are opening-mode fractures with vertical walls and measurable opening width and vertical offset (Fig. 12a). The opening can be filled with tilted columns, broken columns, sediment or younger lava flows and vegetation. Basalt columns can be jammed between the fracture walls or form part of the highly porous aggregate between the walls (Fig. 4d). Filling with sediments on top of the rubble can cover the gap completely (Fig. 12c), so that the opening width can no longer be determined at the surface (Fig. 3a) and DEM (Fig. 14). This has also been described by Trippanera et al. (2015) as their type A structure. The complete filling of the opening causes the faults to appear as a single scarp on the surface. In basalts, the exposed fracture is subvertical and follows the geometry of the basalt columns.
The faults may develop dilatancy of up to 15 m accompanied by vertical offsets in the same order of magnitude. The void between the walls may remain open down to depths of 20–30 m but is usually shallower (Fig. 1). The faces of the fracture walls expose successive layers of lava flows with mostly vertical cooling joints (see Fig. S5). Field examination of the walls on both sides usually do not allow to match patterns of columns, indicating that material between the walls is missing due to erosion. In the DEMs (Fig. 15), MDFs have measurable opening widths (fracture walls are visible) with clear vertical offsets (Fig. 12a). All faults, including the ones that appear non-dilatant, can be shown to have an opening. At apparently non-dilatant faults the opening is covered by sediment so that it is not easily visible in the field or DEM (Fig. 14).
-
Fissures. Fissures are opening-mode fractures with a prominent surface aperture and no significant vertical offset (Fig. 12b). Their local geometry is governed by pre-existing cooling joints in the basaltic lava flows (Grant and Kattenhorn, 2004; Holland et al., 2006) and thus develop in decimeter-scale sawtooth patterns along the boundaries of the basalt columns (Fig. 3a). Fissures can be early stages of MDFs or represent the lateral ends of MDFs, which show en échelon fracturing when formed at oblique slip (Acocella et al., 2003; Grant and Kattenhorn, 2004; Gudmundsson, 1987a; von Hagke et al., 2019). Earlier studies defined fissures as fractures with vertical offsets <1 m (Grant and Kattenhorn, 2004; Gudmundsson, 1987b). However, our data (Fig. 15) show a more substantial surface roughness, leading us to define a maximum allowed vertical offset of 2 m (see Fig. S1). Fissures tend to cluster around fault tips and occur in zones parallel to faults and are rarely longer than 100 m.
-
Tilted blocks. TBs, also referred to as monoclines (Grant and Kattenhorn, 2004; Martel and Langley, 2006; Smart and Ferrill, 2018; Sonnette et al., 2010) can develop in the hanging wall of dilatant faults, creating a surface dipping away from the footwall. The length of single tilted blocks ranges from several meters up to several hundred meters; widths range between several meters to tens of meters, and depending on their subsurface geometry and kinematics three different types of TBs can be distinguished (Kettermann et al., 2019). An example of a Type III (Kettermann et al., 2019) TB is provided in Fig. 3d. A sketch showing the expected behavior of opening width and vertical offset relationships of a Type I TB is provided in Fig. 12d. In the DEMs, we identify TBs quantitatively based on the slope on the hanging wall, dipping away from the footwall (Fig. 16), following Kettermann et al. (2019). Dips of TBs are commonly few degrees; exact measurements may be perturbed by vegetation cover and surface roughness of the lava flows. For a more detailed analysis of TBs, including kinematic models, the reader is referred to Kettermann et al. (2019); here, we focus on the presence or absence of TBs along the faults.
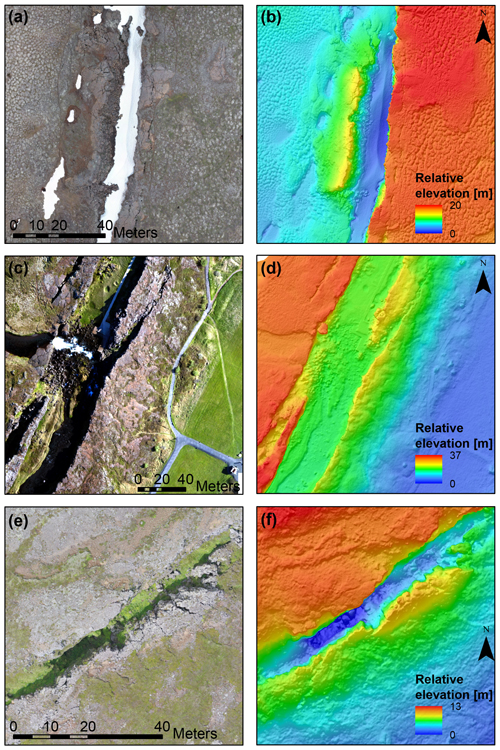
Figure 16Samples showing the resolution of our DEMs and orthomosaics on tilted blocks: (a, c, e) orthorectified mosaics and (b, d, f) DEMs. (a, b) Krafla; the opening is partly filled by snow. The surface dip of the TB is visible in the DEM; 65∘51′19′′ N, 16∘43′23 W. (c, d) Partly segmented TB in Thingvellir, including the Öxarárfoss waterfall; 64∘15′56′′ N, 21∘7′4′′ W. (e, f) TB dipping towards the south in Vogar; 63∘58′19′′ N, 22∘20′29′′ W. Projection: WGS1984 UTM 27N and 28N.
We mapped the fractures as previously described and measured opening width and vertical offset along their strike in the DEMs. Surface structures were identified either in the high-resolution models or, for larger structures, with TanDEM-X WorldDEM™. Based on the definitions above, each measurement in the database was assigned to one of the proposed endmember types, i.e., fissures, tilted blocks (TBs) or dilatant faults, which are subdivided in dilatant faults with discernible opening (DFs) and no discernible opening.
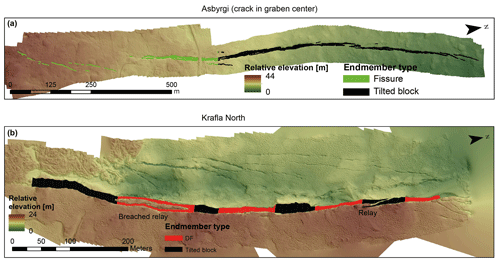
Figure 17(a) DEM and proposed endmember types of the fractures close to Ásbyrgi canyon. (b) DEM and proposed endmember types of the fractures of the Krafla fissure swarm. Projection of the DEM: WGS1984 UTM 28N.
Ásbyrgi (Fig. 17a). Due to the small vertical offsets and en échelon arrangement, the fractures in the south are identified as mode I fissures. The larger segmented structure towards the north shows different endmembers: (i) is a fissure, followed by two segments of TBs, as their aspect ratio is biased towards larger opening widths in relation to the vertical offset, further aided by the surface gradient of the hanging wall, which is dipping away from the footwall. As the high-resolution DEM coverage is restricted in these directions, TanDEM-X WorldDEM™ elevations were used to complement the data.
Krafla N (Fig. 17b). The section of the MDF shows the DF and several TBs. Their direct influence on the measured opening width is apparent in the plot, as the opening width strongly increases along the TB and decreases again in sections without (DF). The opening width along the breached relay at 150–250 m al.st. has been measured along both overlapping faults and summarized along the scanline. The cumulative opening width is equal to the opening width measured in areas without TBs, e.g., 500–550 and 650–700 m. Thus, the segments are completely linked, because no decreasing opening width is seen, as expected at fault tips. The vertical offset in the south, from 0 to approximately 190 m along strike, is most likely underestimated due to the presence of a TB and the younger lava flow which covers the hanging wall.
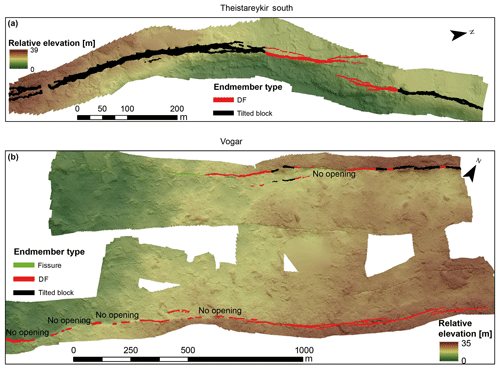
Figure 18(a) DEM and proposed endmember types of the fractures of the Theistareykir fissure swarm. (b) DEM and proposed endmember types of the fractures of the Vogar fissure swarm. Projection of the DEM: WGS1984 UTM 28N (a) and UTM 27N (b).
Theistareykir S (Fig. 18a). The areas along the fault showing the east-dipping surface on the hanging wall (0–500 and 700–950 m al.st.) are interpreted as TBs. The southern TB has a larger opening width when compared with the area between 500 m and 700 m al.st., while the northern TB has a larger vertical offset (7–10 m) than the southern one, accompanied by opening widths undulating around 6 m. The section between the two TB segments includes a relay zone, with further fractures subparallel to the main fault. As the cumulative opening widths along the relay zone show no significant variation, the overall extension in this area is interpreted to be the same. Combining an opening width of 5 m with a clear vertical offset and no TB on the hanging wall, the stretch between the TBs in the north and south qualifies as endmember type DF. Furthermore, the decrease in opening width from 450 m al.st. towards the north coincides with the observed change in strike. With the general orientation of the E–W extension in the northern rift zone and the influence of the Húsavik–Flatley transform fault on the Theistareykir fissure swarm (Tibaldi et al., 2016), the obliquity of the fault segment is most likely the cause for the decrease in opening width, as proposed by von Hagke et al. (2019).
Vogar, northwestern fracture (Fig. 18b). The northwestern fracture in the DEM of the Vogar fissure swarm represents a graben boundary fault. The western tip of the fracture system is composed of several isolated fractures. Measurements of these fractures show vertical offsets <2 m and opening widths up to 6 m. Thus, the fractures including the tip of the larger structure until approximately 930 m al.st. are classified as fissures. The following fracture segments towards the north show an overall increasing trend of vertical offset reaching the maximum of 13 m at 1900 m al.st. Reviewing the data from TanDEM-X WorldDEM™, the fracture can be traced 500 m further from the end of our DEM. Thus, the maximum vertical offset at 930 m al.st. is interpreted as the central point of the fault ellipsoid. The opening width along strike has a trend similar to the vertical offset, increasing towards the center of the fracture. However, the opening width is less consistent and varies ±5 m around the general trend over distances of few tens of meters, also resulting in intervals of no measurable opening width, e.g., between 1400 and 1540 m al.st. Several areas with a prominent surface slope, dipping away (SE) from the fracture, can be identified on the hanging wall at 1220–1320, 1700, 1750–1950 and 2000 m al.st. and are interpreted as TBs. This structure is a MDF with endmember types TB and DF, respectively.
Vogar, southeastern fracture (Fig. 18b). Partly also presented in von Hagke et al. (2019), the southeastern fracture consists of several segments that are partially overlapping in relay zones (e.g., 1000, 1400 and 1900 m al.st.), with vertical offsets consistently fluctuating around 6 m. We classify these fractures as DFs. Several sections have no measurable opening width (e.g., 140–210, 310–390, 430–4802 m and 870–930 m al.st.), because they are filled to the surface, as confirmed by field observation. From 1600 m al.st. towards the NE, the hanging wall surface shows a significant slope towards the graben center. Considering the surface morphology of the surrounding area showing a clear rim at the edge of the slope and spatter cones and domes on top of the slope, the slope is most likely caused by a lava flow and not by tectonically induced tilting resulting in TBs. In the context of the local setting, the fault is part of the southern graben boundary fault dipping in the opposite direction as the northern one. Whether this is the actual graben boundary or rather an antithetic fault is not clear, as several parallel faults dipping in the same direction can be identified in 400 and 1000 m SE of the high-resolution DEM.

Figure 19DEM and proposed endmember types of the fractures of the Thingvellir fissure swarm. Projection of the DEM: WGS1984 UTM 27N.
Thingvellir, Almannagjá (Fig. 19). As described by Gudmundsson (1987b), the Thingvellir fissure swarm consists of two types of fractures: extension fractures with vertical offsets <0.5 m, in which category most fissures fall, and dilatant normal faults, that often turn into fissures at their tips. Reviewing our DEM, the fault parallel structures along the hanging wall, we interpret the eastward-dipping slope as several TBs, in accordance with the interpretation of Kettermann et al. (2019). In combination with the large opening width and vertical offset, the proposed endmember type is TB. The en échelon fractures in the southern part of the DEM show vertical offsets <1 m, when measured on the adjacent sides of single fractures, and thus qualify as fissures. However, the eastward-sloping surface is very prominent at this location, resulting in a combined vertical offset of the faults locally exceeding 10 m.
The en échelon fractures have been interpreted as surface expression of an old weakness, possibly a Pleistocene fault that has been covered by postglacial lava flows (Gudmundsson, 1987b). Thus, the opening width and vertical offsets are interpreted to represent the geometry of a larger, underlying structure. We classify this structure as a very large TB. The overall trends of opening width as well as vertical offset are maximal at the center of the fault and decrease towards the tips. This is interpreted as the typical behavior of an ellipsoidal fault. The dataset of the Almannagjá fault is not only the largest of our datasets, with an almost 7 km length, but also includes the largest values of opening width, vertical offset and the most prominent TBs. We infer that these large offsets are possible due to the relatively larger dilation rate of Thingvellir fissure swarm as compared to, e.g., the proximate Vogar fissure swarm (Gudmundsson, 1987b).
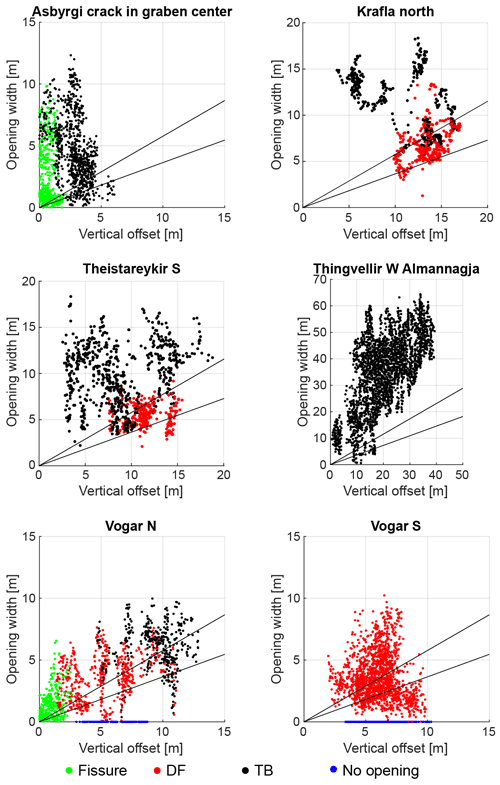
Figure 20Plots of opening width against vertical offset. The straight black lines represent R for basement fault dips of 60∘ (upper one) and 70∘ (lower one).
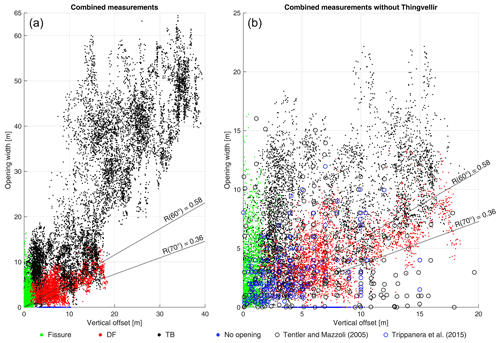
Figure 21(a) Cumulative plots of opening width plotted against the vertical offset, including all reviewed fractures. (b) Cumulative plots of opening width plotted against the vertical offset with data from Tentler and Mazzoli (2005) and Trippanera et al. (2015), excluding Thingvellir. The straight black lines represent R for basement fault dips of 60 and 70∘.
In this study, we used UAV-based photogrammetry to create high-resolution DEMs of representative faults and fractures of the Icelandic rift. We show that these DEMs can be used to map faults and fractures in much more detail when compared to aerial photography or satellite imagery. Furthermore, these DEMs can be used to extract geometries much faster than taking measurements in the field. Resolutions of 5–15 cm per pixel are appropriate to map fractures in volcanic settings, corroborating the findings of Bonali et al. (2019a). We derived three endmember types of surface expressions of fractures linked to the massively dilatant faults in Iceland, based on the ratio of opening width and vertical offset, similar to earlier studies on dilatant fractures (Tentler and Mazzoli, 2005; Trippanera et al., 2015, and references therein).
We visualized this ratio for different field areas, color coded for different endmembers (Figs. 20 and 21). The straight lines plotted in the figure represent the relationship between vertical offset and horizontal opening corresponding to a simple dilatant normal fault at depth with dips ranging between 60 and 70∘, being within the dip range as commonly inferred for Iceland (Angelier et al., 1997; Grant and Kattenhorn, 2004; Gudmundsson, 1992; von Hagke et al., 2019; Trippanera et al., 2015). We further define the parameter R as ratio of opening width and vertical offset as Eq. (1):
where O is the opening width and V the vertical offset measured on one scanline. We calculated R for all endmember types with measured opening width sorted by area (Fig. 22). Expected R values for fault dips between 60 and 70∘ are within the interval of and .
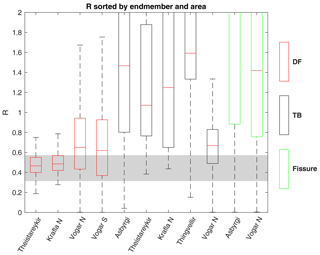
Figure 22Box plots of R sorted by endmember type and area. The y axis of the graph has been cut at R=2 to show the majority of values (O≫V will result in very large R). Outliers were removed. The horizontal grey bar indicates the expected values for . Maximum values of cut-off whiskers: Ásbyrgi TB: 897.23, Theistareykir TB: 5.34, Krafla N: 4.02, Thingvellir N: 21.78, Ásbyrgi fissures: 5499.11, Vogar N fissures: 174.62. Dilatant faults with filled openings (O=0) have been excluded, because . Measurements with V=0 have not been encountered due to the surface roughness.
The fractures in Ásbyrgi have been classified as fissures and tilted blocks. The proximity of the fissures to the fault and the prominent surface slope may possibly be interpreted as doming of the surface related to a subsurface dike intrusion, as described for similar structures by Tentler and Temperley (2007). However, in this model, a slope on both sides of the fractures is expected. Since in Ásbyrgi the local slope can only be identified at the hanging wall, we interpret the structure as a TB. The plot of our data from Ásbyrgi does not show a clear separation between the point clouds for fissures and TBs (Fig. 20). The different endmember classification in the plot is a result of our definition for the cutoff of vertical offset, which automatically defines fractures with vertical offsets <2 m as fissures, thus creating an artificial threshold in a smooth transition within a continuum. The data show that TBs and fissures are endmembers of a continuum, without a gap or separation in the data. Most measurements from Ásbyrgi show much higher R values as would be expected for slip along a basement fault dipping steeper than 60∘ (Fig. 12a, d), in agreement with the geometry of TBs (Kettermann et al., 2019) and opening-mode fissures.
In the Ásbyrgi area, we noted TB data points with very low opening widths. These measurements are in areas where the visible opening is reduced by vegetation and soil cover. This effect can be seen mostly in relay zones where the opening width is summed over smaller fractures or at the fault tip in the north, thus indicating an underestimation of opening width by mapping errors, depending on the type and coverage of vegetation, as explained in Sect. 2.3.2 and Fig. 5. A general trend of the surface dipping at approximately 5 % from west to east can be identified in our high-resolution and the TanDEM-X WorldDEM™ data. Since the vertical offsets have been measured at a distance to the fracture, an additional error is made, leading to the overestimation of vertical offsets and thus underestimation of R.
Krafla N includes the two endmember types of MDFs: DFs and TBs, which form two clusters (Fig. 20). DFs with the lowest R≈0.49 are interpreted to be the closest to “classic MDF” (Fig. 12a), but most of the data show much larger R, with TBs often having R>1 (Fig. 20). However, the two clusters of R in Krafla overlap. R in data of Theistareykir S shows a similar trend, where DFs are within the commonly assumed interval of R with R≈0.47, while TBs tend towards larger R with R≈1.07. However, in Theistareykir S, the vertical offsets are underestimated at the TBs due to the missing horizontal part of the hanging wall in the DEM, leading to a too-high R value. Assuming the same vertical offset as in the DF part of the fault, the vertical offset of the TBs might be underestimated by approximately 5 m. Overlaps of DFs and TBs can be explained by the resolution of surface tilt; TBs with surface dips ≪5∘ may be unrecognized and misinterpreted as DFs. Particularly the transition from TB to DF is prone to interpretation errors when no clear boundary is visible, e.g., due to a smooth transition from tilted to horizontal hanging wall.
The tendency of TBs towards large opening width with respectively smaller vertical offset becomes even more apparent in Thingvellir, where TBs are well developed and the majority of the measurements have R>1 (median R≈1.59). The smaller, detached cluster between 0 and 5 m vertical offset and 5–20 m opening width (Fig. 20) results from the measurements taken on the en échelon fractures in the southern part of the main fault. These classify as fissures when viewed as single fractures (see Fig. S3) but when counted cumulatively reflect the underlying fault structure as a TB. This strain partitioning has been described as separate fault structure by Trippanera et al. (2015).
The fractures mapped in Vogar are of particular value, as all proposed endmember types associated with MDFs are present: fissures form a continuum with DFs in the north (Fig. 20). Faults with no distinguishable opening width were all confirmed in the field to be filled with sediment at the northern and southern fractures. R values of DFs in the north (R≈0.65) and south (R≈0.62) are similar to R values of TBs (R≈0.67), while TBs trend towards larger vertical offsets (Fig. 20). The high value of R for DFs is most likely caused by strong erosion of the fracture walls, leading to overestimation of the opening width and accumulation of material in the opening, up to completely covering it. With our selected areas, all types of TBs as defined in Kettermann et al. (2019) are covered: Type I in Vogar and Krafla, Type II in Theistareykir and Type III in Thingvellir, all resulting in R values larger than expected for the “classic” MDF. Solely relying on measurements of opening width and vertical offset, expressed as ratio R, different types of TBs cannot be distinguished. This is because vertical offset is less influenced by surface structures, but deep processes and fault geometries, when compared to opening width. Furthermore, vertical offset has been measured outside the influence area of TBs, while opening width depends on TB geometry and erosion. Therefore, simple numeric measurements are not sufficient to identify the type of TB. Additionally, opening width can vary strongly over short distances. Generally, in all areas, the data of the endmember classifications form one continuous cloud.
We added further measurements from Ásbyrgi and Krafla (see Fig. S4) in combined plots (Fig. 21) including data from Iceland and Ethiopia (Tentler and Mazzoli, 2005; Trippanera et al., 2015, and references therein). The distribution of the endmember types remains consistent. However, the data of Tentler and Mazzoli (2005) add a number of measurements with V=10–15 m and O<5 m, suggesting basement fault dips steeper than 70∘. From Fig. 21, we infer the following:
-
Fissures have vertical offsets <2 m per definition and can accumulate up to 15 m of opening width. Fractures with larger opening widths will also develop larger vertical offsets and thus no longer qualify as fissures. However, there is no clear correlation between V and O in any of the datasets. Some weak correlation may possibly be inferred for Vogar or Krafla (Fig. 20).
-
DF clusters tend to have larger vertical offset than opening width. The net amount of vertical offset and opening width is directly linked to the dip of the basement fault. A basement fault dipping >45∘ produces a vertical offset at the surface that is larger than the opening width. DFs with V>10 m concentrate (with some outliers) around R associated with 60–70∘ basement fault dip. This is in line with the results from analog models by von Hagke et al. (2019), who use a prescribed basement fault dip of 60∘. Similarly, this fits with the transition from pure extension to a steep normal fault as proposed by Acocella et al. (2003) and Gudmundsson (1992). Measurements classified as DFs that show higher values of R (associated with shallower basement fault dips) are the result of erosion and the disintegration of the fracture walls, leading to an overestimation of the opening width.
-
TBs plot in clusters that also overlap with DFs but mainly have R>0.5, depending on fault geometry. Faults with large vertical offsets in relation to the opening width can produce TB clusters similar to those of DFs, as observed in Vogar. However, when compared to their non-TB counterparts, the TB clusters trend towards larger opening widths (see Figs. S4 and S5). This trend can be explained by the rotation of the hanging wall away from the footwall and a resulting increased aperture (Kettermann et al., 2019). Therefore, measurements of opening width on TBs led to an overestimation of the overall dilatancy of the fractures.
Vertically elongated clusters in the plots (Fig. 21) are the result of relatively stable vertical offsets with smooth gradients over long distances along strike at most faults, while the opening width shows much more local variations. Piercing point correlations of adjacent fracture walls are more reliable for small openings and opening width measurements can vary strongly over the fault length. Consequently, errors increase towards the fault center where displacement is largest, as shown for Ásbyrgi, Krafla and Theistareykir. Maximum opening widths are larger than 60 m in the Thingvellir dataset, with a maximum vertical offset of 40 m. Our data are consistent with the measurements of Tentler and Mazzoli (2005) and Trippanera et al. (2015), who have however not studied faults with large values as present in Thingvellir. Figure 22 shows the distributions of R for the different endmembers, but the overlapping distributions indicate that all mapped structures belong to a larger continuum with smooth transitions between endmembers. Furthermore, vertical offsets with small opening widths are rare in our data and the data of Tentler and Mazzoli (2005) and Trippanera et al. (2015), resulting in a gap between MDFs with and without TBs, and DFs with no discernible opening (Fig. 21). The reasons for this gap in our data are (i) the mapping procedure of the fracture traces (see Fig. S6) at the transition between the DF and no opening, and (ii) the interval length between scanlines (see Fig. S6). The transition between opening and non-opening occurs over shorter lengths; therefore, the transition between opening and the fully filled state with decreasing opening widths is not fully covered by the scanlines, since a smooth transition between the filled and open state will be missed when it appears over a distance smaller than our scanline interval of 1 m.
From the measurements and interpretations, we derive the following observations:
-
Measurements of vertical offset follow the trend of an elliptical fault without much local variation, whereas opening width is more prone to local variations when measured along strike.
-
The local variations in opening width can be caused by formation of tilted blocks or by erosion, corroborating earlier studies. Erosional processes such as collapse of the fracture walls or disintegrated relays of the fracture walls may lead to overestimation of opening width; when fractures are filled and/or covered by sediment or vegetation, opening width may be underestimated.
-
Underestimation of the vertical offset of the master fault at depth occurs when measurements are taken on the slope of a tilted block.
-
Structures that appear as non-dilatant normal faults on the surface can consistently be shown to have a blind opening hidden by vegetation or sedimentation.
-
Tilted blocks are common features observed along all faults. They may be present along entire faults (Thingvellir) or exist only locally (Vogar southeastern fault).
By analyzing the ratio of opening width and vertical displacement, we conclude that structural endmembers (fissures, dilatant faults with and without discernible opening and tilted blocks) are part of a continuum with smooth transitions. Extreme values for R, i.e., the endmembers, can be reliably used to predict fault structures. However, for a wide range of R-value fissures, DFs and TBs can coexist and a clear identification solely via the determination of R is impossible.
This is rooted in the duality of governing processes, where the vertical offset is (in the absence of high sedimentation rates) controlled by deep fault kinematics and the opening width shows a stronger control by surface processes such as erosion or vegetation coverage.
A table containing the measurements of opening width and vertical offset and additional figures is provided in the Supplement.
The supplement related to this article is available online at: https://doi.org/10.5194/se-10-1757-2019-supplement.
CW acquired the data, did the processing and data extraction and prepared the manuscript with contribution from the co-authors. JLU contributed to the conceptualization, discussion and interpretation of the data and acquired funding. MK acquired data and contributed to the processing, conceptualization and discussion. CvH and KR contributed to the conceptualization and discussion of the paper and acquired funding.
The authors declare that they have no conflict of interest.
We would like to thank the park administration of the Thingvellir National Park for giving us the permission to use our drone in the park outside of business hours and Daniele Trippanera for sharing his data with us. Further thanks go to the Deutsche Forschungsgemeinschaft for funding this project: MDF: The structure and evolution of near-surface massively dilatant faults). TanDEM-X WorldDEM™ data are provided by a DLR Science grant (2017). We further thank two anonymous reviewers who helped to improve the manuscript with their comments.
This research has been supported by the Deutsche Forschungsgemeinschaft (DFG) (grant no. 316167043).
This paper was edited by Cristiano Collettini and reviewed by two anonymous referees.
Abe, S., van Gent, H., and Urai, J. L.: DEM simulation of normal faults in cohesive materials, Tectonophysics, 512, 12–21, https://doi.org/10.1016/j.tecto.2011.09.008, 2011.
Acocella, V., Gudmundsson, A., and Funiciello, R.: Interaction and linkage of extension fractures and normal faults: examples from the rift zone of Iceland, J. Struct. Geol., 22, 1233–1246, https://doi.org/10.1016/S0191-8141(00)00031-6, 2000.
Acocella, V., Korme, T., and Salvini, F.: Formation of normal faults along the axial zone of the Ethiopian Rift, J. Struct. Geol., 25, 503–513, 2003.
Allen, R. M., Nolet, G., Morgan, J., Vogfjörd, K., Nettles, M., Ekström, G., Bergsson, B. H., Erlendsson, P., Foulger, G. R., Jakobsdóttir, S. S., Julian, B. R., Pritchard, M., Ragnarsson, S., and Stefánsson, R.: Plume-driven plumbing and crustal formation in Iceland, J. Geophys. Res., 107, ESE 4-1–ESE 4-19, https://doi.org/10.1029/2001JB000584, 2002.
Angelier, J., Bergerat, F., Dauteuil, O., and Villemin, T.: Effective tension-shear relationships in extensional fissure swarms, axial rift zone of northeastern Iceland, J. Struct. Geol., 19, 673–685, https://doi.org/10.1016/S0191-8141(96)00106-X, 1997.
Bonali, F. L., Tibaldi, A., Marchese, F., Fallati, L., Russo, E., Corselli, C., and Savini, A.: UAV-based surveying in volcano-tectonics: An example from the Iceland rift, J. Struct. Geol., 121, 46–64, https://doi.org/10.1016/j.jsg.2019.02.004, 2019a.
Bonali, F. L., Tibaldi, A., Mariotto, F. P., Saviano, D., Meloni, A., and Sajovitz, P.: Geometry, oblique kinematics and extensional strain variation along a diverging plate boundary: The example of the northern Theistareykir Fissure Swarm, NE Iceland, Tectonophysics, 756, 57–72, https://doi.org/10.1016/j.tecto.2019.02.018, 2019b.
Brandsdóttir, B., Hooft, E. E. E., Mjelde, R., and Murai, Y.: Origin and evolution of the Kolbeinsey Ridge and Iceland Plateau, N-Atlantic, Geochem. Geophys. Geosystems, 16, 612–634, 2015.
Bubeck, A., Walker, R. J., Imber, J., Holdsworth, R. E., MacLeod, C. J., and Holwell, D. A.: Extension parallel to the rift zone during segmented fault growth: application to the evolution of the NE Atlantic, Solid Earth, 8, 1161–1180, https://doi.org/10.5194/se-8-1161-2017, 2017.
Bubeck, A., Walker, R. J., Imber, J., and MacLeod, C. J.: Normal fault growth in layered basaltic rocks: The role of strain rate in fault evolution, J. Struct. Geol., 115, 103–120, https://doi.org/10.1016/j.jsg.2018.07.017, 2018.
Clifton, A. E. and Kattenhorn, S. A.: Structural architecture of a highly oblique divergent plate boundary segment, Tectonophysics, 419, 27–40, https://doi.org/10.1016/j.tecto.2006.03.016, 2006.
Clifton, A. E. and Schlische, R. W.: Fracture populations on the Reykjanes Peninsula, Iceland: Comparison with experimental clay models of oblique rifting, J. Geophys. Res.-Sol. Ea., 108, ETG 4-1–ETG 4-17, https://doi.org/10.1029/2001JB000635, 2003.
Crider, J. G. and Peacock, D. C. P.: Initiation of brittle faults in the upper crust: a review of field observations, J. Struct. Geol., 26, 691–707, 2004.
Einarsson, P.: Earthquakes and present-day tectonism in Iceland, Tectonophysics, 189, 261–279, https://doi.org/10.1016/0040-1951(91)90501-I, 1991.
Faulkner, D. R., Jackson, C. A. L., Lunn, R. J., Schlische, R. W., Shipton, Z. K., Wibberley, C. A. J., and Withjack, M. O.: A review of recent developments concerning the structure, mechanics and fluid flow properties of fault zones, J. Struct. Geol., 32, 1557–1575, https://doi.org/10.1016/j.jsg.2010.06.009, 2010.
Ferrill, D. A. and Morris, A. P.: Dilational normal faults, J. Struct. Geol., 25, 183–196, https://doi.org/10.1016/S0191-8141(02)00029-9, 2003.
Forslund, T. and Gudmundsson, A.: Crustal spreading due to dikes and faults in southwest Iceland, J. Struct. Geol., 13, 443–457, https://doi.org/10.1016/0191-8141(91)90017-D, 1991.
Geiger, H., Mattsson, T., Deegan, F. M., Troll, V. R., Burchardt, S., Gudmundsson, Ó., Tryggvason, A., Krumbholz, M., and Harris, C.: Magma plumbing for the 2014-2015 Holuhraun eruption, Iceland: MAGMA PLUMBING FOR HOLUHRAUN, Geochem. Geophys. Geosyst., 17, 2953–2968, https://doi.org/10.1002/2016GC006317, 2016.
Grant, J. V. and Kattenhorn, S. A.: Evolution of vertical faults at an extensional plate boundary, southwest Iceland, J. Struct. Geol., 26, 537–557, https://doi.org/10.1016/j.jsg.2003.07.003, 2004.
Gudmundsson, A.: Form and dimensions of dykes in eastern Iceland, Tectonophysics, 95, 295–307, https://doi.org/10.1016/0040-1951(83)90074-4, 1983.
Gudmundsson, A.: Mechanical aspects of postglacial volcanism and tectonics of the Reykjanes Peninsula, southwest Iceland, J. Geophys. Res.-Sol. Ea., 91, 12711–12721, https://doi.org/10.1029/JB091iB12p12711, 1986.
Gudmundsson, A.: Geometry, formation and development of tectonic fractures on the Reykjanes Peninsula, southwest Iceland, Tectonophysics, 139, 295–308, https://doi.org/10.1016/0040-1951(87)90103-X, 1987a.
Gudmundsson, A.: Tectonics of the thingvellir fissure swarm, sw iceland, J. Struct. Geol., 9, 61–69, https://doi.org/10.1016/0191-8141(87)90044-7, 1987b.
Gudmundsson, A.: Formation and growth of normal faults at the divergent plate boundary in Iceland, Terra Nova, 4, 464–471, https://doi.org/10.1111/j.1365-3121.1992.tb00582.x, 1992.
Gudmundsson, A.: Infrastructure and mechanics of volcanic systems in Iceland, J. Volcanol. Geoth. Res., 64, 1–22, https://doi.org/10.1016/0377-0273(95)92782-Q, 1995.
Gudmundsson, A. and Bäckström, K.: Structure and development of the Sveinagja graben, Northeast Iceland, Tectonophysics, 200, 111–125, https://doi.org/10.1016/0040-1951(91)90009-H, 1991.
Gudmundsson, A., Oskarsson, N., Gronvold, K., Saemundsson, K., Sigurdsson, O., Stefansson, R., Gislason, S. R., Einarsson, P., Brandsdóttir, B., Larsen, G., Johanesson, H., and Thordarson, T.: The 1991 eruption of Hekla, Iceland, Bull. Volcanol., 54, 238–246, 1992.
Gudmundsson, A., Brynjolfsson, S., and Jonsson, M. T.: Structural analysis of a transform fault-rift zone junction in North Iceland, Tectonophysics, 220, 205–221, https://doi.org/10.1016/0040-1951(93)90232-9, 1993.
Hardy, S.: Propagation of blind normal faults to the surface in basaltic sequences: Insights from 2D discrete element modelling, Mar. Pet. Geol., 48, 149–159, https://doi.org/10.1016/j.marpetgeo.2013.08.012, 2013.
Hatton, C. G., Main, I. G., and Meredith, P. G.: Non-universal scaling of fracture length and opening displacement, Nature, 367, 162–162, 1994.
Hjartardóttir, Á. R., Einarsson, P., Bramham, E., and Wright, T. J.: The Krafla fissure swarm, Iceland, and its formation by rifting events, Bull. Volcanol., 74, 2139–2153, https://doi.org/10.1007/s00445-012-0659-0, 2012.
Hjartardóttir, Á. R., Einarsson, P., Magnúsdóttir, S., Björnsdóttir, Þ., and Brandsdóttir, B.: Fracture systems of the Northern Volcanic Rift Zone, Iceland: an onshore part of the Mid-Atlantic plate boundary, Geol. Soc. Lond. Spec. Publ., 420, 297–314, https://doi.org/10.1144/SP420.1, 2015.
Holland, M., Urai, J. L., and Martel, S.: The internal structure of fault zones in basaltic sequences, Earth Planet. Sci. Lett., 248, 301–315, https://doi.org/10.1016/j.epsl.2006.05.035, 2006.
Hollingsworth, J., Leprince, S., Ayoub, F., and Avouac, J.-P.: Deformation during the 1975–1984 Krafla rifting crisis, NE Iceland, measured from historical optical imagery: 1975–84 KRAFLA RIFT CRISIS DEFORMATION, J. Geophys. Res.-Sol. Ea., 117, B11407, https://doi.org/10.1029/2012JB009140, 2012.
James, M. R. and Robson, S.: Mitigating systematic error in topographic models derived from UAV and ground-based image networks: MITIGATING SYSTEMATIC ERROR IN TOPOGRAPHIC MODELS, Earth Surf. Process. Landf., 39, 1413–1420, https://doi.org/10.1002/esp.3609, 2014.
Jarðfræðikort af Íslandi: Berggrunnur – 1:600 000 – NI_J600v_berg_2.utg, available at: https://gatt.lmi.is:/geonetwork/srv/api/records/\{005FFDAD-69A1-4385-B16F-FD31B960FE33\}, last access: 4 June 2019.
Kettermann, M., Grützner, C., van Gent, H. W., Urai, J. L., Reicherter, K., and Mertens, J.: Evolution of a highly dilatant fault zone in the grabens of Canyonlands National Park, Utah, USA – integrating fieldwork, ground-penetrating radar and airborne imagery analysis, Solid Earth, 6, 839–855, https://doi.org/10.5194/se-6-839-2015, 2015.
Kettermann, M., von Hagke, C., van Gent, H. W., Grützner, C., and Urai, J. L.: Dilatant normal faulting in jointed cohesive rocks: a physical model study, Solid Earth, 7, 843–856, https://doi.org/10.5194/se-7-843-2016, 2016.
Kettermann, M., Weismüller, C., von Hagke, C., Reicherter, K., and Urai, J. L.: Large near-surface block rotations at normal faults of the Iceland rift: Evolution of tectonic caves and dilatancy, Geology, 47, 781–785, https://doi.org/10.1130/G46158.1, 2019.
Lawver, L. A. and Muller, R. D.: Iceland hotspot track, Geology, 22, 311–314, https://doi.org/10.1130/0091-7613(1994)022<0311:IHT>2.3.CO;2, 1994.
Lucieer, A., Turner, D., King, D. H., and Robinson, S. A.: Using an Unmanned Aerial Vehicle (UAV) to capturemicro-topography of Antarctic moss beds, Int. J. Appl. Earth Obs. Geoinformation, 27, 53–62, 2014.
MAP.IS Loftmyndir ehf: available at: http://map.is/base/, last access: 4 June 2019.
Martel, S. J. and Langley, J. S.: Propagation of normal faults to the surface in basalt, Koae fault system, Hawaii, J. Struct. Geol., 28, 2123–2143, https://doi.org/10.1016/j.jsg.2005.12.004, 2006.
Müller, D., Walter, T. R., Schöpa, A., Witt, T., Steinke, B., Gudmundsson, M. T., and Dürig, T.: High-Resolution Digital Elevation modeling from TLS and UAV Campaign Reveals Structural Complexity at the 2014/2015 Holuhraun Eruption Site, iceland, Front Earth Sci., 5, 59, https://doi.org/10.3389/feart.2017.00059, 2017.
Niethammer, U., James, M. R., Rothmund, J., Travelett, J., and Joswig, M.: UAV-based remote sensing of the Super-Sauze landslide: Evaluation and results, Eng. Geol., 128, 2–11, 2012.
Opheim, J. A. and Gudmundsson, A.: Formation and geometry of fractures, and related volcanism, of the Krafla fissure swarm, northeast Iceland, Geol. Soc. Am. Bull., 101, 1608–1622, 1989.
Pasquarè Mariotto, F., Bonali, F. L., Tibaldi, A., Rust, D., Oppizzi, P., and Cavallo, A.: Holocene displacement field at an emerged oceanic transform-ridge junction: The Husavik-Flatey Fault – Gudfinnugja Fault system, North Iceland, J. Struct. Geol., 75, 118–134, https://doi.org/10.1016/j.jsg.2015.03.011, 2015.
Peacock, D. C. P., Nixon, C. W., Rotevatn, A., Sanderson, D. J., and Zuluaga, L. F.: Glossary of fault and other fracture networks, J. Struct. Geol., 92, 12–29, https://doi.org/10.1016/j.jsg.2016.09.008, 2016.
Rose, W. I., Gu, Y., Watson, I. M., Yu, T., Bluth, G. J. S., Prata, A. J., Krueger, A. J., Krotkov, N., Carn, S., Fromm, M. D., Hunton, D. E., Ernst, G. G. J., Viggiano, A. A., Miller, T. M., Ballenthin, J. O., Reeves, J. M., Wilson, J. C., Anderson, B. E., and Flittner, D. E.: The February–March 2000 Eruption of Hekla, Iceland from a Satellite Perspective, Geophys. Monogr., 139, 107–132, https://doi.org/10.1029/139GM07, 2003.
Rowland, J. V., Baker, E., Ebinger, C. J., Keir, D., Kidane, T., Biggs, J., Hayward, N., and Wright, T. J.: Fault growth at a nascent slow-spreading ridge: 2005 Dabbahu rifting episode, Afar, Geophys. J. Int., 171, 1226–1246, https://doi.org/10.1111/j.1365-246X.2007.03584.x, 2007.
Sæmundsson, K.: Evolution of the Axial Rifting Zone in Northern Iceland and the Tjörnes Fracture Zone, Geol. Soc. Am. Bull., 85, 495, https://doi.org/10.1130/0016-7606(1974)85<495:EOTARZ>2.0.CO;2, 1974.
Saemundsson, K. and Saemundsson, K.: Geology of the Thingvallavatn Area, Oikos, 64, 40, https://doi.org/10.2307/3545042, 1992.
Schmidt, A., Leadbetter, S., Theys, N., Carboni, E., Witham, C. S., Stevenson, J. A., Birch, C. E., Thordarson, T., Turnock, S., Barsotti, S., Delaney, L., Feng, W., Grainger, R. G., Hort, M. C., Höskuldsson, Á., Ialongo, I., Ilyinskaya, E., Jóhansson, T., Kenny, P., Mather, T. A., Richards, N. A. D., and Sheperd, J.: Satellite detection, long-range transport, and air quality impacts of volcanic sulfur dioxide from the 2014–2015 flood lava eruption at Bárðarbunga (Iceland), J. Geophys. Res.-Atmos., 120, 9739–9757, https://doi.org/10.1002/2015JD023638, 2015.
Smart, K. J. and Ferrill, D. A.: Discrete element modeling of extensional fault-related monocline formation, J. Struct. Geol., 115, 82–90, https://doi.org/10.1016/j.jsg.2018.07.009, 2018.
Sonnette, L., Angelier, J., Villemin, T., and Bergerat, F.: Faulting and fissuring in active oceanic rift: Surface expression, distribution and tectonic-volcanic interaction in the Thingvellir Fissure Swarm, Iceland, J. Struct. Geol., 32, 407–422, https://doi.org/10.1016/j.jsg.2010.01.003, 2010.
Tentler, T. and Mazzoli, S.: Architecture of normal faults in the rift zone of central north Iceland, J. Struct. Geol., 27, 1721–1739, 2005.
Tentler, T. and Temperley, S.: Magmatic fissures and their systems in Iceland: A tectonomagmatic model, Tectonics, 26, TC5019, https://doi.org/10.1029/2006TC002037, 2007.
Thiele, S. T., Grose, L., Samsu, A., Micklethwaite, S., Vollgger, S. A., and Cruden, A. R.: Rapid, semi-automatic fracture and contact mapping for point clouds, images and geophysical data, Solid Earth, 8, 1241–1253, https://doi.org/10.5194/se-8-1241-2017, 2017.
Thordarson, T. and Larsen, G.: Volcanism in Iceland in historical time: Volcano types, eruption styles and eruptive history, J. Geodyn., 43, 118–152, https://doi.org/10.1016/j.jog.2006.09.005, 2007.
Tibaldi, A., Bonali, F. L., Einarsson, P., Hjartardóttir, Á. R., and Pasquarè Mariotto, F. A.: Partitioning of Holocene kinematics and interaction between the Theistareykir Fissure Swarm and the Husavik-Flatey Fault, North Iceland, J. Struct. Geol., 83, 134–155, https://doi.org/10.1016/j.jsg.2016.01.003, 2016.
Trippanera, D., Acocella, V., Ruch, J., and Abebe, B.: Fault and graben growth along active magmatic divergent plate boundaries in Iceland and Ethiopia, Tectonics, 34, 2318–2348, https://doi.org/10.1002/2015TC003991, 2015.
Trippanera, D., Ruch, J., Passone, L., and Jónsson, S.: Structural Mapping of Dike-Induced Faulting in Harrat Lunayyir (Saudi Arabia) by Using High Resolution Drone Imagery, Front. Earth Sci., 7, 168, https://doi.org/10.3389/feart.2019.00168, 2019.
Tryggvason, E.: Multiple magma reservoirs in a rift zone volcano: Ground deformation and magma transport during the September 1984 eruption of Krafla, Iceland, J. Volcanol. Geotherm. Res., 28, 1–44, https://doi.org/10.1016/0377-0273(86)90003-X, 1986.
Tryggvason, E.: Surface deformation at the Krafla volcano, North Iceland, 1982–1992, Bull. Volcanol., 56, 98–107, 1994.
van Gent, H. W., Holland, M., Urai, J. L., and Loosveld, R.: Evolution of fault zones in carbonates with mechanical stratigraphy – Insights from scale models using layered cohesive powder, J. Struct. Geol., 32, 1375–1391, https://doi.org/10.1016/j.jsg.2009.05.006, 2010.
Vasuki, Y., Holden, E.-J., Kovesi, P., and Micklethwaite, S.: Semi-automatic mapping of geological Structures using UAV-based photogrammetric data: An image analysis approach, Comput. Geosci., 69, 22–32, 2014.
Villemin, T. and Bergerat, F.: From surface fault traces to a fault growth model: The Vogar Fissure Swarm of the Reykjanes Peninsula, Southwest Iceland, J. Struct. Geol., 51, 38–51, https://doi.org/10.1016/j.jsg.2013.03.010, 2013.
Vink, G. E.: A Hotspot Model for Iceland and the Vøring Plateau, J. Geophys. Res., 89, 9949–9959, 1984.
Vitale, S. and Isaia, R.: Fractures and faults in volcanic rocks (Campi Flegrei, southern Italy): insight into volcano-tectonic processes, Int. J. Earth Sci., 103, 801–819, https://doi.org/10.1007/s00531-013-0979-0, 2014.
von Hagke, C., Kettermann, M., Bitsch, N., Bücken, D., Weismüller, C., and Urai, J. L.: The Effect of Obliquity of Slip in Normal Faults on Distribution of Open Fractures, Front. Earth Sci., 7, 18, https://doi.org/10.3389/feart.2019.00018, 2019.
Wolfe, C. J., Bjarnason, I. Th., VanDecar, J. C., and Solomon, S. C.: Seismic structure of the Iceland mantle plume, Nature, 385, 245–247, 1997.
Ziegler, M., Rajabi, M., Heidbach, O., Hersir, G. P., Ágústsson, K., Árnadóttir, S., and Zang, A.: The stress pattern of Iceland, Tectonophysics, 674, 101–113, https://doi.org/10.1016/j.tecto.2016.02.008, 2016.


