the Creative Commons Attribution 4.0 License.
the Creative Commons Attribution 4.0 License.
 | 02 Mar 2020
The variation and visualisation of elastic anisotropy in rock-forming minerals
David Healy
Nicholas Erik Timms
Mark Alan Pearce
All minerals behave elastically; elasticity is a rheological property that controls their ability to support stress, strain, and pressure; controls the nature of acoustic wave propagation; and influences subsequent plastic (i.e. permanent non-reversible) deformation. All minerals are intrinsically anisotropic in their elastic properties – that is, they have directional variations that are related to the configuration of the crystal lattice. This means that the commonly used mechanical elastic properties that relate elastic stress to elastic strain, including Young's modulus (E), Poisson's ratio (ν), shear modulus (G) and linear compressibility (β), are dependent on crystallographic direction. In this paper, we explore the ranges of anisotropy of E, ν, G and β in 86 rock-forming minerals, using previously published data, and show that the range is much wider than commonly assumed. We also explore how these variations (the directionality and the magnitude) are important for fundamental processes in the solid earth, including deformation (mechanical) twinning, coherent phase transformations and brittle failure. We present a new open-source software package (AnisoVis, written in MATLAB), which we use to calculate and visualise directional variations in elastic properties of rock-forming minerals. Following previous work in the fields of chemistry and materials science, we demonstrate that by visualising the variations in elasticity, we discover previously unreported properties of rock-forming minerals. For example, we show previously unreported directions of negative Poisson's ratio and negative linear compressibility, and we show that the existence of these features is more widespread (i.e. present in many more minerals) than previously thought. We illustrate the consequences of intrinsic elastic anisotropy for the elastic normal and shear strains within α-quartz single crystal under different applied stress fields; the role of elastic anisotropy on Dauphiné twinning and the α–β phase transformations in quartz; and stress distributions around voids of different shapes in talc, lizardite, albite, and sanidine. In addition to our specific examples, elastic anisotropy in rock-forming minerals, to the degree that we describe, has significant consequences for seismic (acoustic) anisotropy, for the focal mechanisms of earthquakes in anisotropic source regions (e.g. subducting slabs), for a range of brittle and ductile deformation mechanisms in minerals, and for geobarometry using mineral inclusions.
- Article
(20062 KB) - Full-text XML
- BibTeX
- EndNote


The elastic deformation of rock-forming minerals plays an important role in many earth processes. The increased availability of measured or calculated elastic properties of whole rocks and of specific rock-forming minerals has led to advances in many fields of earth science, including seismology, geodynamics, tectonics and metamorphism. Minerals have long been known to display anisotropy – directional variations – in their elastic properties (Mandell, 1927; Birch and Dancroft, 1938; Hearmon, 1946), and these variations show a close relationship to the symmetry of the mineral crystallographic structure (e.g. Angel et al., 2012; Timms et al., 2018). Advances in laboratory methods of measurement (acoustic velocities, Brillouin scattering, resonant ultrasound) and in theoretical techniques for ab initio molecular dynamics calculations has allowed scientists to quantify this anisotropy for a wide range of rock-forming minerals. For this paper we have collected 246 published datasets (measurements or ab initio calculations) of anisotropic elastic properties covering 86 distinct minerals. Elastic anisotropy is fully described by a fourth-rank tensor (compliance or stiffness; see below), and published data are commonly presented in a Voigt matrix format, listing up to 21 independent values (depending on the crystal symmetry class), whereas elastically isotropic minerals require only 2 independent values. A key aim of this paper is to use published data to visualise and explore elastic anisotropy in rock-forming minerals using familiar measures, such as Young's modulus and Poisson's ratio, but presented in novel formats and thereby render the increasing volume of data more transparent to analysis. As noted by previous authors (Karki and Chennamsetty, 2004; Lethbridge et al., 2010; Marmier et al., 2010; Gaillac et al., 2016), graphical depictions of the directional variation of elastic properties provide new opportunities to relate the quantitative data to the crystalline structure of the mineral. This in turn allows us to relate the observed or predicted mechanical and chemical behaviour of the mineral to specific crystallographic directions.
It has long been recognised that the velocity of seismic waves passing through rocks is a direct function of the minerals' elastic properties and their density, expressed through the Christoffel equation (Christoffel, 1877; Zhou and Greenhalgh, 2004). By considering rocks as polycrystalline aggregates, various workers have modelled seismic velocities and their anisotropy by combining single mineral elasticity data with different averaging schemes due to Reuss, Voigt or Hill (e.g. Mainprice, 1990; Lloyd and Kendall, 2005). This “rock recipe” approach has improved our understanding of the composition and structure of the lower crust and mantle and provided useful constraints for alternative models for observed variations in seismic anisotropy beneath continents and around arcs (e.g. Kern, 1982; Tatham et al., 2008; Healy et al., 2009).
Inclusions of one mineral or fluid within another host mineral have been used to estimate pressures at the time of inclusion or entrapment (Rosenfeld and Chase, 1961; Rosenfeld, 1969; Chopin, 1984; Gillet et al., 1984; van der Molen and van Roermund, 1986; Angel et al., 2014, 2015). The analysis critically depends on the elastic properties of the host mineral and, in the case of solid inclusions, on the inclusion itself, typically expressed as the bulk and shear moduli (e.g. Mazzucchelli et al., 2018). The underlying theory is based on the classical analysis by Eshelby (1957, 1959), who derived the equations for the deformation within an ellipsoidal inclusion and host due to the imposition of a far-field load. Most of the work to date has simplified the analysis to assume isotropy in both the inclusion and the host; although, see Zhang (1998) for a rare exception. Therefore, the full effects of host minerals and inclusion elastic anisotropy on inclusion-based geobarometry have not yet been rigorously investigated. Furthermore, fluid inclusions can decrepitate – i.e. fracture their host and dissipate their fluid – if their internal overpressure rises to a critical value that exceeds the local strength of the enclosing grain. The basis for predicting this behaviour is linear elastic fracture mechanics (LEFM) and the assumption of elastic isotropy is nearly ubiquitous (e.g. Lacazette, 1990).
Permanent non-reversible (i.e. plastic) deformation of minerals is invariably preceded by an elastic response prior to some form of yield condition being reached. For example, the elastic properties of minerals are important in the analysis of brittle cracking at the grain scale. As noted above for the decrepitation of fluid inclusions, the dominant paradigm for this analysis is linear elastic fracture mechanics (LEFM) and the assumption of elastic isotropy. This is important because faults and fractures in rocks are composite structures, built by the interaction and coalescence of many smaller cracks that nucleate at the scale of individual grains, i.e. within elastically anisotropic crystals. Jaeger and Cook (1969) used the equations published by Green and Taylor (1939) to consider the stresses developed at the edges of circular holes in anisotropic rocks. In their analysis (repeated in Pollard and Fletcher, 2005), they dismissed the significance of elastic anisotropy because the ratio of maximum to minimum Young's modulus in rocks is “rarely as high as 2”. Timms et al. (2010) conducted novel indentation experiments in a single crystal of quartz and produced a type of cone fracture with variations in opening angle and crack length that have a trigonal symmetry radiating from the point of contact, and thus demonstrated the key role played by the elastic anisotropy in controlling the fracture geometry. In the same study, these authors confirmed that elastic anisotropy plays a significant role in controlling the focal mechanisms (moment tensors) of acoustic emission events at the scale of a single crystal.
Poisson's ratio appears as a term in, for example, the equations describing fracture toughness and indentation, and therefore the precise value of Poisson's ratio is important. Poisson's ratio for isotropic materials is constrained to lie between 0.5 and −1, but there are no theoretical limits for anisotropic materials (Ting and Chen, 2005). Materials with Poisson's ratio less than 0 are termed “auxetic” (Lakes, 1987; Baughman et al., 1998a; Prawoto, 2012; Pasternak and Dyskin, 2012). Fracture toughness and resistance to indentation increase as Poisson's ratio approaches the lower (isotropic) limit of −1.0 (Yeganeh-Haeri et al., 1992). In rock-forming minerals, negative Poisson's ratios have already been documented for α-cristobalite (Yeganeh-Haeri et al., 1992), for quartz at the α–β phase transition (Mainprice and Casey, 1990), for talc (Mainprice et al., 2008), and for calcite and aragonite (Aouni and Wheeler, 2008). A key question therefore is to determine if there are other rock-forming minerals with the same properties and for which specific crystallographic directions. In a recent review of data on Poisson's ratio in engineering materials, Greaves et al. (2011) pointed out that the brittle–ductile transition at the grain scale is also a function of the elastic properties, and it is therefore likely dependent on direction in strongly anisotropic materials.
Elastic properties, and anisotropy, are also known to influence the “ductile” or plastic deformation of minerals, and they have a role in twinning, crystal plasticity (dislocation creep) and phase transformations (e.g. Tullis, 1970; Christian and Mahajan, 1995; Timms et al., 2018). The role of mineral elasticity is also important for the inhomogeneous distribution of stresses at the grain scale, necessary for driving pressure solution creep, and it is either treated implicitly (e.g. Wheeler, 1992) or explicitly (e.g. Wheeler, 2018). However, in many studies of rock deformation, minerals are commonly assumed to be elastically isotropic, scalar mean values of elastic moduli are used, and/or elastic strains are assumed to be small relative to plastic deformation, and so they are ignored (e.g. in visco-plastic self-consistent (VPSC) code) (Tomé and Lebensohn, 2009).
Given the key role that the elastic behaviour of minerals plays in so many fundamental geological processes, the scientific need to explore, understand and quantify directional variations in elastic properties in minerals is clear, as is the need to develop better approaches for their graphical visualisation. It is very difficult to fully appreciate the variations in elastic properties of a mineral simply by inspection of the fourth-rank-stiffness (or compliance) tensor, even in reduced form (Voigt notation; see below). A related requirement is the ability to investigate the interactions of mineral elastic anisotropy with imposed pressure, stress or strain. However, the visualisation and full appreciation of the properties of second-rank tensors, such as stress and strain, also presents challenges. No single surface can simultaneously portray the full anisotropy quantified by the diagonal (normal) and off-diagonal (shear) components of these tensorial mechanical quantities. Depictions of strain (or stress) as ellipsoids using only the principal values as semi-axes fail to quantify the directional variations in shear strain (or stress) and cannot easily show examples with mixed positive and negative principal values. We believe there are clear educational benefits to alternative approaches to visualising stress and strain, which students commonly find challenging, both conceptually and from a three-dimensional cognition perspective. For example, most geological textbooks either illustrate stress or strain as ellipses/ellipsoids of the normal component only (with the limitations described above), Mohr diagrams, or as written out in matrix notation. Furthermore, a common misnomer that some minerals are isotropic in material properties undoubtedly stems from the strong emphasis on optical properties of minerals in most undergraduate mineralogy courses. Software tools with the capability of comparative visualisation of various physical properties of minerals in two and three dimensions, including elastic, optical and acoustic anisotropy, have a valuable place in teaching and learning in mineralogy and in scientific research.
While the number of published datasets for single mineral elastic anisotropy continues to increase, there are relatively few publications that have reviewed or synthesised the available data. Gercek (2007) provided a useful review of Poisson's ratio for rocks and included some data for specific minerals. A more recent review of Poisson's ratio in rocks (Ji et al., 2018) also contained data for minerals, but it used their calculated Voigt–Reuss–Hill average values rather than quantifying their anisotropy. Workers in the fields of chemistry, physics and engineering have published methods and tools for visualising the elastic anisotropy of various groups of solid elements and compounds (Karki and Chennamsetty, 2004; Lethbridge et al., 2010; Marmier et al., 2010; Gaillac et al., 2016), and these predominantly focus on Poisson's ratio. In earth sciences, the MTEX toolbox for the analysis and modelling of crystallographic textures from electron backscatter diffraction (EBSD) data provides stereographic projections of elastic properties, such as Young's modulus, for single minerals (Hielscher and Schaeben, 2008; Mainprice et al., 2011). The MSAT toolbox for seismic anisotropy also contains options for plotting the elastic anisotropy of rocks and minerals (Walker and Wookey, 2012). Both MTEX and MSAT provide one or more options for displaying the elastic properties of minerals, but their focus is on the analysis of textures and seismic (acoustic) velocity anisotropy, respectively.
In this paper, we seek to quantify and visualise the variations in elastic properties of rock-forming minerals. In addition, we present the AnisoVis toolbox, a collection of new MATLAB scripts based on published methods with a graphical user interface (GUI) to explore the range of elastic anisotropy displayed by rock-forming minerals. Specifically, AnisoVis depicts the magnitude of the directional variations in elastic properties such as Young's modulus (E), Poisson's ratio (ν), shear modulus (G) and linear compressibility (β) using a range of two- and three-dimensional representations of each elastic property to enable a complete assessment of the anisotropy in relation to the crystal symmetry. We exploit the large database of published elastic constants for rock-forming minerals to systematically assess the anisotropy of different elastic properties as a function of temperature and pressure (where possible), giving new insights into the elastic behaviour of rock-forming minerals. Most of the figures presented in this paper have been produced from the AnisoVis toolbox, which is freely available on the web.
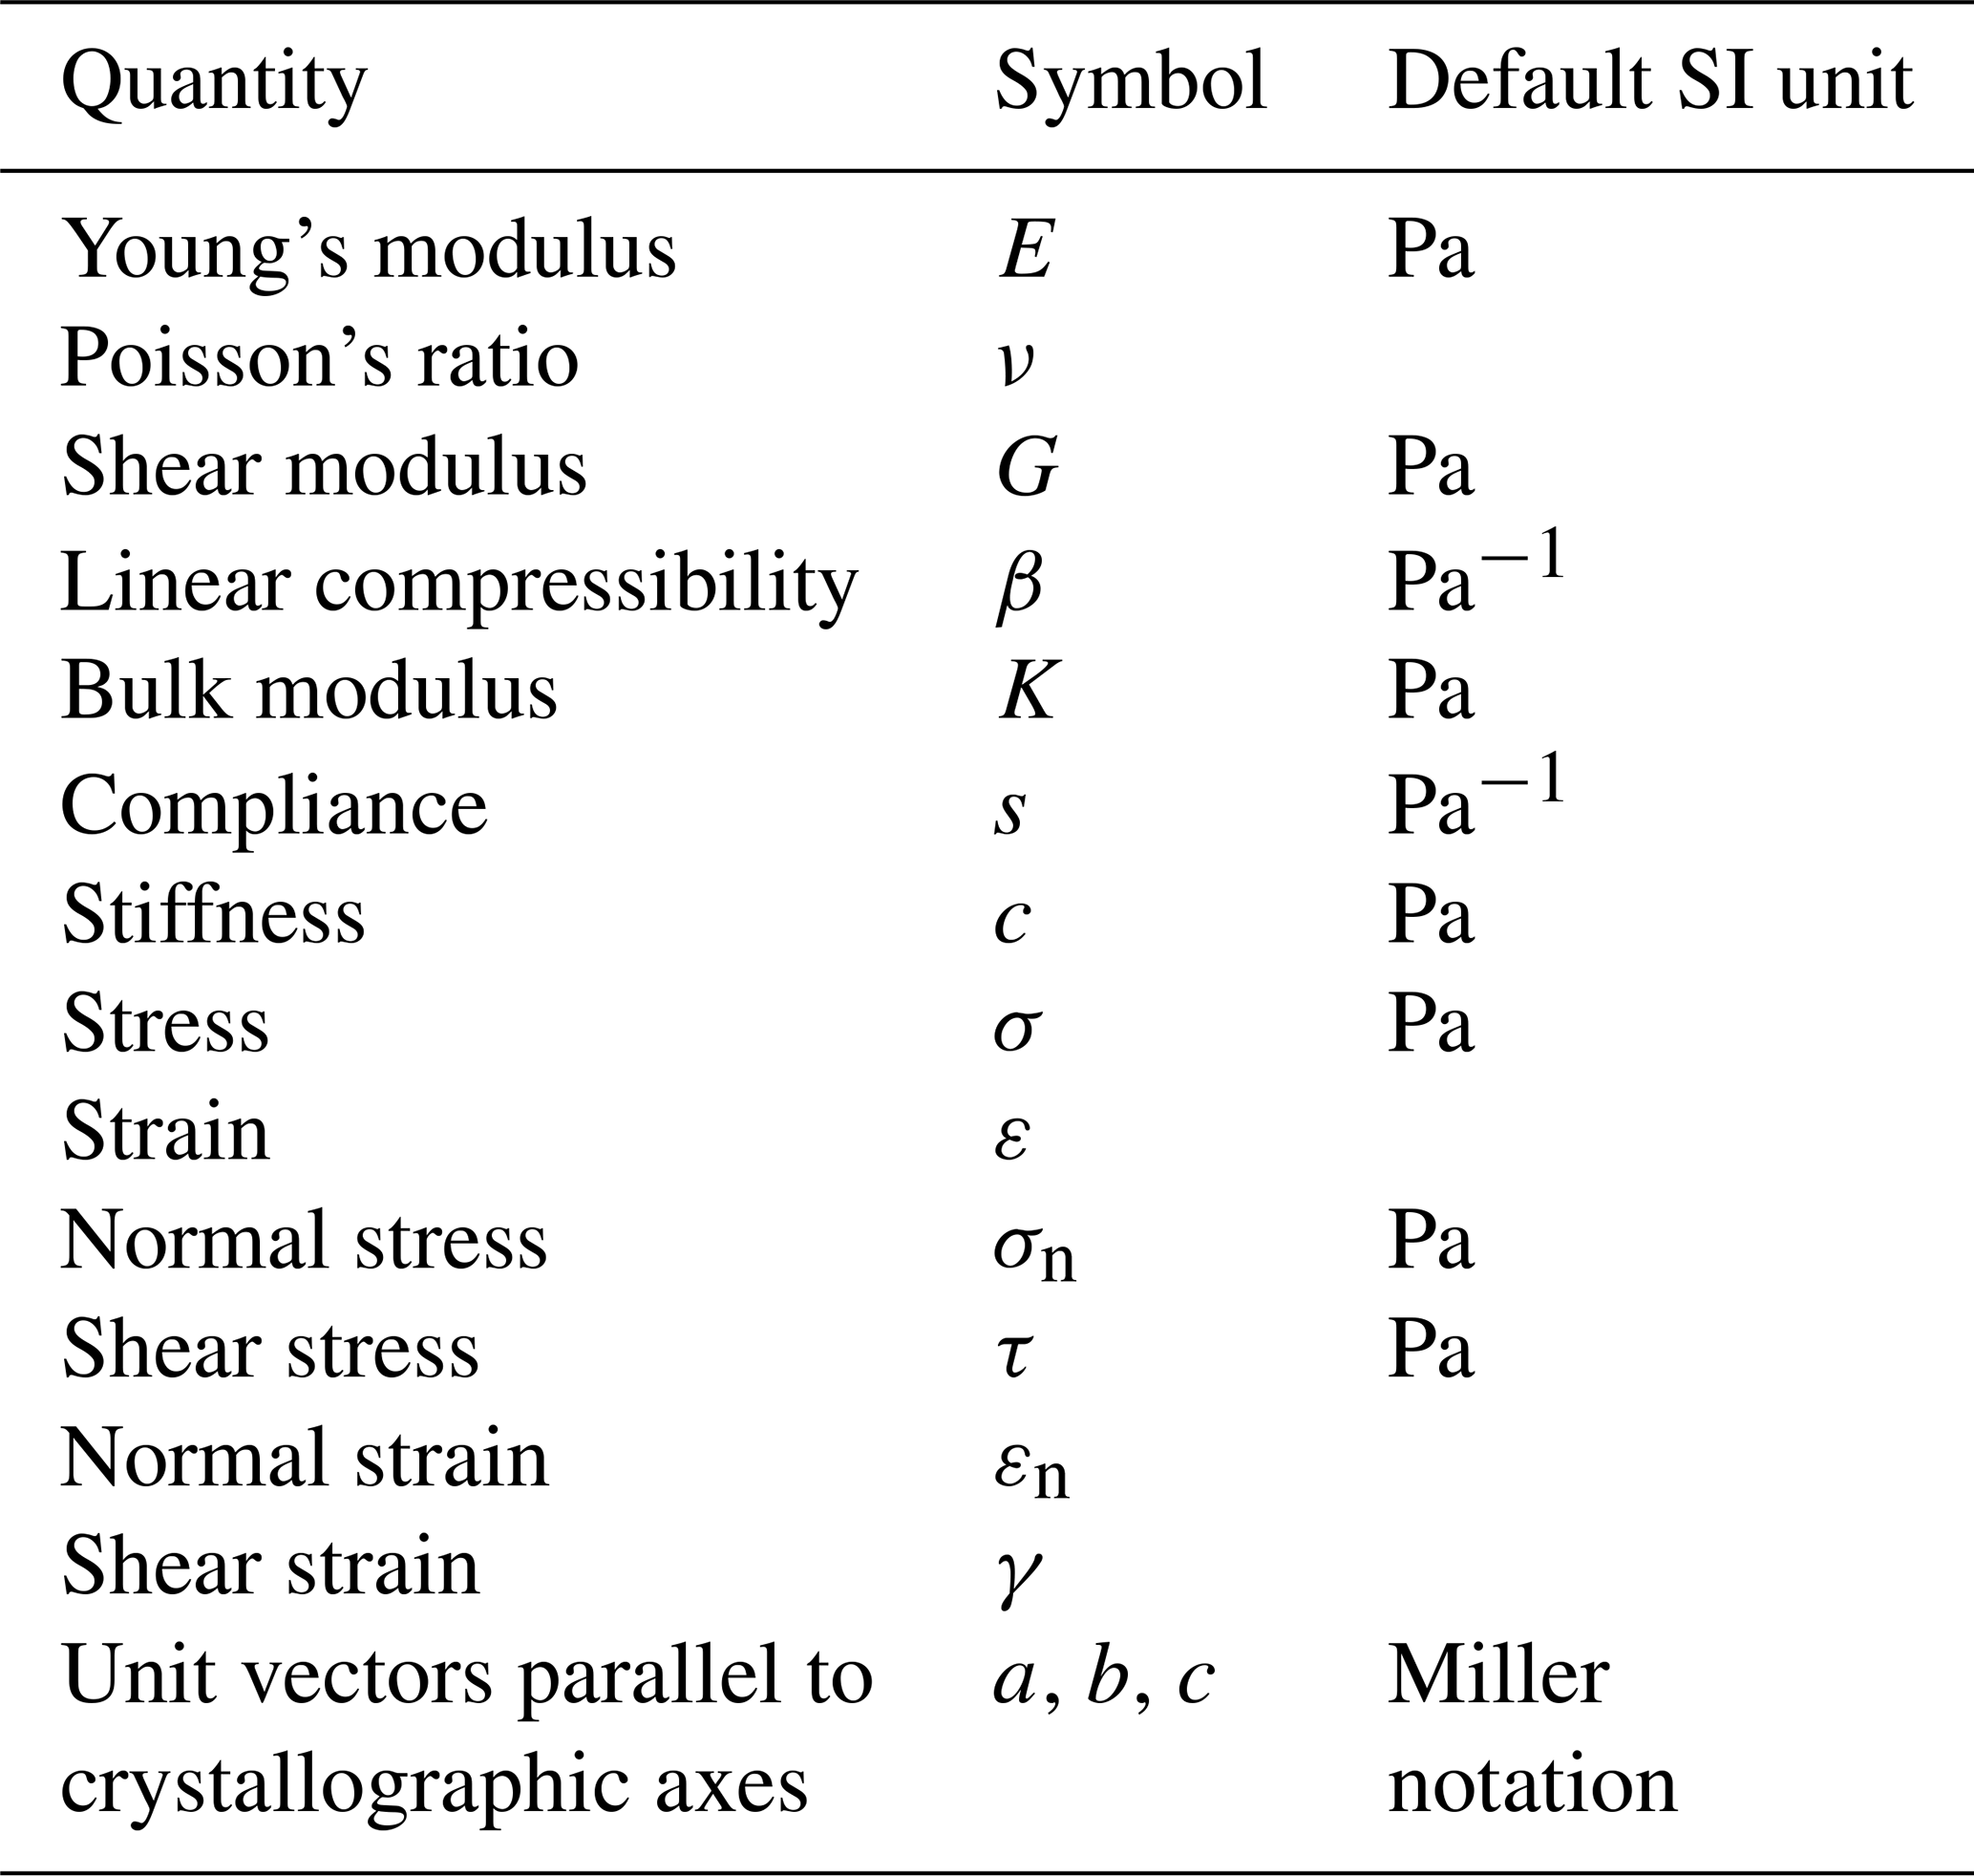
A table of symbols and terms used in this paper is provided in Table 1. Elastic properties are reported in SI units. In Sect. 2 we review the theoretical basis of linear elasticity and the formal description of elastic anisotropy in terms of the key equations. We then describe the methods we use to visualise and quantify the directional variations in elastic properties for any given mineral. We present two sets of results. Firstly, we analyse general trends in the database of 86 distinct minerals with 246 separate elasticity datasets from published sources, and we summarise the degree of anisotropy to be found in rock-forming minerals. Secondly, we analyse specific examples and focus on their response to applied deformation. We review the key issues raised by these analyses in the Summary section. The appendix contains benchmarks of the calculations performed in AnisoVis in comparison to published output from previous workers.
Table 1List of symbols and terms used in this paper, together with their default units (if any).
The elastic anisotropy of a solid material is described by a fourth-rank tensor, either the compliance sijkl or its inverse the stiffness cijkl (Nye, 1985). For linear elastic deformation, the generalised form of Hooke's law can be written as
where εij and σij are the second-rank tensors of strain and stress, respectively. Alternatively, Eq. (1) can be written as
Symmetry considerations lead to sijkl=sijlk and sijkl=sjikl (Nye, 1985). The corollary of these relationships is that the number of independent (potentially unique) components of sijkl is reduced from 81 (=34) to 36. The same applies to cijkl. The elastic compliance s or stiffness c of a crystal can therefore be represented in a more compact form, known as the Voigt matrix. This is a square 6×6 matrix where, for example, the elements of elastic stiffness are defined as cIJ=cijkl, where I=ij and J=kl. There are six different permutations of I(J)=ij(kl), the details of which are listed in Nye (1985) and more recently in Almqvist and Mainprice (2017).
The measured and calculated elastic properties of single crystals are reported in Voigt matrix notation (sIJ, cIJ), where the indices I and J (=1, 2, 3) relate to a standard Cartesian reference frame (x=1, y=2, z=3). The relationship between any specific crystal lattice and this Cartesian reference is arbitrary, but we adopt the convention described in Britton et al. (2016). In this system
-
the unit cell lattice vectors a, b and c form a right-handed set,
-
c is parallel to Cartesian z,
-
b lies in the Cartesian y–z plane at angle α to c, and
-
a is directed at angle β to c and γ to b.
Note that α is the angle between b and c, β is the angle between c and a, and γ is the angle between a and b (see Fig. 1a).
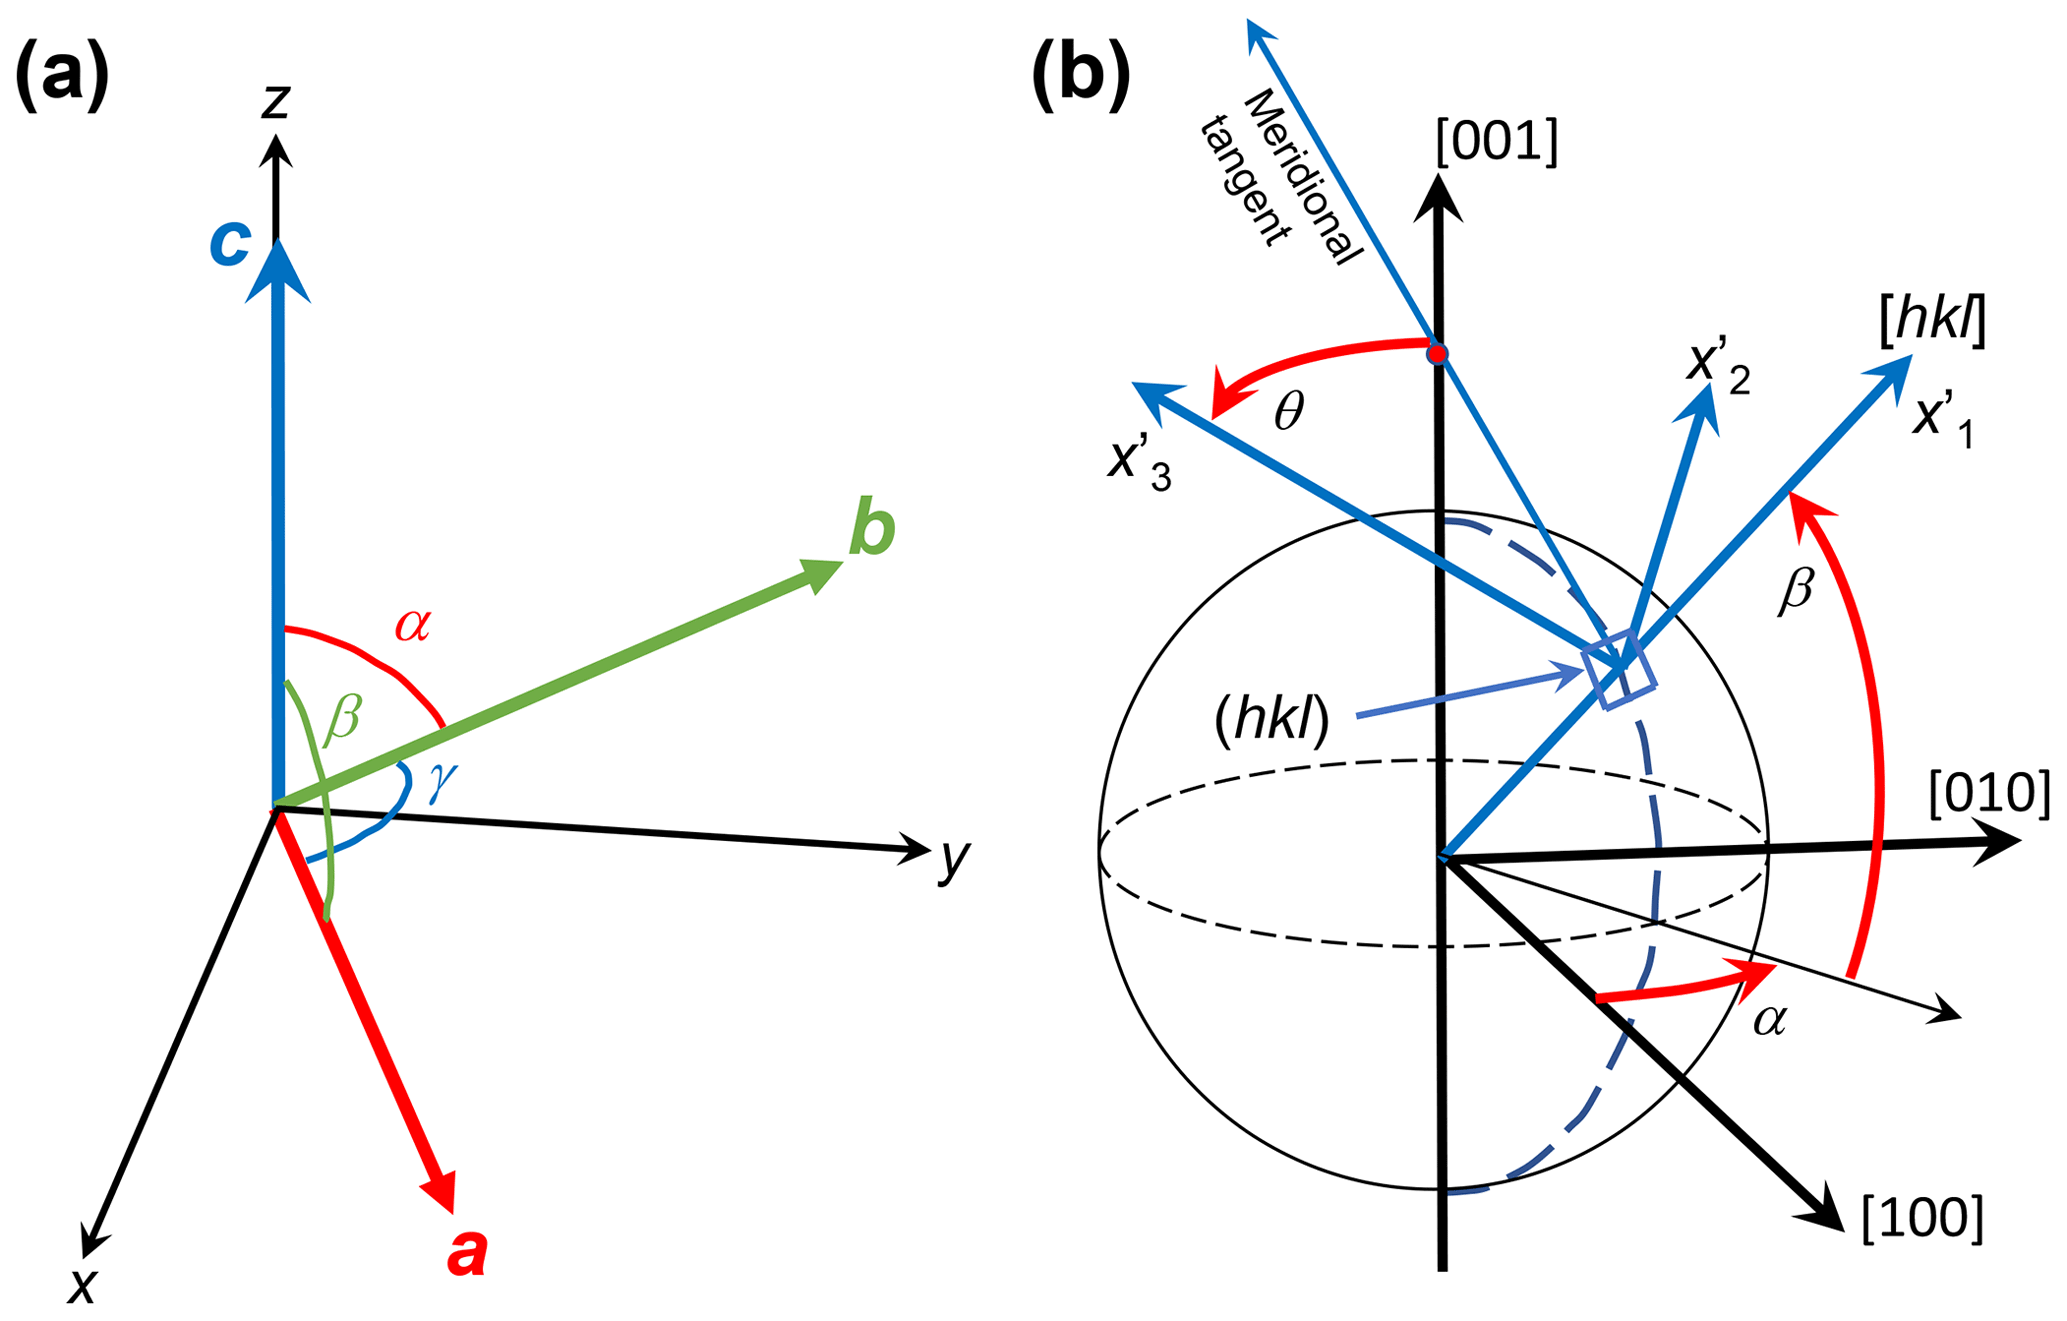
Figure 1(a) Crystallographic orientation convention (after Britton et al., 2016) and (b) geometrical reference frame (after Turley and Sines, 1971) used in this paper.
Familiar elastic properties, such as Young's modulus (E), Poisson's ratio (ν) and shear modulus (G), can be expressed directly in terms of the components of the compliance matrix. For example, the Young's modulus of a single crystal for a uniaxial stress applied in the x direction is
and the Poisson's ratio for a uniaxial stress and axial strain along x and a lateral strain along y is
Note that, in general for anisotropic materials, νxy≠νyx and so on.
Guo and Wheeler (2006) note that although Poisson's ratio may be negative for some directions, these are often compensated by higher positive values in transverse directions perpendicular to the minima in the same plane. They suggest a more useful measure of extreme auxeticity, the areal Poisson's ratio, defined as the average of all values of Poisson's ratio taken within the plane normal to a chosen direction. If the areal Poisson's ratio is negative, this implies that a cylinder of the mineral would contract under a uniaxial compression, around the whole circumference, and not just along certain directions.
In order to calculate specific values of these elastic properties in more general directions within a crystal – i.e. not just along the axes of the default Cartesian reference frame – we need to transform the compliance matrix into a different reference frame. We follow the notation used by Turley and Sines (1971) based on Eulerian angles α, β and θ (see Fig. 1b) that define the new Cartesian axes (1′, 2′, 3′ or x′, y′, z′) in relation to the initial reference frame (1, 2, 3 or x, y, z). The transformation of compliance matrix sijkl to is given by (Nye, 1985):
where the elements of the rotation matrix a are given by
where A=cos αcos β, B=sin αcos β, C=sin β, , , , G=cos α, and H=cos β (Turley and Sines, 1971).
Using the transformed compliance matrix , we can now calculate the elastic properties for any general direction within the crystal defined by a unit vector with angles α, β and θ; for example,
To calculate the variation in any elastic property over all possible directions in 3D, we simply need to vary α and β over a unit sphere (α: 0–360∘, β: 0–180∘) and vary θ over a unit circle (θ: 0–360∘).
Isotropic approximations of anisotropic elastic properties
Two useful “averaging” schemes that can be applied to the full set of anisotropic elastic properties of polycrystals are those due to Reuss and Voigt (see Hill, 1952). The bulk and shear moduli in the Voigt scheme are defined as
and in the Reuss scheme as
The Voigt average of any property always exceeds the Reuss average and the “true” value lies somewhere in between. The Voigt–Reuss–Hill (VRH) average of a property is defined as the arithmetic mean of the Voigt and Reuss estimates, e.g. . Note that, although only formally defined for polycrystals and based on averaging over many grains, the Voigt, Reuss and VRH estimates are in practice useful for single crystals: if we consider a polycrystal made of many grains all aligned perfectly parallel, then the elastic anisotropy of this polycrystal is identical to that of the single crystal.
To plot the variations of disparate elastic properties across minerals with widely different symmetries and anisotropies, we use the Universal Anisotropy Index (AU), of Ranganathan and Ostoja-Starzewski (2008), defined as
where GV and KV are the Voigt average shear and bulk moduli, respectively; and GR and KR are the Reuss average shear and bulk moduli, respectively. In contrast to previous measures, the Universal Anisotropy Index was designed to incorporate contributions from the bulk part of the elasticity (terms in K) and is unique for a given mineral elasticity (Ranganathan and Ostoja-Starzewski, 2008). AU is zero for isotropic materials and increases as symmetry decreases, e.g. monoclinic and triclinic minerals tend to have higher AU.
The visualisations of elastic anisotropy presented in this paper have been prepared using AnisoVis, a set of custom scripts linked to a graphical user interface (GUI) and written in MATLAB™. This code is available as an open-source project on GitHub and through the MathWorks™ File Exchange server (https://github.com/DaveHealy-Aberdeen/AnisoVis, last access: 28 February 2020; https://uk.mathworks.com/matlabcentral/fileexchange/73177-anisovis, last access: 28 February 2020). Single mineral elasticity values are supplied as input data, together with lattice parameters defining the unit cell and symmetry. The code then calculates the directional variations in elastic properties and produces outputs of the kinds shown in Figs. 4–7. AnisoVis can also calculate the acoustic velocities (phase and group) and their polarisations, as well as the optical birefringence from the refractive indices. Over 240 data files for 86 different minerals are included (from published sources), and a user guide is provided with the software.
3.1 Installation and input file format
AnisoVis is installed by copying all of the files from the GitHub or MathWorks File Exchange server into a folder on the user's computer. AnisoVis will run on any computer with MATLAB installed, including running Windows, Mac OS X or different versions of Linux. After starting MATLAB, the working folder or directory should be set to the folder containing the installed source code. The application is started by typing “AnisoVis” in the command window of the MATLAB session. There is only one window in AnisoVis (Fig. 2). Click “Browse...” to show the standard dialogue to open an input file of mineral properties. These data are stored in formatted tab-delimited ASCII text files with an extension of “.mdf2” (“mineral data file”). The user guide supplied with the software has examples for each different mineral symmetry class.
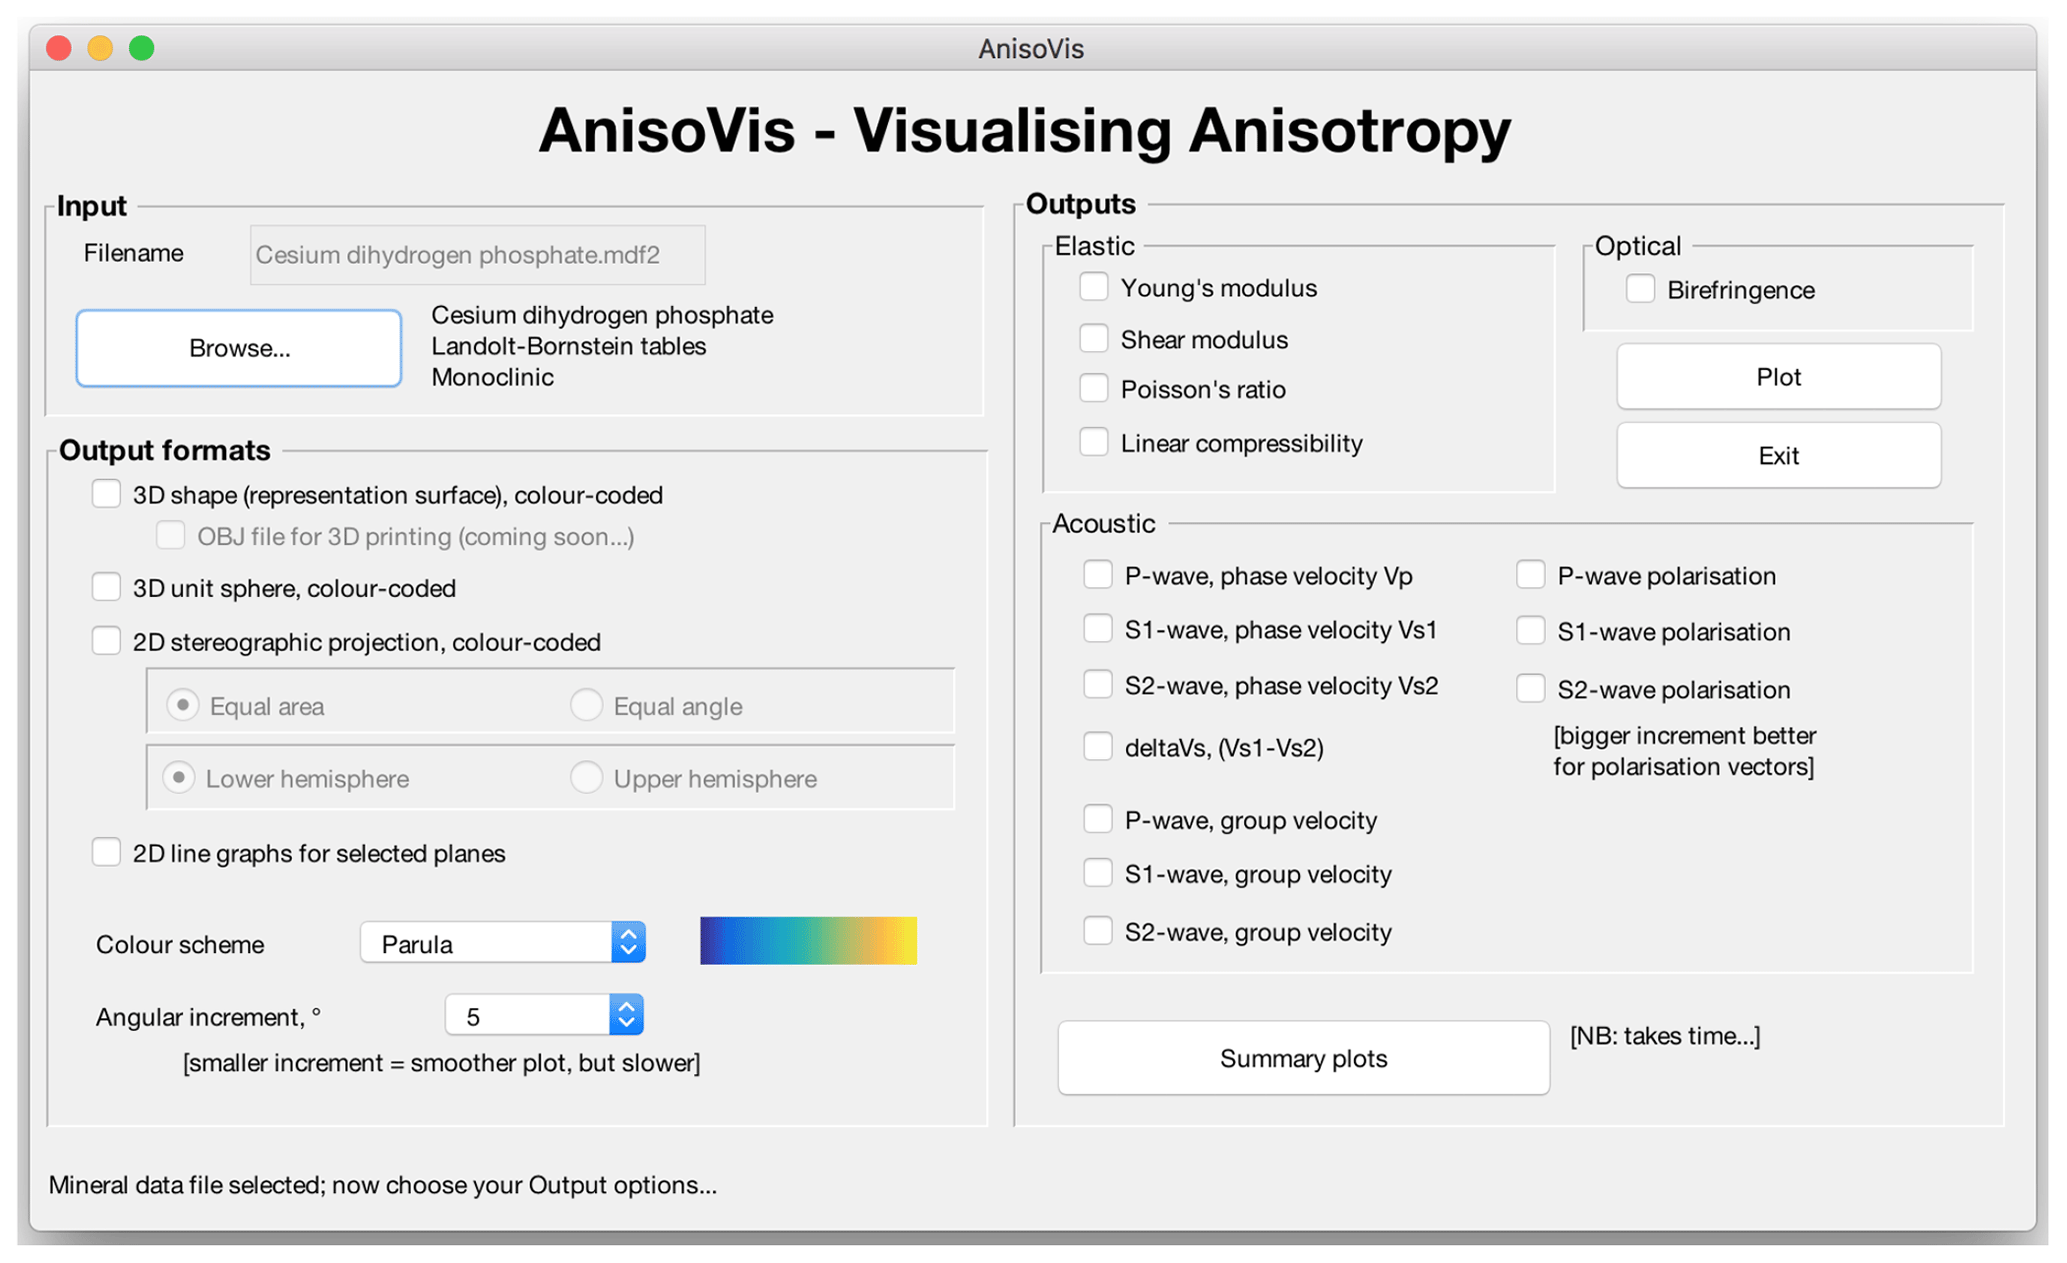
Figure 2The graphical user interface in AnisoVis, showing the range of output options for elastic, acoustic and optical anisotropies.
3.2 Calculations
After selecting the required output formats (shape, sphere or stereogram) and anisotropic properties to be visualised (elastic, acoustic or optical), the user clicks “Plot” to generate the images. Calculations are performed using the equations for each property described above, looping through three-dimensional space with the specified angular increment. Smaller angular increments (e.g. 1–2∘) take longer to run than larger increments (e.g. 5–10∘). In the tests that we have conducted to date, runtime has been very satisfactory, with most operations completed in a few seconds on standard desktop computers purchased within the last three years. The exception to this performance is when the angular increment is 1∘, where runtimes are typically of the order of 1–2 min. We have implemented a MATLAB™ “waitbar” to provide basic progress information for lengthier tasks.
3.3 Generating outputs
Output is directed to MATLAB figure windows, with one plotted property per figure window. These images are automatically saved as “.tif” files at 600 dpi resolution in the working folder. While each figure window is visible, the user can exploit standard MATLAB functionality to resize or reformat the figure as they wish, and they can save the figure to a different filename, folder or even to a different graphic format (e.g. “.png” or “.jpeg”). The colour schemes used for the representation surfaces, unit spheres and stereograms can be varied using the drop-down list box in the main window. In addition to the standard MATLAB colour map of “Parula”, we offer three other choices from the cmocean colour map library (Thyng et al., 2016) using perceptually uniform scales (“Haline”, “Thermal” and “Matter”).
3.4 Visualising elastic anisotropy in 2D and 3D
As pointed out by Nye (1985), no single surface can represent the elastic behaviour of a crystal completely. However, we can plot specific surfaces that are useful in practice. To visualise the anisotropy of elastic properties of single crystals, we use a mixture of 3D surfaces and 2D polar plots projected onto selected planes. We use representation surfaces (Nye, 1985) to generate 3D shapes where, for any given radius vector measured from the origin to the surface, the radius is proportional to the magnitude of the property in that direction. The magnitude of the property is also conveyed by a colour mapping applied to the surface. An alternative method is to plot the directional variation of a property projected onto a unit sphere, using a colour map to depict the magnitude. We can also use stereographic projections (lower-hemisphere equal-area) to show directional variations in properties. Lastly, we can use polar plots to the variation of a property in selected crystallographic planes (e.g. [100], [010], [001]).
3.5 Challenges in visualising Poisson's ratio (ν) and shear modulus G
Any of the above methods of visualisation can be used for “simple” elastic properties, such as Young's modulus or linear compressibility, where the property is a single scalar value for a given direction. Young's modulus is defined as the ratio of uniaxial stress to uniaxial strain, and it is implicit that the directions of applied stress and measured strain are coincident (i.e. coaxial; Fig. 3). However, for Poisson's ratio and shear modulus this is no longer the case. Poisson's ratio is defined as the ratio of (negative) lateral strain to the axial strain, and therefore involves two orthogonal directions (Fig. 3). Shear modulus is defined as the ratio of the shear stress to the shear strain, again involving two orthogonal directions (see Fig. 3). For a stress (normal or shear) applied in a specific direction, there is only one value of E, but there are many possible values of ν and G. It can be seen from Fig. 3 that ν and G will vary according to the direction of the normal to the chosen direction [hkl], described by angle θ in the Turley and Sines (1971) notation. To plot representation surfaces for ν and G, we take their minimum and maximum values calculated over θ for an applied stress along each direction in 3D space. In addition, as ν can be negative for some directions in some minerals, we further separate the minimum representation surfaces of Poisson's ratio into negative minimum and positive minimum components where appropriate.
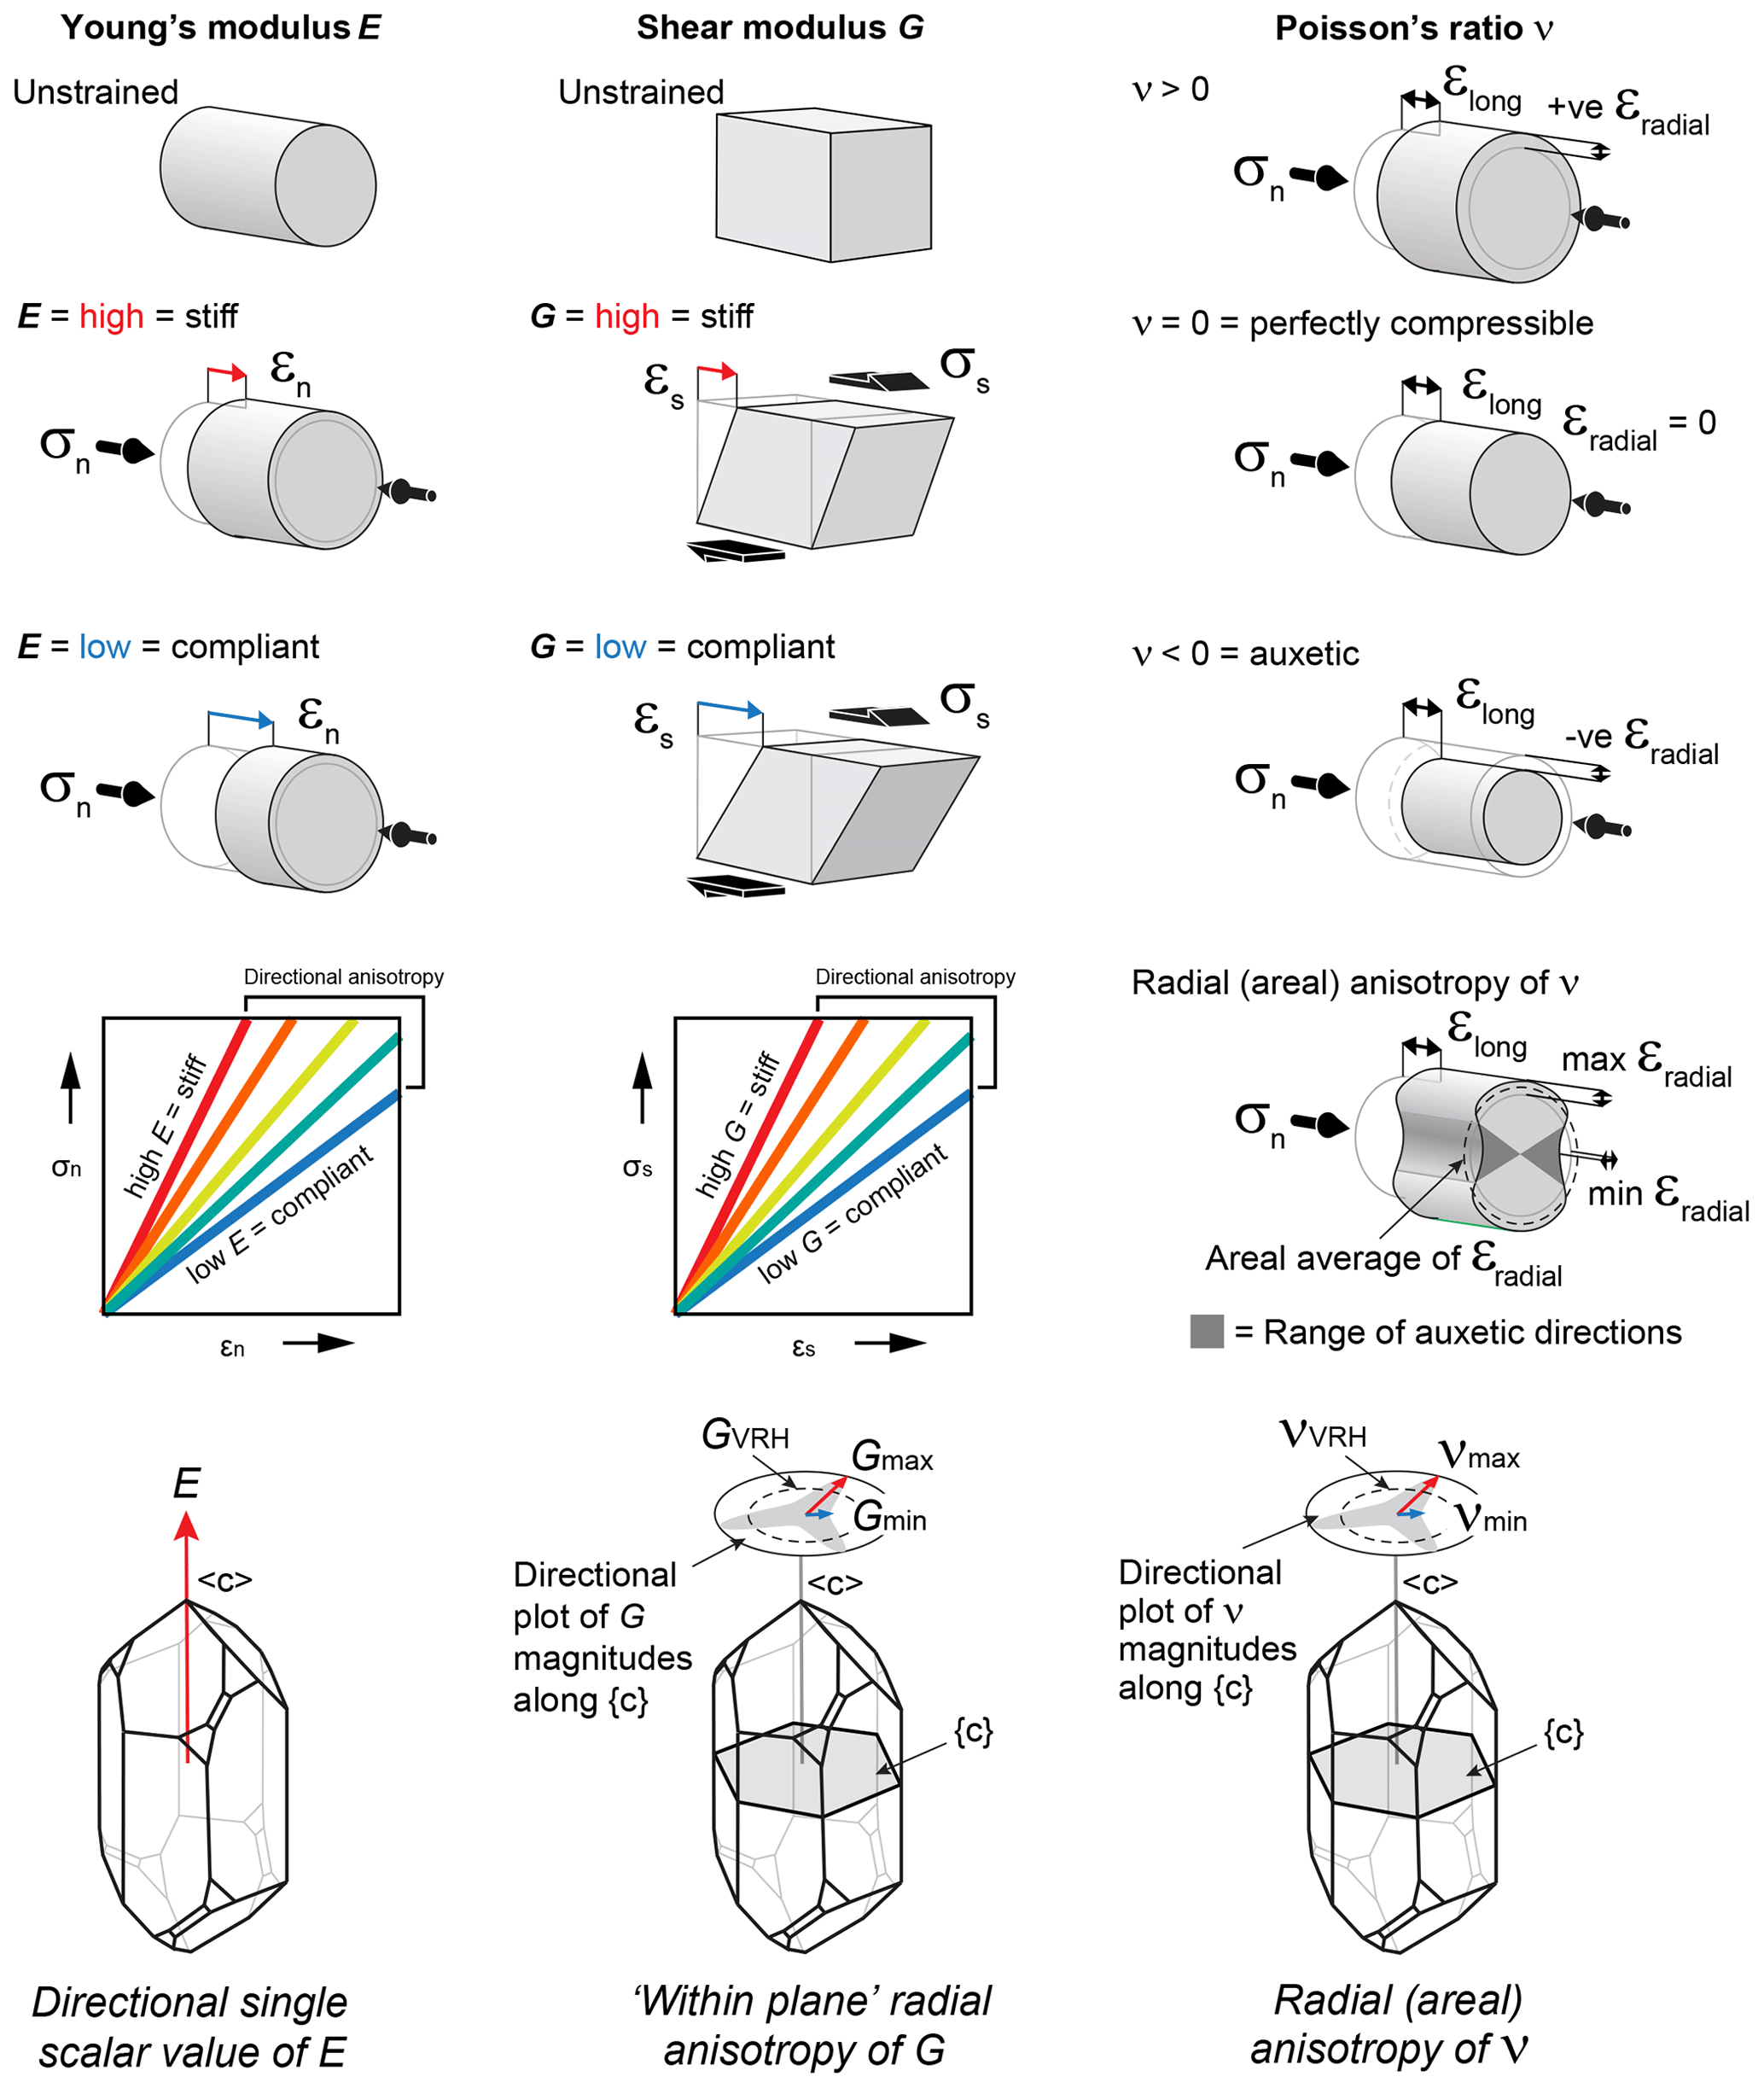
Figure 3Schematic diagrams to illustrate the definitions of Young's modulus, Poisson's ratio and shear modulus in a 3D crystallographic reference frame, using α-quartz (trigonal) as an example.
3.6 Example: α-quartz (trigonal; Ogi et al., 2006)
To illustrate the different possibilities described above, we use the elasticity of α-quartz as quantified by Ogi et al. (2006). The anisotropy of Young's modulus is shown in Fig. 4 using a representation surface, a unit sphere, a stereogram and polar plots of E in the plane (100). The colour bar scale is the same in all plots for ease of comparison. Using AnisoVis, the user can rotate any of these plot views in the MATLAB figures to gain a better appreciation of the directional variations in relation to the crystallographic reference axes 〈a〉, 〈b〉 and 〈c〉.

Figure 4Alternative visualisations of the anisotropy of Young's modulus (E, in GPa) of α-quartz. (a) 3D representation surface where the radius in any direction is proportional to the magnitude of E. (b) Projection of E on to a unit sphere, colour-coded by magnitude. (c) Lower-hemisphere equal-area stereographic projection. (d) Polar plot of anisotropy of E in selected planes. Crystallographic axes 〈a〉, 〈b〉 and 〈c〉 shown in pink.
As noted above, the shear modulus is a function of shear stress in one direction and a shear strain in a perpendicular direction. Therefore, for any given crystallographic direction in 3D space [hkl] in an anisotropic crystal, there are many possible values of G as the transverse component is rotated through the angle θ (see Fig. 1b). In Fig. 5 we show representation surfaces for the minimum and maximum values of G of α-quartz associated with each direction [hkl]. Polar plots are also shown for planes (010) and (001).

Figure 5Alternative visualisations of the anisotropy of shear modulus (G, in GPa) of α-quartz. (a–b) 3D representation surfaces where the radius in any direction is proportional to the magnitude of G. Separate surfaces shown for minimum and maximum G. (c) Lower-hemisphere equal-area stereographic projection of Gmax. (d) Polar plots of anisotropy of G in selected planes. Crystallographic axes 〈a〉, 〈b〉 and 〈c〉 shown in pink. VRH represents the Voigt–Reuss–Hill average value of G.
Visualising the directional variation of Poisson's ratio ν can pose further challenges. α-Quartz is auxetic and has many directions that show negative Poisson's ratios. As for shear modulus, we show representation surfaces for both the minimum (Fig. 6a–b) and maximum (Fig. 6c) Poisson's ratios, but we separate the minimum Poisson's ratio plot into two surfaces: one for (Fig. 6a) and one for (Fig. 6b). Maximum Poisson's ratio is nearly always positive, and we show a single plot for this. We also include a plot for the areal Poisson's ratio – the value of Poisson's ratio averaged over all θ for each direction [hkl] (Fig. 6d; after Guo and Wheeler, 2006). Polar plots for specific 2D planes can also be useful (Fig. 6e–f).
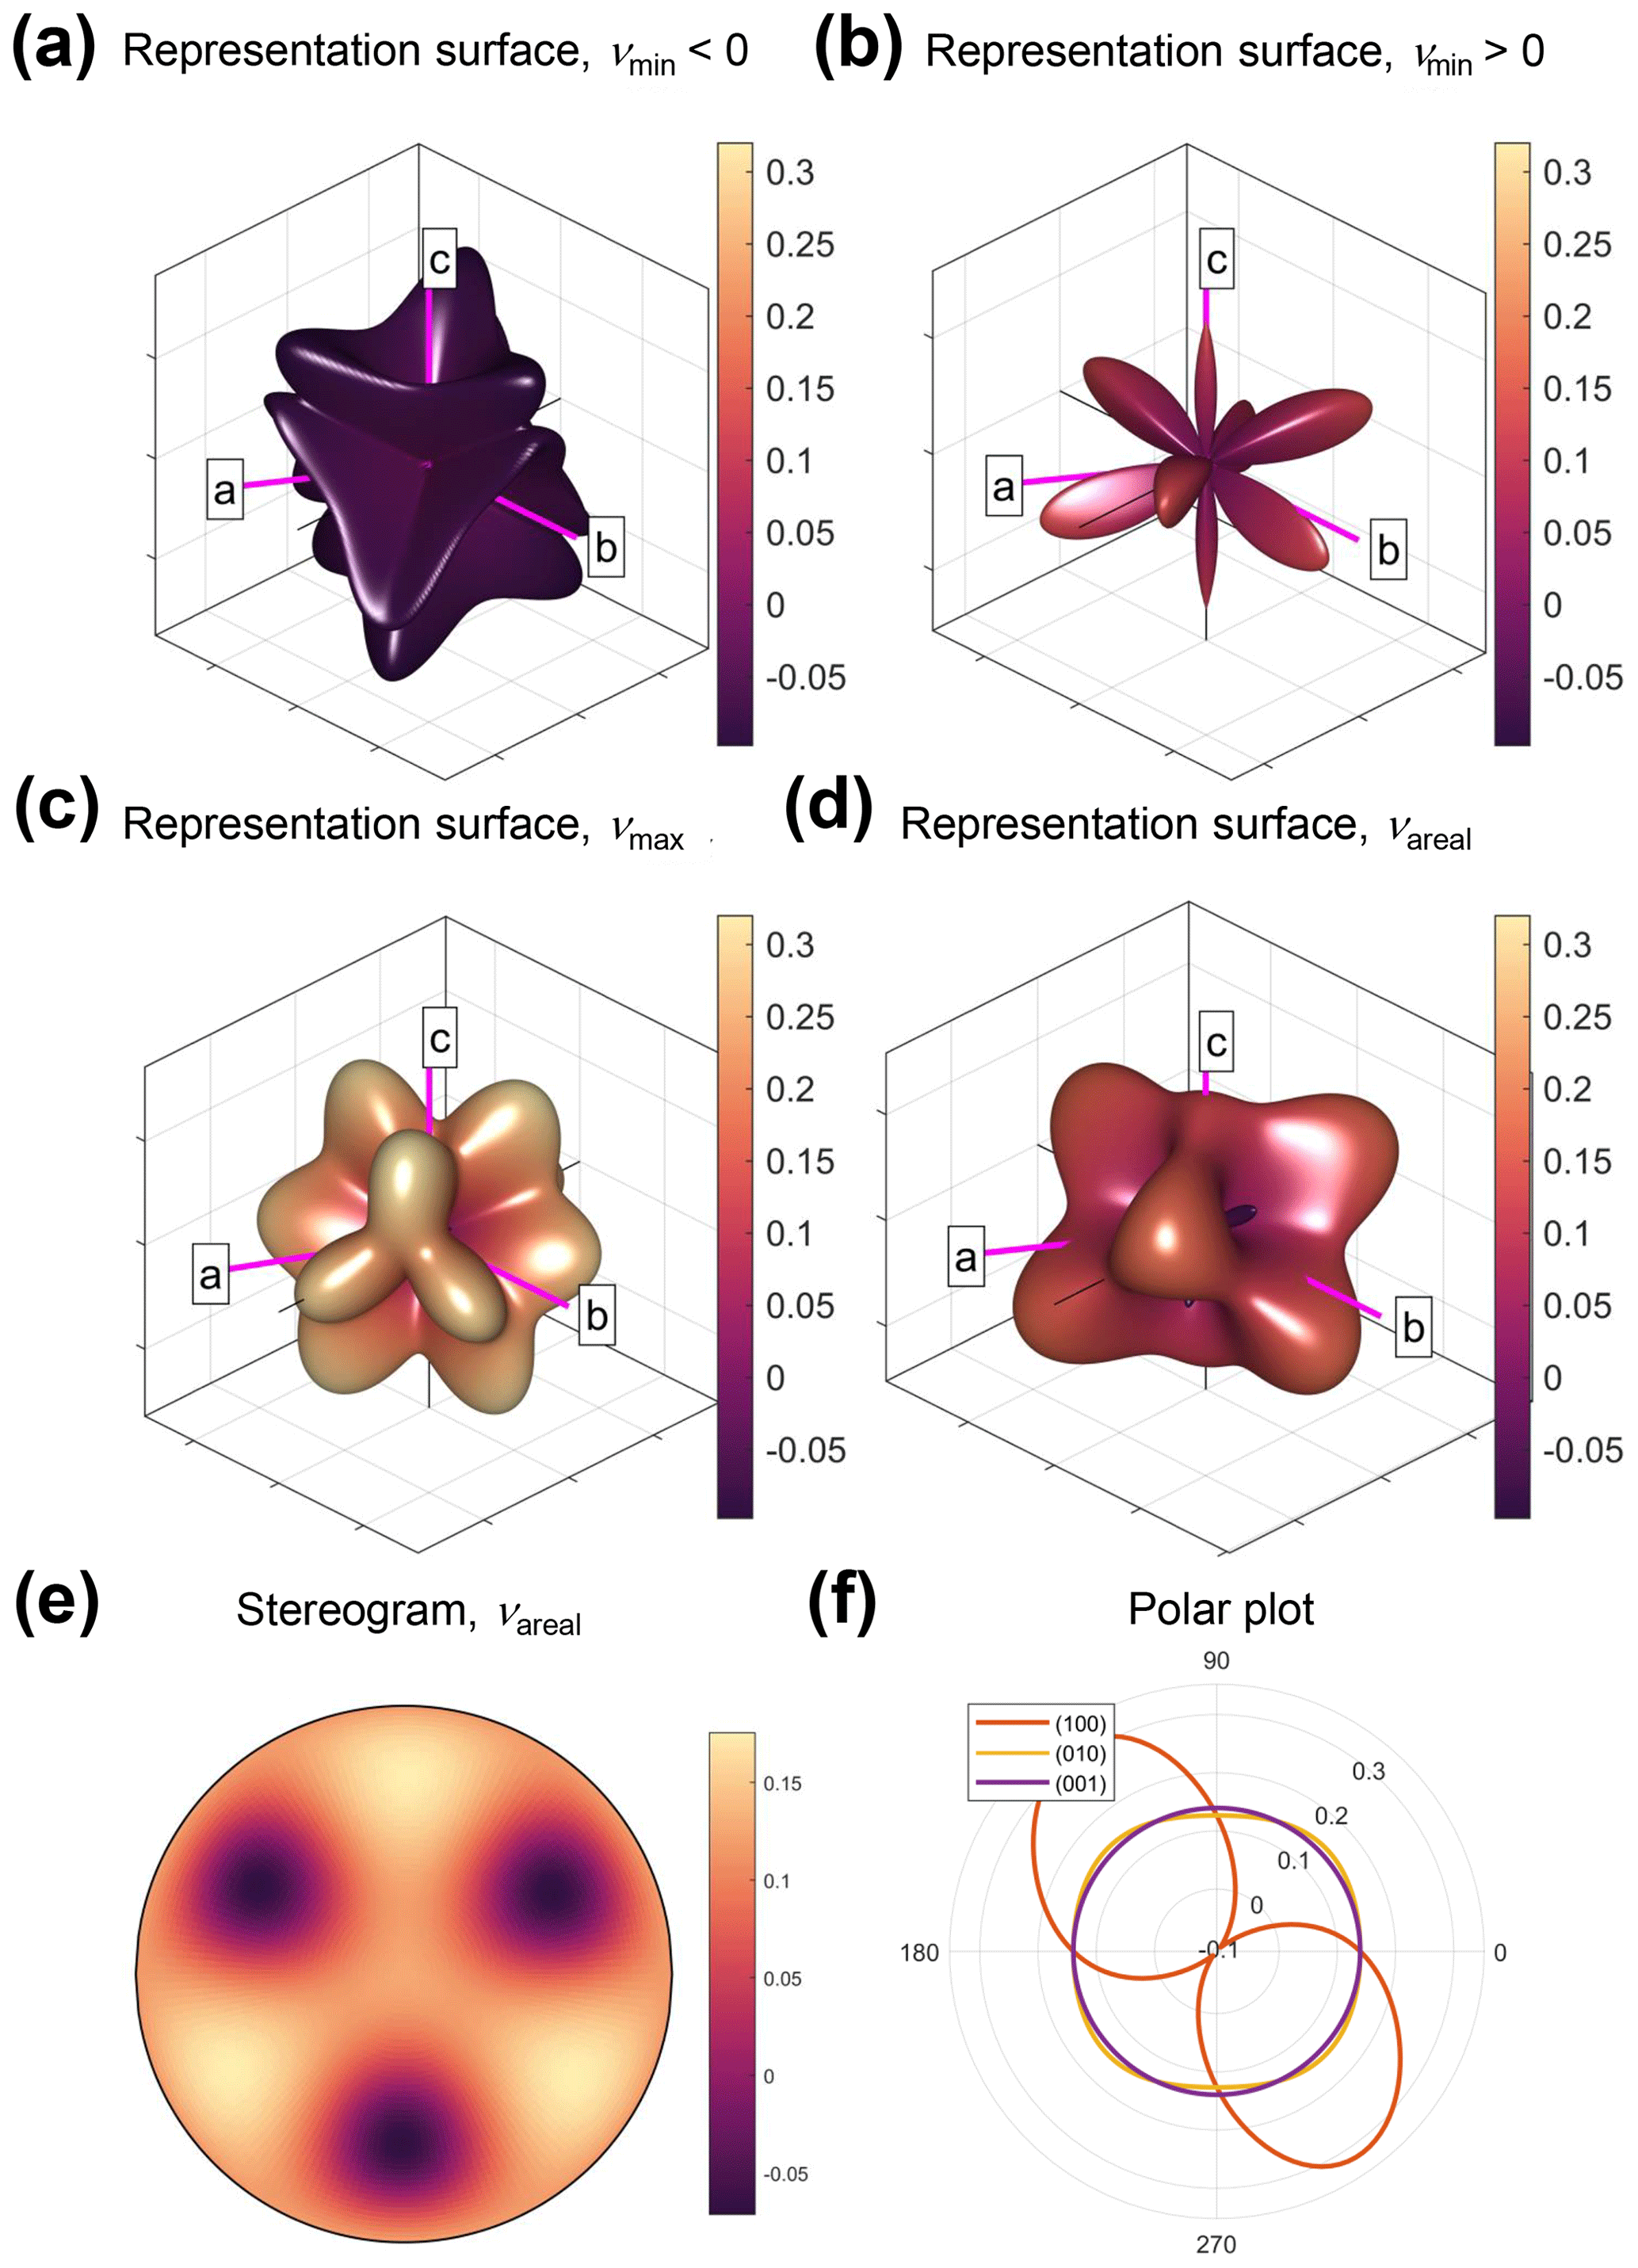
Figure 6Alternative visualisations of the anisotropy of Poisson's ratio (ν) of α-quartz. (a–d) 3D representation surfaces where the radius in any direction is proportional to the magnitude of ν. Separate surfaces shown for minimum negative, minimum positive, maximum and areal ν, as defined in the equations in Sect. 2. (e) Lower-hemisphere equal-area stereographic projection of νareal. (f) Polar plots of anisotropy of ν in selected planes. Crystallographic axes 〈a〉, 〈b〉 and 〈c〉 shown in pink.
The linear compressibility (β) of an anisotropic crystal quantifies the directional response to an applied hydrostatic load, i.e. to pressure, not stress. For isotropic materials, the compressibility is a scalar – i.e. directionally invariant – and it is simply the inverse of the bulk modulus . For anisotropic rock-forming minerals, this is no longer the case, and β varies with direction. Figure 7 shows the variation for α-quartz using the same types of plots as for Young's modulus (Fig. 5).
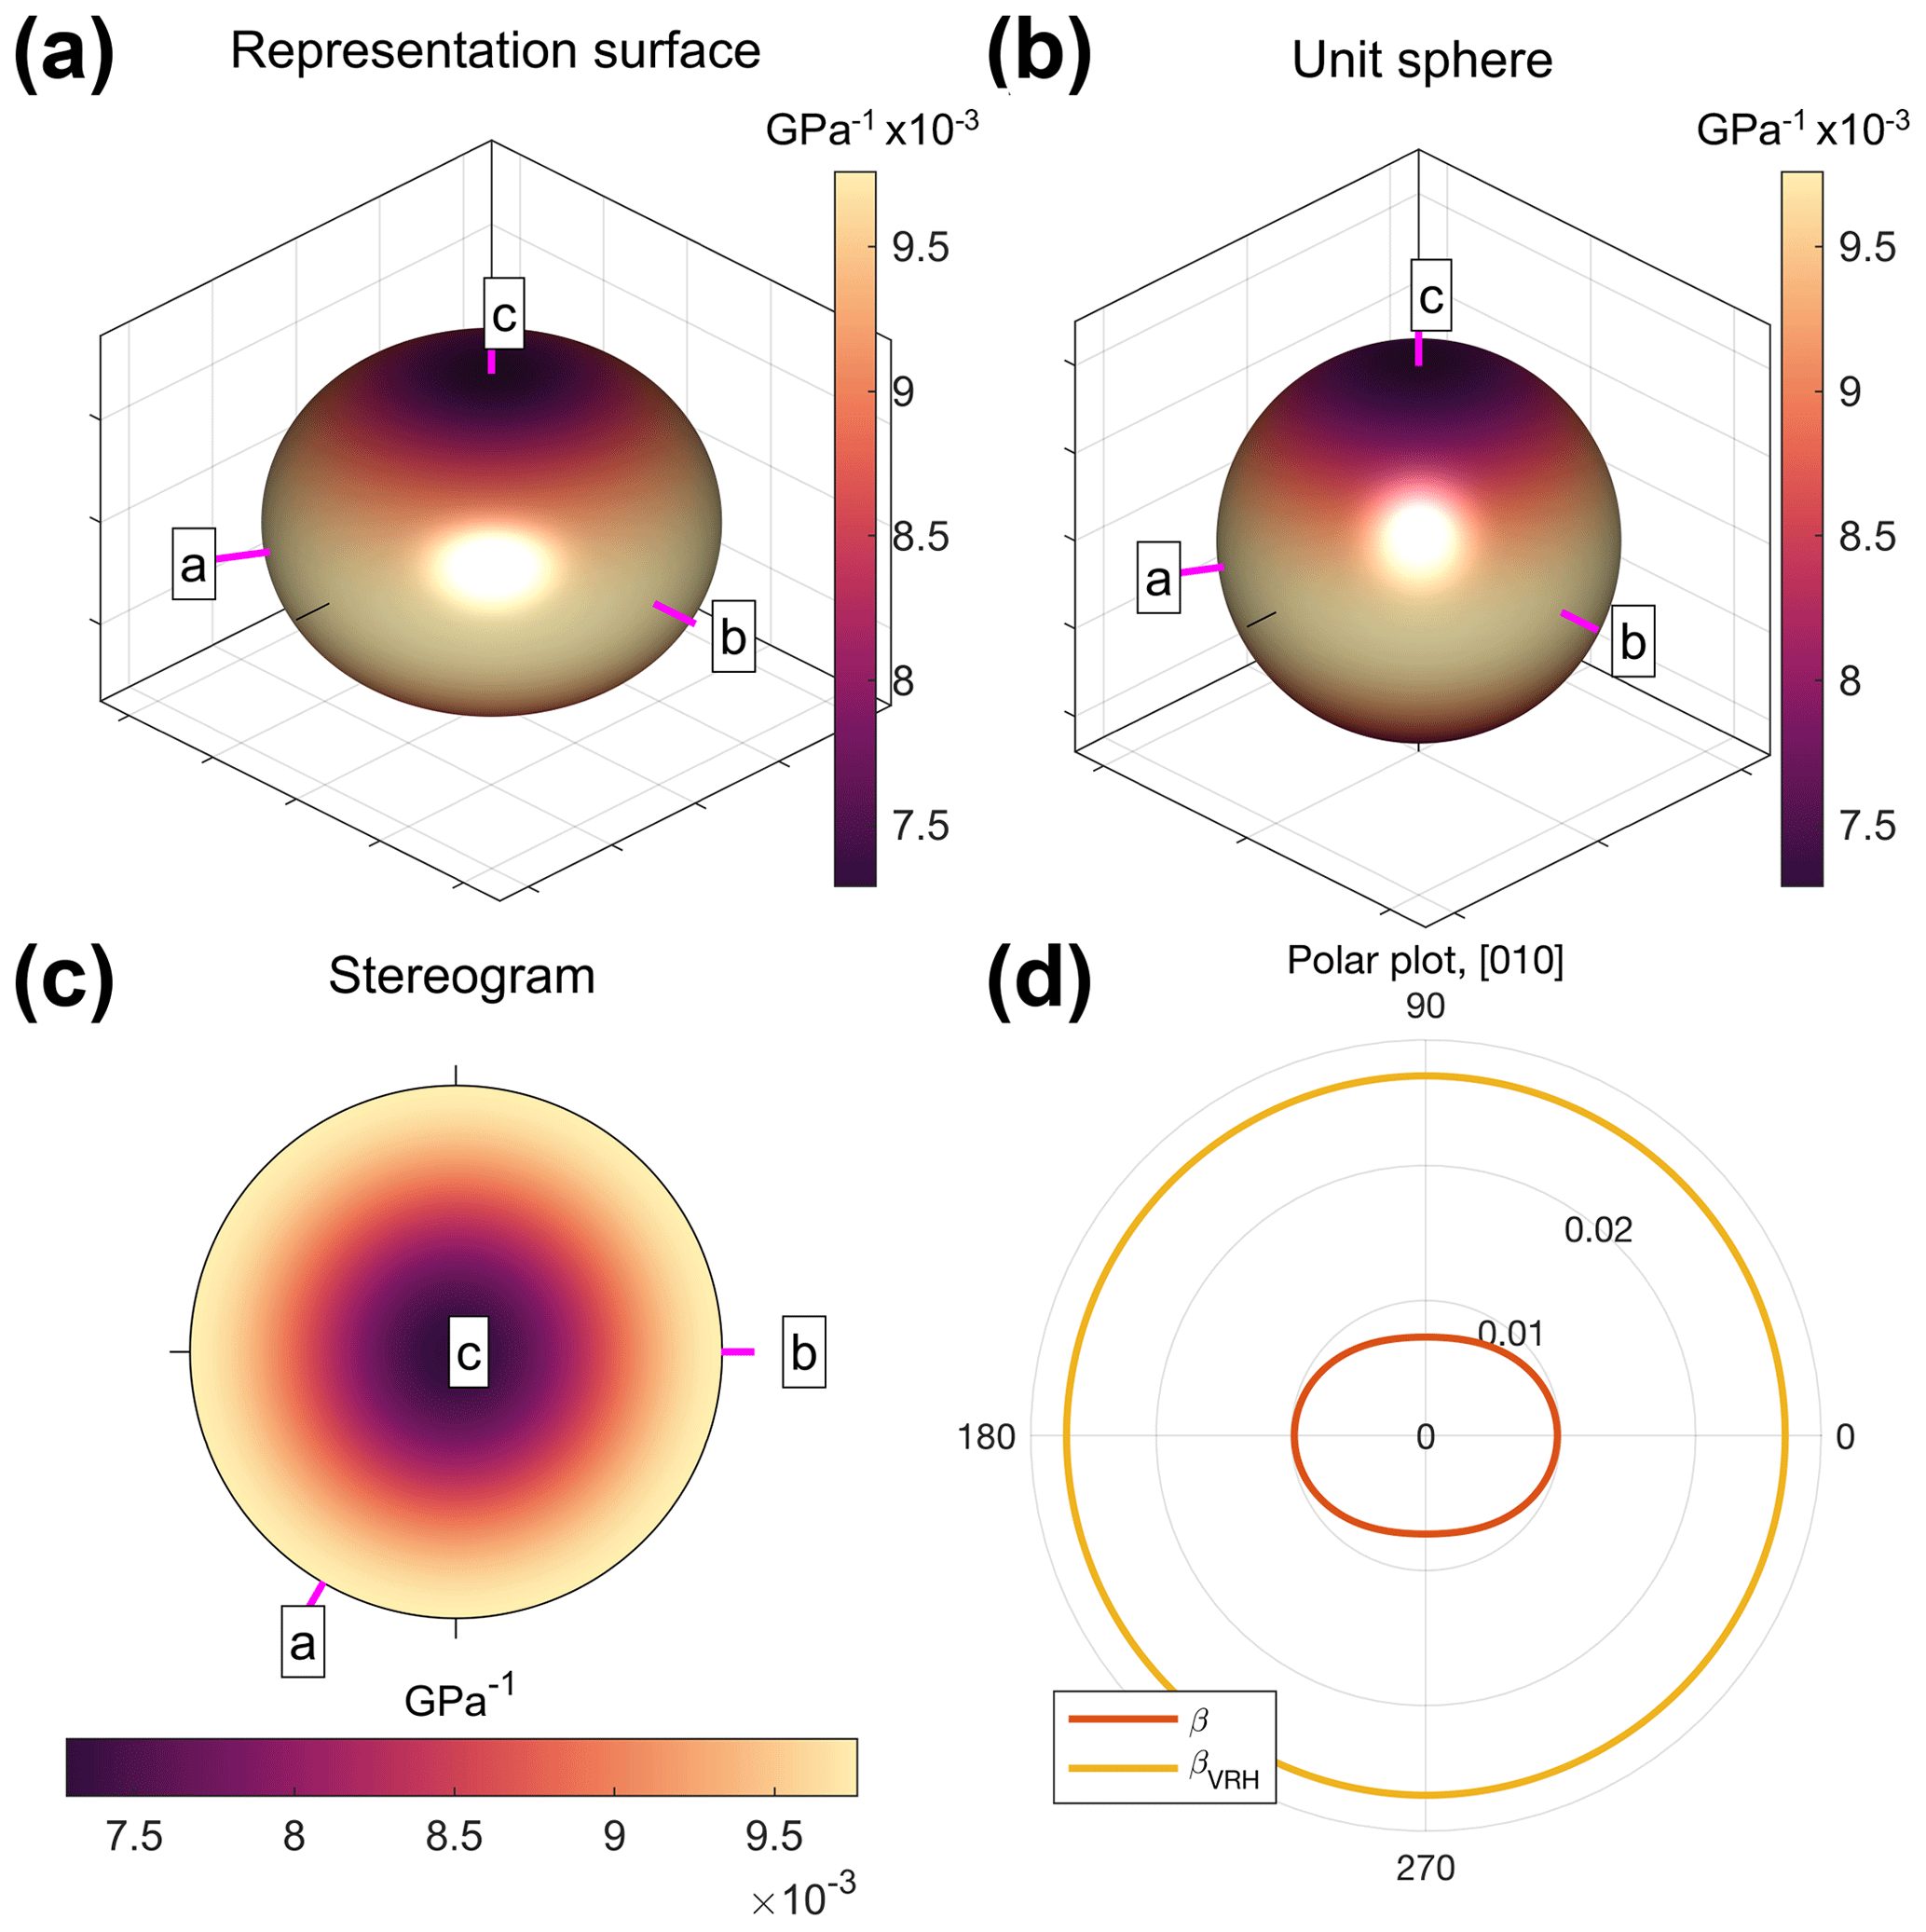
Figure 7Alternative visualisations of the anisotropy of linear compressibility (β, in GPa−1) of α-quartz. (a) 3D representation surface where the radius in any direction is proportional to the magnitude of β. (b) Projection of β on to a unit sphere, colour-coded by magnitude. (c) Lower-hemisphere equal-area stereographic projection. (d) Polar plot of anisotropy of β in the (010) plane. Crystallographic axes 〈a〉, 〈b〉 and 〈c〉 shown in pink. VRH represents the Voigt–Reuss–Hill average value of β.
In summary, we note that as a corollary of the point made by Nye (1985) that no single surface can represent the full richness of the fourth-rank elasticity tensor, neither can any one measure (e.g. E, G, ν or β) convey the complete behaviour of an anisotropic mineral. The anisotropies of the different parameters shown in these plots should be used in combination to understand a specific problem.
3.7 Visualising second-rank tensors: stress and strain
To address the challenges in visualising stress and strain described above, we use two separate graphical depictions, or glyphs, for the normal and shear components of the strain and stress tensors (Kratz et al., 2014). We use the Reynolds glyph for normal strains and stresses, as this can show positive and negative principal values (Moore et al., 1996). We use the HWY glyph to visualise the shear components of the strain and stress tensors (Hashash et al., 2003). Figures 8 and 9 show examples of the Reynolds and HWY glyphs for strains and stresses, respectively. Isotropic compaction plots as a single point in Mohr space (Fig. 8a), and as a sphere using a Reynolds glyph (Fig. 8b; shear strains are zero and so there is no HWY glyph), are shown. For a general triaxial strain with both shortening and stretching components, the Reynolds and HWY glyphs are shown in Fig. 8d and e. Note that in the HWY glyph for shear strain the maxima are located at 45∘ to the principal axes, and the minima (0) are located along the principal axes. Triaxial compressive stress is shown in Fig. 9a–c. Again, maxima of shear stress in the HWY glyph are at 45∘ to the directions of the principal (normal) stresses. For a general triaxial stress with components of compression and tension, the directional variations of normal and shear stress are shown in Fig. 9d–f.
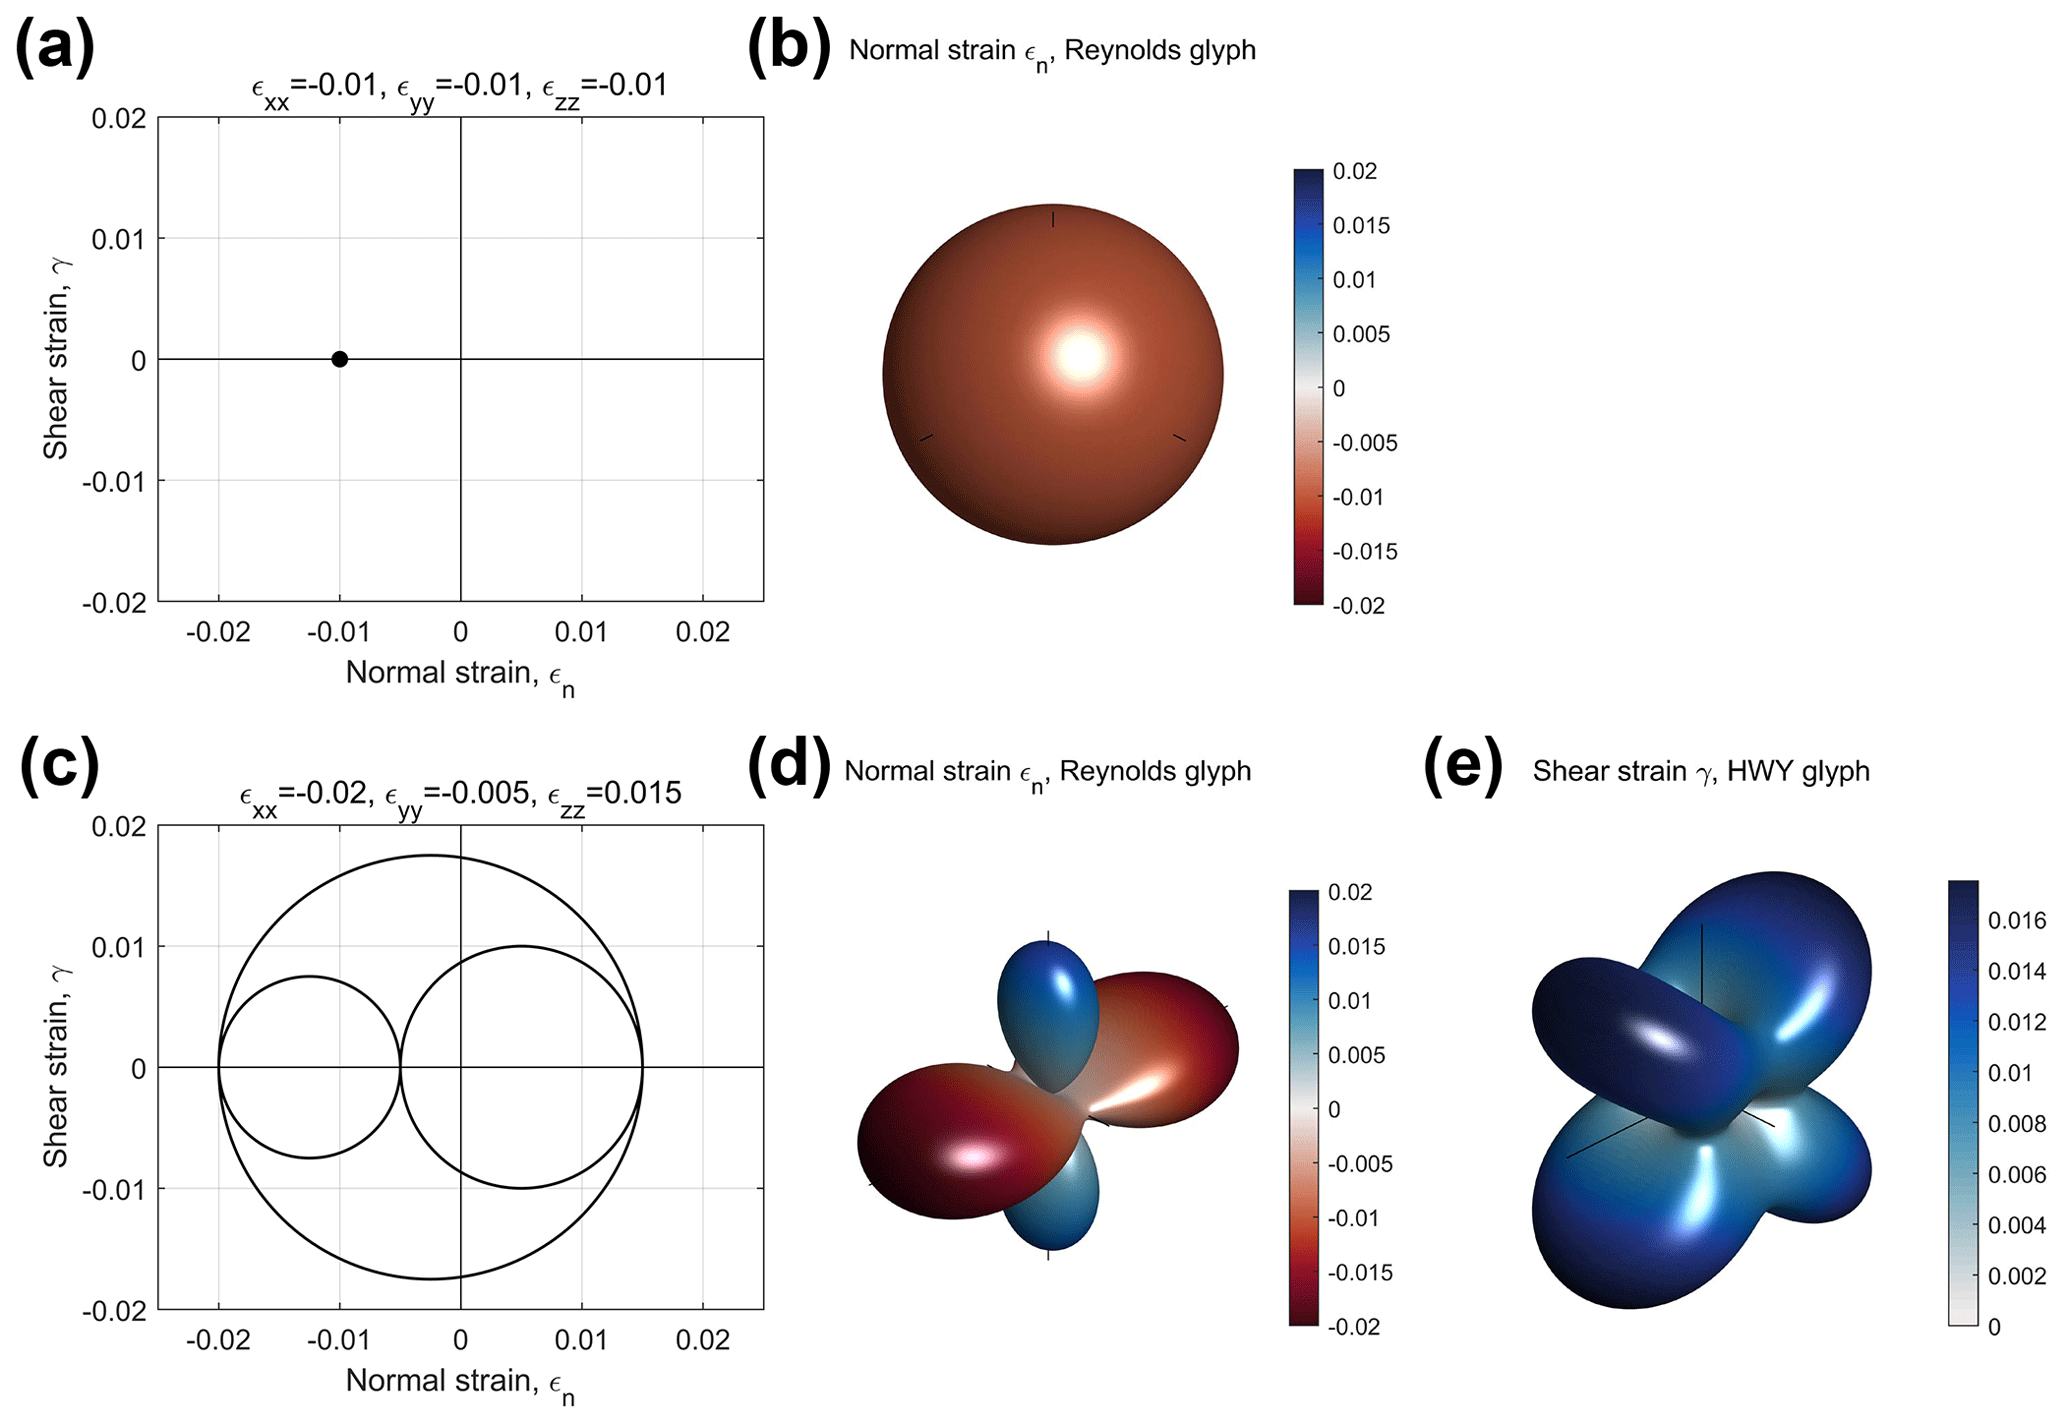
Figure 8Examples of strain tensors depicted in Mohr space (εn, γ) and as Reynolds (normal strains, εn) and HWY (shear strains, γ) glyphs. (a–b) Isotropic compaction (taken as negative, red colour). (c–e) Visualisations for a general triaxial strain. Note the lobes of extensional (blue) and contractional (red) strain in the normal strain plot (d).
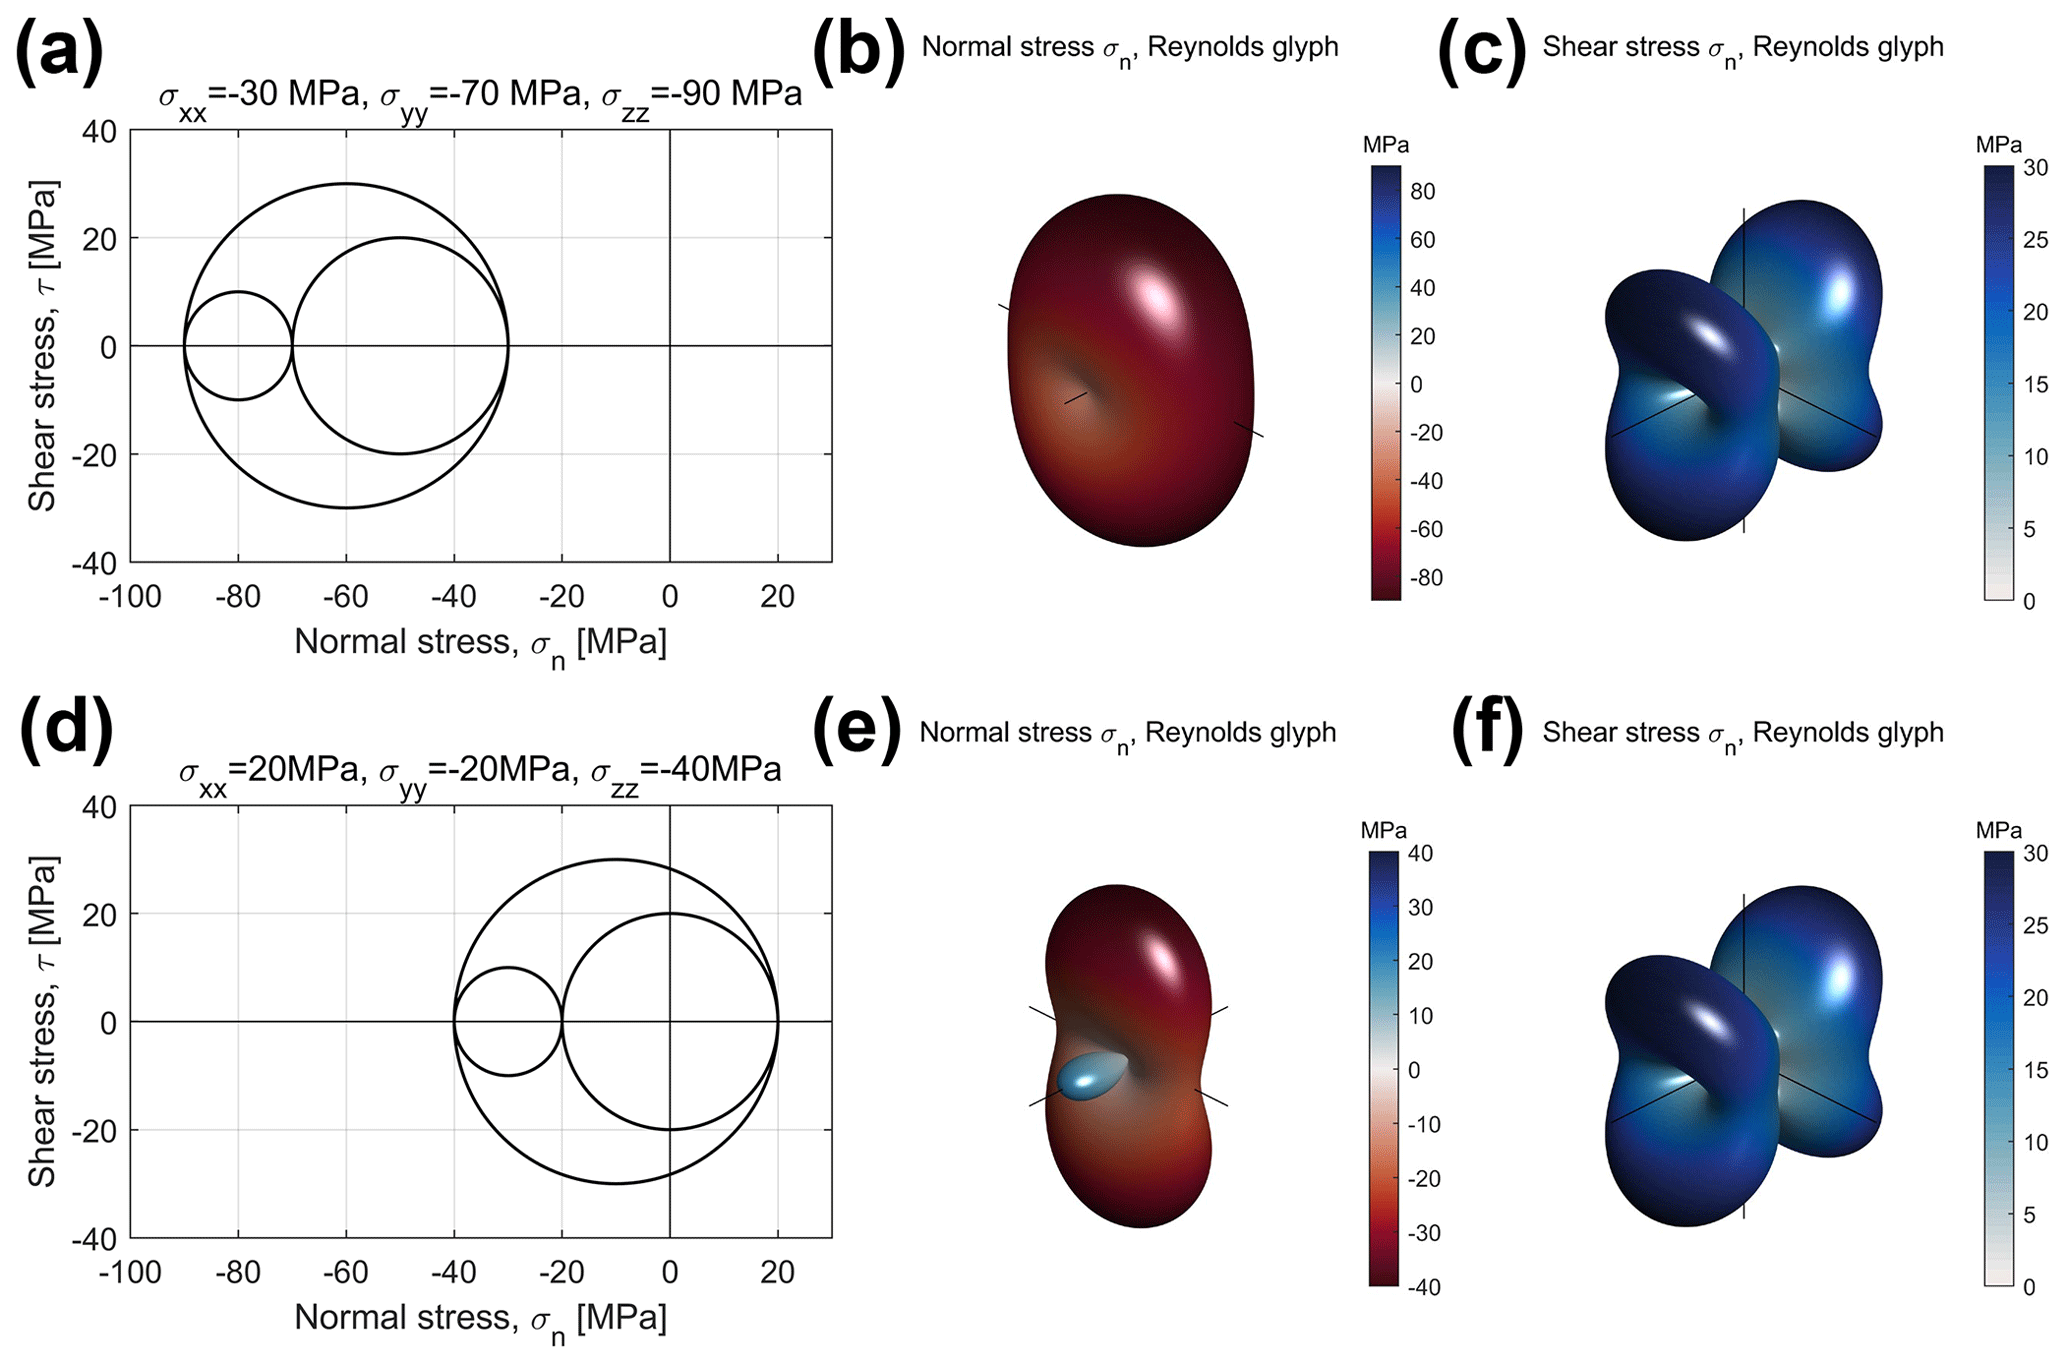
Figure 9Examples of stress tensors depicted in Mohr space (σn, τ) and as Reynolds (normal stress, σn) and HWY (shear stress, τ) glyphs. (a–c) Triaxial compression (taken as negative, red colour). (d–f) General triaxial stress with one principal stress tensile (σxx).
4.1 Data sources
The elastic properties of the minerals used in this study have been derived from previous compilations and original sources where possible. Many compilations of elastic and other physical properties are now available: see Bass (1995) and Almqvist and Mainprice (2017) and references therein. Note that most elastic properties are measured by laboratory methods, whereas a minority are calculated from theory (ab initio molecular dynamics simulations; e.g. Mainprice et al., 2008). Single mineral lattice parameters have been extracted from the same publication as the elasticity data where possible; however, if these were not available, we took representative values from Deer et al. (1992).
4.2 Summary plots
From our database of published elastic properties of rock-forming minerals (246 data files covering 86 distinct minerals, all included with AnisoVis), we have calculated the maxima and minima for Young's modulus, Poisson's ratio, shear modulus and linear compressibility. In Fig. 10 we show the variation in the anisotropy of Young's modulus (E) for 246 rock-forming minerals as a function of the Universal Anisotropy Index AU. If we consider a simple measure of the anisotropy of E as the ratio between the maximum and minimum values, it is clear that most minerals display significant anisotropy with often greater than 2. With increasing AU, many minerals show ratios of about 4 or more. Figure 11 shows the anisotropy of shear modulus (G) for the same rock-forming minerals plotted against AU. The anisotropy of G, simply defined as , is less than that shown for E, and this ratio tends to flatten out with increasing AU.
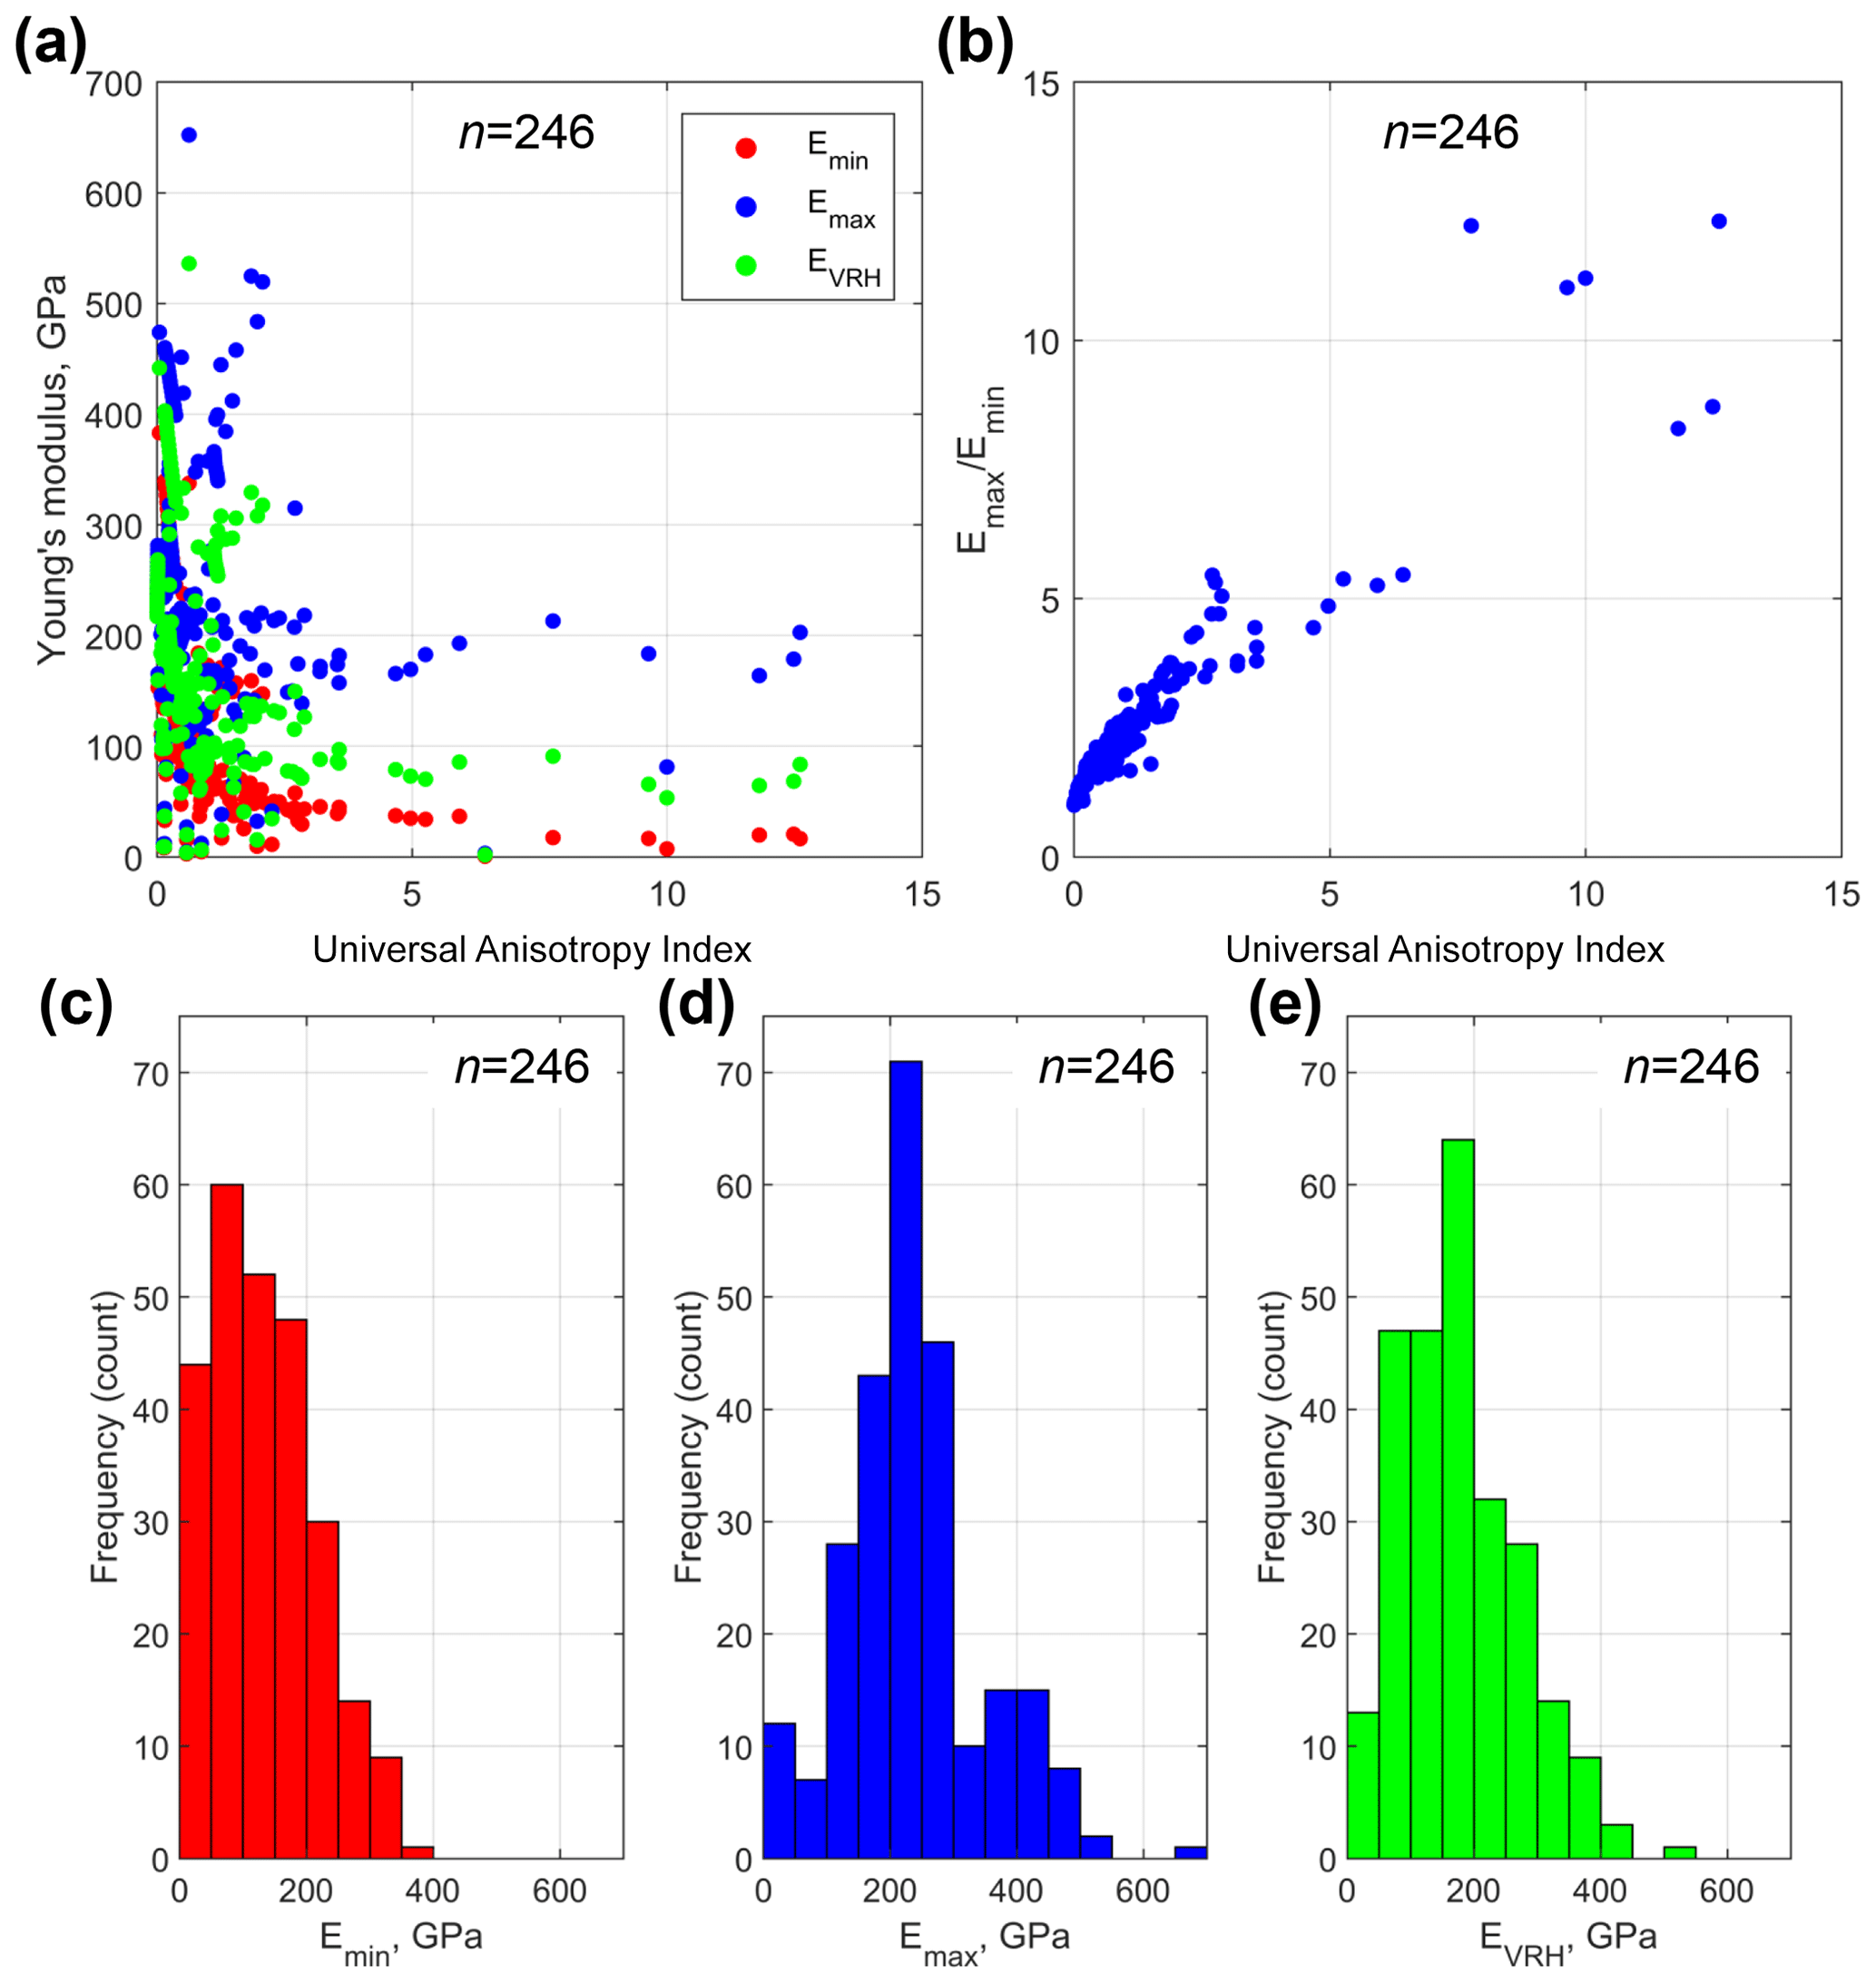
Figure 10Anisotropy of Young's modulus in rock-forming minerals (n=246) plotted against the Universal Anisotropy Index (AU) of Ranganathan and Ostoja-Starzewski (2008). EVRH is the Voigt–Reuss–Hill average of E. Many minerals display anisotropy of E () of 2 or more. (b) Plot of versus AU. (c–e) Histograms of Emin, Emax and EVRH to show the distribution across all 246 datasets.
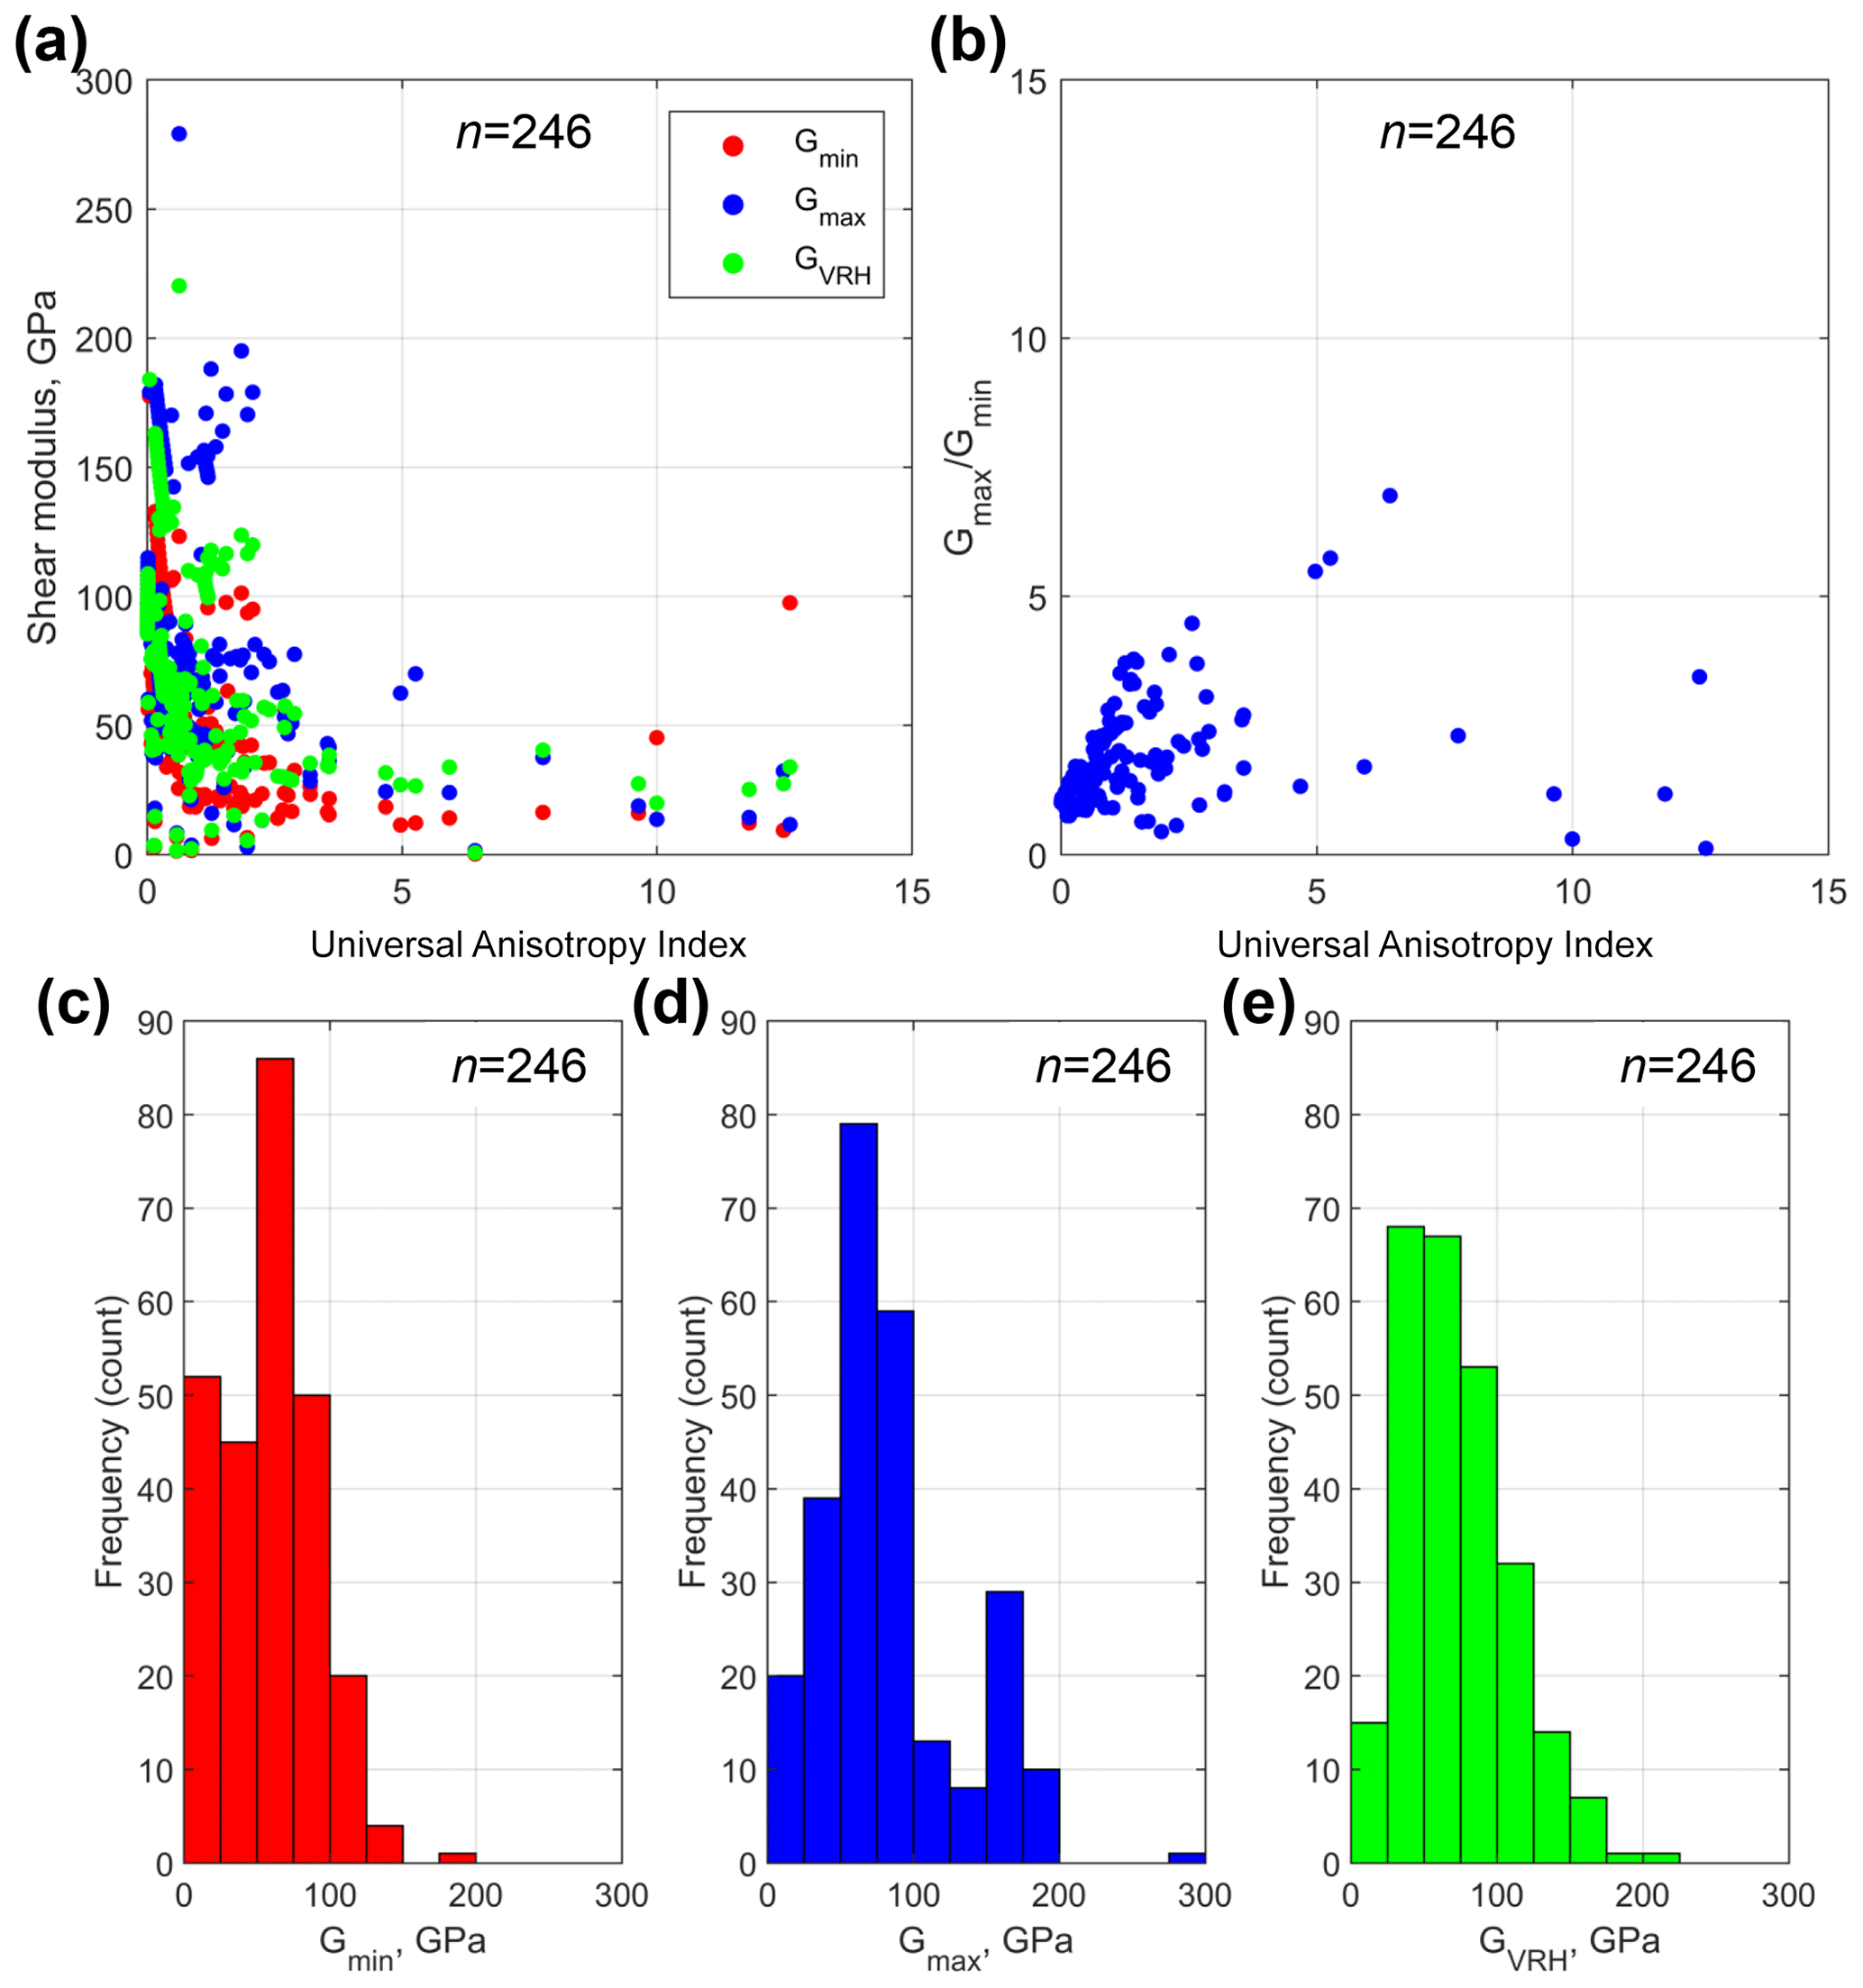
Figure 11Anisotropy of shear modulus in rock-forming minerals (n=246) plotted against the Universal Anisotropy Index of Ranganathan and Ostoja-Starzewski (2008). GVRH is the Voigt–Reuss–Hill average of G. (b) Plot of versus AU. (c–e) Histograms of Gmin, Gmax and GVRH to show the distribution across all 246 datasets.
Figure 12 shows the variation in Poisson's ratio (ν) versus AU for all minerals. The shaded area in Fig. 12a and b denotes the range . As noted by Ting and Chen (2005), ν for anisotropic materials can have no bounds. The data show that many minerals have minimum values less than 0 and maximum values greater than 0.5. The histogram in Fig. 12c shows the statistical variation in νmin for all minerals: 28 % () have negative minimum values for Poisson's ratio – that is, they display auxetic behaviour. Analysis of the variation of νmax shows that 37 % () have values greater than 0.5 (Fig. 12d). The mean value of the Voigt–Reuss–Hill average of Poisson's ratio for all minerals is 0.2464 (Fig. 12e), close to the default assumption of many simplifications to elastic isotropy (ν=0.25). A full list of the rock-forming minerals in our database that show auxetic behaviour is shown in Table 2, and the specific directions of negative ν are shown for several examples in the stereograms in Fig. 13.
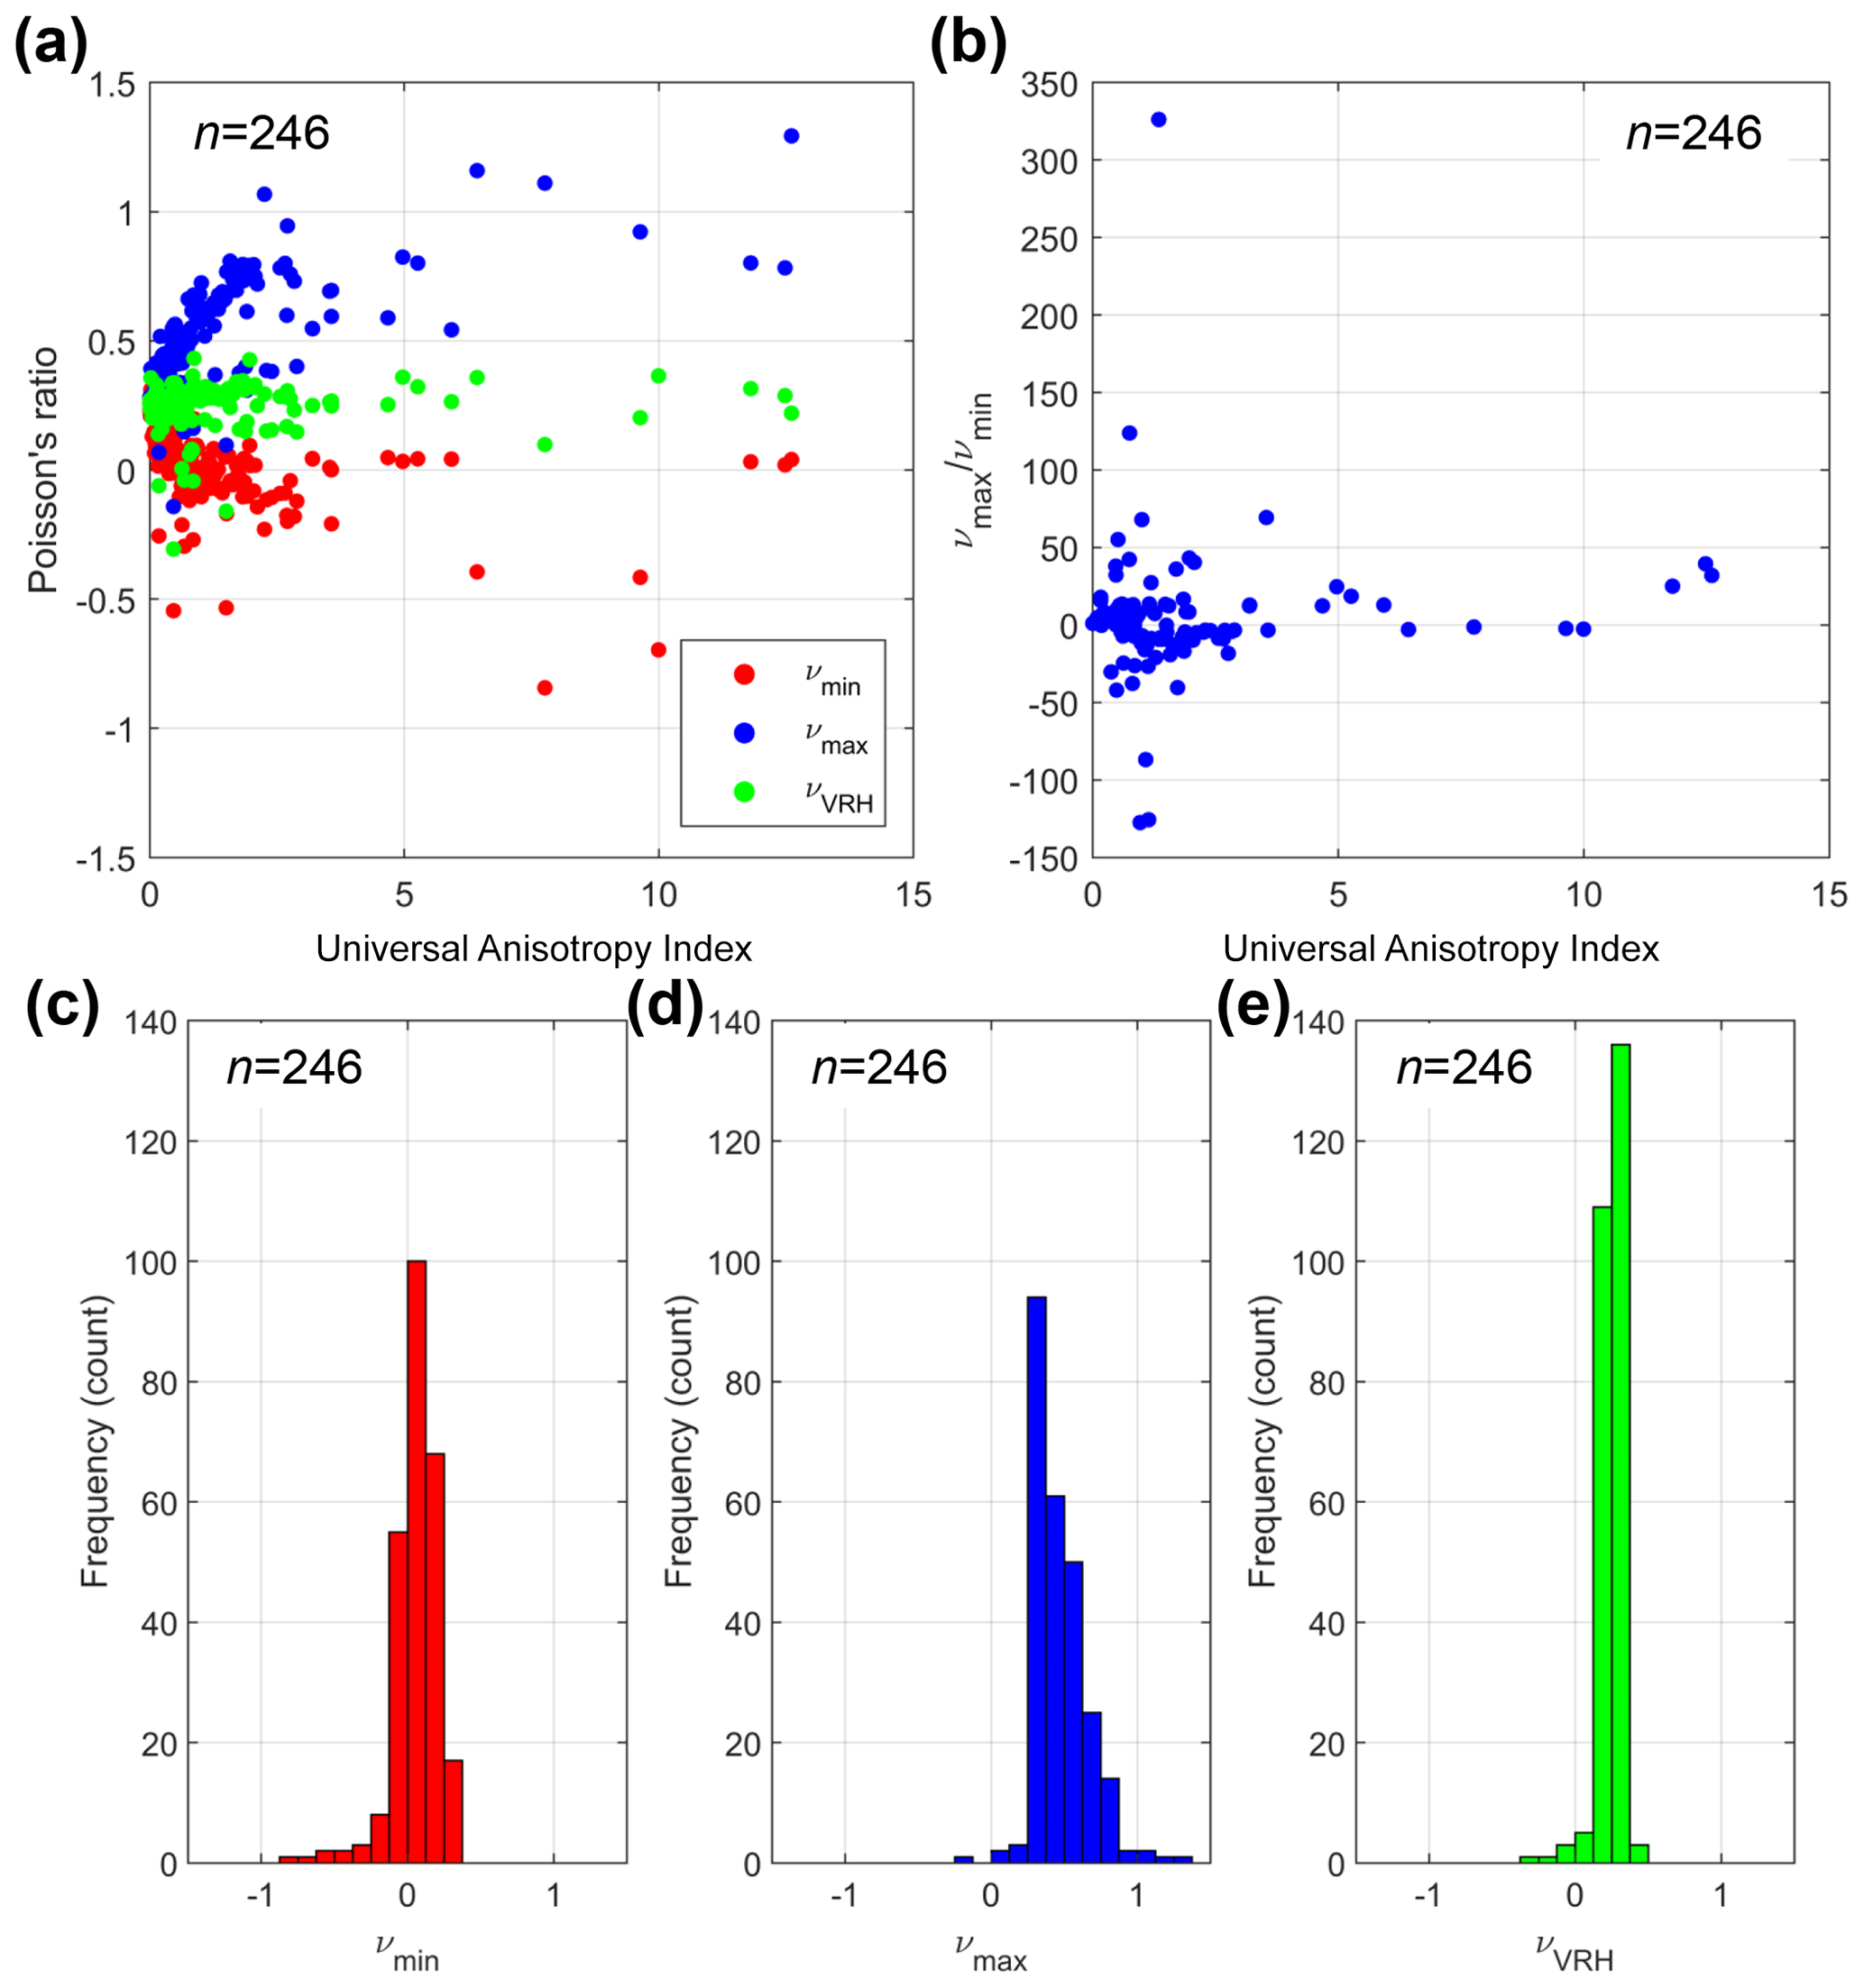
Figure 12(a) Anisotropy of Poisson's ratio in rock-forming minerals (n=246) plotted against the Universal Anisotropy Index of Ranganathan and Ostoja-Starzewski (2008). νVRH is the Voigt–Reuss–Hill average of ν. (b) Plot of versus AU. (c) Histogram of νmin values shown in Fig. 12. Note that 28 % () of minerals display negative νmin. (d) Histogram of νmax values. Note 37 % () minerals display . (e) Histogram of νVRH values. Mean νVRH=0.2464, very close to the common default assumption of ν=0.25.
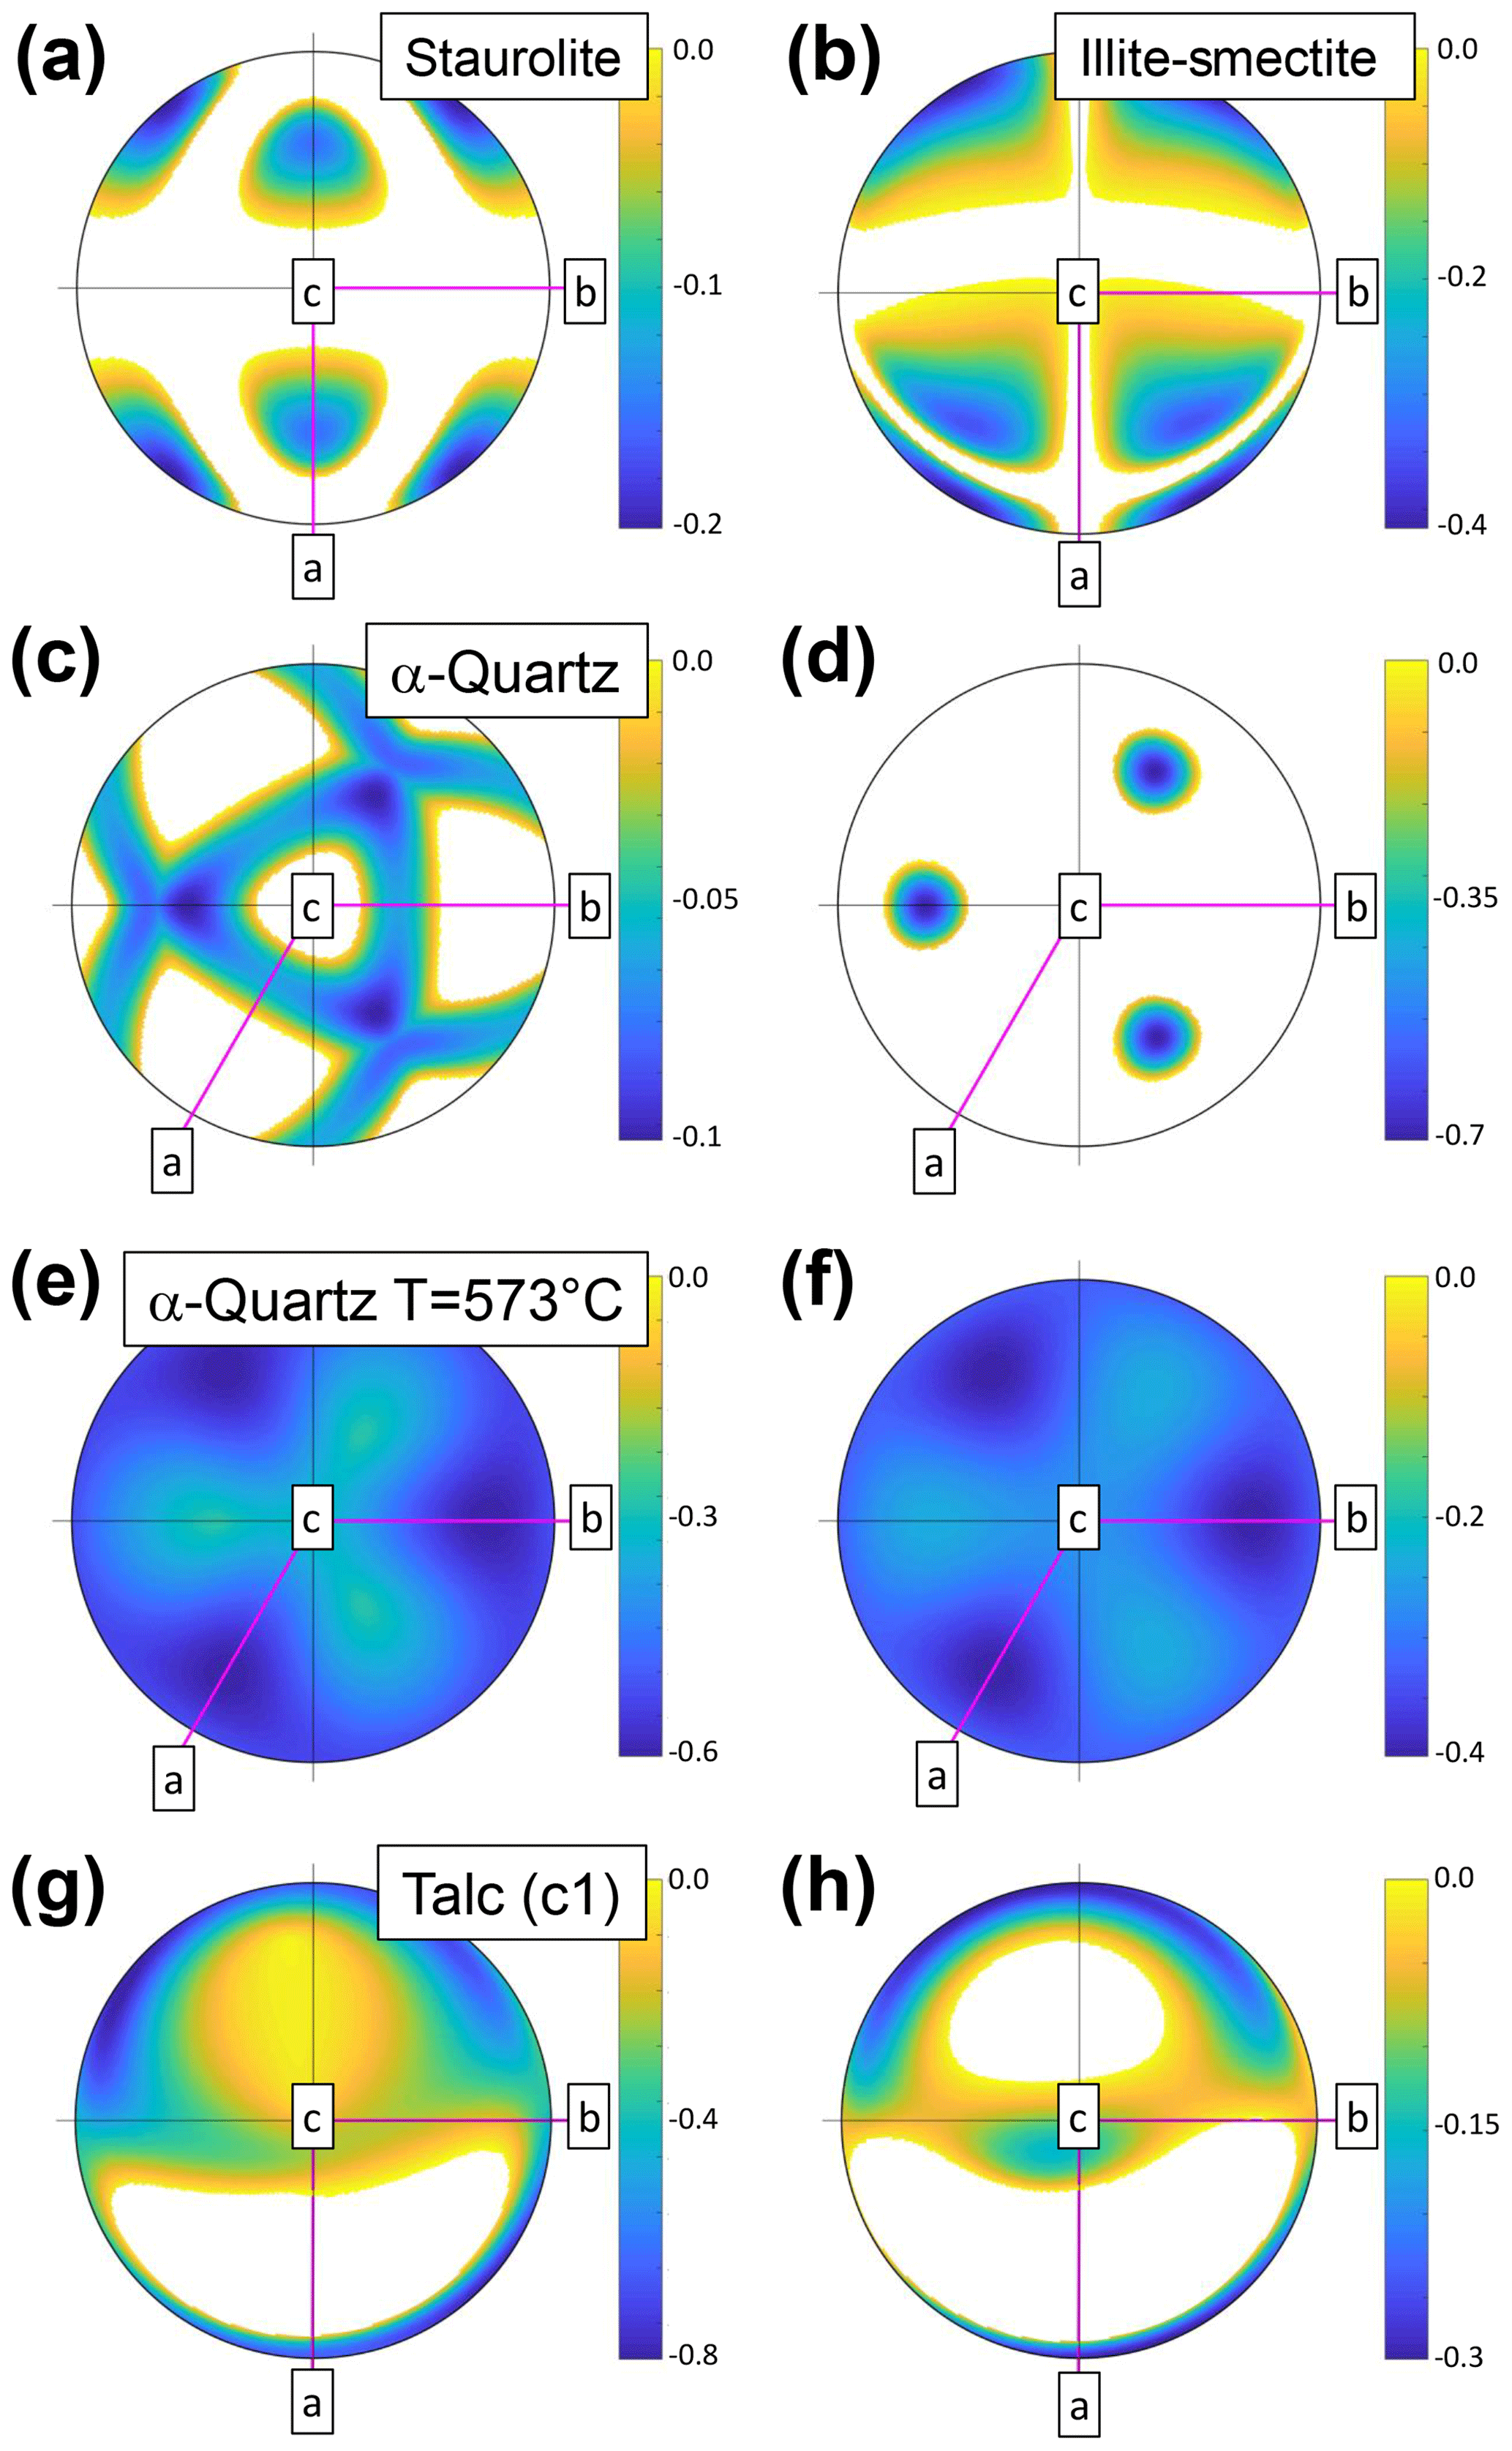
Figure 13Examples of rock-forming minerals showing auxetic and areally auxetic behaviours. Stereograms are all lower-hemisphere equal-area projections and only the directions with negative Poisson's ratio (a, b, c, e, g) or negative areal Poisson's ratio (d, f, h) are shown coloured in (i.e. other directions show positive values). Crystallographic axes in pink. (a) Staurolite. (b) Illite-smectite. (c–d) α-Quartz. (e–f) α-Quartz at the temperature of the phase transformation to β-Quartz (hexagonal). (g–h) Talc (c1, triclinic).
Table 2List of rock-forming minerals showing auxetic behaviour (Poisson's ratio <0) in at least one direction. Also shown are those minerals with directions that have negative areal Poisson's ratio (Guo and Wheeler, 2006). The “Reference” column shows the source of the elasticity data for each mineral used in the calculation. The auxetic directions were found by calculating Poisson's ratio for every possible direction (α, β, θ in the Turley and Sines reference frame shown in Fig. 1) using an angular increment of 1∘ in each direction.

The elastic properties of minerals are known to be temperature (T) and pressure (P) dependent. However, systematic data to quantify the variation of anisotropic elasticity with T or P are relatively scarce. We summarise some of the published data in Fig. 14, shown as the calculated range in Poisson's ratio (νmin to νmax). In terms of pressure dependence, the effect of increasing P is to decrease the anisotropy in ν for talc to within the range normally expected for isotropic minerals. The opposite effect is observed for zircon, with modest increases in νmax with P. The temperature dependence of elastic anisotropy in quartz is well known (Mainprice and Casey, 1990), with a significant excursion into auxetic behaviour at the temperature of the α–β phase transition at 573 ∘C (846 K). The effect of increasing T on the anisotropy of ν for olivine, corundum and spinel is almost non-existent.
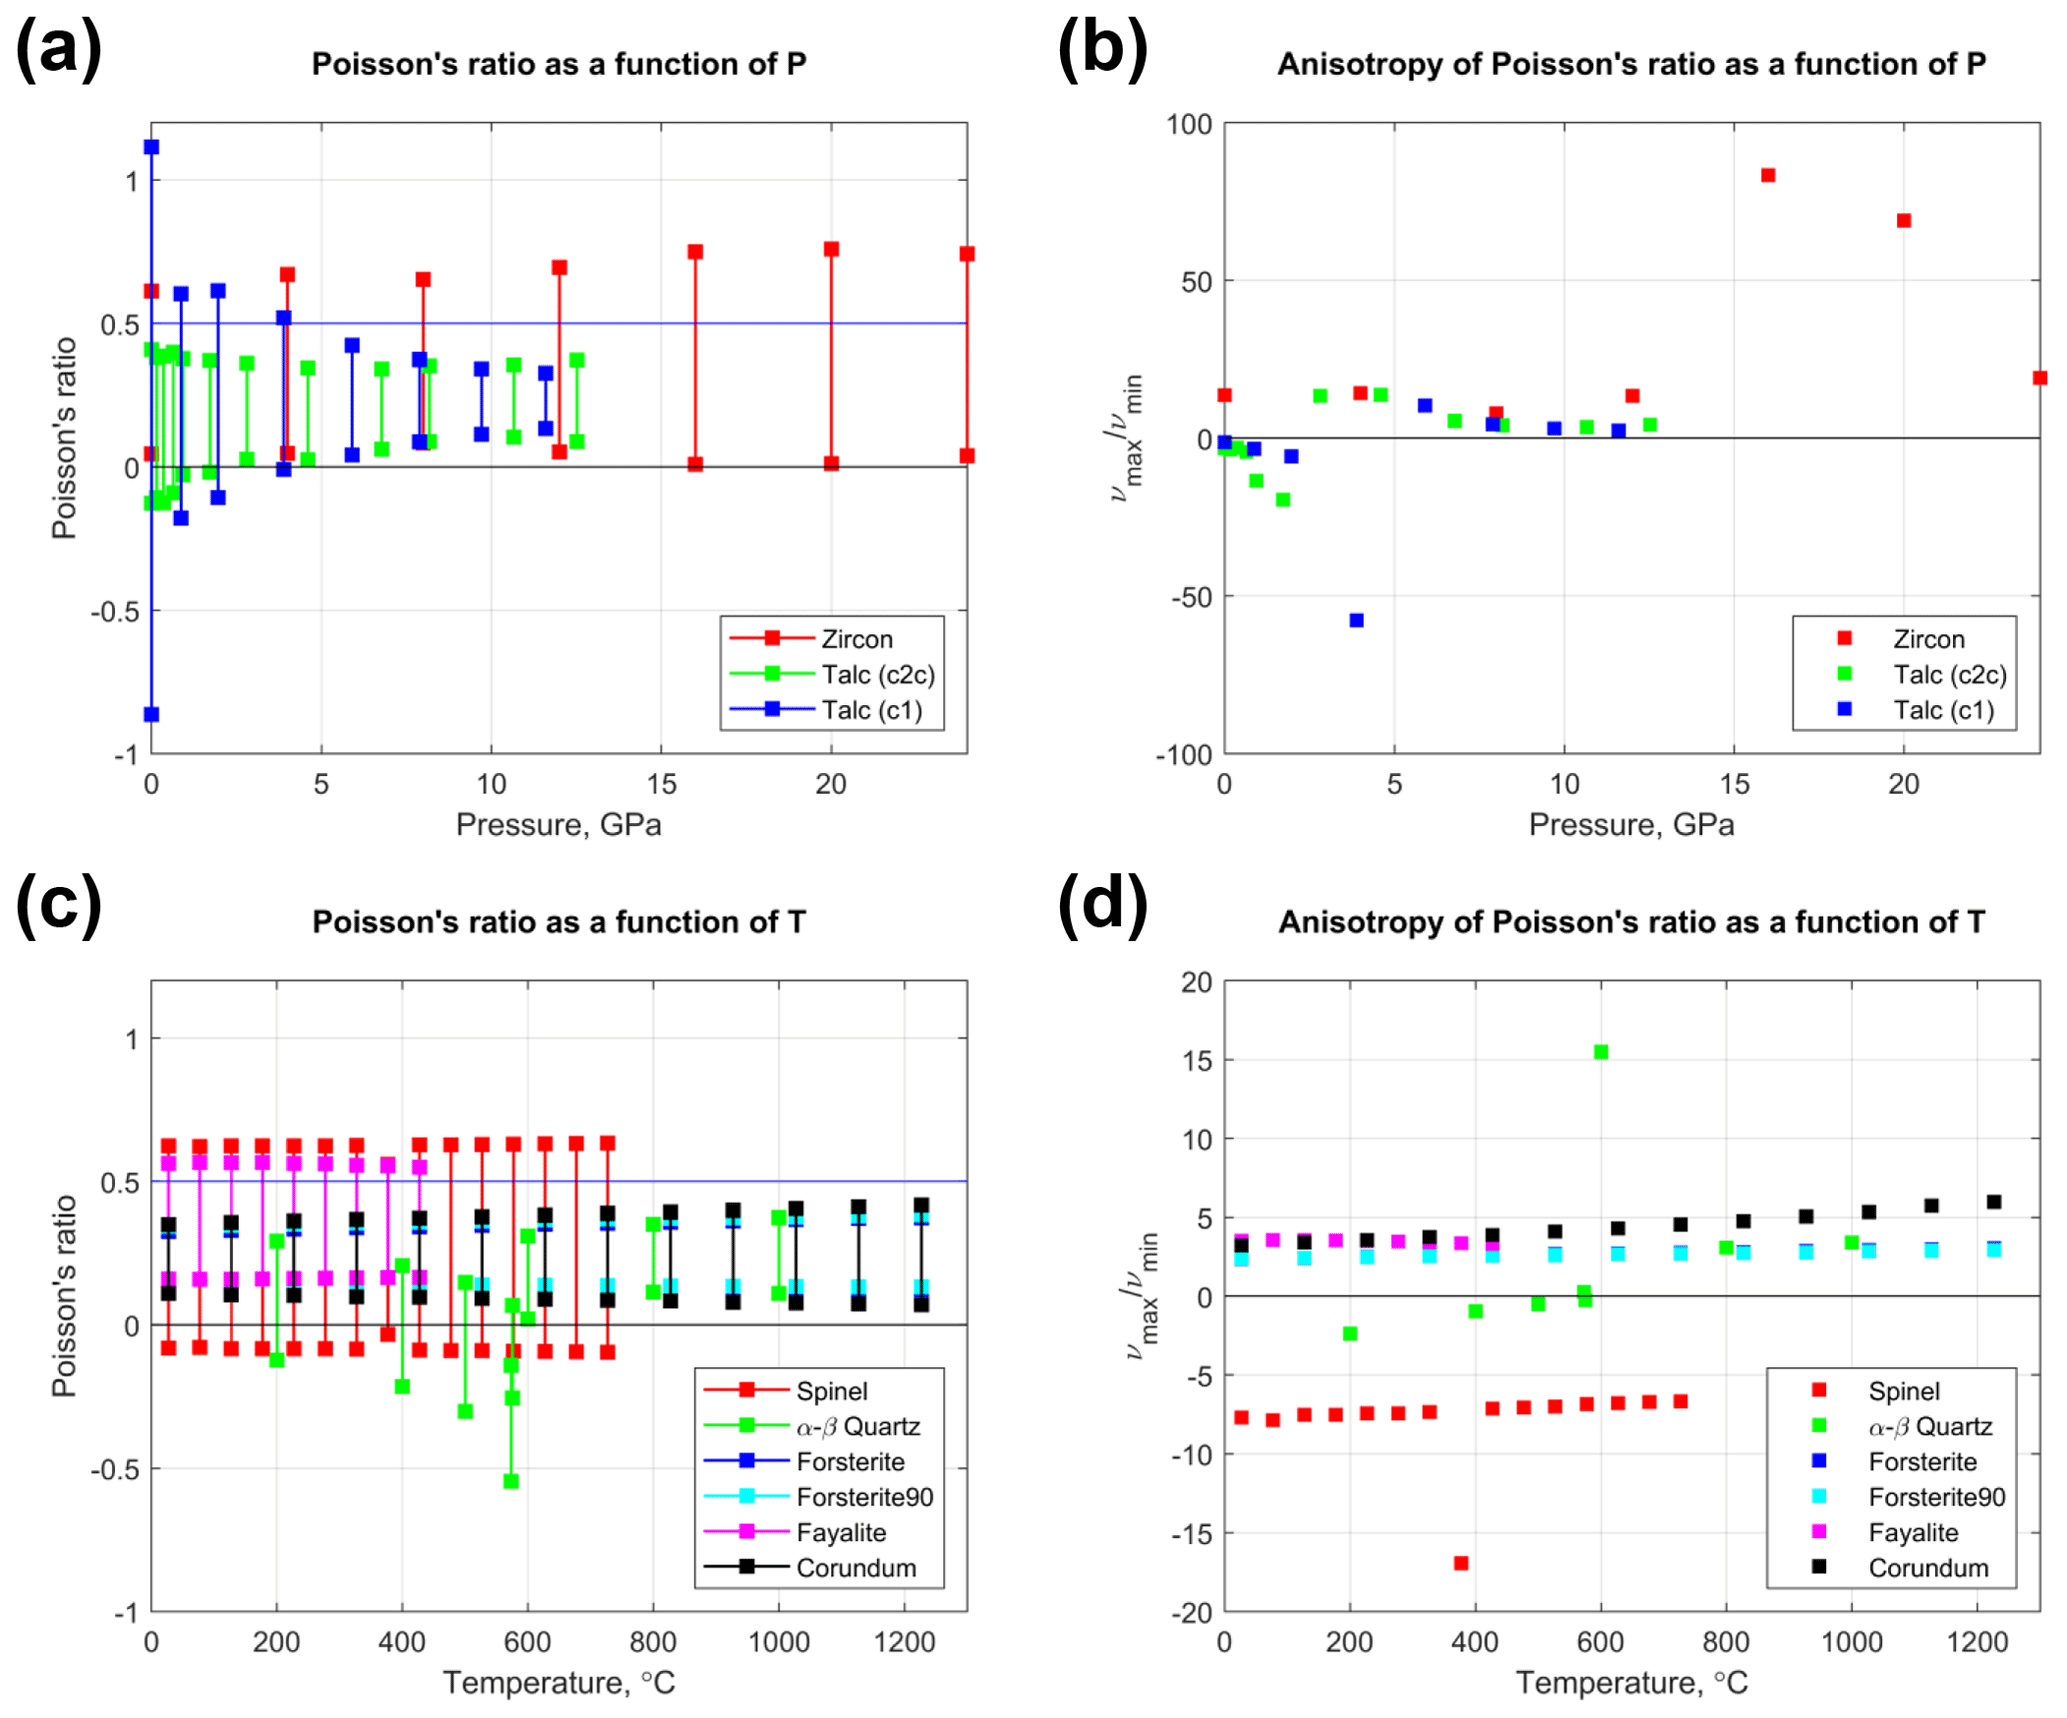
Figure 14Anisotropy of Poisson's ratio in rock-forming minerals as a function of P (a, b) and T (c, d). Other than the well-known auxeticity of α–β quartz around the phase transition (T=573 ∘C), most minerals display Poisson's ratios of between 0 and 0.5. Talc (c1, triclinic) is one exception, and the anisotropy of Poisson's ratio decreases markedly with increasing P.
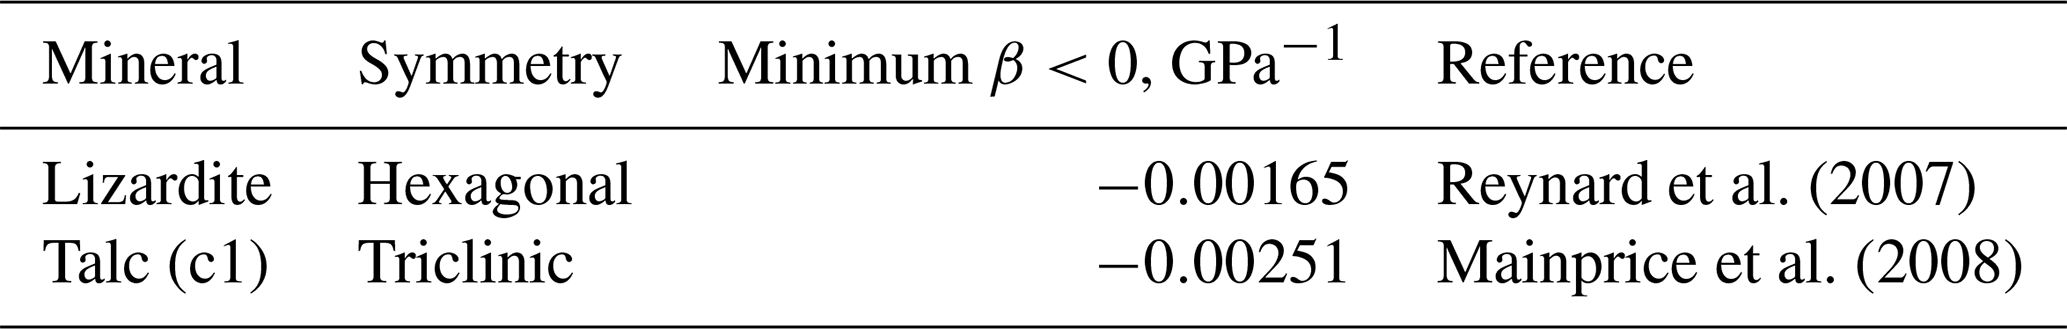
Linear compressibility (β) also displays significant anisotropy in rock-forming minerals (Fig. 16). A list of the rock-forming minerals in our database that show negative linear compressibility (NLC) is shown in Table 3. These minerals have directions that expand in response to a compressive hydrostatic pressure (and vice versa: “stretch-densification” of Baughman et al., 1998b). The specific directions of negative β are shown in the stereograms in Fig. 15.
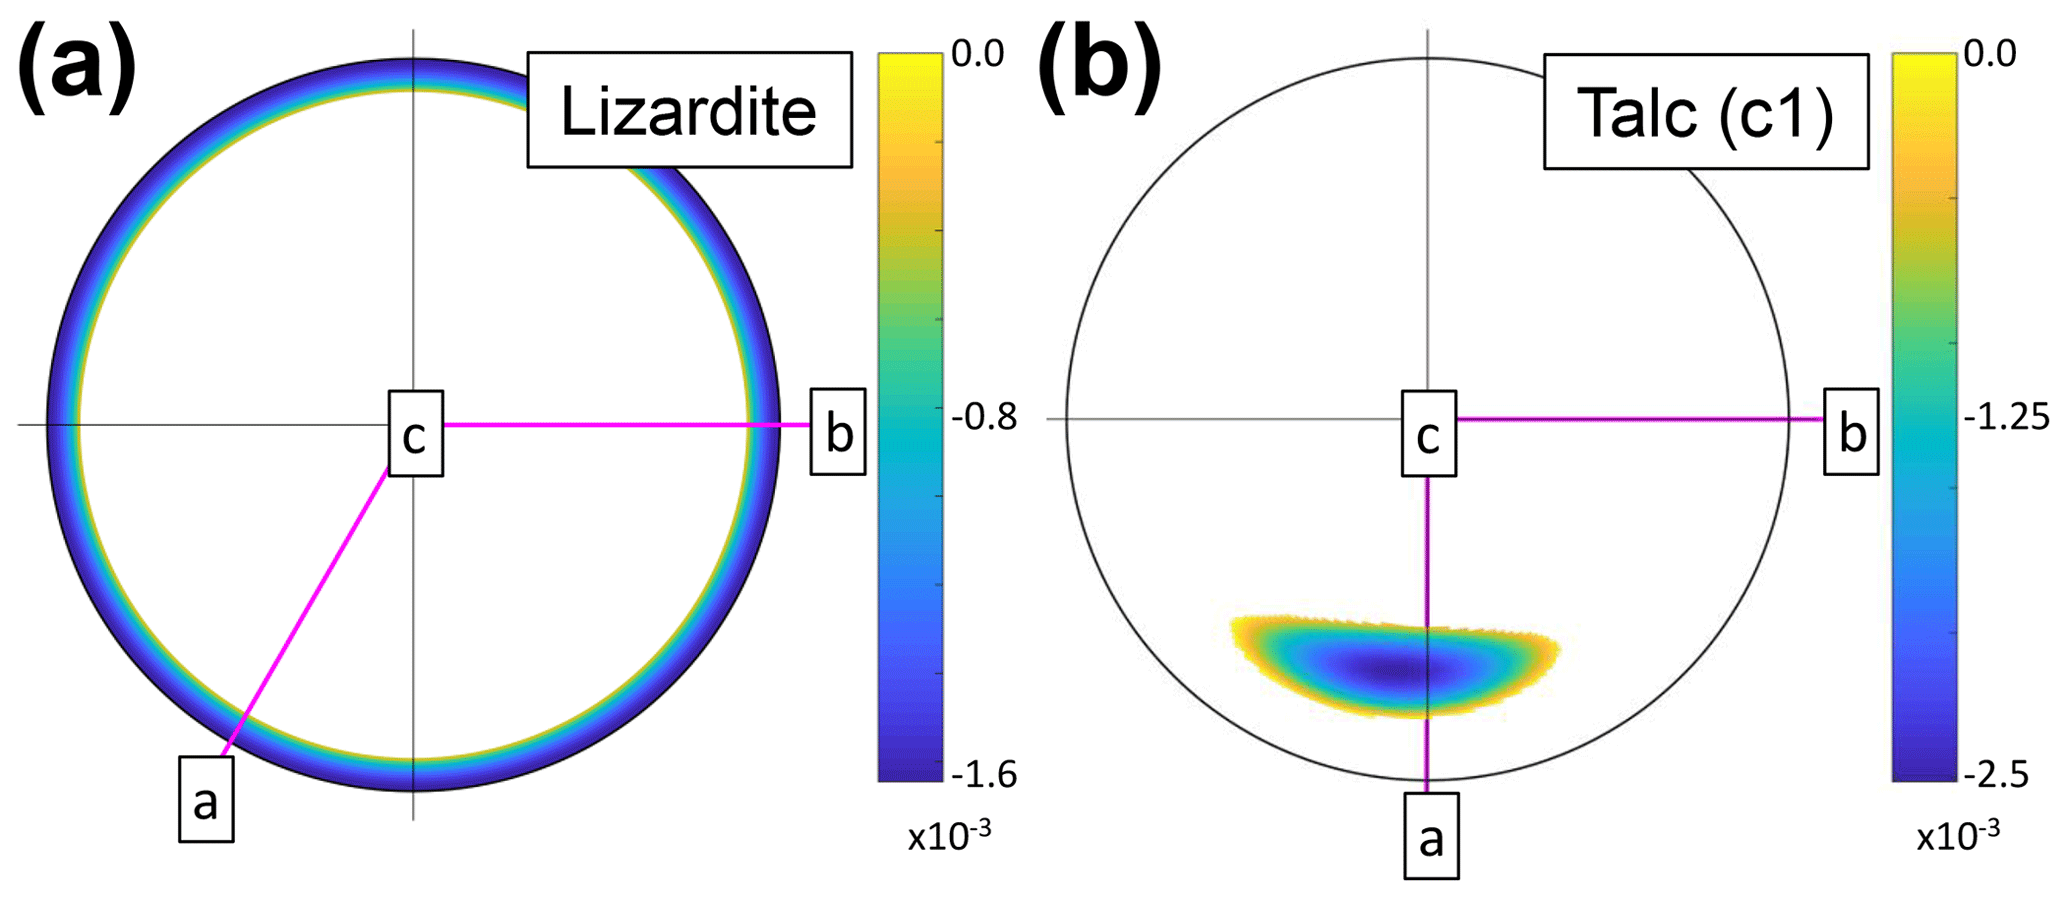
Figure 15Rock-forming minerals showing negative linear compressibility (NLC) in certain directions. Stereograms are all lower-hemisphere equal-area projections and only the directions with NLC are shown coloured in (i.e. other directions show positive values). Crystallographic axes in pink. (a) Lizardite. (b) Talc (c1, triclinic).

Figure 16(a) Anisotropy of linear compressibility (β, in GPa−1) in rock-forming minerals (n=246) plotted against the Universal Anisotropy Index of Ranganathan and Ostoja-Starzewski (2008). (b) Plot of versus AU. (c–e) Histograms of βmin, βmax and βVRH to show the distribution across all 246 datasets.
Table 3List of rock-forming minerals showing negative linear compressibility (NLC) in at least one direction.
We can summarise the elastic anisotropy data for all rock-forming minerals using the elastic anisotropy diagram of Ranganathan and Ostoja-Starzewski (2008). In their review of Poisson's ratio in materials, Greaves et al. (2011) used a plot of bulk modulus K versus shear modulus G; however, for the anisotropic rock-forming minerals there is no single value of either of these properties. Following Ranganathan and Ostoja-Starzewski (2008), we therefore take the ratios KV∕KR and GV∕GR and cross-plot these instead (Fig. 17). Note that the origin is at (1, 1) as no mineral can have or . The dashed lines of slope −5 are for constant AU (Eq. 14), increasing to the right. Unsurprisingly, minerals with monoclinic, triclinic and hexagonal symmetries dominate the higher elastic anisotropies, while minerals with cubic, orthorhombic and tetragonal symmetries are generally less elastically anisotropic.
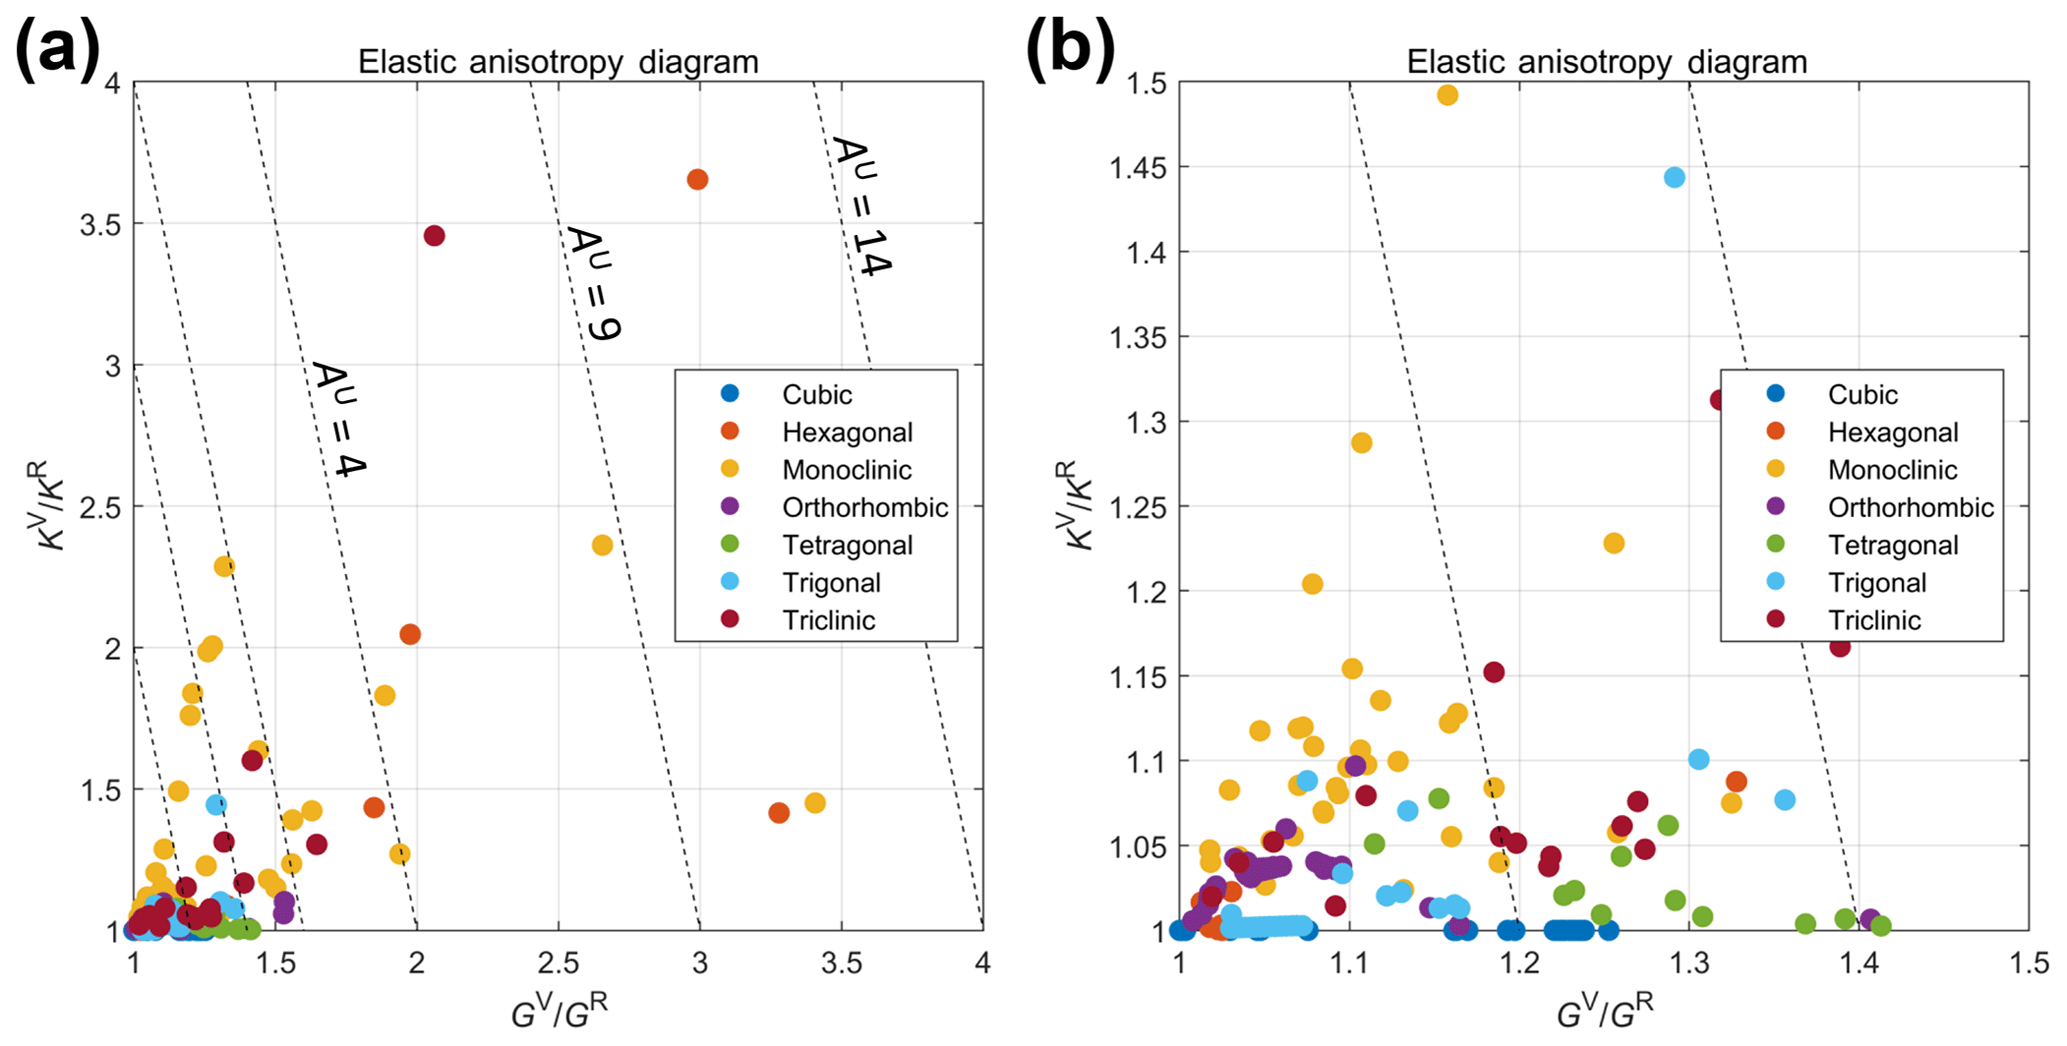
Figure 17(a) Anisotropy of rock-forming minerals (n=246) using the elastic anisotropy diagram used in materials science, grouped by mineral symmetry class. (b) Close-up of the data plotted in (a) with GV∕GR in the range of 1 to 1.5 and KV∕KR in the range of 1 to 1.5.
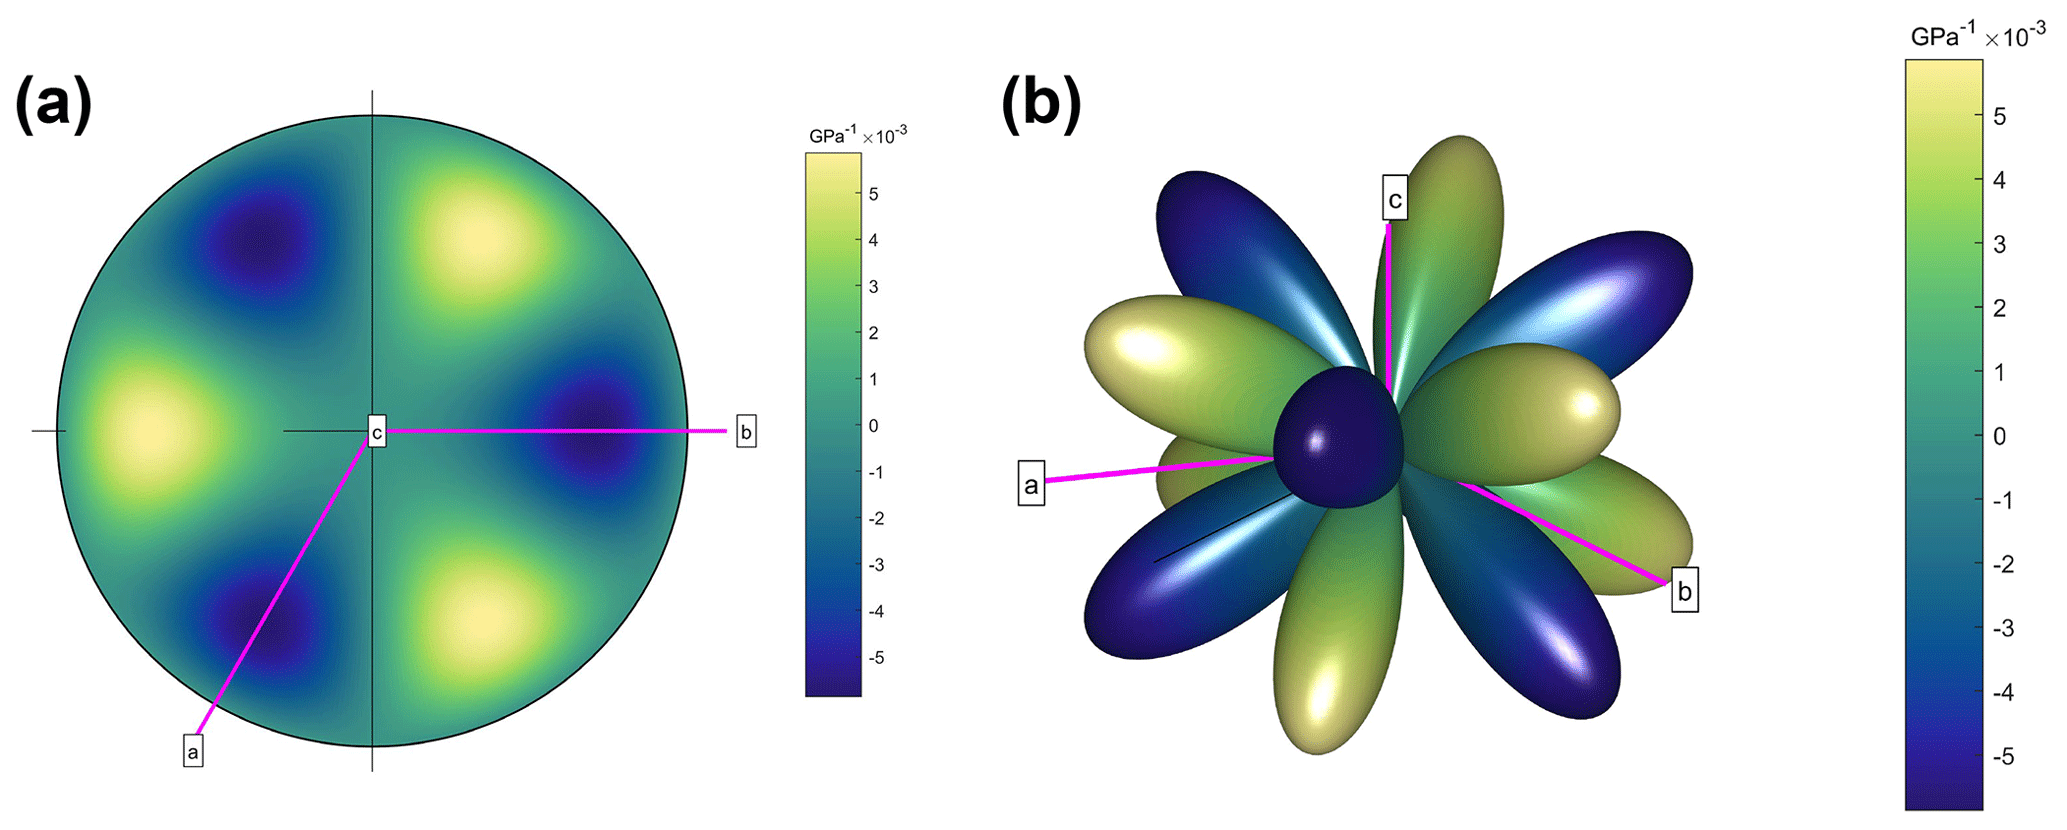
Figure 18Anisotropy of for Dauphiné twinning in α-quartz. is the difference in the compliance between the twinned and un-twinned orientations for each direction. (a) Stereogram (lower-hemisphere equal-area projection) and (b) a 3D representation surface, both with the crystallographic reference axes marked. The directions represented by pale yellow-to-green colours will be favoured for twinning, whereas the directions shown in blue will not.
5.1 Twinning
Deformation or mechanical twinning critically depends on the anisotropy of elastic properties, because minerals respond elastically to imposed stress (or strain) before exceeding the threshold for twin nucleation and propagation (Christian and Mahajan, 1995, and references therein). Perhaps the most widely accepted theory is that twin initiation occurs when an applied shear stress along the twin shear plane (K1) in the shear direction of twinning (η1) reaches a critical value (critically resolved shear stress, CRSS) for twin nucleation and propagation, analogous to Schmid's law for dislocation slip (Thompson and Millard, 1952; Bell and Cahn, 1953; Christian and Mahajan, 1995). However, experimental results can indicate that twinning dynamics can be more complex (e.g. Bell and Cahn, 1957). Additional complexities, such as energy barriers for the nucleation of coeval defects such as stacking faults, disconnections and unstable transition states associated with twinning, have also been considered for twinning in metals (e.g. Serra and Bacon; 1996; Kibey et al., 2007; Pond et al., 2016). Development of a general theory of mechanical twinning applicable to most minerals is still lacking. Nevertheless, shear modulus G in η1 along K1 is highly relevant to mechanical twinning.
Dauphiné twins in α-quartz are merohedral twins, meaning only some atoms exchange their positions, resulting in a host–twin symmetry relationship that can be described simply by a 180∘ rotation about the c axis, and recognisable in EBSD maps via a 60∘ misorientation around the c axis. The formation of Dauphiné twins has been related to the difference in elastic strain energy between twinned and un-twinned at constant stress (Thomas and Wooster, 1951; Tullis, 1970; DeVore, 1970). This difference in elastic strain energy can be written as
where (σ1−σ3) is the applied differential stress, and . Note that is the reciprocal of the Young's modulus for a given direction. Dauphiné twinning occurs more readily in those directions for which the strain energy difference (ΔE) is larger, under a boundary condition of constant axial stress. (The inverse is also true: under a condition of constant strain, the preferred directions of twinning are those that minimise ΔE; Paterson, 1973.) The variation of with direction in α-quartz is shown in Fig. 18. The stereogram is the same pattern shown in Thomas and Wooster (1951; their Fig. 3a) and Tullis (1970; her Fig. 2b). Also shown is a 3D representation surface of , which emphasises the anisotropy of favoured directions for Dauphiné twins in α-quartz. The significance of Dauphiné twinning in quartz has recently been described for sandstones compacted during diagenesis (Mørk and Moen, 2007), deformed in fault damage zones (Olierook et al., 2014), deformed by meteorite impact (Wenk et al., 2011; Timms et al., 2019; Cox et al., 2019), and deformed by granitoid protomylonites (Menegon et al., 2011). In all cases, Dauphiné twins can be used to infer palaeostresses from deformed microstructures. In addition, Menegon et al. (2011) make the point that Dauphiné twins, formed early in a deformation history, may effectively store strain energy which is then consumed in later plastic deformation mechanisms. DeVore (1970) plotted the directional variation of compliances for quartz, ortho- and clino-pyroxene, hornblende, and plagioclase and thereby extended the initial concept of Thomas and Wooster (1951). To our knowledge, detailed analyses of mechanical twins in these phases has not yet been related to the anisotropy of elastic compliance or the calculated variations in elastic strain energy for specific applied loads.
The relationship between elastic anisotropy and deformation twinning has been investigated in zircon (Timms et al., 2018). In zircon, deformation twins can form as a response to shock conditions and are diagnostic of hyper-velocity impact events (Timms et al., 2012, 2017; Erickson et al., 2013). Shock twinning in zircon, which is tetragonal, can occur in up to four symmetrically equivalent orientations, forming along {112} composition planes (the planes of invariant shear, or K1) and with shear direction η1=〈111〉, resulting in a host–twin 65∘/{110} misorientation relationship (Timms et al., 2018). Twinning in this mode has been shown to correspond to the lowest values of G ( GPa) (Timms et al., 2018). Furthermore, the lowest values of ν are along 〈111〉 in zircon, indicating that zircon is almost perfectly compressible in 〈111〉 ( and ≪0.1) (Timms et al., 2018). These authors illustrate that elastic softness in shear (low G) and a lack of lateral strain in the shear plane (ν∼0) are favourable conditions for twinning in zircon (Timms et al., 2018). However, further work is required to determine the critically resolved shear stress for twinning in zircon. Nevertheless, the ability to calculate and visualise anisotropic elastic properties in specific crystallographic directions presented here will be very useful for detailed investigations of mechanical twinning in other phases.
5.2 Polymorphic phase transformations
Coherent phase transformations (or transitions) may also be related to the anisotropy of elastic properties, including the α–β transformation in quartz. Coe and Paterson (1969) describe experiments on oriented cores from single crystals of quartz heated to temperatures above the transformation temperature (573 ∘C, at atmospheric pressure) and subjected to non-hydrostatic stress. They found that the temperature of transition was raised by different amounts depending on the orientation of the stress with respect to the crystal. Crystal cores stressed parallel to the c axis showed the least change, whereas those loaded in the m direction (perpendicular to c) showed the greatest increase. (They also performed experiments on samples cored in the o and r′ directions.) The temperature of phase transformation from α- (trigonal) to β-quartz (hexagonal) is therefore stress dependent. The theoretical analysis of Coe and Paterson (1969, their Appendix C) ascribes this dependence to an infinitesimal reversible transformation strain, based on the formalism of Eshelby (1957, 1959). Noting that the transformation is also marked by a “dramatic increase in the development of small-scale Dauphine twins”, we have calculated the elastic strain energy per unit volume for each of the four core orientations tested by Coe and Paterson, using their values of applied stress ( GPa, MPa; negative stress compressive) and the elastic constants of α-quartz at 500 ∘C (Lakshtanov et al., 2007). The results are shown in Fig. 19, and they clearly show an exact correlation with experimental data: the sample loaded in the m direction has the highest strain energy and that in the c direction has the lowest. The overall sequence is , which precisely mirrors that of the variation in listed for each direction in Coe and Paterson (1969, their Table 3). Therefore, we speculate that the mechanism of phase transformation of α- to β-quartz is probably not related to that of Dauphiné twinning in α-quartz, as the temperature difference increases for those directions that maximise the elastic strain energy under a constant applied stress. We also note that similar phenomena may occur in pyroxenes (Coe, 1970; Coe and Muller, 1973; Clément et al., 2018).
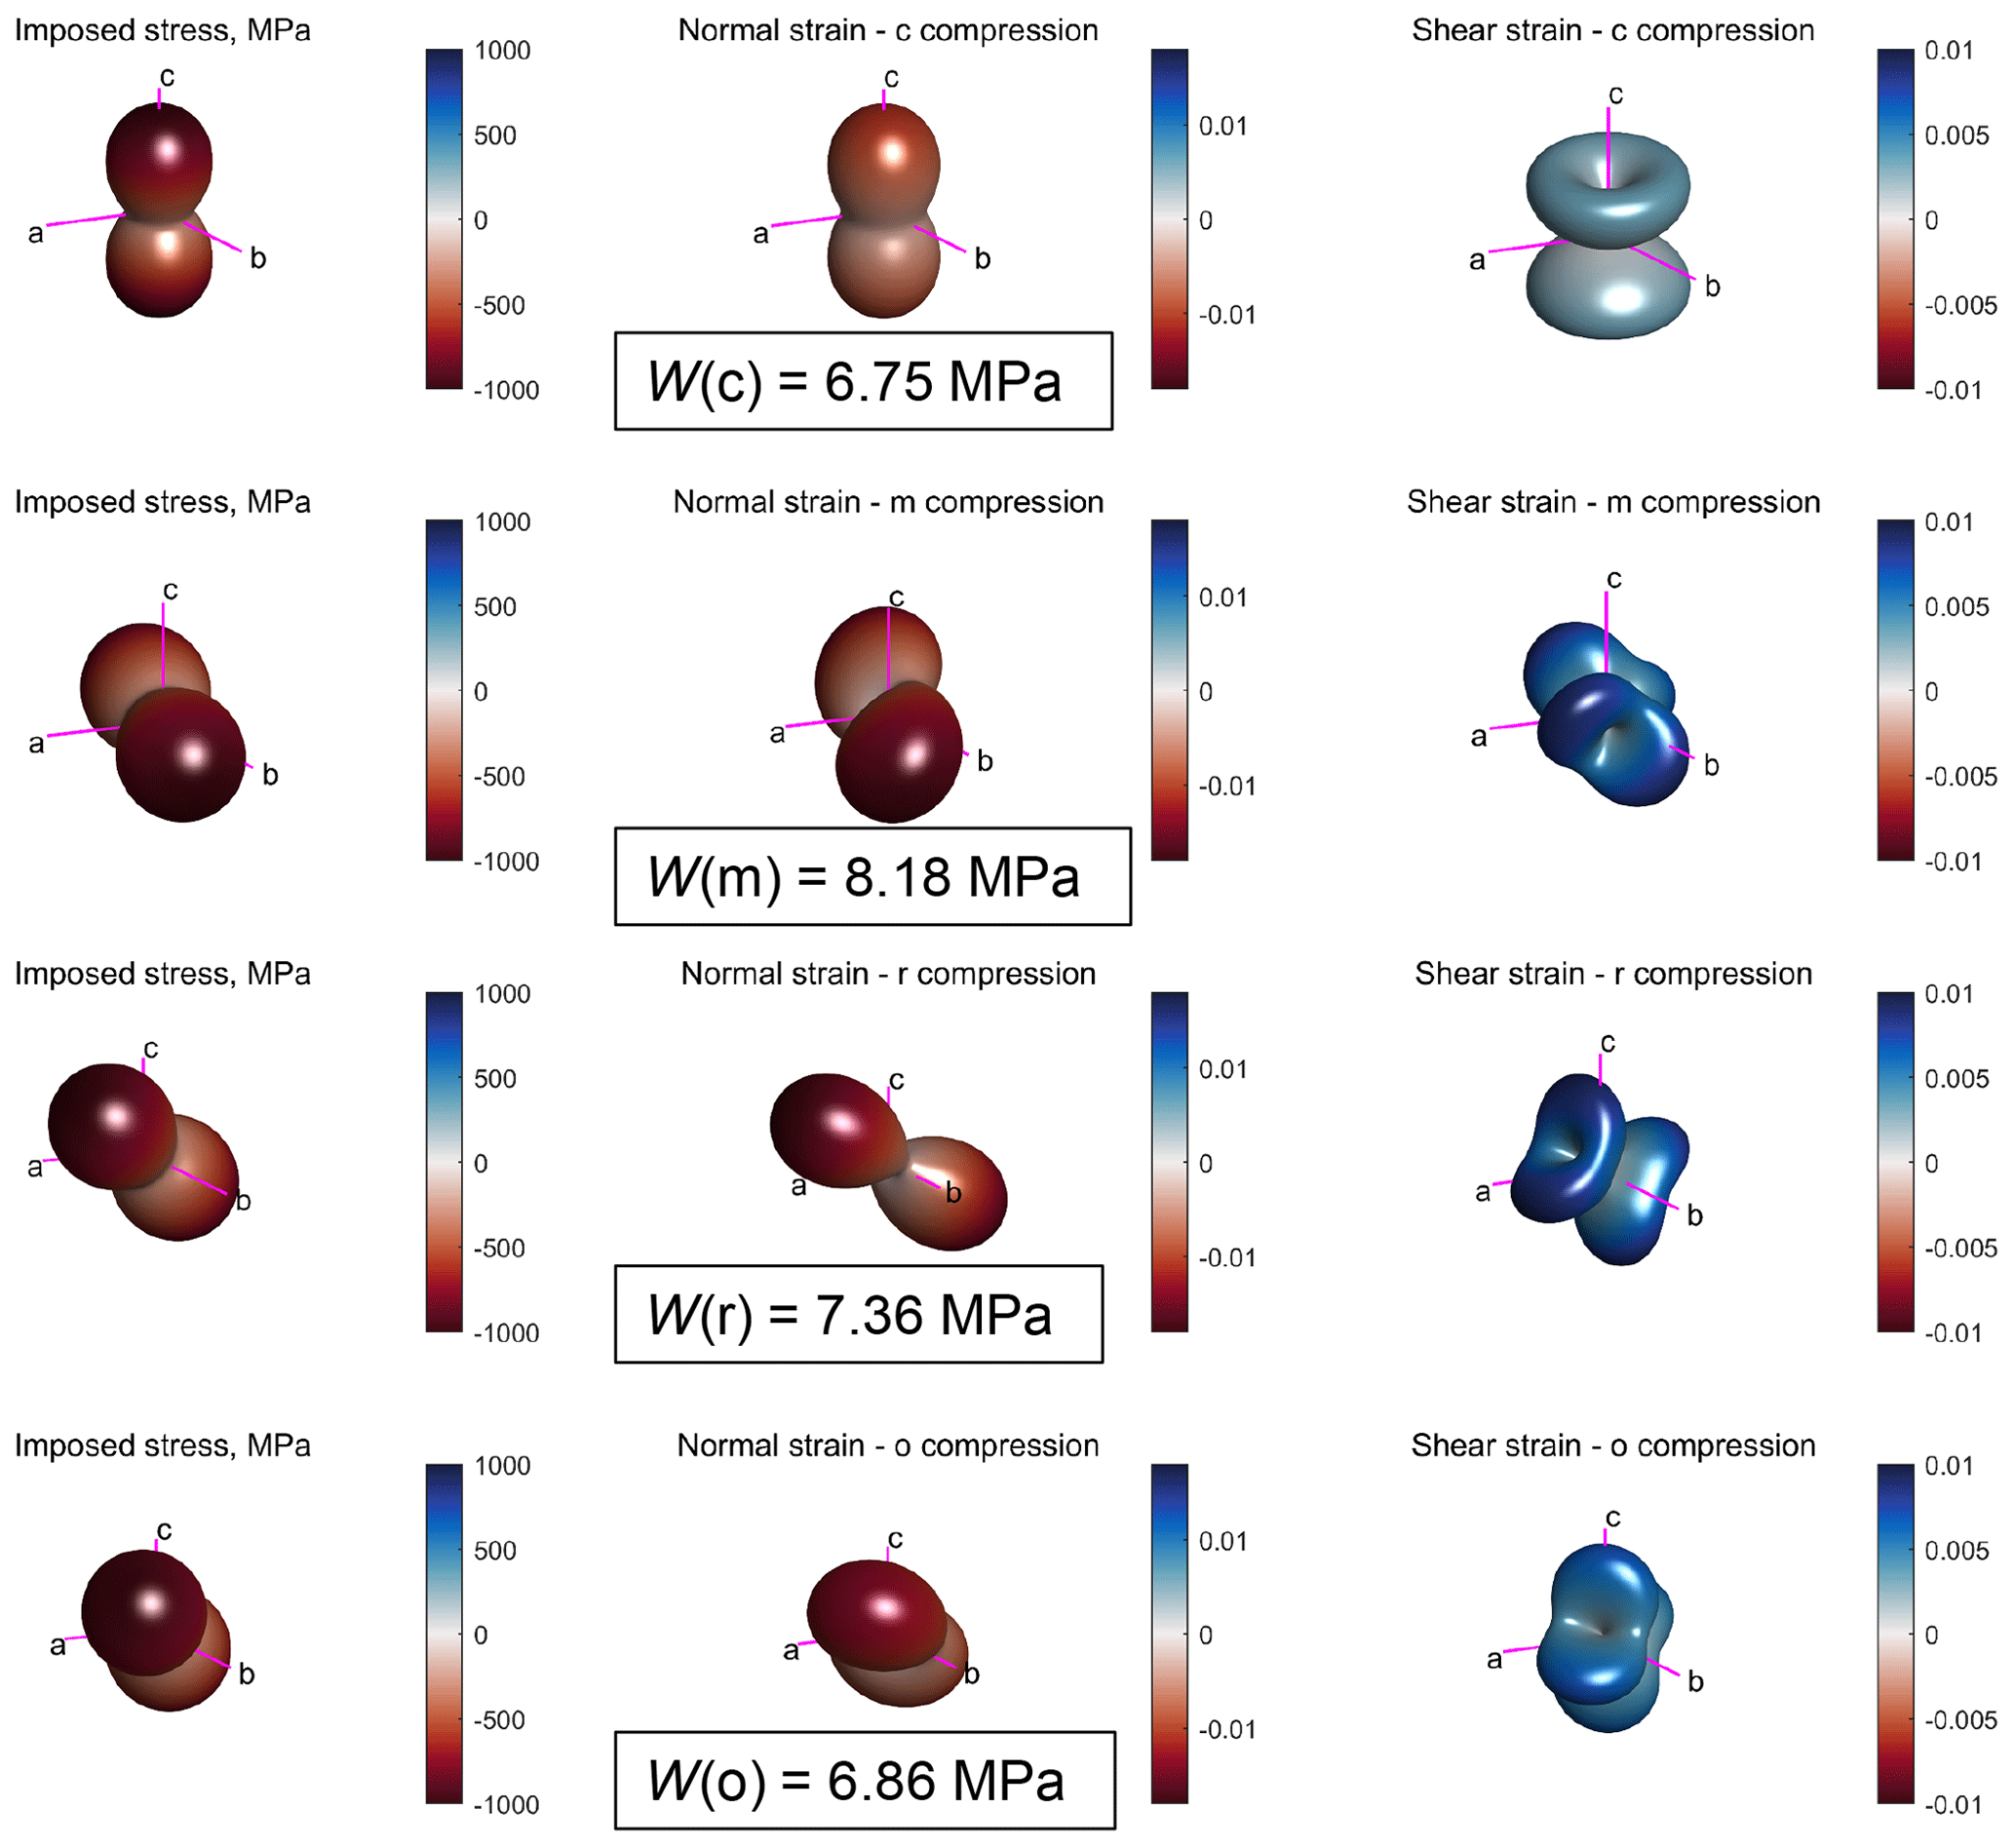
Figure 19Variation in strain (normal and shear) and elastic strain energy for different applied loads in α-quartz at 500 ∘C (Lakshtanov et al., 2007). The same compressive stress ( MPa, MPa) is applied along the c (first row), m (second row), r (third row) and o (fourth row) directions in a single crystal. The Reynolds (second column) and HWY (third column) glyphs show the normal and shear strains, respectively. The elastic strain energy per unit volume (W) is shown for each configuration. Note that .
Visualisation of elastic anisotropy has been used to gain new insights into the effects of intrinsic elastic stiffness on the transformation from zircon to the high-pressure ZrSiO4 polymorph reidite (Timms et al., 2018). The occurrence of lamellar reidite in shocked zircon from hyper-velocity impact structures has been observed to be spatially limited to low-U domains that have not accumulated radiation damage of the lattice from the decay of U to Pb – a process known as metamictisation (Cavosie et al., 2015; Erickson et al., 2017). Using elastic constants measured for variably metamict zircon (Özkan, 1976; Özkan and Jamieson, 1978), Timms et al. (2018) illustrated that the process of metamictisation significantly reduces maxima of E, G and ν in zircon, resulting in a more compliant, isotropic structure. These authors argued that metamict domains in zircon grains are not elastically stiff enough to support sufficiently high stresses and pressures to facilitate the transformation to reidite, limiting reidite lamellae to highly crystalline non-metamict domains during the same shock event. This finding illustrates the dependance of elastic properties on lattice defects and a potential role of intrinsic elastic properties in phase transformations.
5.3 Metamorphic reactions and equilibrium thermodynamics
The role of elastic deformation in the thermodynamics of preferred orientations and reactions at the scale of individual grains has long been controversial (MacDonald, 1960; Brace, 1960; Kamb, 1961, and discussion therein; Paterson, 1973; Wheeler, 2018). Debate has centred on the role, if any, of the elastic strain energy; MacDonald (1960) and Brace (1960) defined the Gibbs free energy of non-hydrostatically stressed minerals in terms of the elastic strain energy, and thereby implicitly defined equilibrium under these conditions. They went on to assert that preferred orientations would develop by the (re)orientation of crystals in a given stress system such that their elastic strain energies were maximised. Wheeler (2018), following Kamb (1961) and Paterson (1973), asserts that there is no definable equilibrium in non-hydrostatically stressed systems. Therefore, it is wrong to equate the Gibbs energy for stressed systems of polycrystals to the elastic strain energy. Moreover, the contribution of the elastic strain energy to the chemical potentials along stressed interfaces, through the Helmholtz free energy term, is second order and therefore negligible (Wheeler, 2018).
5.4 Brittle cracking, decrepitation and dehydration
The magnitude of stresses around fluid-filled pores and cracks developed within single crystalline grains under load can be important for a variety of natural processes. The decrepitation of fluid inclusions occurs when the stresses around the pore exceed the local tensile strength, and the fluid will then drain away. Previous analyses have been rooted in linear elastic fracture mechanics, under an assumption of elastic isotropy. Similarly, in reacting systems the dehydration of hydrous phases can lead to pore fluid overpressures, which cracks the reacting grain and produces dehydration embrittlement (e.g. Raleigh and Paterson, 1965; Jung et al., 2004). Accurate predictions of the stress levels sustainable by intra-crystalline pores and cracks are therefore vital to understanding these fundamental mechanisms. Jaeger and Cook (1969; and repeated by Pollard and Fletcher, 2005) asserted that the elastic anisotropy of rocks, measured as the ratio of Young's moduli , is rarely as high as 2, and therefore the effects of elastic anisotropy are minor to negligible. Davis et al. (2017) used 3D boundary element models to show that Poisson's ratio and void (pore or crack) shape can exert significant control on the local stresses at the void–matrix boundary as a precursor to tensile or shear failure.
We have calculated the circumferential stresses around crack-like voids developed within single elastically anisotropic grains of selected minerals (Figs. 20 and 21). The model configuration follows that of Jaeger and Cook (1969; derived from Green and Taylor, 1939), and it is based on a thin 2D orthotropic plate with a single crack of aspect ratio 5 : 1. The assumption of orthotropy reduces the required elastic constants to five (E1, E2, G, ν21, ν12). We calculated the appropriate values of E, G and ν from polar plots of anisotropy for the [010] crystallographic plane in each mineral using AnisoVis (see Figs. 4d, 5d–f). For an applied uniaxial tensile load (σ0 in Fig. 20) and a plane strain assumption; the resulting anisotropy of circumferential stress (σθθ) at the void–matrix boundary is shown for four different minerals in Fig. 21. Each polar plot shows the σθθ normalised by the applied load σ0 in the [010] plane and for two different configurations of the anisotropy with respect to the load: σ0 parallel to the direction of Emax (red curves) and perpendicular to the direction of Emax (blue curves). For both of the hydrous sheet silicates talc (c1; Mainprice et al., 2008) and lizardite (Reynard et al., 2007), the stresses display significant anisotropy (Fig. 21a and b), with amplifications of 6–7 times the stress predicted by assuming the crystal is isotropic (black curves, calculated with VRH averages of E and ν). These stresses are likely significant for the failure of cracks or narrow fluid-filled pores in dehydrating subducting slabs (Healy et al., 2009; Ji et al., 2018). For the two feldspar examples, albite (Brown et al., 2016) and sanidine (Waeselmann et al., 2016), the amplification of circumferential stress is also significant at 4–5 times the isotropic prediction. Again, these stresses imply that fluid-filled pores in phenocrysts of these phases may fail sooner than currently predicted under the assumption of elastic isotropy. The restriction to 2D may appear limiting in these simple illustrative models, but, pending the development and analysis of fully 3D finite or boundary element models of stresses around voids in elastically anisotropic media, they can provide useful insights into the relative magnitude of local stresses and brittle failure. Moreover, we refute the suggestion from Jaeger and Cook (1969) that as the anisotropy of Young's modulus in rocks is low, the anisotropy of stresses around pores and cracks is therefore unimportant.
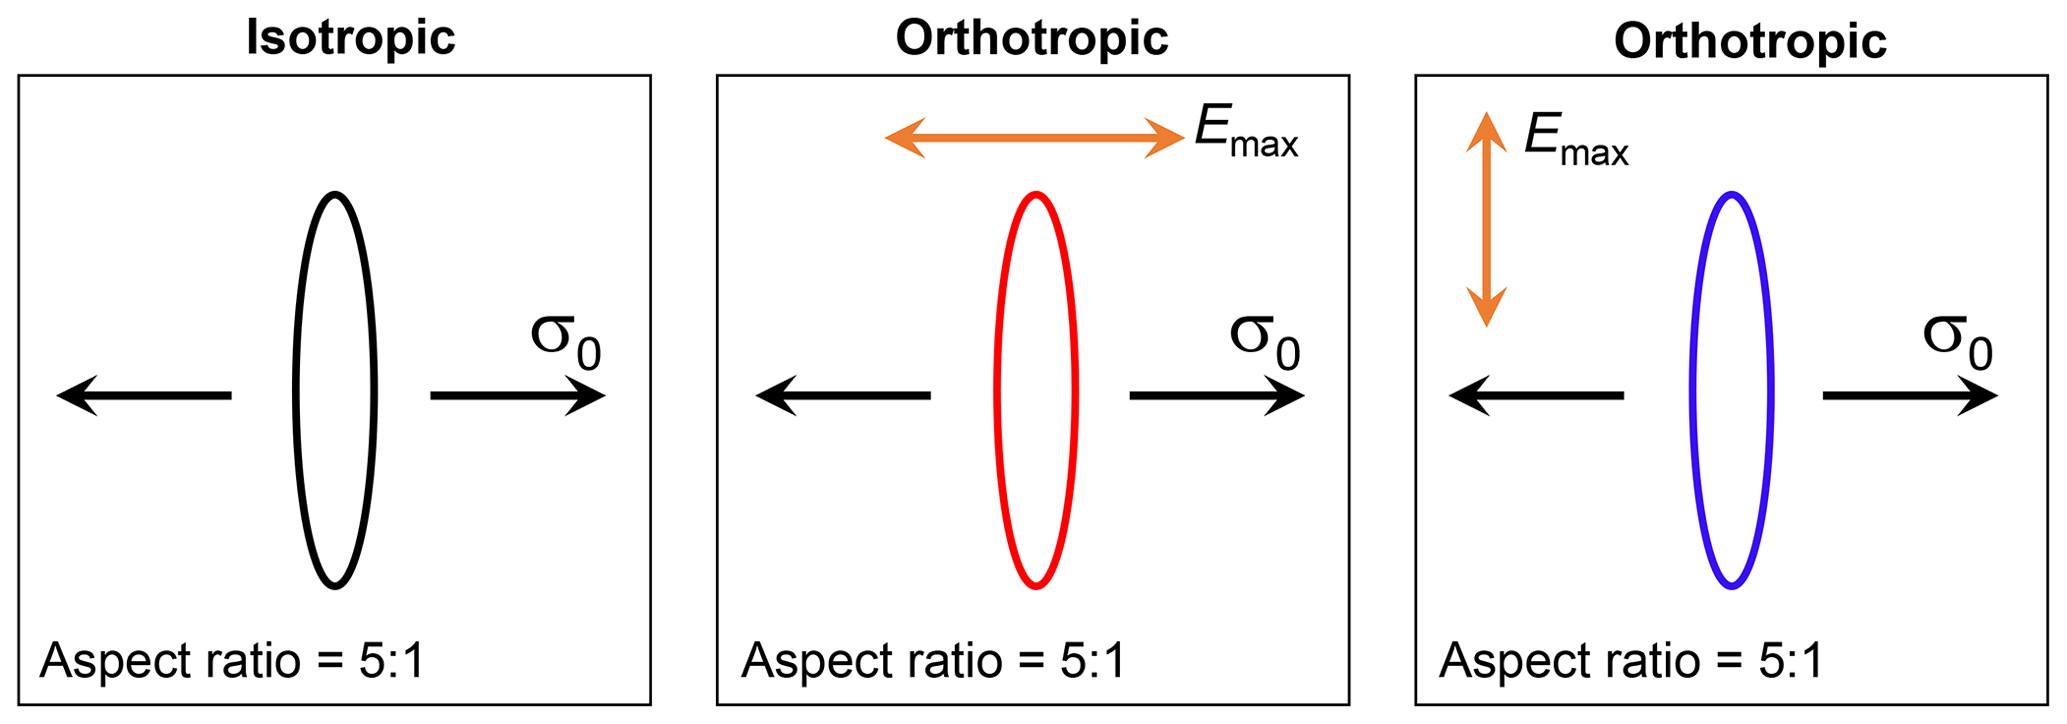
Figure 20Schematic outline for models of narrow cracks in thin 2D orthotropic plates. The crack is subjected to a uniaxial tensile stress, and plane strain is assumed. The colours of the crack outlines correspond to the circumferential stress predictions in Fig. 21.
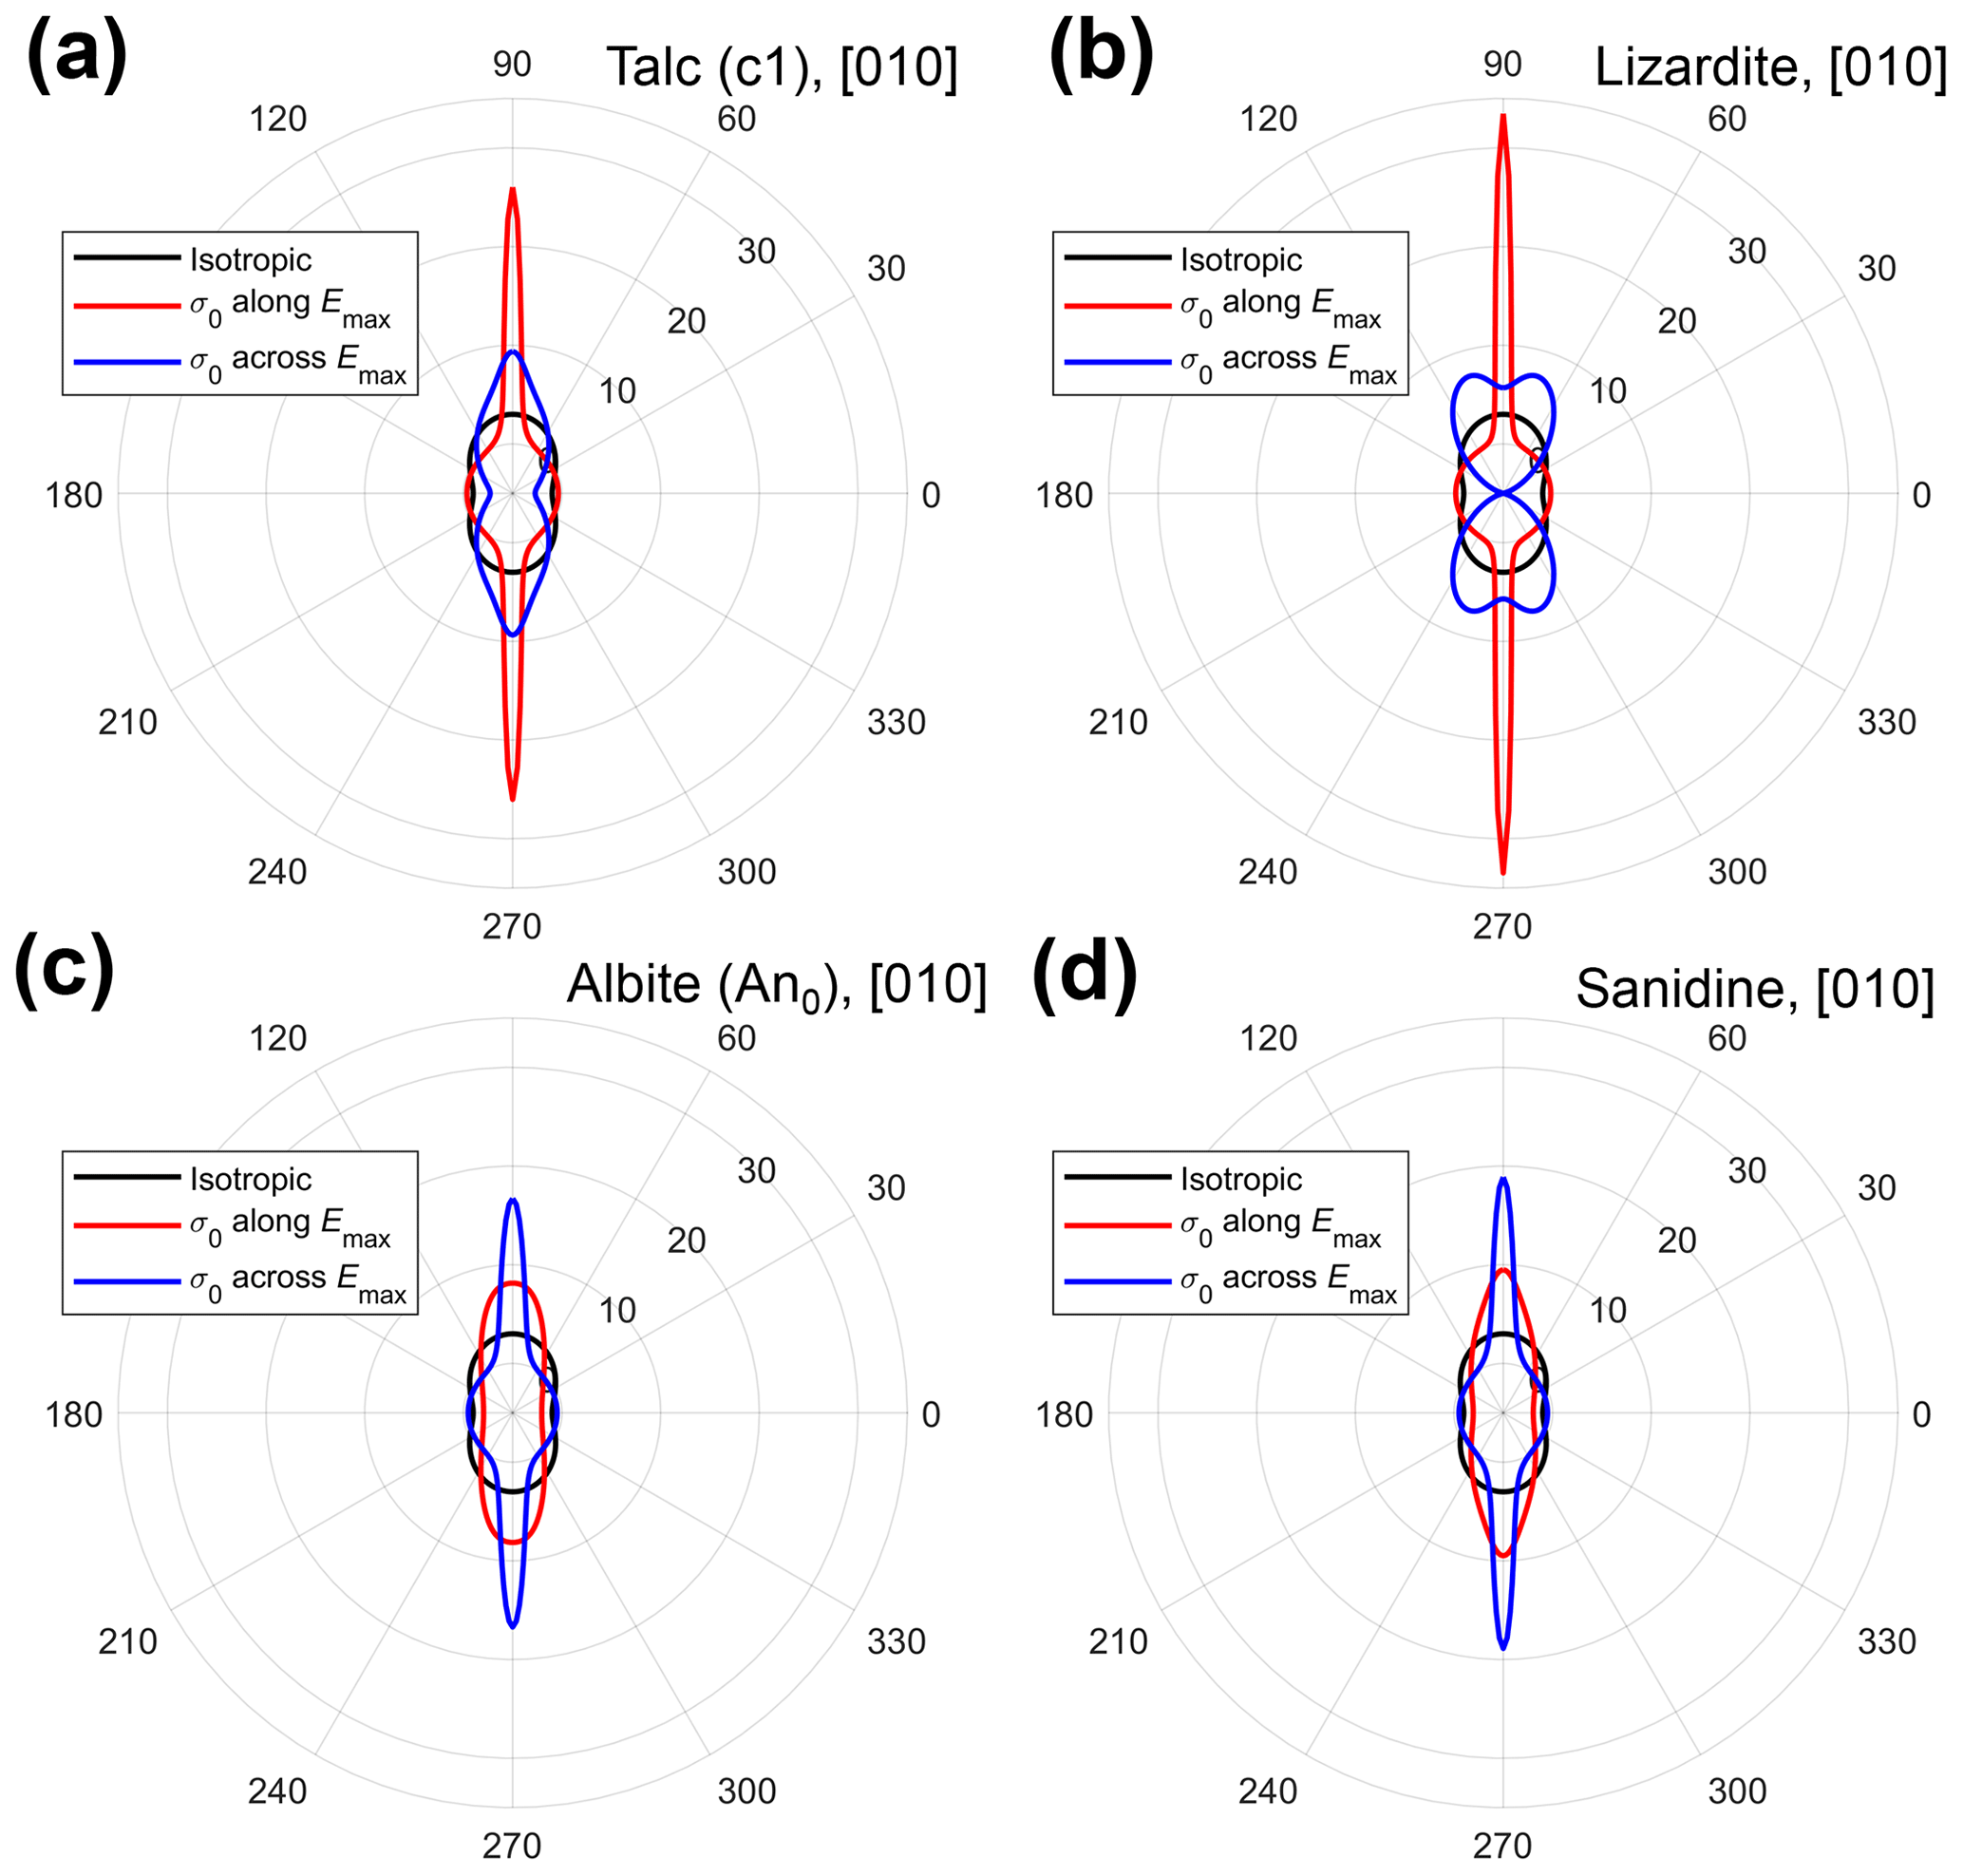
Figure 21Predictions of stresses around cracks in thin 2D orthotropic plates. Curves show the directional variations in the circumferential stress (σθθ) normalised by the applied uniaxial tensile load (σ0). (a) Talc (c1, triclinic), (010) plane. (b) Lizardite, (010) plane. (c) Albite, (010). (d) Sanidine, (010).
We reiterate a key point made by Marmier et al. (2010) in their analysis of chemical compounds: it's only by visualising elastic anisotropies, preferably in 3D, that we can truly perceive them and quantify their directions; this then allows us to relate these elastic properties to the underlying crystal structure and explore the consequences for their behaviour. In developing AnisoVis and using it to quantify the anisotropy of a specific mineral, we have presented multiple alternative visualisations of the directional variation of commonly used elastic properties such as Young's modulus (E), Poisson's ratio (ν), shear modulus (G) and linear compressibility (β). Used in combination, these depictions serve to increase our understanding of the relationships between the anisotropy of elastic properties and the underlying crystal symmetry and structure.
For example, we note previously unreported directions in certain minerals with negative Poisson's ratios and negative linear compressibilities. A potentially important consequence of these findings is that there must also be specific directions along which these properties – Poisson's ratio and linear compressibility – are 0. These directions will form surfaces in 3D which represent the boundary between the following domains: (a) domains of positive and negative Poisson's ratio (both “regular” and areal), along which a uniaxially applied load will produce no lateral strain, and (b) domains of positive and negative linear compressibility, along which an applied hydrostatic load will produce no shortening or stretching. These surfaces and directions in rock-forming minerals may yet lead to new discoveries in the physical behaviour of natural systems and novel applications in materials science or engineering (e.g. Wu et al., 2015).
Considering the results from the database of 246 sets of elastic properties, we observe that
-
significant elastic anisotropy of rock-forming minerals is much more common than previously reported; that is, many minerals – 33 of the 86 we analysed – have auxetic directions and some are areally auxetic;
-
the elastic anisotropy of rock-forming minerals is wider than previously reported, with commonly assumed “natural limits” frequently exceeded; that is, Poisson's ratio for many minerals is either <0 or >0.5.
For specific minerals, we also observe that
-
elastic anisotropy has consequences for intra-crystalline stresses under applied strain (and vice versa); the difference between an assumption of isotropy and using the full elastic anisotropy is often of the order of tens of megapascals (even for small strains) – i.e. likely to be significant for the deformation around voids such as pores and cracks, especially in dehydrating or decrepitating systems;
-
elastic anisotropy is important for mechanical (deformation) twining, especially Dauphiné twinning in quartz but probably in other minerals too;
-
coherent phase transformations, such as the α–β transition in quartz, show a clear correlation with the magnitude of elastic strain energy per unit volume and the stress dependence of the transition temperature.
Further work
We are not currently limited by data; we need to process the elasticity data we have and use it to improve our understanding of earth processes. In theoretical terms, perhaps the biggest advance would come from a solution to the Eshelby problem for an anisotropic inclusion in an anisotropic host, for ellipsoids of general shape and orientation, and for the points inside and outside the inclusion. This problem is non-trivial but would be of direct relevance to the inclusion-host studies estimating pressure histories and for mechanical problems involving voids and cracks in anisotropic crystals, including reacting systems. Numerical modelling studies of the deformation around voids and cracks might usefully incorporate a wider range of values of E and ν. Visualisation of direction-specific elastic properties will be useful for future investigations of the mechanics of twinning, dislocations, and fractures in a wide range of minerals. Earthquake focal mechanisms are known to depend on the elastic anisotropy of the source region (Vavryčuk, 2005), and better understanding of the anisotropies in rock-forming minerals is informing models of fabrics in subducting slabs (Li et al., 2018) and interpretations of microseismicity from commercial hydraulic fracturing operations (Jia et al., 2018). A practical assessment of the contribution of elastic strain energy to metamorphic reactions might involve the systematic mapping of major element chemistry around specific inclusions.
We believe that publicly available and easy-to-use software tools like AnisoVis may be useful in teaching environments to guide understanding of the links between mineral properties (elastic, acoustic, optical) and their underlying symmetry and lattice structure. Following Nye's original text, other properties such as piezoelectric and thermal conductivities could also be added and visualised (Tommasi et al., 2001; Mainprice et al., 2015). Our AnisoVis MATLAB source code and sample elasticity files have been made available in open repositories so that other developers and researchers will optimise and extend the functionality, and “given enough eyeballs, all bugs are shallow” (Raymond, 1999).
The outputs from AnisoVis, and the calculations underlying them, have been benchmarked against previously published examples, chiefly from chemistry and materials science literature. Figures produced by AnisoVis are shown below, with one example per symmetry group, formatted to mimic the plots in the original publication.
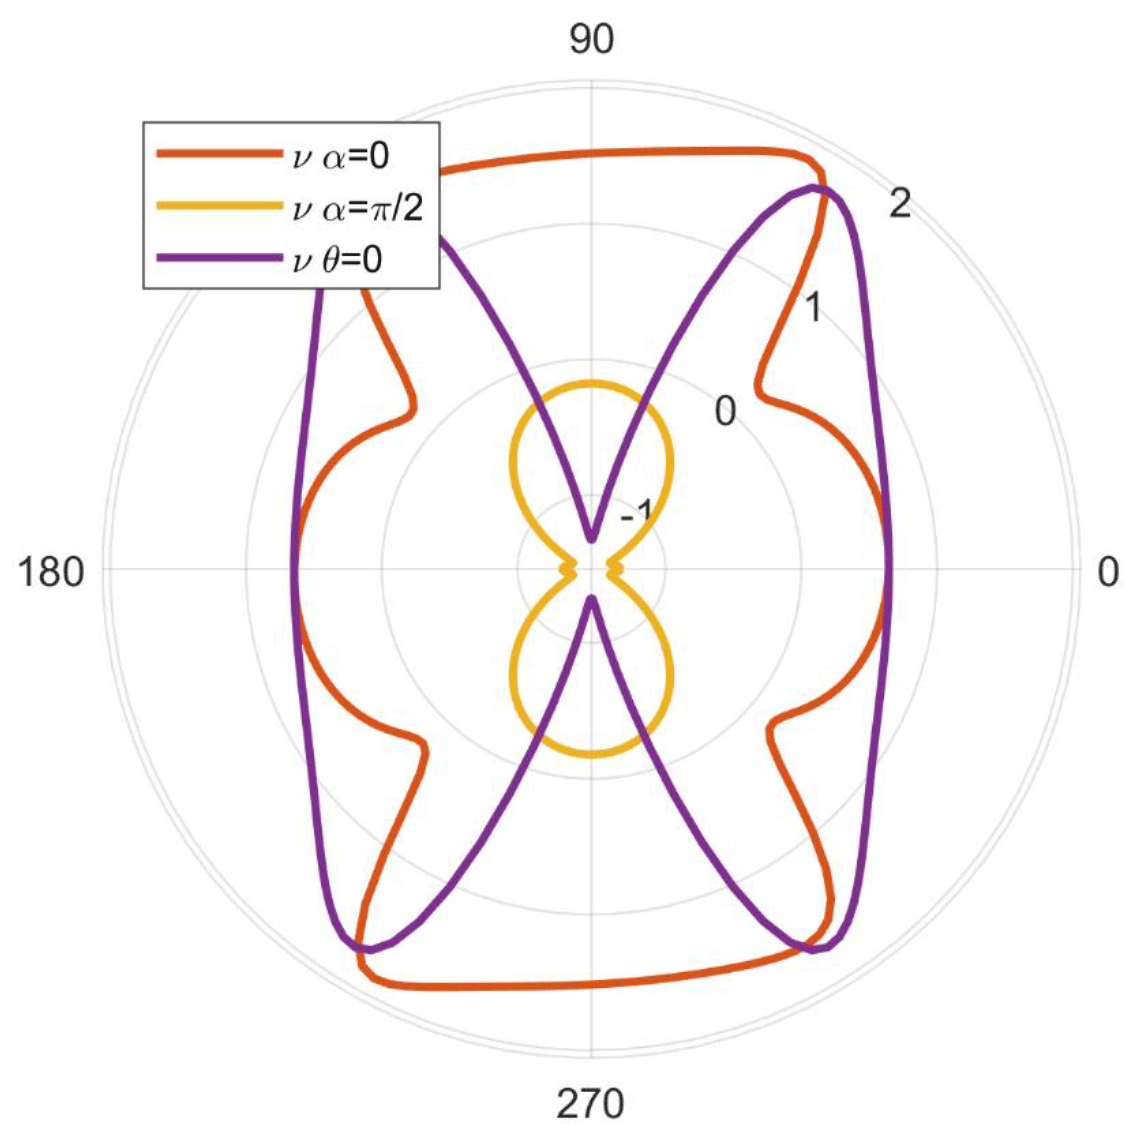
Figure A1Benchmarks to Rovati (2004, their Fig. 4) for monoclinic cesium dihydrogen phosphate. Note the extreme auxeticity (negative Poisson's ratio) shown by this material.

Figure A2Benchmarks to Tan et al. (2015, their Figs. 2, 3 and 4) for orthorhombic ZIF-4, a zeolite. Plots shown for Young's modulus, shear modulus and Poisson's ratio.
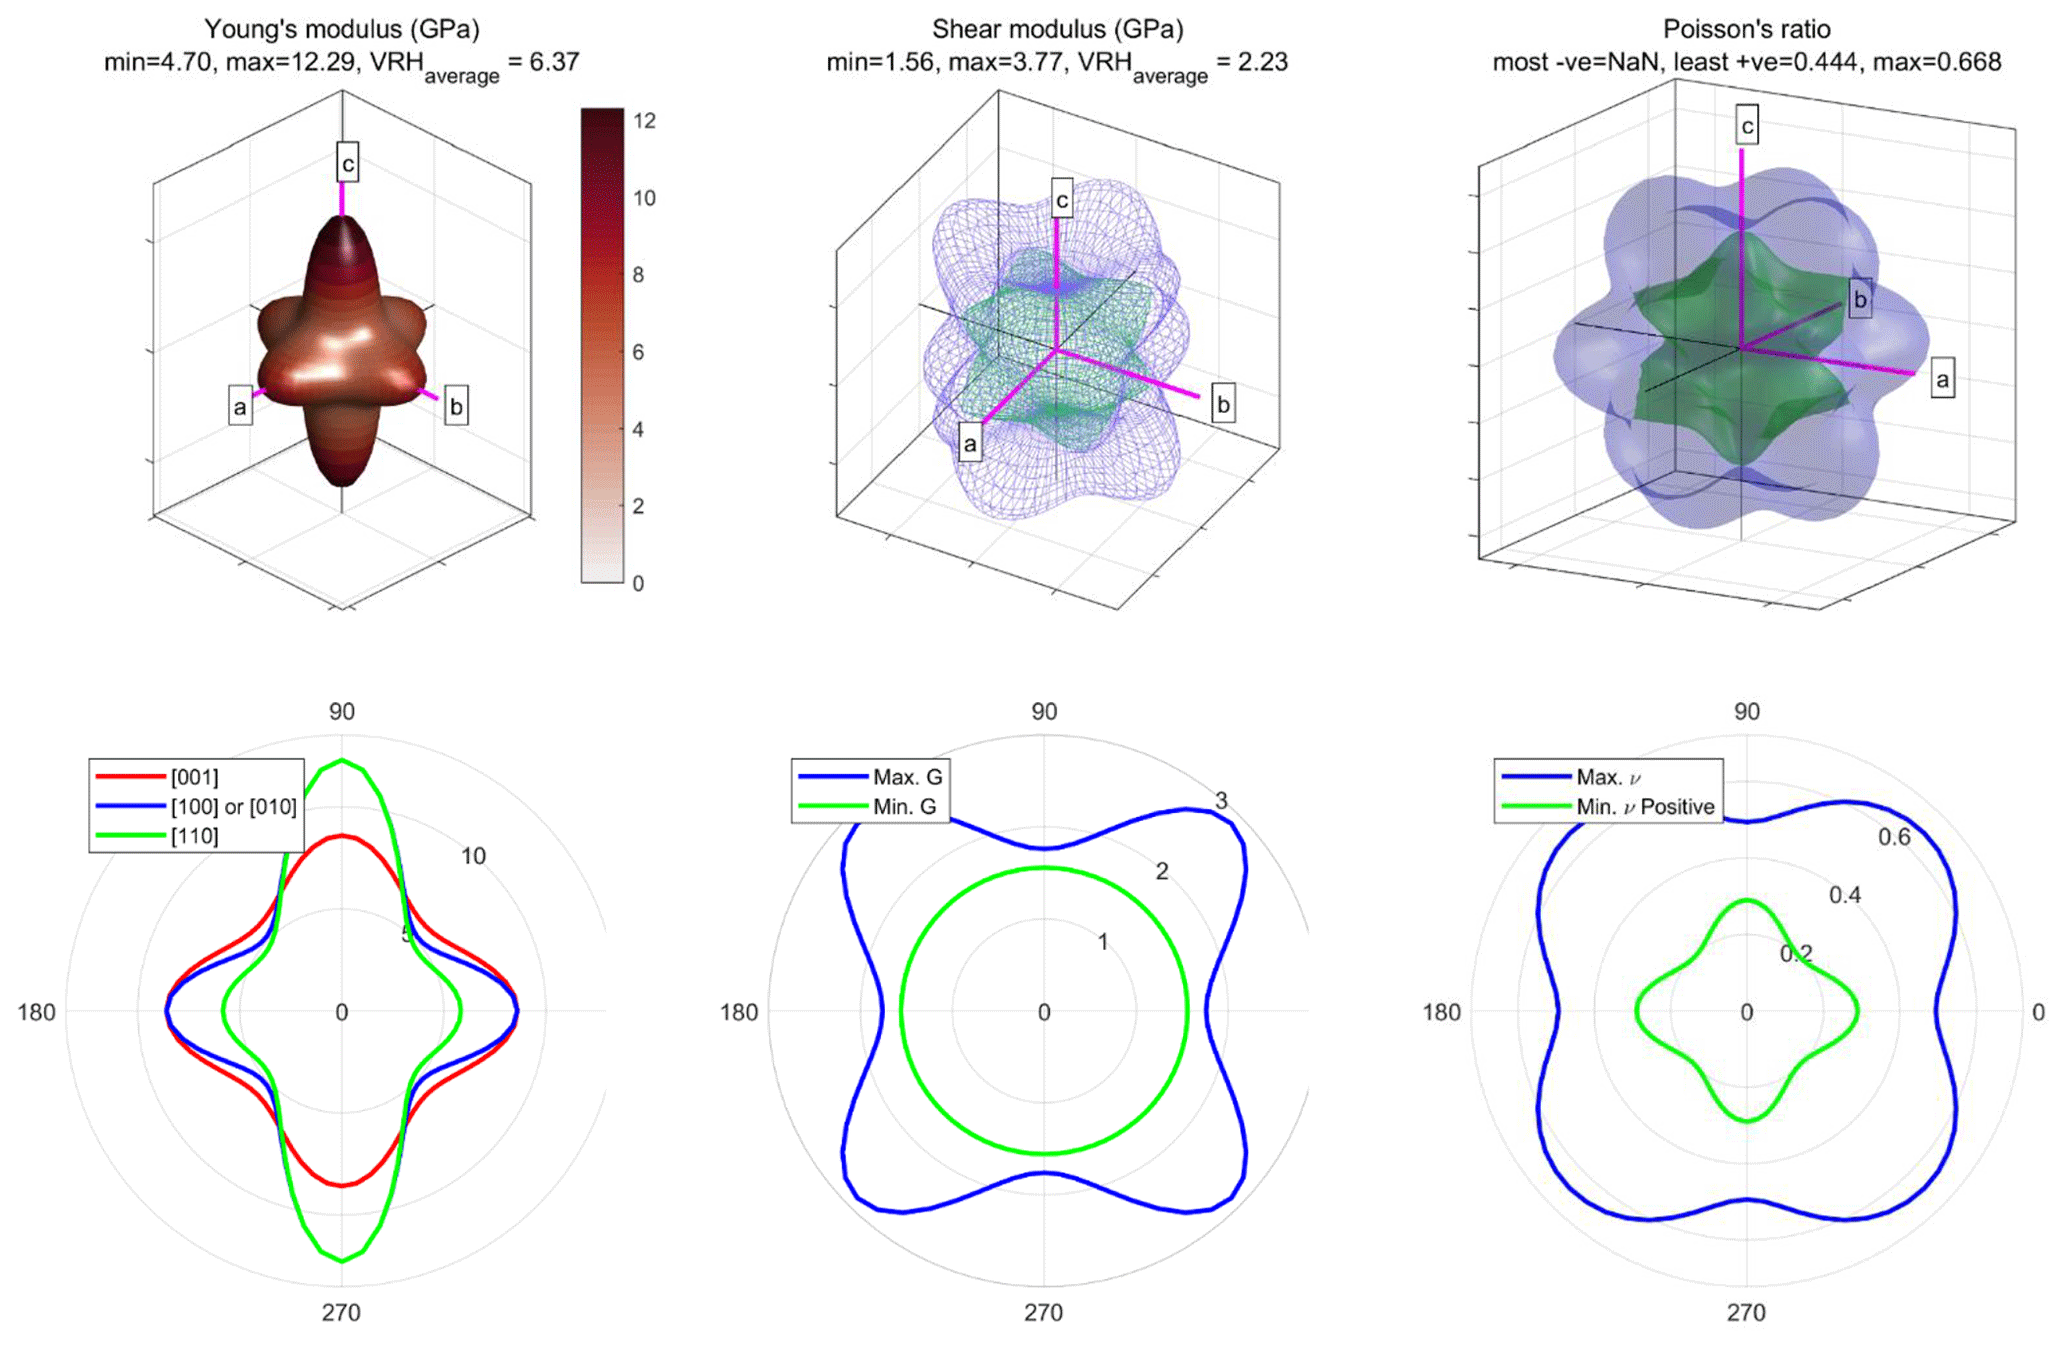
Figure A3Benchmarks to Tan et al. (2015, their Figs. 2, 3 and 4) for tetragonal ZIF-zni, a zeolite. Plots shown for Young's modulus, shear modulus and Poisson's ratio.
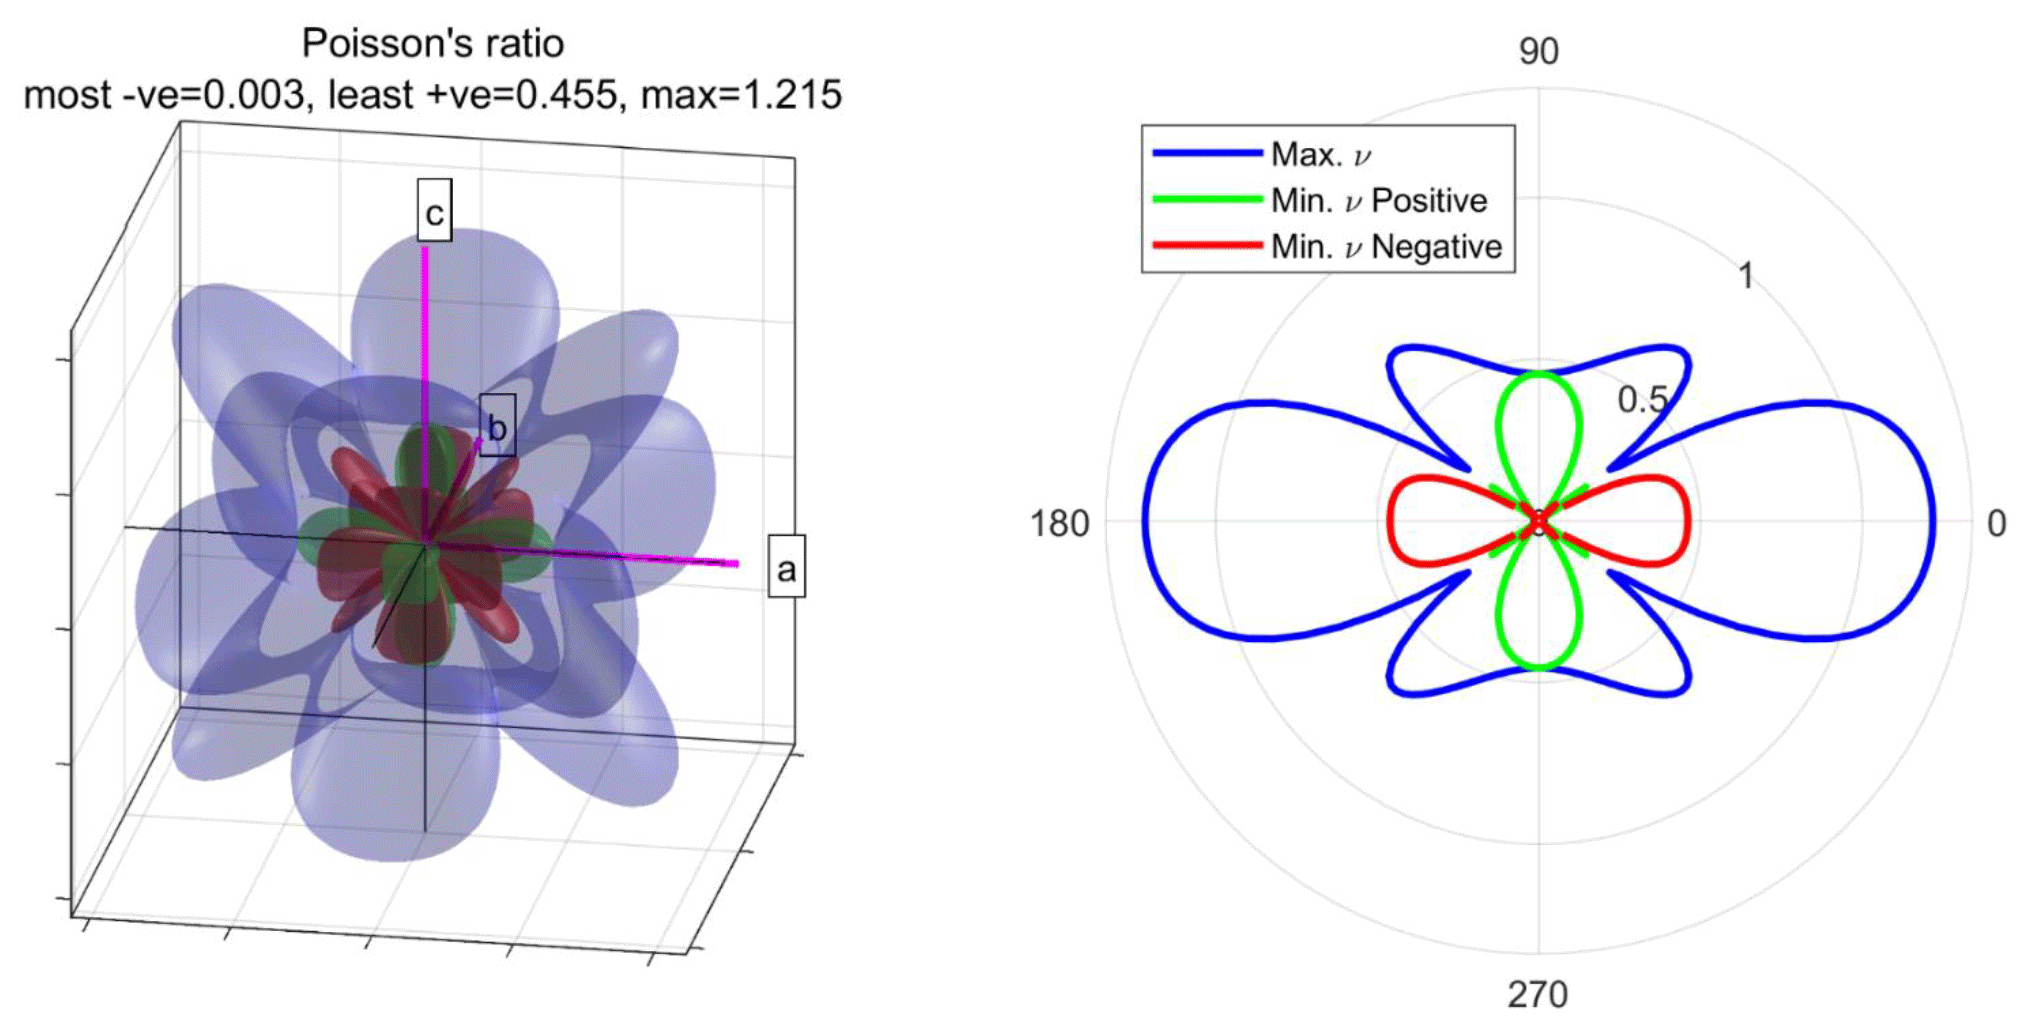
Figure A4Benchmarks to Marmier et al. (2010, their Figs. 5 and 6) for cubic cesium. Note the auxetic nature of Poisson's ratio.
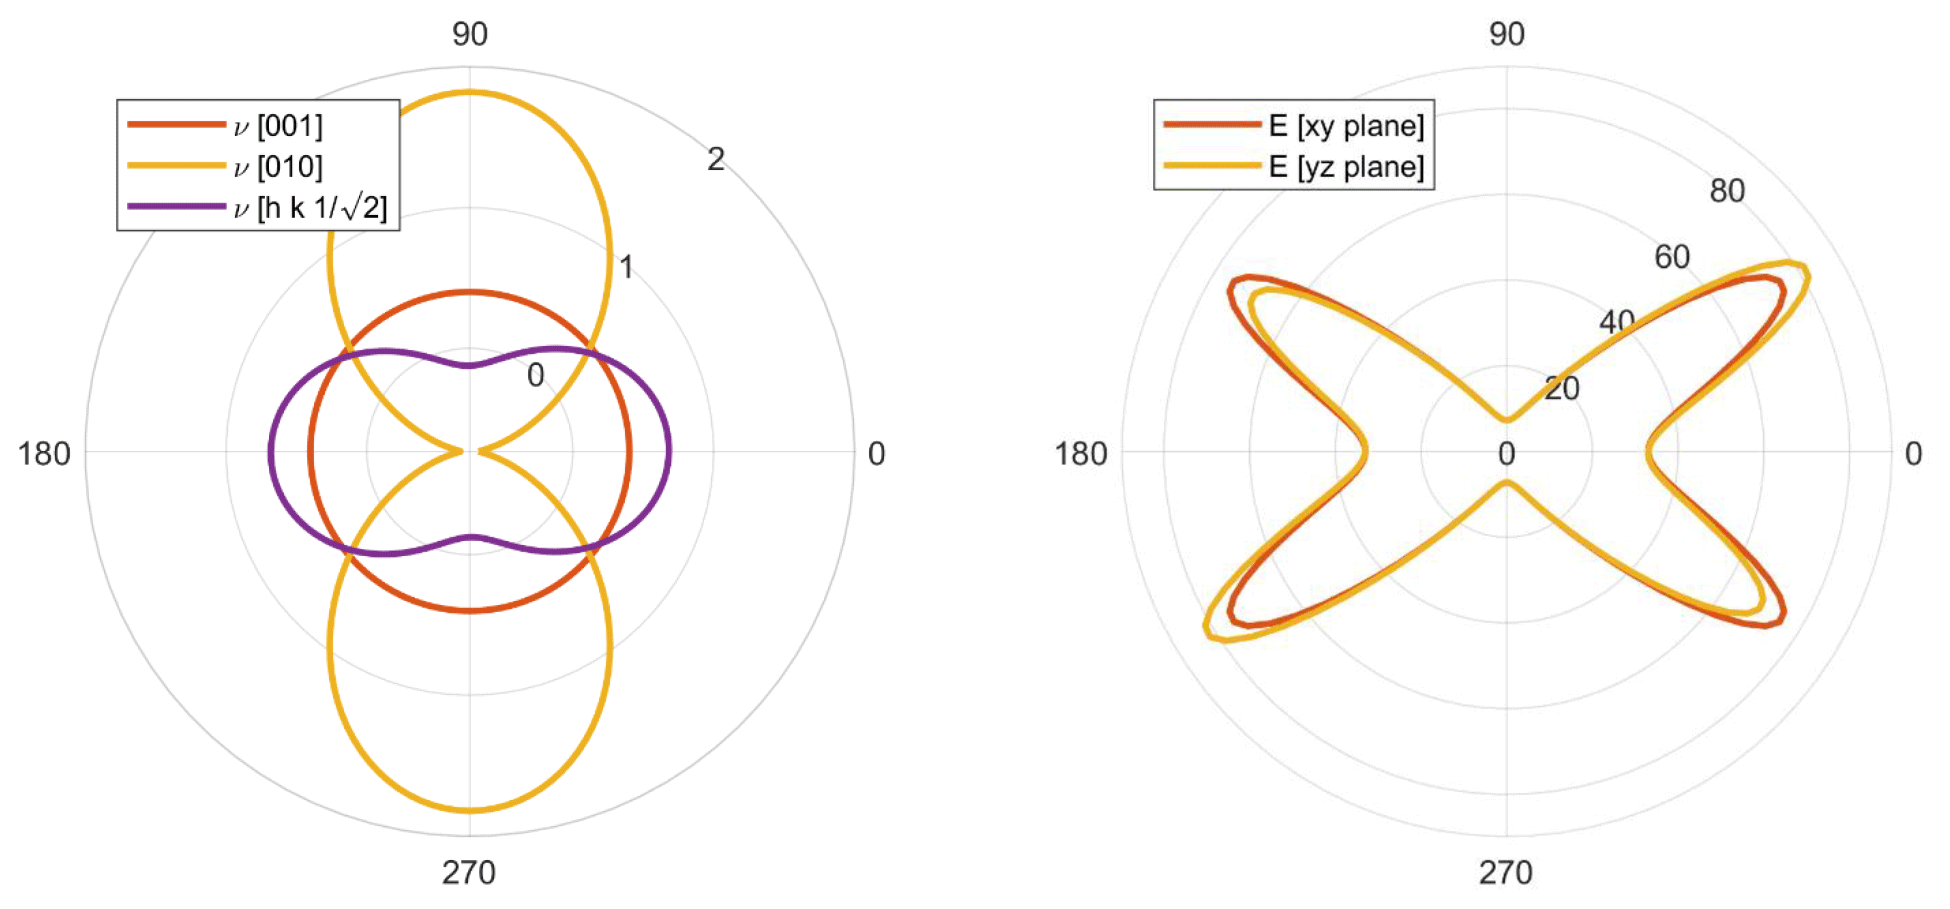
Figure A5Benchmarks to Gunton and Saunders (1972, their Figs. 3 and 6) for trigonal arsenic.
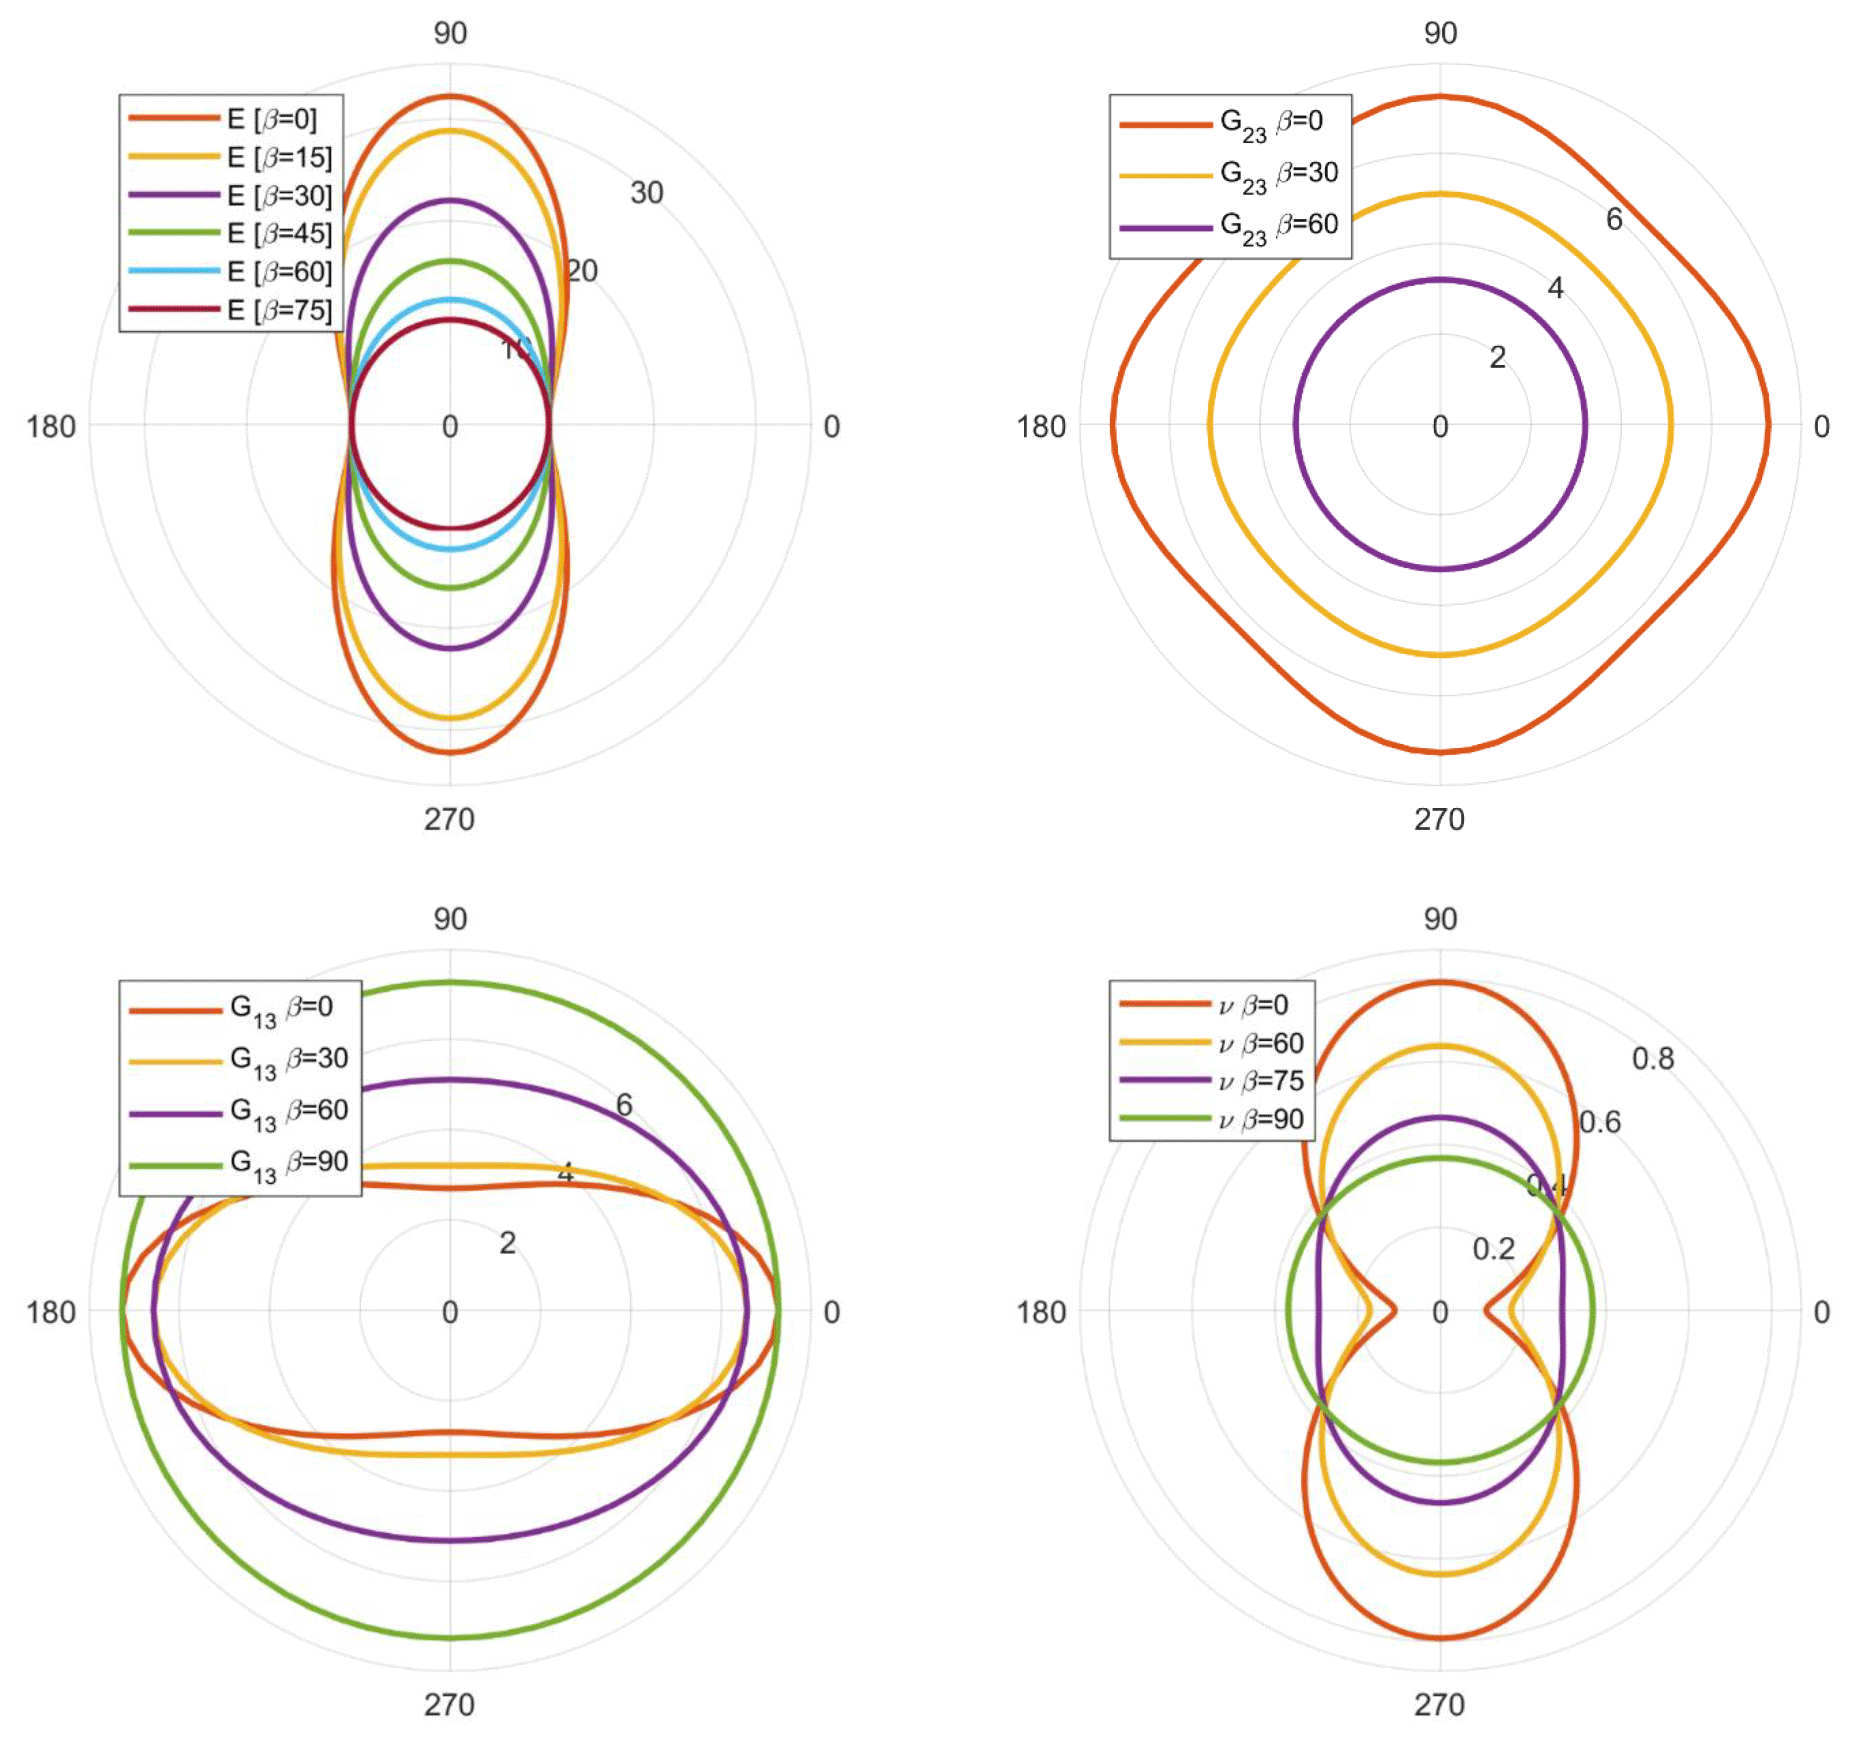
Figure A7Benchmarks to Mainprice et al. (2008, their Fig. 5) for triclinic talc (c1) at 0.0 GPa (a) and 3.9 GPa (b). The lower-pressure example shows auxetic behaviour.
AnisoVis, including MATLAB source code, a basic user guide and data files for mineral elasticity from published sources, is freely available on GitHub (https://github.com/DaveHealy-Aberdeen/AnisoVis, Healy, 2020a) and MathWorks File Exchange (https://uk.mathworks.com/matlabcentral/fileexchange/73177-anisovis, Healy, 2020b).
DH designed the software, and wrote the code to calculate the anisotropic elastic properties. NET contributed most of the section on twinning. MAP contributed to the code, especially the calculation of directional properties in Cartesian and crystallographic reference frames. All authors contributed to the article.
The authors declare that they have no conflict of interest.
David Healy thanks John Wheeler (Liverpool) for discussions and Ross Angel (Padua) for discussions and a reprint. This paper is dedicated to the memory of John Frederick Nye (1923–2019), whose seminal text book, first published in 1957 (Physical Properties of Crystals: Their Representation by Tensors and Matrices; reprinted as Nye, 1985), has had a huge influence on the lead author.
This research has been supported by the NERC (grant no. NE/N003063/1).
This paper was edited by Cristiano Collettini and reviewed by Marco Mercuri and one anonymous referee.
Aleksandrov, K. S., Ryzhova, T. V., and Belikov, B. P.: The elastic properties of pyroxenes, Sov. Phys. Crystallogr., 8, 589–591, 1964.
Almqvist, B. S. and Mainprice, D.: Seismic properties and anisotropy of the continental crust: predictions based on mineral texture and rock microstructure, Rev. Geophys., 55, 367–433, 2017.
Anderson, O. L. and Isaak, D. G.: Elastic constants of mantle minerals at high temperature. Mineral physics and crystallography: a handbook of physical constants, AGU, Washington, D.C., 2, 64–97, 1995.
Angel, R. J., Sochalski-Kolbus, L. M., and Tribaudino, M.: Tilts and tetrahedra: The origin of the anisotropy of feldspars, Am. Mineral., 97, 765–778, 2012.
Angel, R. J., Mazzucchelli, M. L., Alvaro, M., Nimis, P., and Nestola, F.: Geobarometry from host-inclusion systems: the role of elastic relaxation, Am. Mineral., 99, 2146–2149, 2014.
Angel, R. J., Nimis, P., Mazzucchelli, M. L., Alvaro, M., and Nestola, F.: How large are departures from lithostatic pressure? Constraints from host–inclusion elasticity, J. Metamorph. Geol., 33, 801–813, 2015.
Aouni, N. and Wheeler, L.: Auxeticity of Calcite and Aragonite polymorphs of CaCO3 and crystals of similar structure, Phys. Status Solidi B, 245, 2454–2462, 2008.
Babuska, V. and Cara, M.: Seismic anisotropy in the Earth, Vol. 10, Springer Science and Business Media, AGU, Washington, D.C., 1991.
Bass, J. D.: Elastic properties of minerals, melts, and glasses, Handbook of Physical Constants, AGU, Washington, D.C., 45–63, 1995.
Baughman, R. H., Shacklette, J. M., Zakhidov, A. A., and Stafström, S.: Negative Poisson's ratios as a common feature of cubic metals, Nature, 392, p. 362, 1998a.
Baughman, R. H., Stafström, S., Cui, C., and Dantas, S. O.: Materials with negative compressibilities in one or more dimensions, Science, 279, 1522–1524, 1998b.
Bell, R. L. and Cahn, R. W.: The nucleation problem in deformation twinning, Acta Metall., 1, 752–753, 1953.
Bell, R. L. and Cahn, R. W.: The dynamics of twinning and the interrelation of slip and twinning in zinc crystals, P. Roy. Soc. Lond. A Mat., 239, 494–521, 1957.
Bezacier, L., Reynard, B., Bass, J. D., Sanchez-Valle, C., and Van de Moortèle, B.: Elasticity of antigorite, seismic detection of serpentinites, and anisotropy in subduction zones, Earth Planet. Sc. Lett., 289, 198–208, 2010.
Birch, A. F. and Bancroft, D.: The elasticity of certain rocks and massive minerals, Am. J. Sci., 237, 2–6, 1938.
Brace, W. F.: Orientation of anisotropic minerals in a stress field: discussion, Geol. Soc. Am. Mem., 79, 9–20, 1960.
Britton, T. B., Jiang, J., Guo, Y., Vilalta-Clemente, A., Wallis, D., Hansen, L. N., Winkelmann, A., and Wilkinson, A. J.: Tutorial: Crystal orientations and EBSD – Or which way is up?, Mater. Charact., 117, 113–126, 2016.
Brown, J. M., Angel, R. J., and Ross, N. L.: Elasticity of plagioclase feldspars, J. Geophys. Res.-Sol. Ea., 121, 663–675, 2016.
Cavosie, A. J., Erickson, T. M., and Timms, N. E.: Nanoscale records of ancient shock deformation: Reidite (ZrSiO4) in sandstone at the Ordovician Rock Elm impact crater, Geology, 43, 315–318, 2015.
Chen, C. C., Lin, C. C., Liu, L. G., Sinogeikin, S. V., and Bass, J. D.: Elasticity of single-crystal calcite and rhodochrosite by Brillouin spectroscopy, Am. Mineral., 86, 1525–1529, 2001.
Chopin, C.: Coesite and pure pyrope in high-grade blueschists of the Western Alps: a first record and some consequences, Contrib. Mineral. Petr., 86, 107–118, 1984.
Christian, J. W. and Mahajan, S.: Deformation twinning, Prog. Mater. Sci., 39, 1–57, 1995.
Christoffel, E. B.: Uber die Fortpflanzung von Stössen durch elastische feste Körper, Ann. Mat. Pur. Appl., 8, 193–243, 1877.
Clément, M., Padrón-Navarta, J. A., Tommasi, A., and Mainprice, D.: Non-hydrostatic stress field orientation inferred from orthopyroxene (Pbca) to low-clinoenstatite (P21/c) inversion in partially dehydrated serpentinites, Am. Mineral., 103, 993–1001, 2018.
Coe, R. S.: The thermodynamic effect of shear stress on the ortho-clino inversion in enstatite and other coherent phase transitions characterized by a finite simple shear, Contrib. Mineral. Petr., 26, 247–264, 1970.
Coe, R. S. and Muller, W. F.: Crystallographic orientation of clinoenstatite produced by deformation of orthoenstatite, Science, 180, 64–66, 1973.
Coe, R. S. and Paterson, M. S.: The α–β inversion in quartz: a coherent phase transition under nonhydrostatic stress, J. Geophys. Res., 74, 4921–4948, 1969.
Cox, M. A., Cavosie, A. J., Ferrière, L., Timms, N. E., Bland, P. A., Miljković, K., Erickson, T. M., and Hess, B.: Shocked quartz in polymict impact breccia from the Upper Cretaceous Yallalie impact structure in Western Australia, Meteoritics and Planetary Science, 54, 621–637, 2019.
Davis, T., Healy, D., Bubeck, A., and Walker, R.: Stress concentrations around voids in three dimensions: The roots of failure, J. Struct. Geol., 102, 193–207, 2017.
Deer, W., Howie, R., and Zussman, J.: An introduction to the rock-forming minerals, Longman Scientific and Technology, Essex, UK, 1992.
DeVore, G. W.: Elastic compliances of minerals related to crystallographic orientation and elastic strain energy relations in twinned crystals, Lithos, 3, 193–208, 1970.
Erickson, T. M., Cavosie, A. J., Moser, D. E., Barker, I. R., and Radovan, H. A.: Correlating planar microstructures in shocked zircon from the Vredefort Dome at multiple scales: Crystallographic modeling, external and internal imaging, and EBSD structural analysis, Am. Mineral., 98, 53–65, 2013.
Erickson, T. M., Pearce, M. A., Reddy, S. M., Timms, N. E., Cavosie, A. J., Bourdet, J., and Nemchin, A. A.: Microstructural constraints on the mechanisms of the transformation to reidite in naturally shocked zircon, Contrib. Mineral. Petr., 172, 6, https://doi.org/10.1007/s00410-016-1322-0, 2017.
Eshelby, J. D.: The determination of the elastic field of an ellipsoidal inclusion, and related problems, P. R. Soc. Lond. A-Conta., 241, 376–396, 1957.
Eshelby, J. D.: The elastic field outside an ellipsoidal inclusion, P. R. Soc. Lond. A-Conta., 252, 561–569, 1959.
Gaillac, R., Pullumbi, P., and Coudert, F. X.: ELATE: an open-source online application for analysis and visualization of elastic tensors, Journal of Physics: Condensed Matter, 28, p. 275201, 2016.
Gercek, H.: Poisson's ratio values for rocks, Int. J. Rock Mech. Min., 44, 1–13, 2007.
Gillet, P., Ingrin, J., and Chopin, C.: Coesite in subducted continental crust: PT history deduced from an elastic model, Earth Planet. Sc. Lett., 70, 426–436, 1984.
Greaves, G. N., Greer, A. L., Lakes, R. S., and Rouxel, T.: Poisson's ratio and modern materials, Nat. Mater., 10, p. 823, 2011.
Green, A. E. and Taylor, G. I.: Stress systems in aeolotropic plates. I, P. R. Soc. Lond. A-Conta., 173, 162–172, 1939.
Gunton, D. J. and Saunders, G. A.: The Young's modulus and Poisson's ratio of arsenic, antimony and bismuth, J. Mater. Sci., 7, 1061–1068, 1972.
Guo, C. Y. and Wheeler, L.: Extreme Poisson's ratios and related elastic crystal properties, J. Mech. Phys. Solids, 54, 690–707, 2006.
Hashash, Y. M., Yao, J. I. C., and Wotring, D. C.: Glyph and hyperstreamline representation of stress and strain tensors and material constitutive response, Int. J. Numer. Anal. Met., 27, 603–626, 2003.
Healy, D.: AnisoVis, GitHub, available at: https://github.com/DaveHealy-Aberdeen/AnisoVis, last access: 28 February 2020a.
Healy, D.: AnisoVis, MathWorks File Exchange, available at: https://uk.mathworks.com/matlabcentral/fileexchange/73177-anisovis, last access: 28 February 2020b.
Healy, D., Reddy, S. M., Timms, N. E., Gray, E. M., and Brovarone, A. V.: Trench-parallel fast axes of seismic anisotropy due to fluid-filled cracks in subducting slabs, Earth Planet. Sc. Lett., 283, 75–86, 2009.
Hearmon, R. F. S.: The elastic constants of anisotropic materials, Rev. Modern Phys., 18, p. 409, 1946.
Hearmon, R. F. S.: The third-and higher-order elastic constants, Numerical Data and Functional Relationships in Science and Technology, Landolt-Bornstein, Springer-Verlag, Berlin, 11, 1979.
Hearmon, R. F. S.: The elastic constants of crystals and other anisotropic materials, Landolt-Bornstein Tables, Springer-Verlag, Berlin, III/18, p. 1154, 1984.
Hielscher, R. and Schaeben, H.: A novel pole figure inversion method: specification of the MTEX algorithm, J. Appl. Crystallogr., 41, 1024–1037, 2008.
Hill, R.: The elastic behaviour of a crystalline aggregate, P. Phys. Soc. Lond. A, 65, p. 349, 1952.
Jaeger, J. C. and Cook, N. G.: Fundamentals of rock mechanics, Methuen and Co. Ltd., London, 513 pp., 1969.
Ji, S., Li, L., Motra, H. B., Wuttke, F., Sun, S., Michibayashi, K., and Salisbury, M. H.: Poisson's ratio and auxetic properties of natural rocks, J. Geophys. Res.-Sol. Ea., 123, 1161–1185, 2018.
Jia, S. Q., Eaton, D. W., and Wong, R. C.: Stress inversion of shear-tensile focal mechanisms with application to hydraulic fracture monitoring, Geophys. J. Int., 215, 546–563, 2018.
Jung, H., Green Ii, H. W., and Dobrzhinetskaya, L. F.: Intermediate-depth earthquake faulting by dehydration embrittlement with negative volume change, Nature, 428, p. 545, 2004.
Kamb, W. B.: The thermodynamic theory of nonhydrostatically stressed solids, J. Geophys. Res., 66, 259–271, 1961.
Karki, B. B. and Chennamsetty, R.: A visualization system for mineral elasticity, Visual Geosciences, 9, 49–57, 2004.
Kern, H.: Elastic-wave velocity in crustal and mantle rocks at high pressure and temperature: the role of the high-low quartz transition and of dehydration reactions, Phys. Earth Planet. In., 29, 12–23, 1982.
Kibey, S., Liu, J. B., Johnson, D. D., and Sehitoglu, H.: Predicting twinning stress in fcc metals: Linking twin-energy pathways to twin nucleation, Acta Mater., 55, 6843–6851, 2007.
Kratz, A., Auer, C., and Hotz, I.: Tensor Invariants and Glyph Design, in: Visualization and Processing of Tensors and Higher Order Descriptors for Multi-Valued Data, 17–34, Springer, Berlin, Heidelberg, 2014.
Lacazette, A.: Application of linear elastic fracture mechanics to the quantitative evaluation of fluid-inclusion decrepitation, Geology, 18, 782–785, 1990.
Lakes, R.: Foam structures with a negative Poisson's ratio, Science, 235, 1038–1041, 1987.
Lakshtanov, D. L., Sinogeikin, S. V., and Bass, J. D.: High-temperature phase transitions and elasticity of silica polymorphs, Phys. Chem. Miner., 34, 11–22, 2007.
Lethbridge, Z. A., Walton, R. I., Marmier, A. S., Smith, C. W., and Evans, K. E.: Elastic anisotropy and extreme Poisson's ratios in single crystals, Acta Mater., 58, 6444–6451, 2010.
Li, Y.: The anisotropic behavior of Poisson's ratio, Young's modulus, and shear modulus in hexagonal materials, Phys. Status Solidi A, 38, 171–175, 1976.
Li, J., Zheng, Y., Thomsen, L., Lapen, T. J., and Fang, X.: Deep earthquakes in subducting slabs hosted in highly anisotropic rock fabric, Nat. Geoscie., 11, p. 696, 2018.
Lloyd, G. E. and Kendall, J. M.: Petrofabric-derived seismic properties of a mylonitic quartz simple shear zone: implications for seismic reflection profiling, Geol. Soc. Lond. Spec. Publ., 240, 75–94, 2005.
MacDonald, G. J.: Orientation of anisotropic minerals in a stress field, Geol. Soc. Am. Mem., 79, 1–8, 1960.
Mainprice, D.: A FORTRAN program to calculate seismic anisotropy from the lattice preferred orientation of minerals, Comput. Geosci., 16, 385–393, 1990.
Mainprice, D. and Casey, M.: The calculated seismic properties of quartz mylonites with typical fabrics: relationship to kinematics and temperature, Geophys. J. Int., 103, 599–608, 1990.
Mainprice, D., Le Page, Y., Rodgers, J., and Jouanna, P.: Ab initio elastic properties of talc from 0 to 12 GPa: interpretation of seismic velocities at mantle pressures and prediction of auxetic behaviour at low pressure, Earth Planet. Sc. Lett., 274, 327–338, 2008.
Mainprice, D., Hielscher, R., and Schaeben, H.: Calculating anisotropic physical properties from texture data using the MTEX open-source package, Geol. Soc. Lond. Spec. Publ., 360, 175–192, 2011.
Mainprice, D., Bachmann, F., Hielscher, R., Schaeben, H., and Lloyd, G. E.: Calculating anisotropic piezoelectric properties from texture data using the MTEX open source package, Geol. Soc. Lond. Spec. Publ., 409, 223–249, 2015.
Mandell, W.: The determination of the elastic moduli of the piezo-electric crystal Rochelle salt by a statical method,, P. Roy. Soc. Lond. A Mat., 116, 623–636, 1927.
Manghnani, M. H.: Elastic constants of single crystal rutile under pressures to 7.5 kilobars, J.Geophys. Res., 74, 4317–4328, 1969.
Mao, Z., Jiang, F., and Duffy, T. S.: Single-crystal elasticity of zoisite Ca2Al3Si3O12 (OH) by Brillouin scattering, Am. Mineral., 92, 570–576, 2007.
Marmier, A., Lethbridge, Z. A., Walton, R. I., Smith, C. W., Parker, S. C., and Evans, K. E.: ElAM: A computer program for the analysis and representation of anisotropic elastic properties, Comput. Phys. Commun., 181, 2102–2115, 2010.
Mazzucchelli, M. L., Burnley, P., Angel, R. J., Morganti, S., Domeneghetti, M. C., Nestola, F., and Alvaro, M.: Elastic geothermobarometry: Corrections for the geometry of the host-inclusion system, Geology, 46, 231–234, 2018.
Menegon, L., Piazolo, S., and Pennacchioni, G.: The effect of Dauphiné twinning on plastic strain in quartz, Contrib. Mineral. Petr., 161, 635–652, 2011.
Militzer, B., Wenk, H. R., Stackhouse, S., and Stixrude, L.: First-principles calculation of the elastic moduli of sheet silicates and their application to shale anisotropy, Am. Mineral., 96, 125–137, 2011.
Moore, J. G., Schorn, S. A., and Moore, J.: Methods of Classical Mechanics Applied to Turbulence Stresses in a Tip Leakage Vortex, J. Turbomach., 118, 622–629, 1996.
Mørk, M. B. E. and Moen, K.: Compaction microstructures in quartz grains and quartz cement in deeply buried reservoir sandstones using combined petrography and EBSD analysis, J. Struct. Geol., 29, 1843–1854, 2007.
Nye, J. F.: Physical properties of crystals: their representation by tensors and matrices, Oxford University Press, 1985.
Ogi, H., Ohmori, T., Nakamura, N., and Hirao, M.: Elastic, anelastic, and piezoelectric coefficients of α-quartz determined by resonance ultrasound spectroscopy, J. Appl. Phys., 100, 053511, https://doi.org/10.1063/1.2335684, 2006.
Olierook, H. K., Timms, N. E., and Hamilton, P. J.: Mechanisms for permeability modification in the damage zone of a normal fault, northern Perth Basin, Western Australia, Mar. Petrol. Geol., 50, 130–147, 2014.
Özkan, H.: Effect of nuclear radiation on the elastic moduli of zircon, J. Appl. Phys., 47, 4772–4779, 1976.
Özkan, H. and Jamieson, J. C.: Pressure dependence of the elastic constants of non-metamict zircon, Phys. Chem. Miner., 2, 215–224, 1978.
Pabst, W. and Gregorová, E. V. A.: Elastic properties of silica polymorphs – a review, Ceramics-Silikaty, 57, 167–184, 2013.
Pasternak, E. and Dyskin, A. V.: Materials and structures with macroscopic negative Poisson's ratio, Int. J. Eng. Sci., 52, 103–114, 2012.
Paterson, M. S.: Nonhydrostatic thermodynamics and its geologic applications, Rev. Geophys., 11, 355–389, 1973.
Pollard, D. D. and Fletcher, R. C.: Fundamentals of Structural Geology, Cambridge University Press, 512 pp., 2005.
Pond, R. C., Hirth, J. P., Serra, A., and Bacon, D. J.: Atomic displacements accompanying deformation twinning: shears and shuffles, Mater. Res. Lett., 4, 185–190, 2016.
Prawoto, Y.: Seeing auxetic materials from the mechanics point of view: a structural review on the negative Poisson's ratio, Comp. Mater. Sci., 58, 140–153, 2012.
Raleigh, C. B. and Paterson, M. S.: Experimental deformation of serpentinite and its tectonic implications, J. Geophys. Res., 70, 3965–3985, 1965.
Ranganathan, S. I. and Ostoja-Starzewski, M.: Universal elastic anisotropy index, Phys. Rev. Lett., 101, 055504, https://doi.org/10.1103/PhysRevLett.101.055504, 2008.
Raymond, E.: The cathedral and the bazaar, Knowledge, Technology and Policy, 12, 23–49, 1999.
Reynard, B., Hilairet, N., Balan, E., and Lazzeri, M.: Elasticity of serpentines and extensive serpentinization in subduction zones, Geophys. Res. Lett., 34, L13307, https://doi.org/10.1029/2007GL030176, 2007.
Rosenfeld, J. L.: Stress effects around quartz inclusions in almandine and the piezothermometry of coexisting aluminum silicates, Am. J. Sci., 267, 317–351, 1969.
Rosenfeld, J. L. and Chase, A. B.: Pressure and temperature of crystallization from elastic effects around solid inclusions in minerals?, Am. J. Sci., 259, 519–541, 1961.
Rovati, M.: Directions of auxeticity for monoclinic crystals, Scripta Mater., 51, 1087–1091, 2004.
Ryzhova, T. V.: Elastic properties of plagioclases, Akad. SSSR Izv. Ser. Geofiz., 7, 1049–1051, 1964.
Serra, A. and Bacon, D. J.: A new model for {10 1 2} twin growth in hcp metals, Philos. Mag. A, 73, 333–343, 1996.
Sinogeikin, S. V., Schilling, F. R., and Bass, J. D.: Single crystal elasticity of lawsonite, Am. Mineral., 85, 1834–1837, 2000.
Tan, J. C., Civalleri, B., Erba, A., and Albanese, E.: Quantum mechanical predictions to elucidate the anisotropic elastic properties of zeolitic imidazolate frameworks: ZIF-4 vs. ZIF-zni, CrystEngComm, 17, 375–382, 2015.
Tatham, D. J., Lloyd, G. E., Butler, R. W. H., and Casey, M.: Amphibole and lower crustal seismic properties, Earth Planet. Sc. Lett., 267, 118–128, 2008.
Thomas, L. A. and Wooster, W. A.: Piezoerescence – the growth of Dauphiné twinning in quartz under stress, P. Roy. Soc. Lond. A Mat., 208, 43–62, 1951.
Thyng, K. M., Greene, C. A., Hetland, R. D., Zimmerle, H. M., and DiMarco, S. F.: True colors of oceanography: Guidelines for effective and accurate colormap selection, Oceanography, 29, 9–13, 2016.
Timms, N. E., Healy, D., Reyes-Montes, J. M., Collins, D. S., Prior, D. J., and Young, R. P.: Effects of crystallographic anisotropy on fracture development and acoustic emission in quartz, J. Geophys. Res.-Sol. Ea., 115, B07202, https://doi.org/10.1029/2009JB006765, 2010.
Timms, N. E., Reddy, S. M., Healy, D., Nemchin, A. A., Grange, M. L., Pidgeon, R. T., and Hart, R.: Resolution of impact-related microstructures in lunar zircon: A shock deformation mechanism map, Meteoritics and Planetary Science, 47, 120–141, 2012.
Timms, N. E., Erickson, T. M., Pearce, M. A., Cavosie, A. J., Schmieder, M., Tohver, E., Reddy, S. M., Zanetti, M. R., Nemchin, A. A., and Wittmann, A.: A pressure-temperature phase diagram for zircon at extreme conditions, Earth-Sci. Rev., 165, 185–202, 2017.
Timms, N. E., Healy, D., Erickson, T. M., Nemchin, A. A., Pearce, M. A., and Cavosie, A. J.: The role of elastic anisotropy in the development of deformation microstructures in zircon, in: AGU Monograph: Microstructural Geochronology, edited by: Moser, D., Corfu, F., Reddy, S., Darling, J., and Tait, K., Lattice to Atom-Scale Records of Planetary Evolution, AGU-Wiley, Washington, D.C., 183–202, 2018.
Timms, N. E., Pearce, M. A., Erickson, T. M., Cavosie, A. J., Rae, A. S., Wheeler, J., Wittmann, A., Ferrière, L., Poelchau, M. H., Tomioka, N., and Collins, G. S.: New shock microstructures in titanite (CaTiSiO5) from the peak ring of the Chicxulub impact structure, Mexico, Contrib. Mineral. Petr., 174, p. 38, 2019.
Thompson, N. and Millard, D. J.: Twin formation, in cadmium, The London, Edinburgh, and Dublin Philosophical Magazine and Journal of Science, 43, 422–440, 1952.
Ting, T. C. T. and Chen, T.: Poisson's ratio for anisotropic elastic materials can have no bounds, The quarterly journal of mechanics and applied mathematics, 58, 73–82, 2005.
Tommasi, A., Gibert, B., Seipold, U., and Mainprice, D.: Anisotropy of thermal diffusivity in the upper mantle, Nature, 411, p. 783, 2001.
Tomé, C. N. and Lebensohn, R. A.: Manual for Code Visco-Plastic Self-Consistent (VPSC) (Version 7c), Los Alamos National Laboratory, USA, 2009.
Tullis, J.: Quartz: preferred orientation in rocks produced by Dauphiné twinning, Science, 168, 1342–1344, 1970.
Turley, J. and Sines, G.: The anisotropy of Young's modulus, shear modulus and Poisson's ratio in cubic materials, J. Phys. D, 4, p. 264, 1971.
Van der Molen, I. and Van Roermund, H. L. M.: The pressure path of solid inclusions in minerals: the retention of coesite inclusions during uplift, Lithos, 19, 317–324, 1986.
Vavryčuk, V.: Focal mechanisms in anisotropic media, Geophys. J. Int., 161, 334–346, 2005.
Verma, R. K.: Elasticity of some high-density crystals, J. Geophys. Res., 65, 757–766, 1960.
Waeselmann, N., Brown, J. M., Angel, R. J., Ross, N., Zhao, J., and Kaminsky, W.: The elastic tensor of monoclinic alkali feldspars, Am. Mineral., 101, 1228–1231, 2016.
Walker, A. M. and Wookey, J.: MSAT – A new toolkit for the analysis of elastic and seismic anisotropy, Comput. Geosci., 49, 81–90, 2012.
Weidner, D. J. and Carleton, H. R.: Elasticity of coesite, J. Geophys. Res., 82, 1334–1346, 1977.
Wenk, H. R., Janssen, C., Kenkmann, T., and Dresen, G.: Mechanical twinning in quartz: shock experiments, impact, pseudotachylites and fault breccias, Tectonophysics, 510, 69–79, 2011.
Wheeler, J.: Importance of pressure solution and Coble creep in the deformation of polymineralic rocks, J. Geophys. Res.-Sol. Ea., 97, 4579–4586, 1992.
Wheeler, J.: The effects of stress on reactions in the Earth: Sometimes rather mean, usually normal, always important, J. Metamorph. Geol., 36, 439–461, 2018.
Wu, Y., Yi, N., Huang, L., Zhang, T., Fang, S., Chang, H., Li, N., Oh, J., Lee, J. A., Kozlov, M., and Chipara, A. C.: Three-dimensionally bonded spongy graphene material with super compressive elasticity and near-zero Poisson's ratio, Nat. Commun., 6, p. 6141, 2015.
Yeganeh-Haeri, A., Weidner, D. J., and Parise, J. B.: Elasticity of α-cristobalite: a silicon dioxide with a negative Poisson's ratio, Science, 257, 650–652, 1992.
Zhang, Y.: Mechanical and phase equilibria in inclusion–host systems, Earth Planet. Sc. Lett., 157, 209–222, 1998.
Zhou, B. and Greenhalgh, S.: On the computation of elastic wave group velocities for a general anisotropic medium, J. Geophys. Eng., 1, 205–215, 2004.
- Abstract
- Introduction
- Theory and underlying equations
- AnisoVis – program description and visualisation methods
- Results – general trends
- Results – specific examples
- Summary
- Appendix A: Benchmarks to previously published anisotropic elastic properties
- Code and data availability
- Author contributions
- Competing interests
- Acknowledgements
- Financial support
- Review statement
- References