the Creative Commons Attribution 4.0 License.
the Creative Commons Attribution 4.0 License.
 | 20 Aug 2021
Thermal history of the East European Platform margin in Poland based on apatite and zircon low-temperature thermochronology
Stanisław Mazur
Aneta A. Anczkiewicz
István Dunkl
Jan Golonka
The Phanerozoic tectonothermal evolution of the SW slope of the East European Platform (EEP) in Poland is reconstructed by means of thermal maturity, low-temperature thermochronometry, and thermal modelling. We provide a set of new thermochronometric data and integrate stratigraphic and thermal maturity information to constrain the burial and thermal history of sediments. Apatite fission track (AFT) analysis and zircon (ZHe) thermochronology have been carried out on samples of sandstones, bentonites, diabase, and crystalline basement rocks collected from 17 boreholes located in central and NE Poland. They penetrated sedimentary cover of the EEP subdivided from the north to south into the Baltic, Podlasie, and Lublin basins. The average ZHe ages from Proterozoic basement rocks as well as Ordovician to Silurian bentonites and Cambrian to lower Carboniferous sandstones range from 848 ± 81 to 255 ± 22 Ma with a single early Permian age of 288 Ma, corresponding to cooling after a thermal event. The remaining ZHe ages represent partial reset or source ages. The AFT ages of samples are dispersed in the range of 235.8 ± 17.3 Ma (Middle Triassic) to 42.1 ± 11.1 Ma (Paleogene) providing a record of Mesozoic and Cenozoic cooling. The highest frequency of the AFT ages is in the Jurassic and Early Cretaceous prior to Alpine basin inversion. Thermal maturity results are consistent with the SW-ward increase of the Paleozoic and Mesozoic sediments thickness. An important break in a thermal maturity profile exists across the base Permian–Mesozoic unconformity. Thermal modelling showed that significant heating of Ediacaran to Carboniferous sedimentary successions occurred before the Permian with maximum paleotemperatures in the earliest and latest Carboniferous for Baltic–Podlasie and Lublin basins, respectively. The results obtained suggest an important role of early Carboniferous uplift and exhumation at the SW margin of the EEP. The SW slope of the latter was afterward overridden in the Lublin Basin by the Variscan orogenic wedge. Its tectonic loading interrupted Carboniferous uplift and caused resumption of sedimentation in the late Viséan. Consequently, a thermal history of the Lublin Basin is different from that in the Podlasie and Baltic basins but similar to other sections of the Variscan foreland, characterized by maximum burial at the end of Carboniferous. The Mesozoic thermal history was characterized by gradual cooling from peak temperatures at the transition from Triassic to Jurassic due to decreasing heat flow. Burial caused maximum paleotemperatures in the SW part of the study area, where the EEP was covered by an extensive sedimentary pile. However, further NE, due to low temperatures caused by shallow burial, the impact of fluids can be detected by vitrinite reflectance, illite/smectite, and thermochronological data. Our new results emphasize the importance of using multiple low-temperature thermochronometers and thermal modelling in connection with thermal maturity analysis to elucidate the near-surface evolution of platform margins.
- Article
(8997 KB) - Full-text XML
-
Supplement
(1470 KB) - BibTeX
- EndNote


The boundary between the old and thick East European Platform (EEP) and the younger and thinner Paleozoic platform of western Europe is entirely concealed beneath Paleozoic and Mesozoic basins filled with several-kilometre-thick sedimentary successions (Figs. 1–4; Guterch et al., 1986, 1999; Pharaoh, 1999; Grad et al., 2002; Mazur et al., 2015). These basins form an extensive platform cover resting upon the SW slope of the East European Craton, comprising Paleoproterozoic to Mesoproterozoic crystalline basement (Krzemińska et al., 2017). The tectonic and thermal evolution of the area was punctuated by several successive phases of extension and shortening related to the Caledonian and Variscan orogenies, early Permian continental rifting, and Late Cretaceous–Paleocene basin inversion (Krzywiec, 2002, 2009; Mazur et al., 2005). The timing and scale of these processes have not been yet properly constrained due to the scarcity of thermochronological studies performed in the area and incomplete sedimentary record on the SW margin of the EEP that is due to the intervening periods of exhumation (Fig. 2). Although quantitative estimates of exhumation have been previously performed based on thermal maturity of organic matter, they provided divergent results due to the absence of thermochronological data (e.g. Botor et al., 2002; Poprawa et al., 2010). However, in the Scandinavian part of the EEP, the discordant zircon U-Pb ages, onlap of Paleozoic sediments, geomorphological analyses, and low-temperature thermochronology indicate that the Precambrian basement was buried beneath extensive Paleozoic and Mesozoic sedimentary successions (Lidmar-Bergström, 1993, 1996; Hansen, 1995; Larson and Tullborg, 1998; Larson et al., 1999; Hendriks and Redfield, 2005; Söderlund et al., 2005; Green and Duddy, 2006; Larson et al., 2006; Hendriks et al., 2007; Japsen et al., 2016, 2018; Guenthner et al., 2017).
Thermal maturity, low-temperature thermochronometry, and thermal modelling are used in this study to reconstruct the Phanerozoic tectonothermal evolution of the south-western margin of the East European Platform in Poland. We provide a set of new thermochronometric data and integrate stratigraphic and thermal maturity information to constrain the burial and thermal history of sediments. Using apatite fission track (AFT) and zircon (ZHe) analyses, we reconstructed the burial and exhumation paths for different sedimentary successions along the SW margin of the EEP (Fig. 1). The low-temperature thermochronological methods applied are sensitive in the temperature range of ≈ 60–120 ∘C (AFT) and ≈ 130–220 ∘C (ZHe; Reiners, 2005; Guenthner et al., 2013; Guenthner, 2020), allowing us to investigate thermal history of rocks at shallow crustal levels (e.g. Farley, 2002; Armstrong, 2005; Reiners, 2005; Green and Duddy, 2012; Ketcham et al., 2007a; Guenthner et al., 2013; Wauschkuhn et al., 2015; Guenthner, 2020; Milesi et al., 2020). Therefore, these methods provide new constraints on the main subsidence and exhumation episodes in the Phanerozoic history of the region.
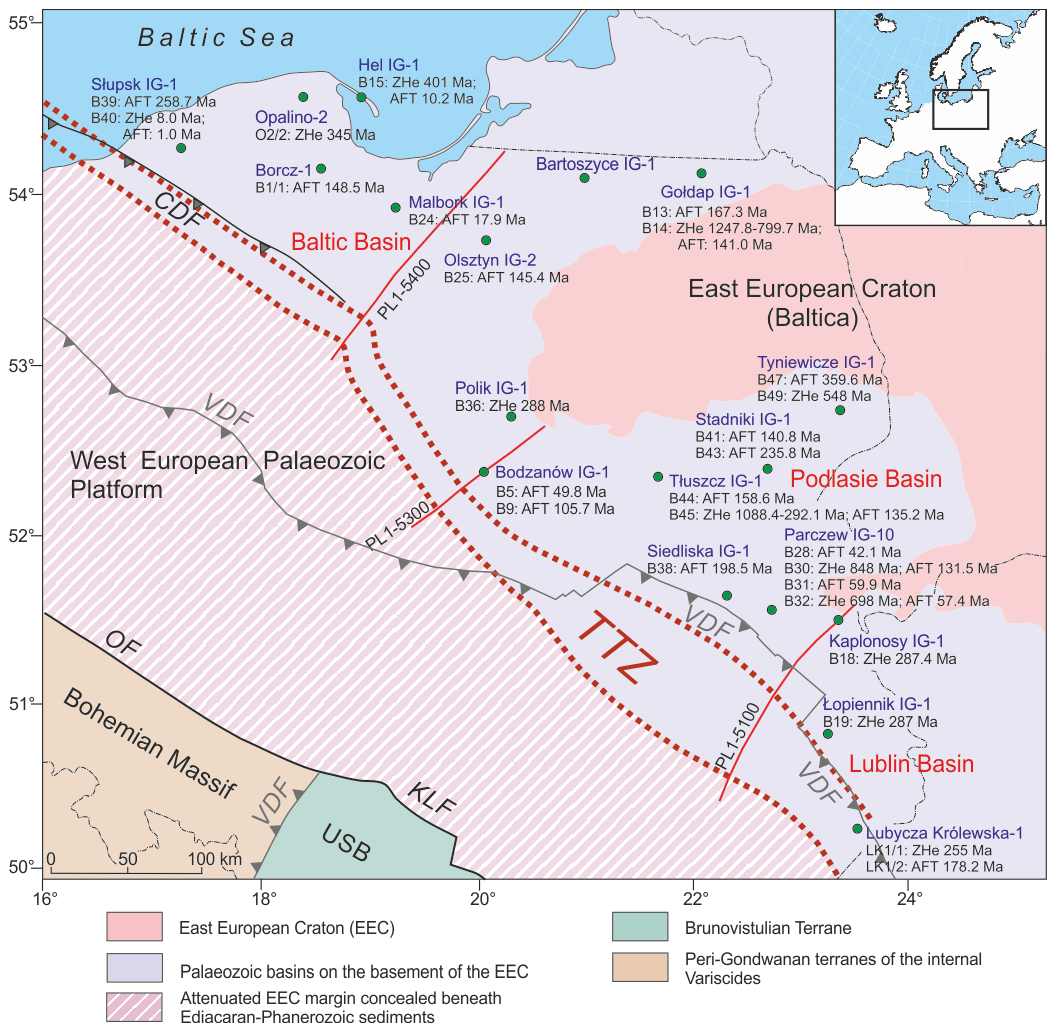
Figure 1Simplified tectonic map of central and north-eastern Poland (modified from Mazur et al., 2018b) showing the location of borehole samples and the AFT and ZHe ages obtained. The locations of PolandSPAN™ seismic profiles (PL1-5100, 5300, 5400) used in Fig. 2 are indicated. CDF – Caledonian Deformation Front; KLF – Kraków–Lubliniec Fault; OF – Odra Fault; VDF – Variscan Deformation Front; TTZ – Teisseyre–Tornquist Zone; USB – Upper Silesia Block.
The SW slope of the EEP is concealed beneath a thick cover of Ediacaran and Phanerozoic sediments overlying the Paleoproterozoic crystalline basement (Figs. 2, 3). The thickness of sediments gradually increases south-westwards with the most rapid depth-to-basement increase within the Teisseyre–Tornquist Zone (TTZ; Mikołajczak et al., 2019). The latter corresponds to a transition between the thick crust of the EEP and the thinner crust underlying the western European Paleozoic platform (Fig. 1) (Grad et al., 2002; Guterch et al., 2010; Mazur et al., 2015, 2018a). The TTZ represents an ≈ 50 km wide zone of the Moho uplift by ≈ 6 km and a coincident basement downward slope in the range of 9–11 km (Mazur et al., 2015; Mikołajczak et al., 2019). The depth to crystalline basement reaches 8–10 km in the NW and central segments of the TTZ and 14–16 km in its SE part (Mikołajczak et al., 2019). The basement is even deeper beneath the Mid-Polish Trough, an elongated Permian–Mesozoic depocentre, that adjoins the TTZ from the SW (Fig. 4; Dadlez et al., 1995). The trough was subsequently inverted into the Mid-Polish Swell during a Late Cretaceous to earliest Paleogene compressional event (Dadlez et al., 1995; Krzywiec, 2002).

Figure 2Vertically exaggerated geological sections across the south-western slope of the East European Platform, showing the structure of sedimentary cover and top of the crystalline basement. Cross sections are built upon the PolandSPAN™ seismic profiles PL1-5400 (a), PL1-5300 (b), and PL1-5100 (c) for the Baltic, Podlasie, and Lublin basins, respectively. Modified from Mazur et al. (2018a) (a) and Mazur et al. (2015) (b, c). Abbreviations of chronostratigraphic units: Pt – Paleoproterozoic; Ed – Ediacaran; Cm – Cambrian; Or – Ordovician; S – Silurian; D – Devonian; C – Carboniferous; P – Permian; T – Triassic; J – Jurassic; Cr – Cretaceous; Cz – Cenozoic.
The sedimentary cover deposited on the SW slope of the EEP comprises Ediacaran–early Paleozoic, Devonian–Carboniferous, and Permian–Mesozoic successions. The lower Paleozoic sequence has the largest thickness and lateral extent (Figs. 2, 3). Its lower portion was developed on a passive continental margin of Baltica, whereas the upper part represents the rapidly subsided Silurian foredeep of the Caledonian orogen (Poprawa et al., 1999; Mazur et al., 2018b; Poprawa, 2019). At the transition from the Silurian to Devonian, the north-western section of this foredeep was included in the distal part of the Caledonian orogenic wedge comprising a NW–SE-oriented belt of deformed Upper Ordovician and Silurian sedimentary rocks onshore and offshore NW Poland (e.g. Dadlez et al., 1994; Mazur et al., 2016). The fold belt is entirely concealed beneath a 1–4 km thick cover of largely undeformed younger sediments and documented based on borehole data. Toward the east, the Caledonian Deformation Front (CDF) delineates a sharp contact between the Caledonian fold belt and the undeformed sediments of the early Paleozoic basin. This basin is almost completely buried beneath younger sediments with Permian–Mesozoic, Carboniferous, and Devonian strata overlying the top of Silurian in NW, central, and SE Poland, respectively (Figs. 2, 3). The top of Silurian represents an unconformity in NW and central Poland. In SE Poland, the unconformity is younger, and it is located at the top of Lochkovian, being formed due to a widespread late Caledonian compressional event (Narkiewicz, 2007; Krzywiec et al., 2017a; Poprawa et al., 2018; Mazur et al., 2018b). The initially uniform early Paleozoic basin was subsequently separated by differential exhumation in three distinct parts: the Baltic, Podlasie, and Lublin basins, straddling the SW slope of the EEP from the NW to SE (Fig. 1).
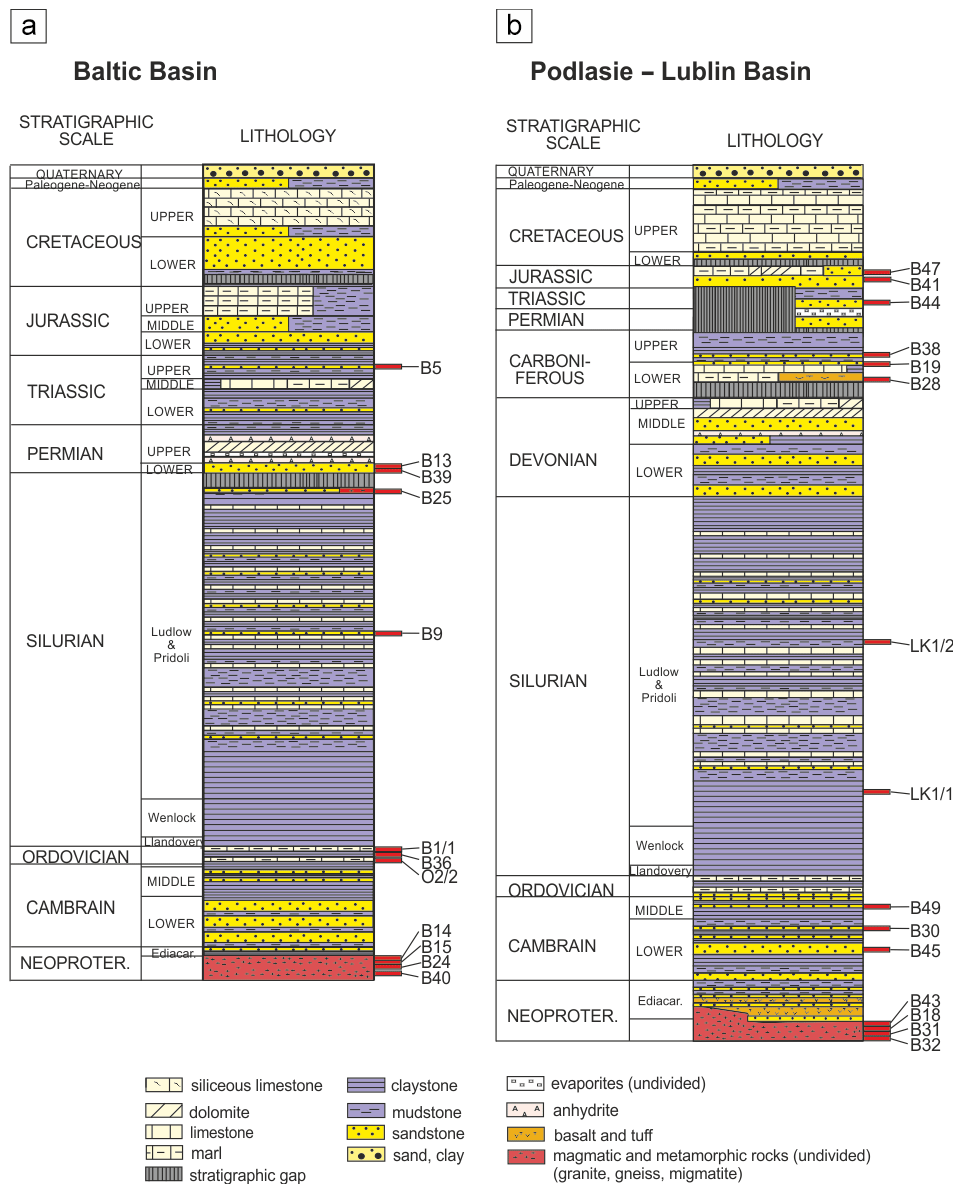
Figure 3Simplified chronostratigraphic logs for the (a) Baltic Basin and (b) Podlasie–Lublin basins the location of samples indicated (based on various sources including Żelichowski, 1987; Modliński et al., 2010; Poprawa, 2010).
The post-Caledonian succession overlying the EEP in SE Poland comprises lower Devonian thick terrestrial clastics and Middle Devonian relatively thin (200 m) and laterally variable alluvial to open-shelf deposits (Narkiewicz, 2007). Localized subsidence during the Late Devonian led to formation of a 2.5 km thick sedimentary succession filling the NW–SE-oriented Lublin Trough (Narkiewicz, 2007). This extensional event was terminated by significant uplift during the “Bretonnian” tectonic phase at the transition from the Devonian to Carboniferous that caused widespread exhumation in the range of 1000–2000 m (Poprawa, 2006; Krzywiec et al., 2017a). The lack of Devonian strata over the remaining part of the SW slope of the EEP in Poland is usually attributed to post-Variscan exhumation in the latest Carboniferous and early Permian (Żelichowski, 1987; Narkiewicz, 2007). Based on facies patterns, it was accordingly postulated that Devonian and early Carboniferous successions had originally extended over considerable stretches of the EEP slope (Żelichowski, 1987). However, the presence of upper Carboniferous sediments directly overlying Silurian strata in central Poland points out a role of early Carboniferous uplift and exhumation across the entire SW slope of the EEP. The top of Carboniferous represents a major unconformity throughout the study area. Its origin is usually attributed to final stages of Variscan shortening (Mazur et al., 2010), although the unconformity is also developed over the areas of the EEP that are virtually unaffected by Variscan deformation.
During the Permian and Mesozoic, the study area was located in the marginal part of the Polish Basin that onlapped the SW slope of the EEP (Kutek and Głazek, 1972; Pożaryski and Brochwicz-Lewiński, 1978; Dadlez et al., 1995; Kutek, 2001). Up to a few kilometres of sediments were deposited at that time, and the thickness is rapidly decreasing towards the interior of the EEP (Świdrowska et al., 2008). The bulk of the Mesozoic infill in a distal, eastern part of the Polish Basin located beyond the TTZ consists of the Oxfordian–Kimmeridgian dominantly carbonate succession covered by the Albian transgressive clastics and thick Cenomanian–Maastrichtian pelagic carbonates (Fig. 3; Krzywiec, 2002, 2009). In contrast to the Mid-Polish Trough, where significant Late Cretaceous basin inversion took place (Botor et al., 2018; Łuszczak et al., 2020), the part of the Polish Basin extending over the TTZ and adjacent area of the EEP experienced only mild to little inversion (Krzywiec, 2009; Krzywiec et al., 2017a, b). This is probably related to the rather shallow depth to the rigid Precambrian basement. Cenozoic strata, forming the uppermost part of the sedimentary section, are composed of varied, poorly consolidated deposits attaining a maximum thickness of a few hundred metres.
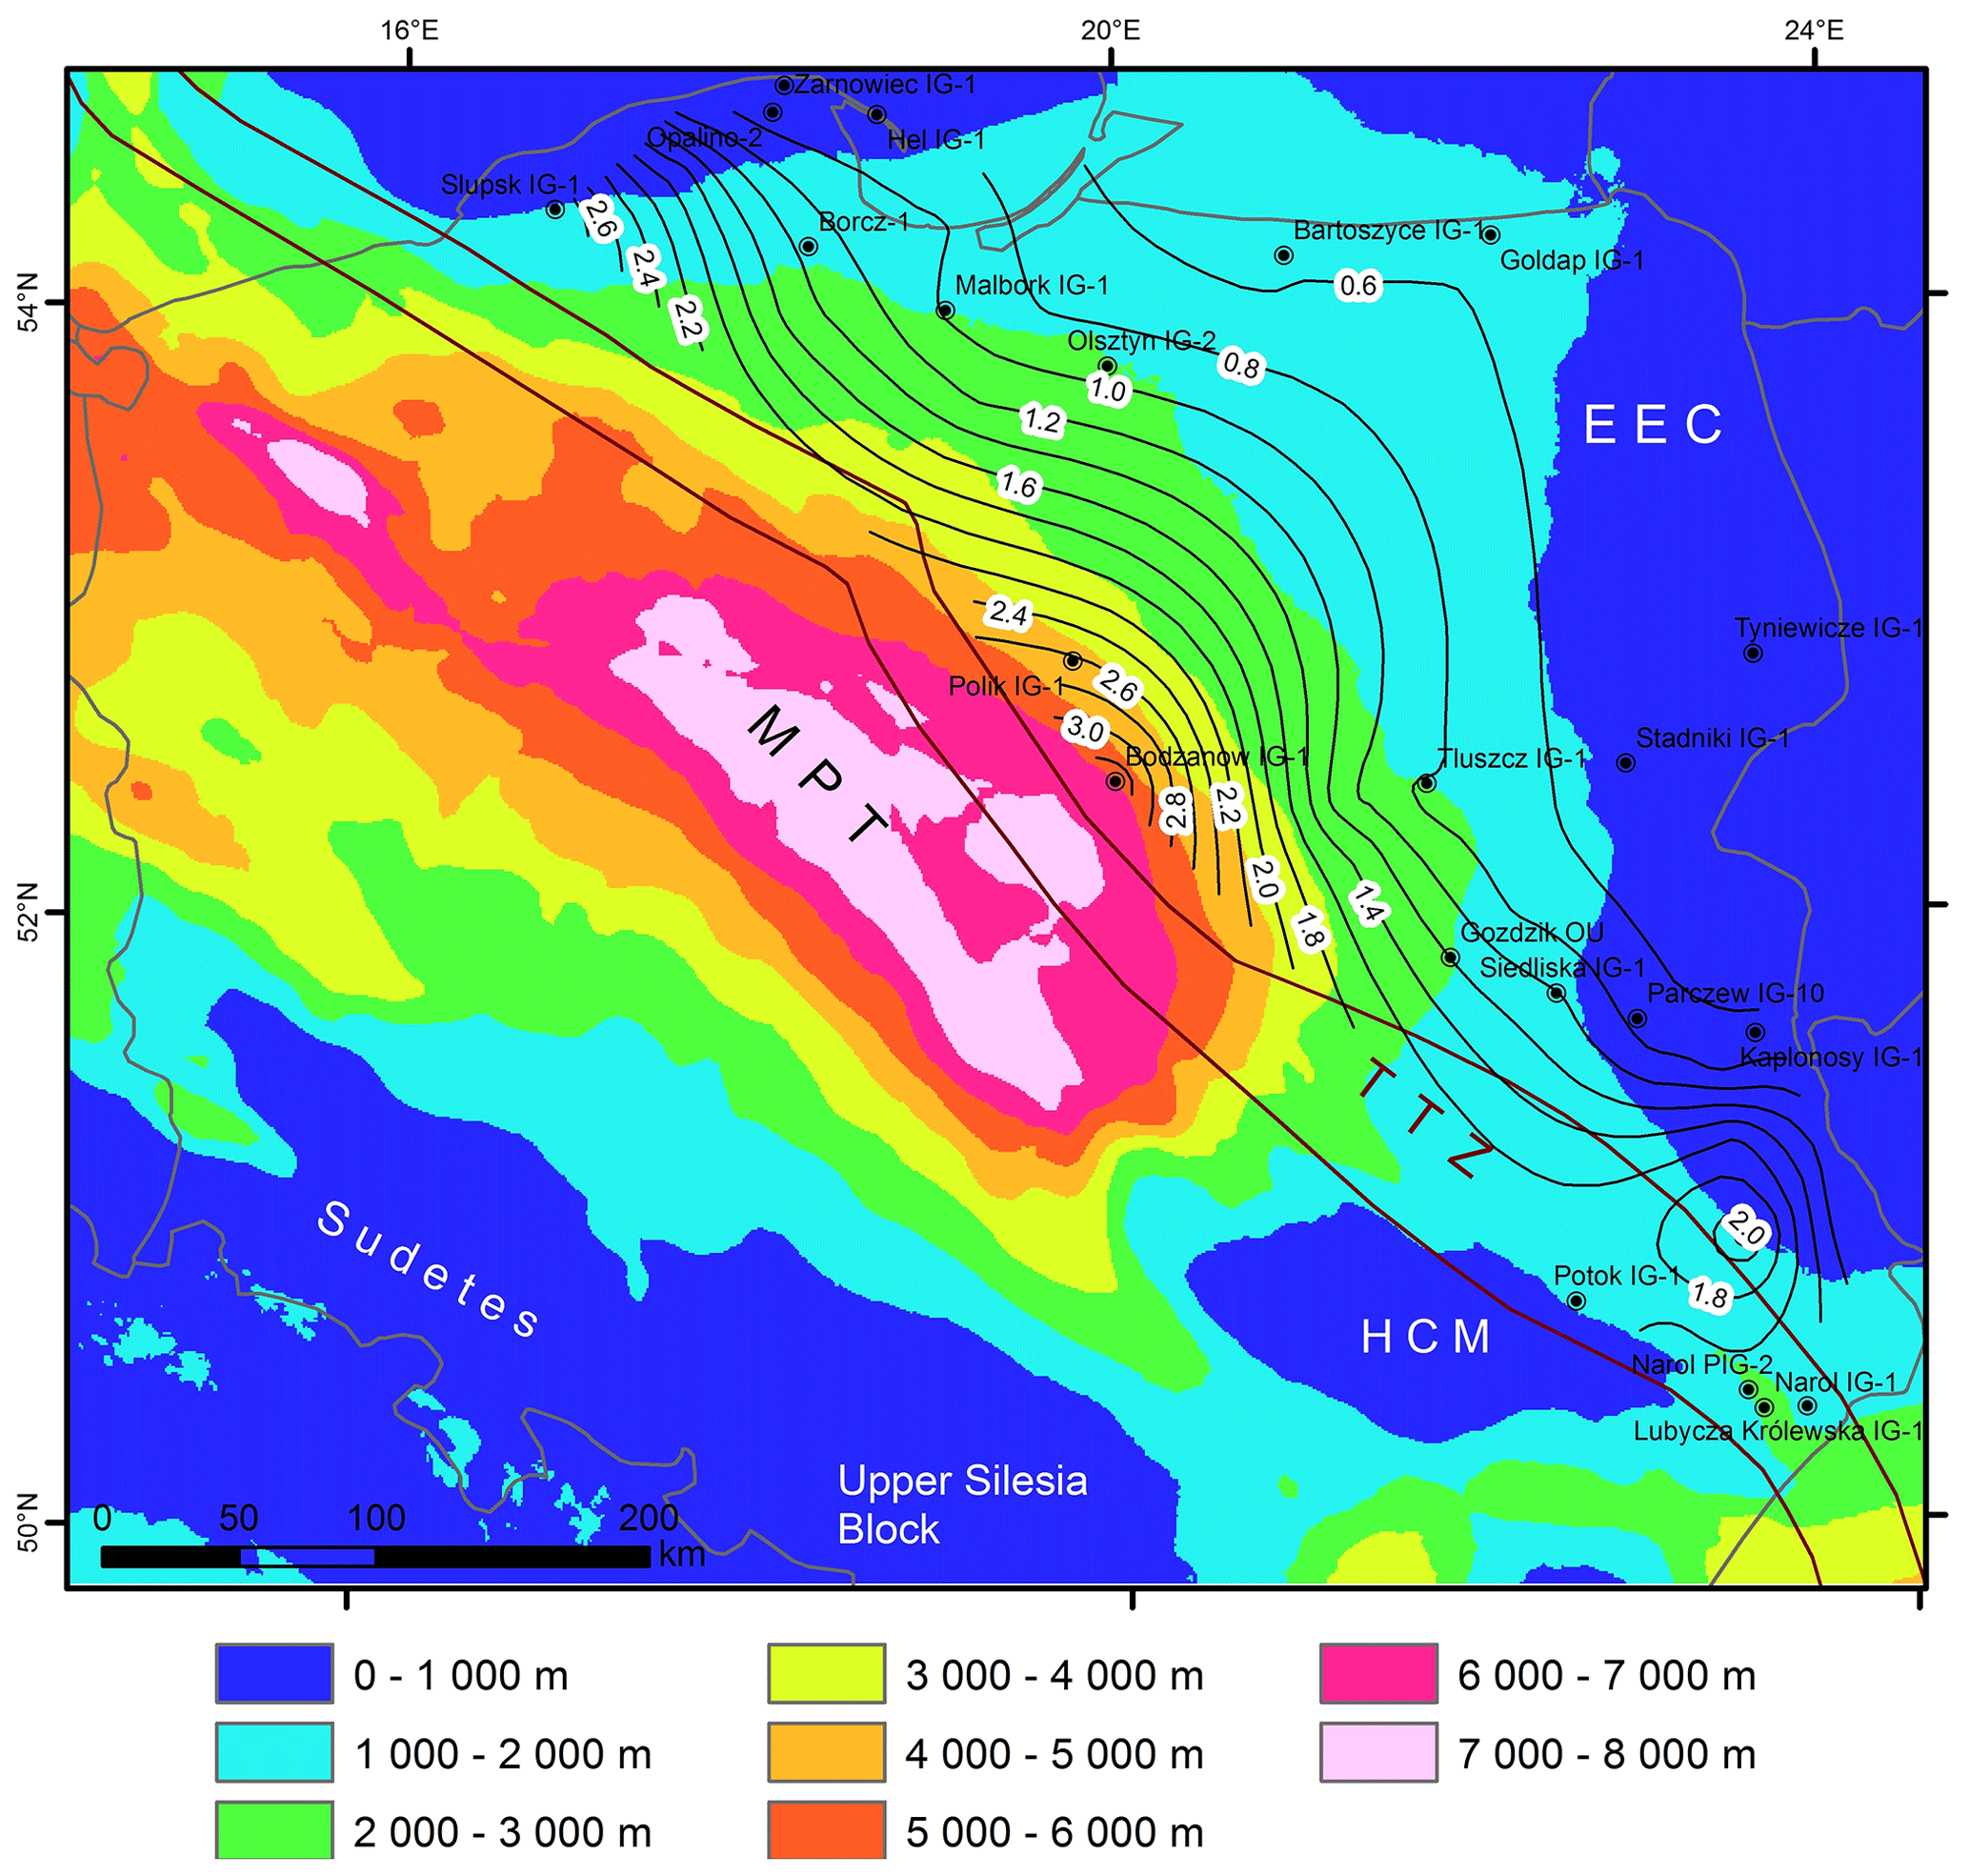
Figure 4Permian–Cenozoic sediments isopach map for Poland adapted from Lamarche and Scheck-Wenderoth (2005), Maystrenko and Scheck-Wenderoth (2013), and Mazur et al. (2021). Isolines show mean vitrinite-equivalent reflectance model for the base of Silurian in NE Poland modified from Papiernik et al. (2019). EEC – East European Craton; HCM – Holy Cross Mountains; MPT – Mid-Polish Trough; TTZ – Teisseyre–Tornquist Zone.
The Ediacaran to Mesozoic strata on the SW slope of the EEP were investigated by reflectance of organic particles (including vitrinite), rock-eval analysis, conodont colour alteration index (CAI), and thermal alteration index (Botor et al., 2019a, b, and references therein). These studies revealed a systematic zonation in the degree of diagenesis of Ediacaran to lower Paleozoic rocks that is oriented NE–SW, parallel to the TTZ (Fig. 4; Kanev et al., 1994; Nehring-Lefeld et al., 1997; Swadowska and Sikorska, 1998; Grotek, 1999, 2006, 2016; Skręt and Fabiańska, 2009; Więcław et al., 2010, 2012). In all stratigraphic units, thermal maturity increases toward the SW corresponding to the increase of burial depth. Accordingly, mean random vitrinite reflectance (VR) for the base of Phanerozoic sequences in the Baltic, Podlasie, and Lublin basins attains 5.0 % VR, 1.3 % VR, and 3.4 % VR, respectively (Grotek, 1999, 2005, 2006, 2016). Conodont CAI for Ordovician–Devonian rocks in the interior of the EEP attains 1–1.5 (Drygant, 1993; Nehring-Lefeld et al., 1997; Poprawa, 2010), the value that is indicative of paleotemperatures between 50 and 90 ∘C, according to the CAI calibration by Epstein et al. (1977). Toward the SW, the Ordovician CAI values gradually increase and reach level 5 (i.e. over 300 ∘C) within the TTZ (Drygant, 1993; Nehring-Lefeld et al., 1997). In the Baltic Basin, the analogous zonation was documented by the illite-to-smectite ratio in shales (Środoń et al., 2009). In the Ukrainian part of the EEP (Podolia area; see further discussion in Sect. 6.4), Silurian bentonite samples were examined by clay mineralogy, illite K-Ar and AFT dating (Środoń et al., 2013). Apatite samples yielded mid-Late Cretaceous FT ages (107–63 Ma), significantly younger than the stratigraphic ages (423–417 Ma; Środoń et al., 2013). Illite K-Ar data constrained the age of maximum paleotemperatures at 390–310 Ma (Middle Devonian–late Carboniferous), comparable to the range of ages obtained for bentonites from the Baltic Basin (382–294 Ma). Środoń et al. (2009, 2013) interpreted these data as indicative of deep burial under a Devonian–Carboniferous sedimentary cover. However, new illite K-Ar ages show an early Carboniferous age (350–325 Ma) of maximum temperatures for most of the area, except for the SE part of the Lublin Basin, where K-Ar data revealed younger, late Carboniferous to Permian ages for a thermal climax (Kowalska et al., 2019).
Permian and Mesozoic rocks in the Baltic Basin show much lower thermal maturity compared to the lower Paleozoic sediments, usually below 0.6 % VR (Grotek, 1999, 2006; Poprawa et al., 2010). Further SE, thermal maturity is variable in the Carboniferous and Devonian–Carboniferous strata of the Podlasie and Lublin basins, respectively (Poprawa and Pacześnia, 2002; Grotek, 2005; Botor et al., 2002, 2019a, b). However, the Permian–Mesozoic sediments consistently show low thermal maturity below 0.5 % VR in these basins (Grotek, 2005, 2006, 2016).
Maturity modelling, based on downhole VR profiles (Fig. 5), showed that the thermal evolution in the Lublin Basin was related to burial in Devonian–Carboniferous times with the most prominent temperature increase in the late Carboniferous (Botor et al., 2002; Karnkowski, 2003; Kosakowski et al., 2013; Botor, 2018; Botor et al., 2019a, b). A fluid flow influence on thermal maturity in this area was suggested by Poprawa and Żywiecki (2005) based on combined analysis of fluid inclusions and modelling of organic maturation. In the Baltic Basin, maturity modelling has shown that the increase of burial and temperature was continuous from the late Silurian to early mid-Carboniferous. Toward the west, more important was late Silurian burial, whereas in the east Devonian and early Carboniferous heating prevailed (Poprawa et al., 2010; Botor et al., 2019a). In Baltic Basin, an alternative possibility was proposed by Poprawa et al. (2010), who suggested that peak temperatures were related to burial and an associated advectional/convectional thermal event in the Late Cretaceous.

Figure 5Representative burial history plots for the (a) Baltic Basin and (b) Lublin Basin after Botor et al. (2019a). In the Baltic and Lublin basins, a maximum temperature in the lower part of the Ediacaran–Paleozoic sedimentary succession was reached in the early and latest Carboniferous, respectively.
Samples of sandstones, bentonites, diabase, and crystalline basement rocks were collected from 17 boreholes located along the SW slope of the EEP (Fig. 1) and their geological details are provided in Table 1. Single samples were available from most of boreholes, apart from the Gołdap IG-1 and Tłuszcz IG-1, each of which was represented by two samples. Stratigraphic ages of the samples range from the Proterozoic to Middle Jurassic, and their depth varies between 416 and 5110 m below surface (Table 1). Corrected present-day temperatures in Table 1 are based on analysis of geophysical data available (Górecki et al., 2006a, b). Apatite and zircon crystals were separated from core samples using conventional crushing, sieving, and magnetic and heavy liquid separation techniques. However, most of the processed 70 samples did not contain any apatite or zircon crystals suitable for thermochronology. Some core samples were too small to yield enough crystals, particularly apatites. Consequently, 12 samples were suitable for ZHe and 21 for AFT analyses.
4.1 Zircon (U–Th) He analyses
Zircon crystals were handpicked following the recommendation of Farley (2002). Selected crystals were characterized by euhedral shape with two pyramidal terminations and a width of >65 µm. The crystals were then photographed, measured for physical dimensions, and loaded in Pt microtubes. The helium was extracted at ∼1000 ∘C under high vacuum using a diode laser and measured by isotope dilution using a Hidden 3F triple-filter mass spectrometer at the University of Göttingen. A “re-extract” was run after each sample to verify complete degassing of the crystals. Following degassing, samples were retrieved from the gas extraction line and spiked with calibrated 230Th and 233U solutions. Zircon crystals were dissolved in teflon bombs using a mixture of double distilled 48 % hydrofluoric acid (HF) and 65 % HNO3 at 220 ∘C for 5 d. Spiked solutions were analysed as 0.4 mL solutions by isotope dilution on a Perkin Elmer Elan DRC II ICP-MS with an APEX micro-flow nebulizer. Procedural U and Th blanks by this method are usually very stable in a measurement session and below 1.5 pg. Sm, Pt, Zr, and Ca were determined by external calibration. The oxide formation rate and the PtAr–U interference was always monitored, but the effects of isobaric argides were negligible relatively to the signal of actinides. The ejection correction factors (Ft) were determined for the single crystals by a modified algorithm of Farley et al. (1996) using an in-house spreadsheet.
4.2 Apatite fission track analyses
Apatite grains were mounted in epoxy resin on glass slides and polished to expose internal grain surfaces. Spontaneous tracks were revealed by 5 N HNO3 at 21 ∘C for 20 s. Neutron fluence was monitored using CN5 uranium dosimeter glass. Thin flakes of low-U muscovite were used as external detectors. Samples together with age standards (Fish Canyon, Durango, and Mount Dromedary apatite) were irradiated with a thermal neutron nominal flux of 9×10¹⁵ n cm−2 at the Oregon State University TRIGA reactor (USA). After irradiation, the muscovite detectors were etched in 40 HF for 45 min at 20 ∘C to reveal the induced tracks. AFT analysis was carried out at the Institute of Geological Sciences, Polish Academy of Sciences in Kraków (Poland), using the external detector method and the ζ age calibration method in order to determine the fission track ages (Hurford and Green, 1983; Hurford, 1990). Track counting and length measurement of horizontal confined fission tracks and the etch pit diameter (Dpar) values were carried out by means of optical microscopy at 1250× magnification using a Nikon Eclipse E-600, equipped with a motorized stage, digitizing tablet, and drawing tube controlled by the FTStage 4.04 programme (Dumitru, 1993). All quoted AFT ages are central ages with 1σ error (Galbraith and Laslett, 1993). The degree to which individual AFT grain ages in a sample belong to a single population was assessed by a χ2 statistic (Galbraith, 1981). Values of P(χ2) below 5 % indicate a statistically significant spread in single-grain ages and the presence of more than one population (Galbraith, 1981, 1990; Galbraith and Laslett, 1993). Crystals chosen for confined track measurements had a well-polished surface, parallel to the c axis. For each sample, as many confined track lengths as possible were measured (Gleadow et al., 1986). Data analyses and age calculations were based on a zeta value (ζCN5) of 348.18 ± 6.52 for CN5 accomplished by using Trackkey 4.2 software (Dunkl, 2002). We used confined tracks non-corrected to the c axis, as normalizing fossil track lengths to a personalized zero length is a questionable procedure for eliminating discrepancies between measured and predicted lengths (e.g. Green and Duddy, 2012).
4.3 Thermal modelling
The modelling of thermal history was performed using HeFTy software (Ketcham, 2005). The programme requires input data such as measured AFT age, track length distribution, kinetic parameter as Dpar for apatite and apparent ZHe age, radioactive elements' concentration, and diameter of the dated crystals to define “acceptable” time–temperature paths that pass statistical criteria and conform to a possible set of user-defined geological constraints (Ketcham, 2005). Thermal histories were modelled using the fission track annealing model (Ketcham et al., 2007b). Randomly generated thermal histories predict the AFT age and length parameters and compare them to the measured data. Modelling was run until the software calculated at least 100 acceptable fits. An acceptable fit corresponds to thermal histories representing the t–T paths that give a goodness-of-fit (GOF) value greater than 0.05 for both the age and the length distribution (Ketcham, 2005). The minimum statistic value above 0.05 means that all statistics pass the 95 % confidence test. When the minimum is above 0.5, the statistical precision limit, the model is termed “good”. For a comprehensive overview of fission track methods and their modelling techniques, see more details in Donelick (2005), Ketcham (2005) and Ketcham et al. (2007b). For the helium diffusion kinetics in zircon, we applied the model by Guenthner et al. (2013). Chronostratigraphic subdivisions and absolute ages refer to Gradstein et al. (2012) throughout the text.
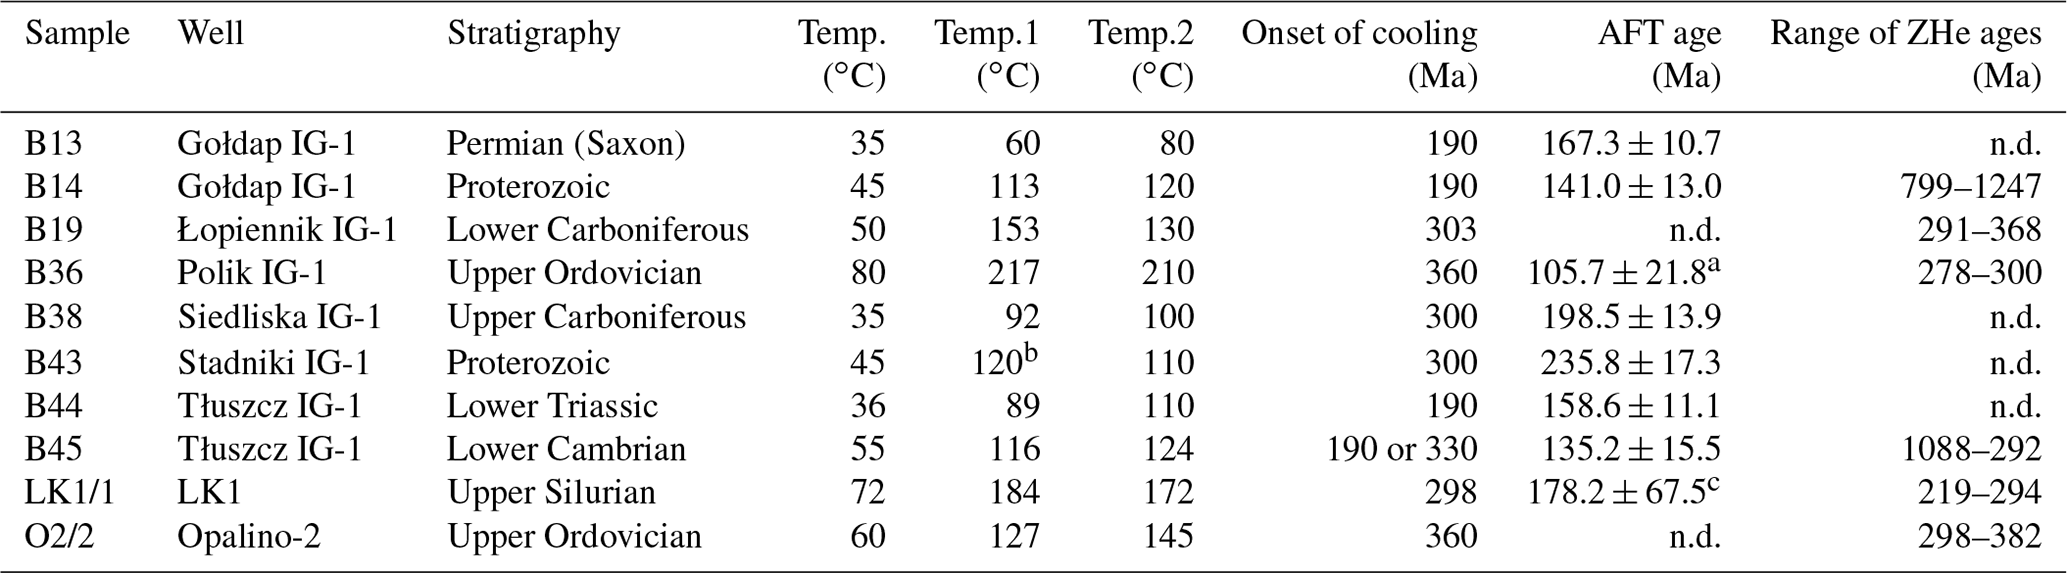
Table 1Locality, stratigraphy, lithology, temperature, and thermal maturity of the samples.
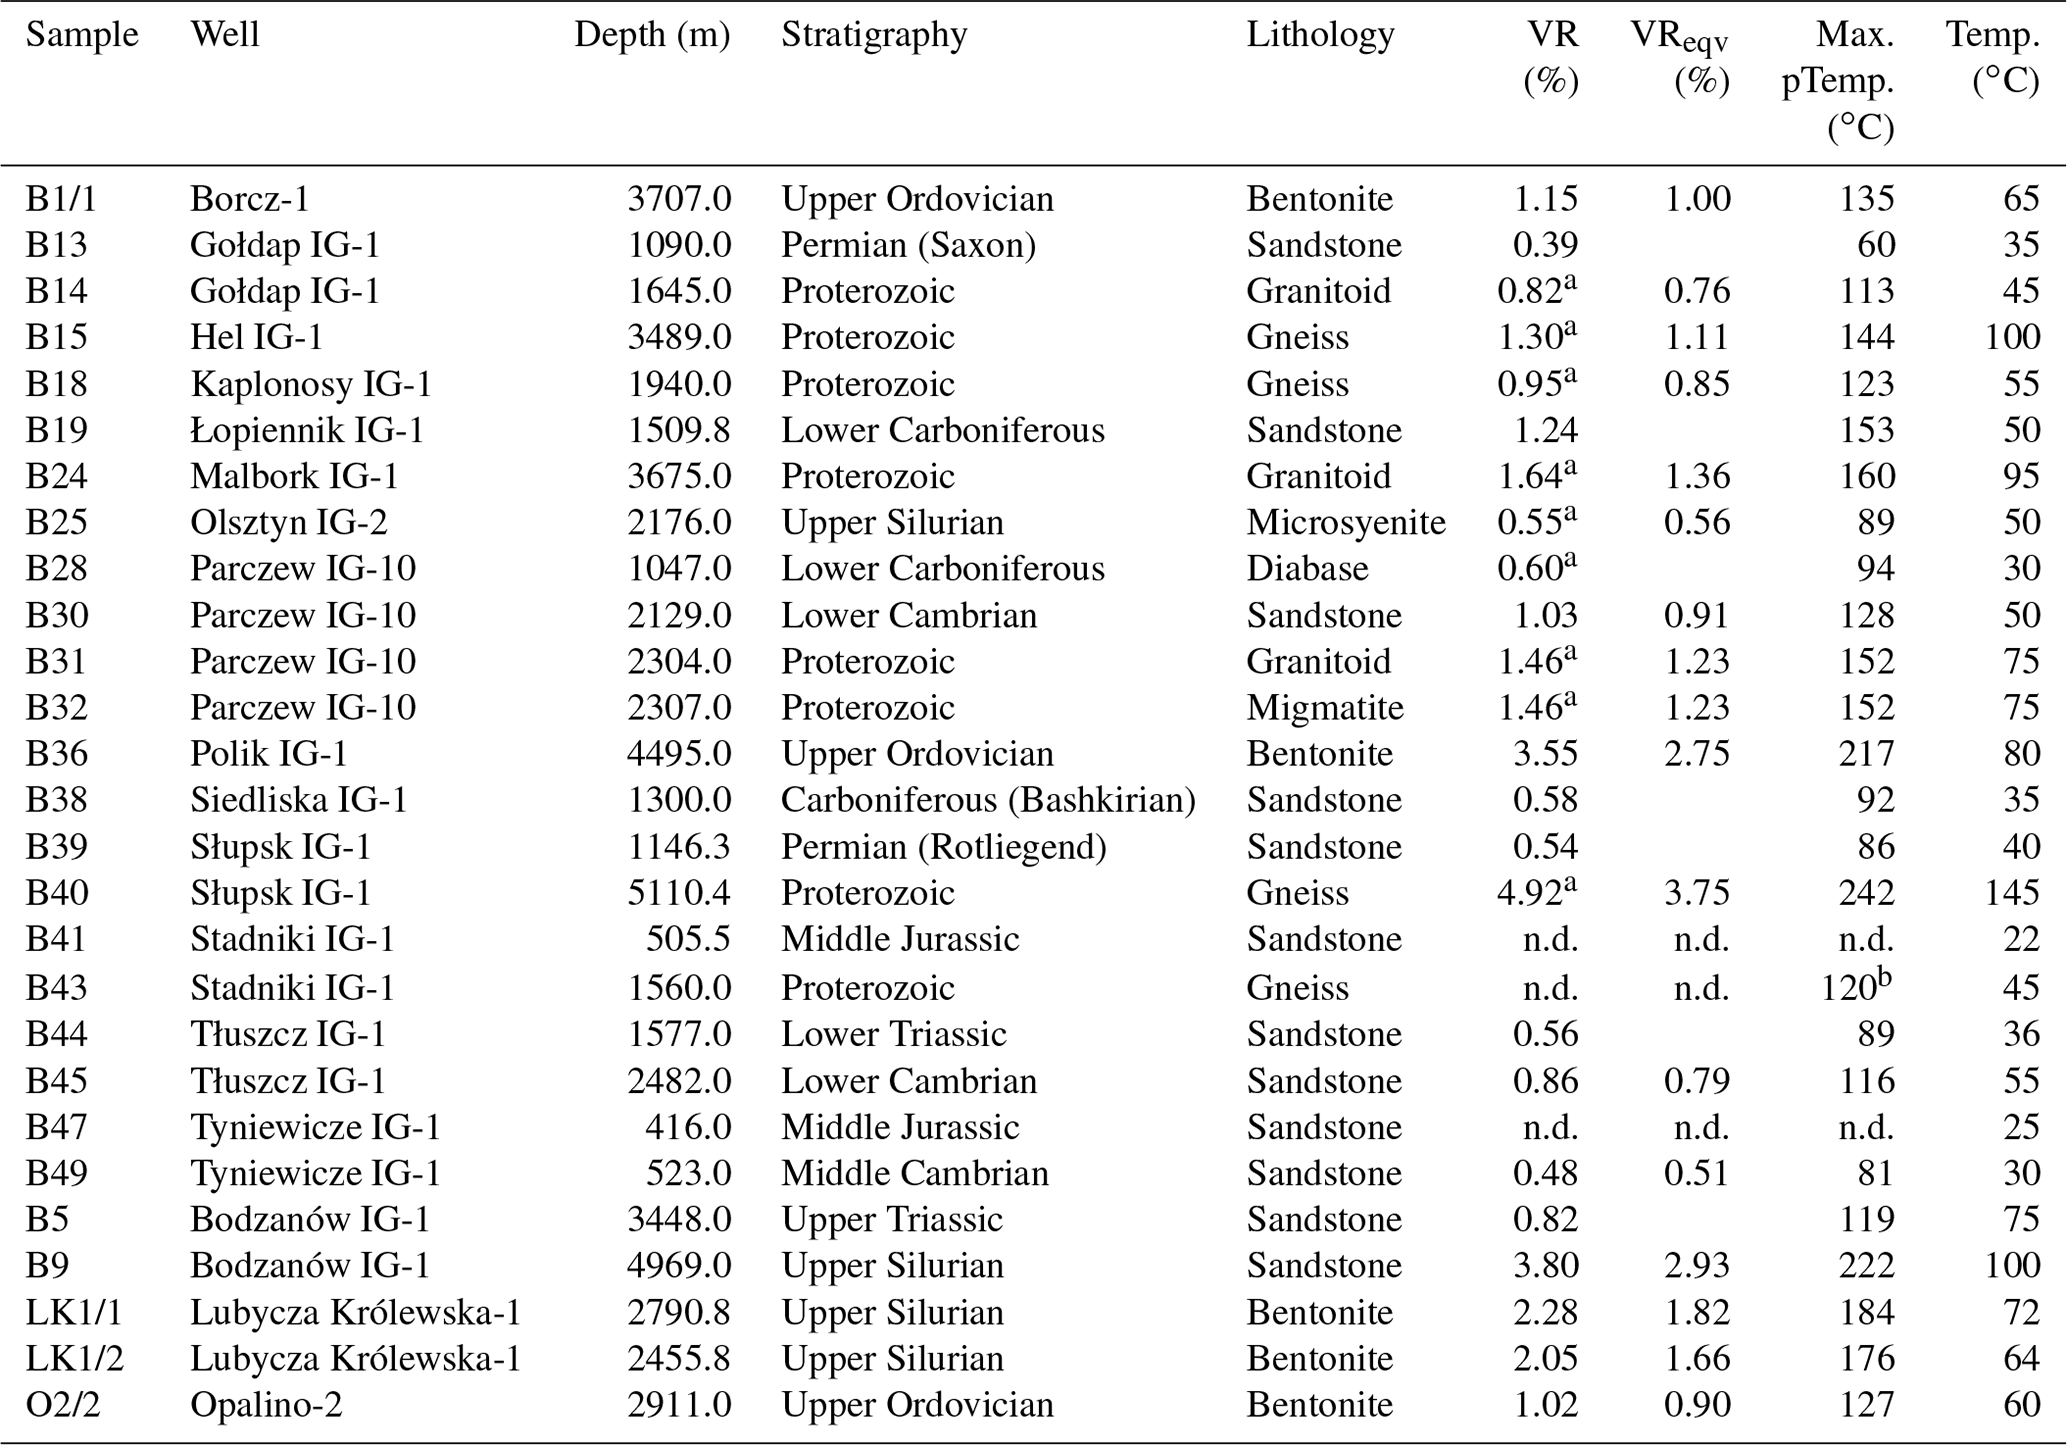
VR – in the adjacent depth level in which VR was measured in shale (Nehring-Lefeld et al., 1997; Grotek, 1999, 2005, 2006). a Values for the magmatic/metamorphic rocks are from adjacent above sedimentary rock. Vreqv – the relationship between graptolite reflectance and equivalent vitrinite reflectance can be expressed by the equation: VReqv=0.73 R (graptolite- and vitrinite-like) low + 0.16 in the Ediacaran–Silurian sediments (Petersen et al., 2013). Max. pTemp. – maximum paleotemperature calculated applying Barker and Pawlewicz (1994) equation, where max. pTemp. = (LN(VR) + 1.68)0.0124. b 120 ∘C in Stadniki IG-1 from illite/smectite data of lower Cambrian (Kowalska et al., 2019). Temp. – present-day average temperature of sample in the given borehole, n.d. – no data.
5.1 Zircon (U–Th) He ages
The stratigraphic ages of the samples are from the Proterozoic to Triassic (Table 1). Single-grain ZHe ages are widely dispersed being in some cases older than a stratigraphic age (Table 2). These grains represent zircons that avoided resetting or are only partially reset. Many other single-grain ages, although younger than a stratigraphic age, are scattered broader than their individual uncertainties (Table 2). This effect must be also related to partial reset of studied crystals or secondary disturbance of the isotopic system. No mean ages are calculated for samples, where the dispersion of single-grain ages exceeds estimated uncertainties (Table 2). Two versions of a mean age are calculated for sample B19: (1) excluding one single-grain age that is older than a stratigraphic age, and (2) additionally excluding the youngest single-grain age that is far beyond the uncertainties of the remaining grains (Table 2). The average ZHe ages range from 848 ± 81 to 255 ± 22 Ma, except for sample B40 in which a measured ZHe is 8 Ma (Table 2, Fig. 1). However, this young ZHe age comes from a borehole where the present-day temperature is ≈ 145 ∘C (Table 1), thus practically from the partial retention thermal conditions (ZPRZ, ≈ 130–220 ∘C; Reiners, 2005).
Table 2Zircon data.
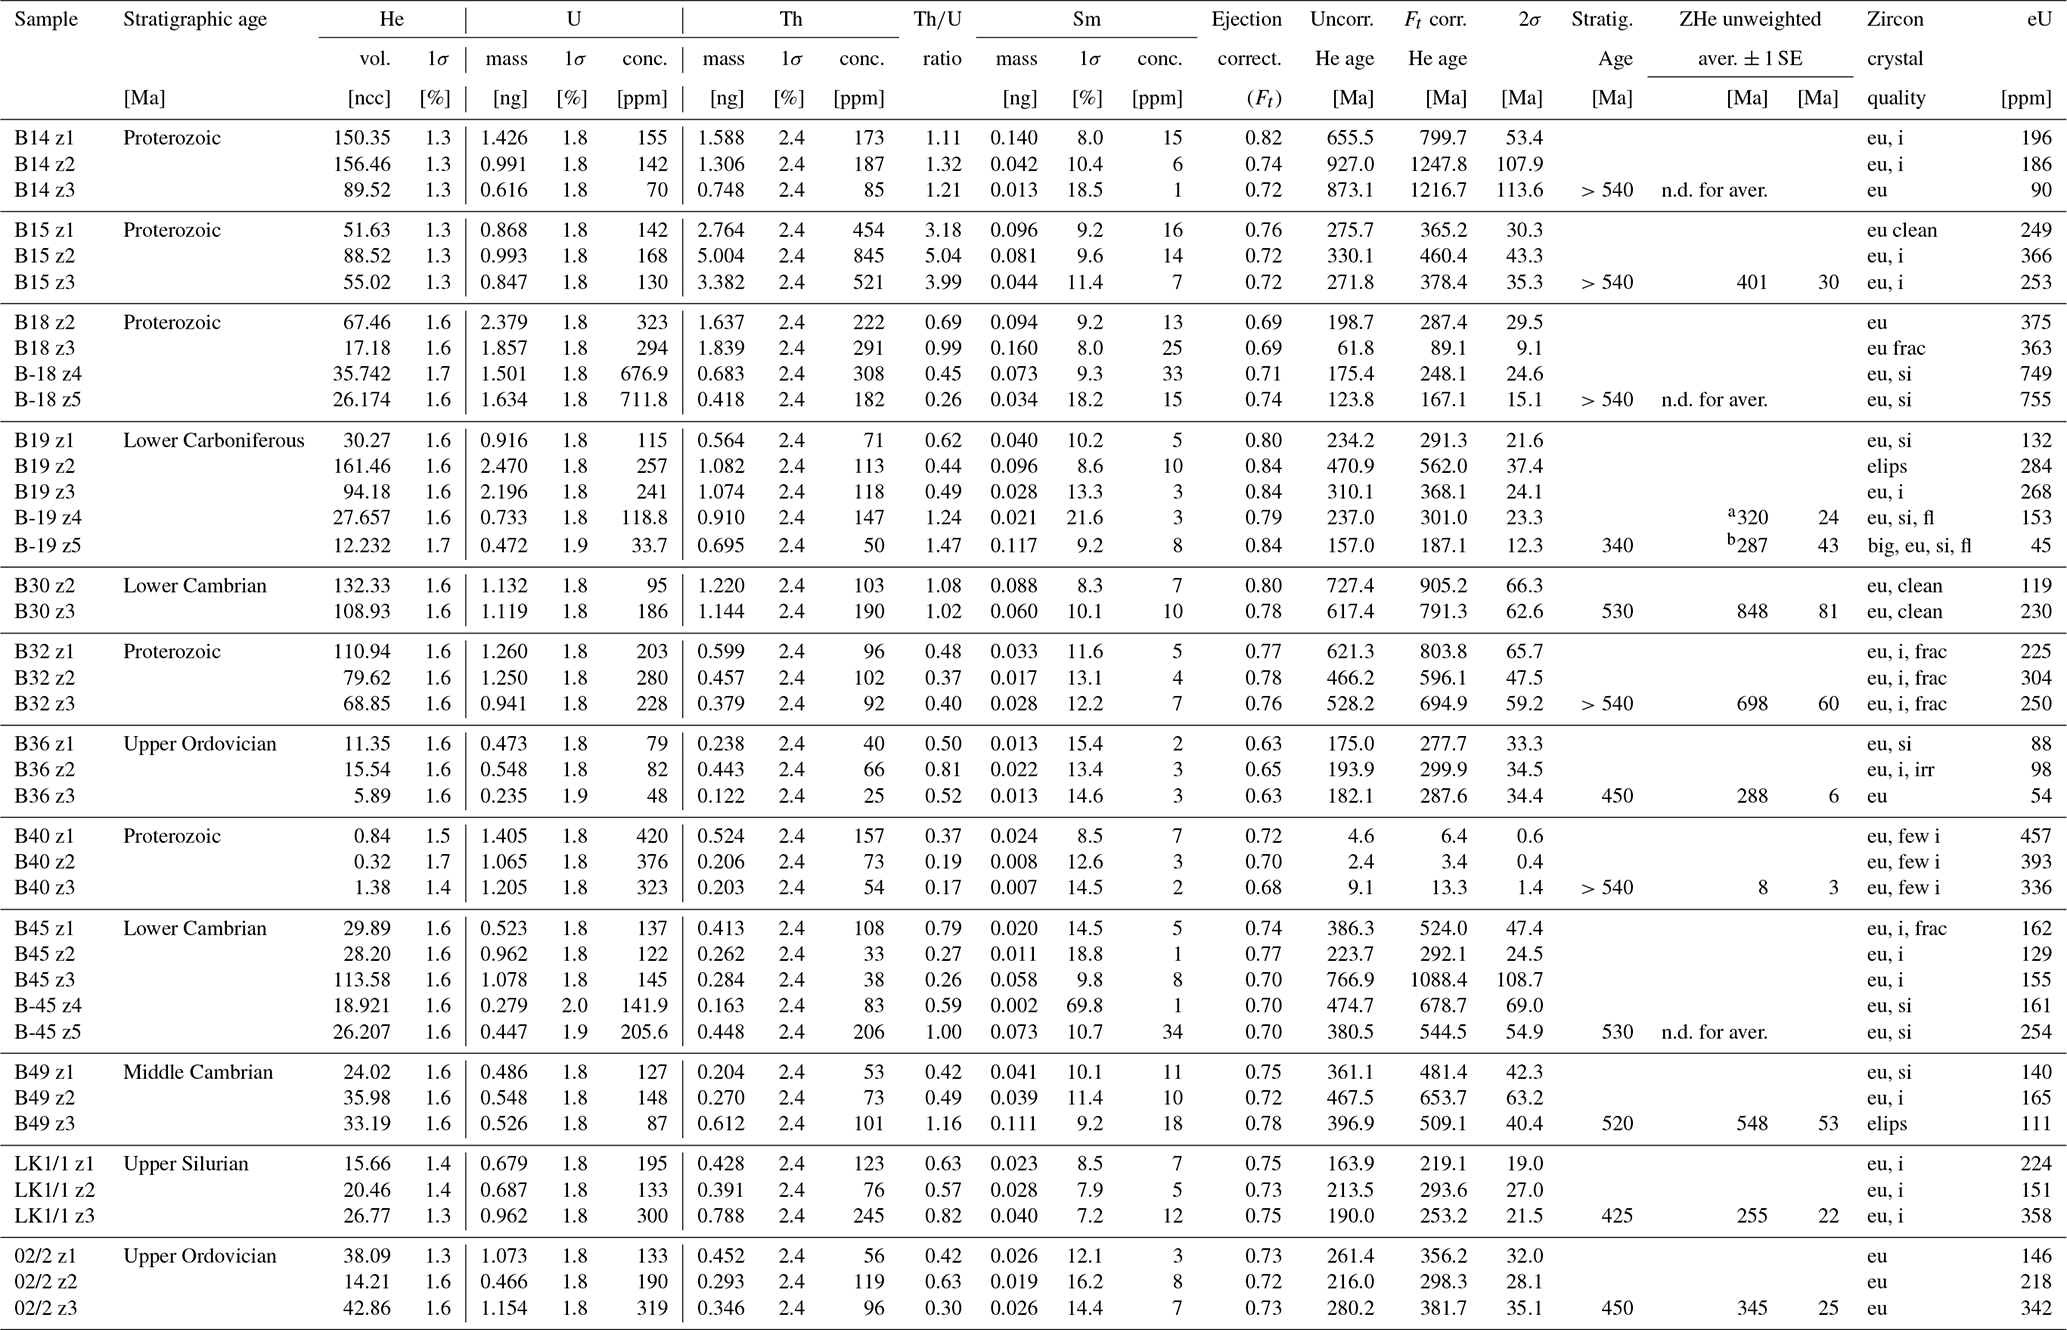
Amount of helium is given in nano-cubic centimetres in standard temperature and pressure. Amounts of radioactive elements are given in nanograms. Ejection correct. (Ft) – correction factor for alpha ejection according to Farley et al. (1996) and Hourigan et al. (2005). Uncertainties of helium and the radioactive element contents are given as 1σ, in relative error %. Uncertainty of the single-grain age is given as 2σ in Ma, and it includes both the analytical uncertainty and the estimated uncertainty of the Ft. Uncertainty of the sample average ages is in 1 standard error, as , where SD is standard deviation of the age replicates and n is the number of age determinations. eU has been calculated with the formula [eU] = [U] + 0.235 × [Th]. eu – euhedral, i – inclusions, irr – irregular, si – small inclusions, frac – fracture, elips – elliptic shape of grain, fi – fluid inclusions. a320 ZHe age without B19z2, and B19z5 (562 and 187.1 Ma). b 287 ZHe age without B19z2 (562 Ma). Strat. age (Ma) is stratigraphic ages which are given as approximate age as no isotopic data exist for these samples.
Certain samples do not show a significant Phanerozoic reset (Table 2, Fig. 1); e.g. the B14 Proterozoic granitoid sample has three single-grain ZHe ages which scatter from 1248 to 800 Ma. The B32 sample of Proterozoic migmatite has three single-grain ZHe ages which scatter from 804 to 596 Ma and a mean ZHe age of 698 Ma. The B30 sample of lower Cambrian sandstone also has three single-grain ZHe ages which are in the range of 905 to 791 Ma and a mean ZHe age of 848 Ma. Two Cambrian samples suggest partial reset of ZHe ages in the Phanerozoic due to some single-grain ages younger than a depositional age. In the B49 sample of mid-Cambrian sandstone, a mean ZHe age is 548 Ma with single-grain ages of 654, 509, and 481 Ma. The B45 sample of lower Cambrian sandstone has four single-grain ZHe ages which scatter from 1088 to 292 Ma. Two zircons have an age younger than a stratigraphic age of the sample. These results are consistent with the low thermal maturity of lower Paleozoic strata in the NE part of the EEP and negligible or very low reheating during Phanerozoic (Grotek, 1999, 2006, 2016; Skręt and Fabiańska, 2009; Pletsch et al., 2010).
All other ZHe mean ages are significantly younger than the stratigraphic age and thus are considered partially or totally reset (Table 2, Fig. 1). These samples occur along the SW slope of the EEP relatively close to the TTZ. In the Baltic Basin, sample B-15 (Hel IG-1 borehole) of Proterozoic gneiss reveals three single-grain ages of 460, 378, and 365 Ma that suggest partial reset and yield a mean ZHe age of 401 Ma. A second sample from the Baltic Basin, the O2/2 sample of Upper Ordovician bentonite (Opalino-2), has an early Carboniferous mean ZHe age of 345 Ma. In the Polik–Bodzanów area (west of Podlasie Basin), the B36 Ordovician bentonite sample (Polik IG-1) has a tightly clustered early Permian mean ZHe age of 288 Ma. In the Lublin Basin, the B19 sample (lower Carboniferous sandstone, Łopiennik IG-1) has ZHe single-grain ages from 562 to 187 Ma, suggesting partial reset. In the B18 (Kaplonosy IG-1) sample, only one of four zircon crystals is euhedral with no inclusions, showing a ZHe age of 287 Ma (early Permian). Sample LK1/1 (Silurian bentonite, Lubycza Królewska-1) has a late Permian mean ZHe age of 255 Ma. A wide scatter of Paleozoic ZHe ages between Devonian and Permian results from the mixture of partially and fully reset zircon grains. Therefore, the ZHe mean ages probably do not reflect the timing of a particular tectonic event. The early Permian ages (B36, LK1/1, and possibly B19) represent the delayed effect of cooling after Carboniferous uplift and erosion. An alternative explanation would be cooling after the earliest Permian phase of continental rifting and possibly associated increased heat flow. Sample O2/2 might be with reservation interpreted as directly reflecting the time of cooling after early Carboniferous exhumation. The results obtained do not bear any record of Mesozoic tectonic events that may have caused thermal effects below the resolution of the ZHe method.
5.2 Apatite fission track data
The results of AFT analyses, performed on 21 samples, are presented in Table 3, Fig. 1 and in the Supplement (Fig. S1). A stratigraphic age of samples ranges from Proterozoic to Jurassic (Table 1). The quality of AFT data is varied in most samples, as a maximum 20 apatite grains were studied (Table 3). The average uranium content is from 3 to 70 ppm. All the AFT ages represent unimodal age populations as shown by high P (χ2), younger than their stratigraphic age except for sample B47 (Table 3, Fig. 1). Central AFT ages range from 359.6 ± 27.2 to 1.0 ± 0.7 Ma. Except the samples characterized by high present-day temperature, related to their depth in boreholes (Table 1) and having impact on apatite tracks annealing (B15, B24, B40), the central AFT ages range from 359.6 ± 27.2 to 42.1 ± 11.1. The AFT age of sample B47 (359.6 ± 27.2) is inherited from a source of detritus since it is much older than a stratigraphic age of the sample (Middle Jurassic; Table 1). Therefore, a scatter of ages interpreted as partially or fully reset is between 258.7 ± 32.1 (latest Permian) and 42.1 ± 11.1 (Paleogene; Table 3). Some caution must be attached to four samples yielding Paleogene ages. Three of them (B5, B31, and B32) are from boreholes characterized by a present-day temperature of 75 ∘C, i.e. within the apatite partial annealing zone. For sample B28, having an AFT age of 42.1 ± 11.1 Ma, no track length measurements are available, whereas its central age is only based on seven grains with some scatter.
Table 3Apatite fission track data.
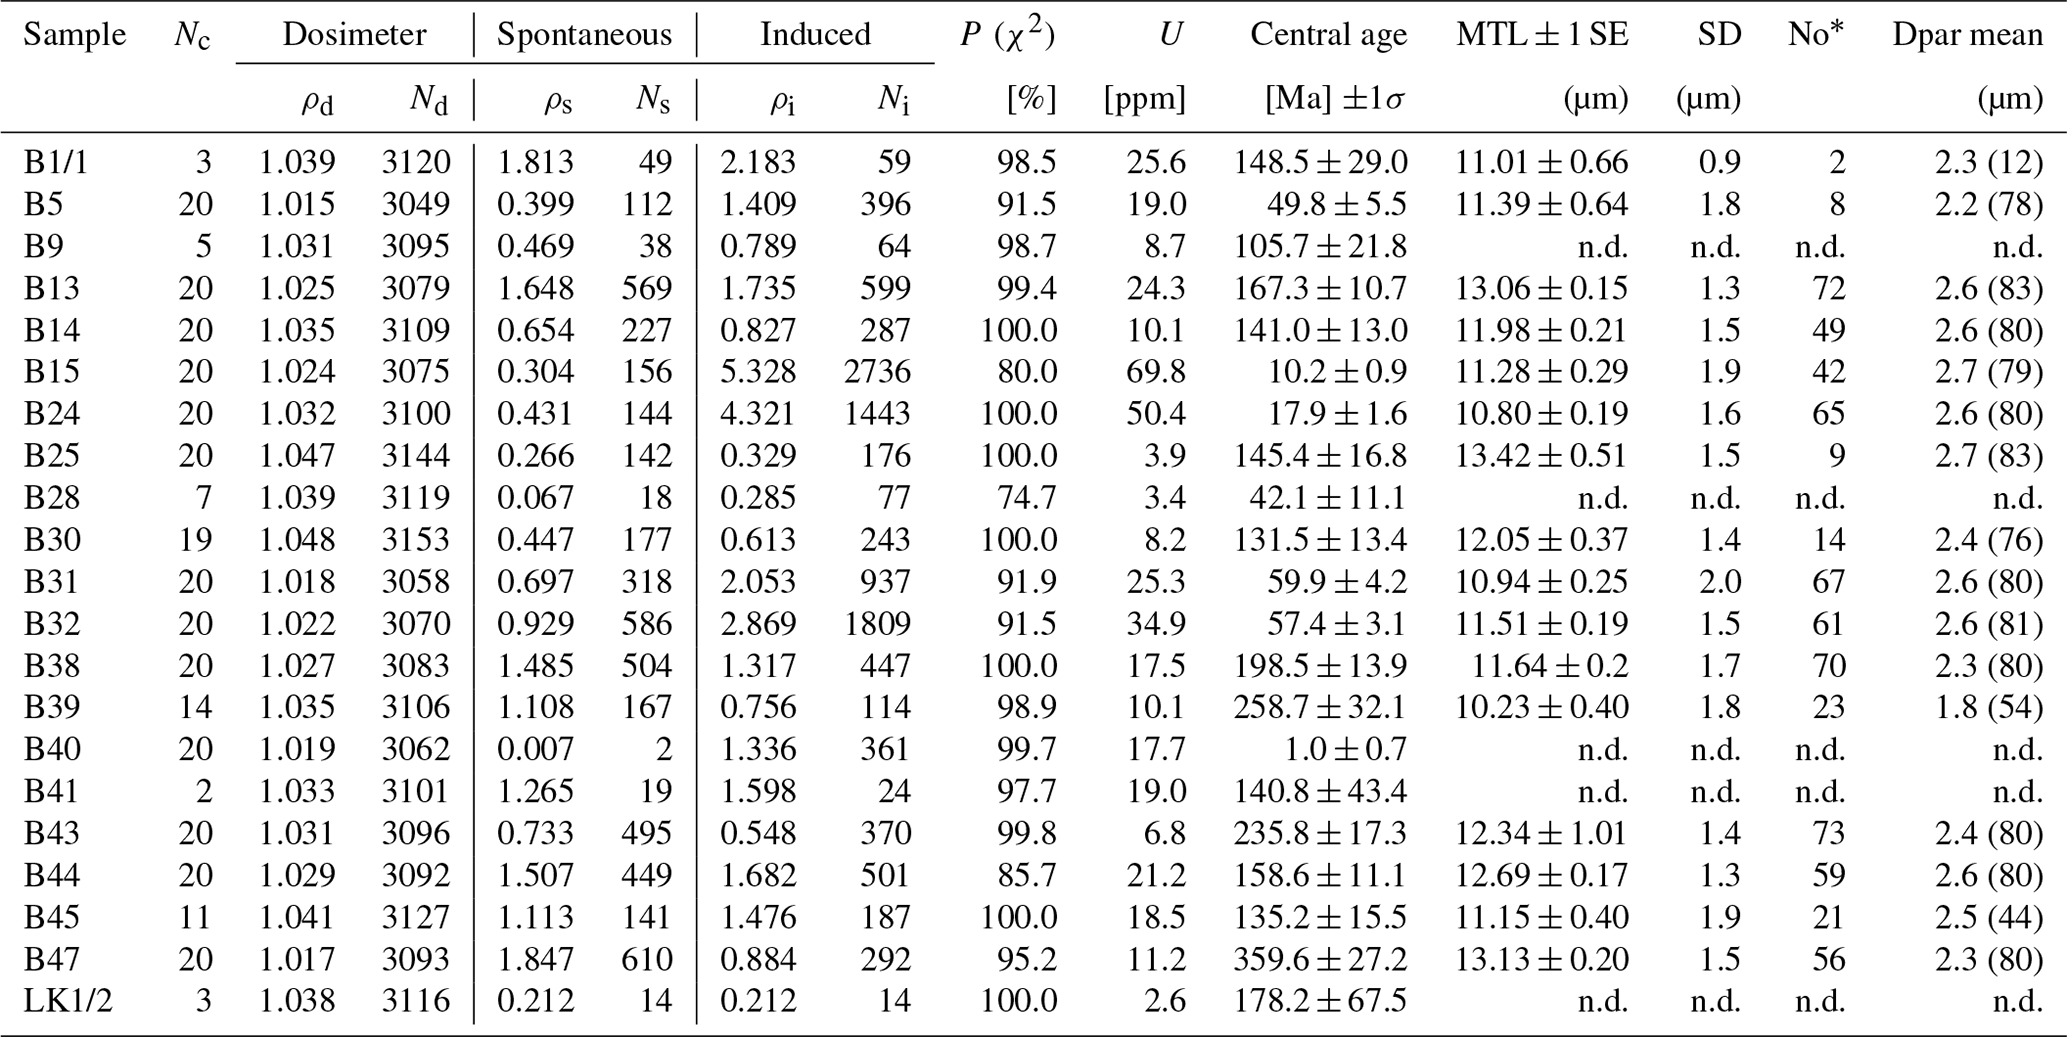
Nc – number of measured crystals, ρs – density of spontaneous tracks (×106 tracks for cm−2); Ns – number of counted spontaneous tracks; ρi – density of induced tracks in external detector (mica) (×106 tracks for cm−2); Ni – number of counted induced tracks; ρd – density of induced tracks in external detector which cover dosimeter (glass CN5) (×106 tracks for cm−2); Nd – numbers of counted tracks. P (χ2) [%] – probability homogeneity apatite population were showed by the test agreement χ2 value (Galbraith, 1981). AFT age ±1σ error is a central age of sample (Galbraith and Laslett, 1993) counted by using the zeta calibration method (Hurford and Green, 1983; Hurford, 1990) and dosimeter (glass) CN5. Data analyses and age calculations were based on a zeta value is 348.18 ± 6.52 (Aneta A. Anczkiewicz), and accomplished by using Trackkey 4.2 software (Dunkl, 2002). Crystals chosen for confined track measurements had a well-polished surface, parallel to the c axis. U – amount of uranium was calculated by software Trackkey 4.2 (Dunkl, 2002). MTL (µm ± SE) – mean confined length. No* – number of measured confined tracks. SD – standard deviation. SE – standard error. Dpar mean – mean etch pit diameter; in brackets are the numbers of etch pit diameters measured.
Horizontal confined track lengths have been measured in 16 samples. Due to the relatively low uranium content, only eight samples yielded the track numbers >50 (Table 3). A mean track length (MTL) ranges from 10.2 ± 0.4 to 13.4 ± 0.5 µm (Table 3) and distributions are from wide to relatively narrow (Fig. S1). Most samples show a negative skewness between −0.1 and −1.6 with tails toward shorter track lengths, apart from three samples (B25, B39, and B43). The standard deviation values of track length range from 1.3 to 2.0 µm except for sample B1/1 (SD of 0.8; Table 3).
A total of 1150 Dpar values were determined for all apatite grains used in this study (Table 3). The mean Dpar values of the samples are in the range of 1.8 ± 0.3 to 2.7 ± 0.4 µm (Table 3) and exhibit skewness in the range between 1.16 and −0.45, except for sample B44 (−2.86).
5.3 Thermal maturity
Thermal maturity data put key constraints on the interpretation of thermochronological results and ensuing thermal modelling. Besides a countrywide compilation of thermal maturity data (Fig. 4), we discuss in detail profiles of key boreholes that penetrate the sedimentary cover of the East European Platform. We also refer to thermochronological results obtained on samples that were collected from these boreholes. Corrected present-day temperatures in Figs. 6–12 are based on analysis of geophysical data available (Górecki et al., 2006a, b). Although a number of AFT and ZHe samples per well with is usually low (in many wells, just a single sample), integration of thermochronological and thermal maturity data provides meaningful results.
Thermal evolution recognized in some boreholes reveals features that are usually considered an effect of fluid flow overprinted on burial diagenesis. The possible influence of advective heat transfer is inferred based on a set of characteristic features that were documented from other sedimentary basins (Ziagos and Blackwell, 1986; Middleton et al., 2001; Lampe et al., 2001; Green and Duddy, 2012): (1) paleotemperatures being much higher than predicted from the burial history under conditions of vertical conductive heat transfer, (2) paleotemperature profiles that fluctuate markedly, suggesting fluid-driven heat transfer along certain horizons, and (3) discrepancies between paleotemperatures derived from fluid inclusions, illite/smectite studies, and kinetically dependent thermal maturity indicators such as vitrinite reflectance and apatite fission track analysis. In this study, such characteristics is documented and discussed in the following boreholes: Gołdap IG-1, Bartoszyce IG-1, Tłuszcz IG-1, and Siedliska IG-1. In some other wells, such as Opalino-2 and Lubycza Królewska-1, fluid flow influence on thermal evolution is also possible. Particularly, fluid flow heat transfer can explain high exhumation estimates inferred in some wells.
5.3.1 Opalino-2
Sample O2/2 of Ordovician bentonite from the Opalino-2 borehole gave single ZHe ages of 381.7, 356.2, and 298.3 Ma and an average ZHe age of 345 Ma (Fig. 6a, Tables 1–2). The equivalent-VR value for the O2/2 sample is 0.9 % that can be recalculated into a maximum paleotemperature of ≈ 127 ∘C (Table 1). This estimate is close to the lower sensitivity range of the zircon method and may explain only partial reset of the ZHe ages. The illite K-Ar age from the bentonite horizon is 336–329 Ma (Kowalska et al., 2019), which might be close to the timing of maximum paleotemperature. The VR profile is too short and scattered to be suitable for calculation of VR gradient. Therefore, paleogeothermal gradient of 20 ∘C km−1 was assumed for the Opalino-2 well that is equivalent to the paleogradient estimated for the Żarnowiec IG-1 well. In several adjacent wells, the discontinuity of the VR profile between Silurian and Permian (base Permian unconformity) suggests the pre-Permian development of thermal maturity (Fig. 6b; Botor et al., 2019a). In the nearby Żarnowiec IG-1 borehole (Fig. 4), a paleogeothermal gradient during maximum burial (20 ∘C km−1) seems to be similar to a present-day value (18 ∘C km−1) as both are almost parallel (Fig. 6) after omitting effects of pressure retardation. A paleogeothermal gradient of 20 ∘C km−1 applied to the Silurian–early Carboniferous succession in the Opalino-2 borehole results in ≈ 5 km of exhumation.
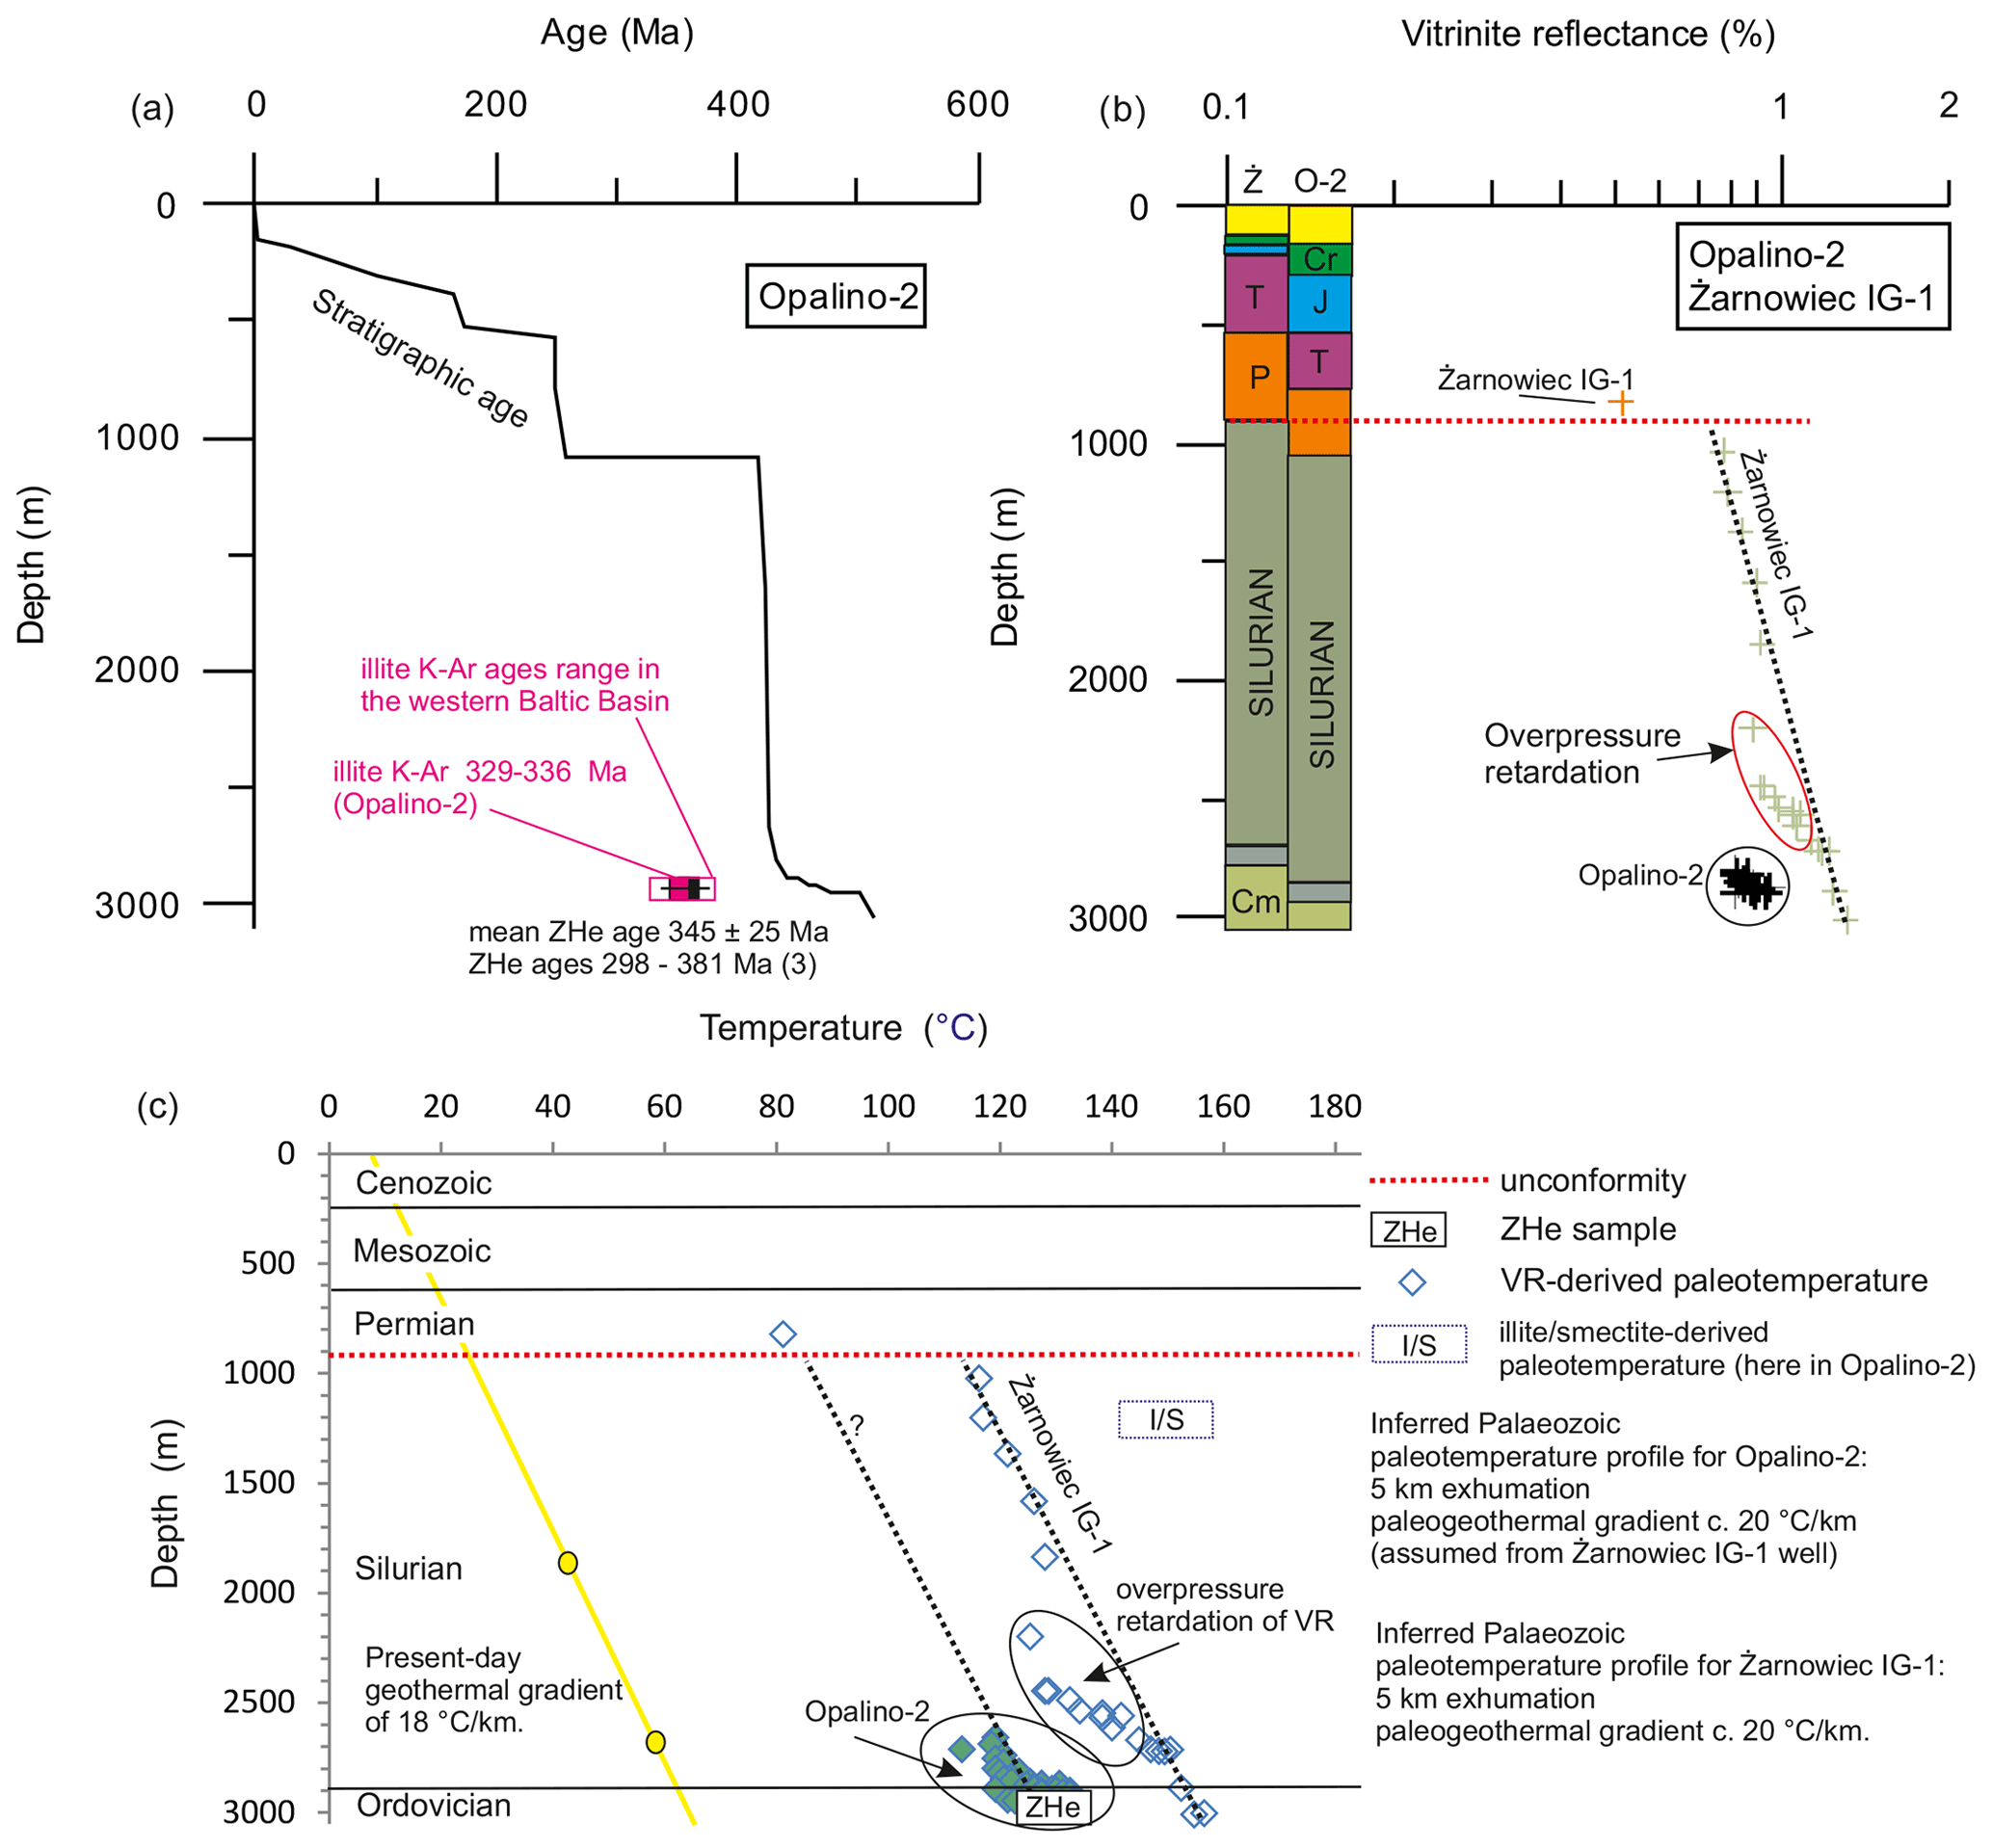
Figure 6Opalino-2 and Żarnowiec IG-1 borehole data (western part of the Baltic Basin). (a) ZHe ages are similar to K-Ar ages (Kowalska et al., 2019) and are younger than a depositional age of sample. (b) Opalino-2 (O-2) and Żarnowiec IG-1 (Ż) vitrinite reflectance (VR) profiles. The approach by Petersen et al. (2013) was used to recalculate reflectance measurements on vitrinite-like macerals from the lower Paleozoic strata into a standard vitrinite reflectance scale. Since the Opalino-2 VR profile is too short to define gradient and estimate exhumation, the adjacent well (Żarnowiec IG-1 VR) was used. The profile clearly shows overpressure retardation of thermal maturity, which occurs within the mudstone/claystone dominated Silurian section in most wells in the western Baltic Basin. The Żarnowiec IG-1 VR profile shows a break across the Silurian–Permian unconformity as a VR value is 0.5 % in Permian sediments. (c) Paleotemperature profile of the Opalino-2 (green diamonds) and Żarnowiec IG-1 (open blue diamonds) wells. The yellow line represents present-day geothermal gradient based on the corrected bottom hole temperature data (Górecki et al., 2006a, b). The paleogeothermal gradient of 20 ∘C km−1 in the Opalino-2 well, comparable to the present-day gradient and the paleogradient in the Żarnowiec IG-1 well, gives an exhumation of ≈ 4–5 km similar to that in the Żarnowiec IG-1 well.
5.3.2 Gołdap IG-1
Two samples, Proterozoic granite (B14) and Permian (Rotliegend) sandstone (B13), were taken from the Gołdap IG-1 borehole (Fig. 7a, Tables 1, 3). The older sample (B14) shows a younger AFT age (141 Ma) and lower MTL (12.0 µm with SD 1.5) compared to the younger early Permian sample (B13) – an AFT age of 167 Ma and MTL of 13.1 µm with SD 1.3. The VR value in the Permian rocks (≈ 0.4 % VR) give a maximum paleotemperature of 60 ∘C (Fig. 7), which is too low to cause a full reset of the AFT thermochronometer. Also, illite/smectite data suggest a similar paleotemperature below 70 ∘C (Kowalska et al., 2019). Furthermore, a temperature of 60 ∘C is consistent with limited sedimentary burial of sample B13 (e.g. Botor et al., 2019a). No episodes of significant Mesozoic exhumation are documented by the Gołdap IG-1 well, whose profile is full of sedimentary gaps but did not reveal any erosional unconformity. A significant discrepancy between VReq-derived paleotemperature (≈ 75 ∘C) and illite-/smectite-derived paleotemperature (160 ∘C) exists in the nearby Bartoszyce IG-1 well (Fig. 4). A similar discrepancy between the maximum paleotemperatures evaluated from illite/smectite and biomarkers was detected for the EEP by Derkowski et al. (2021). These authors interpreted a diagenetic pattern in the Ediacaran sediments of the EEP as the result of short-lasting pulses of potassium-bearing hot fluids, effectively promoting illitization in porous rocks without altering the organic matter (Derkowski et al., 2021). Correspondingly, we suggest that the reset of the AFT age in sample B13 was achieved in temperatures close to the upper limit of the apatite partial annealing zone in the presence of fluids. This interpretation is supported by paleotemperature profile of the nearby Bartoszyce IG-1 well, where a bell-shaped paleotemperature profile suggests transient fluid flow in Triassic rocks (Fig. 7d). The fluids' hypothesis does not explain resetting of the AFT age in sample B14, representing the crystalline basement. However, this sample, due to deeper burial, was subjected to a temperature of ≈ 75 ∘C in the Mesozoic. In the B14 sample, ZHe single-grain ages are dispersed in the range of 1216–799 Ma, suggesting no reheating in the Phanerozoic and temperatures below a helium partial retention zone (below 130 ∘C). An unconformity exists between the middle Cambrian sandstones and Ordovician (Arenig) mudstones that is characterized by a discontinuity of the VR profile. Since the latter is relatively short an assessment of paleogradient and exhumation (≈ 3 km) is uncertain and seems to be overestimated compared to regional data (Botor et al., 2019a). Another discontinuity of the VR profile occurs at the base Permian unconformity, indicating a pre-Permian cooling event (Fig. 7c).

Figure 7Gołdap IG-1 borehole data (eastern part of the Baltic Basin). (a) AFT ages vs. stratigraphic age in the Gołdap IG-1 well (ZHe age not to scale), (b) vitrinite reflectance (VR) profile in the Gołdap IG-1 well. (c) Paleotemperature profile: inferred Mesozoic profile (dotted blue line) shows no exhumation with paleogeothermal gradient of ≈ 45 ∘C km−1; inferred Ordovician–Silurian profile (dotted green line) shows 3 km exhumation with paleogeothermal gradient of 33 ∘C km−1. (d) Bartoszyce IG-1 paleotemperature profile – the bell-shaped curve (e.g. Ziagos and Blackwell, 1986) suggests transient fluid flow due to lateral migration in Triassic rocks. Significant discrepancy between VReq-derived paleotemperature (≈ 75 ∘C) and illite-/smectite-derived paleotemperature (I/S = 160 ∘); not to scale, data from Kowalska et al. (2019) exist in the upper part of Silurian strata that can be also caused by fluid flow. For other explanations, see Fig. 6.
5.3.3 Polik IG-1
The Ordovician bentonite (sample B36) from the Polik IG-1 borehole (Table 1) yielded a well-constrained ZHe mean age of 288 ± 6 Ma (Table 2; Fig. 8a). The Ordovician bentonite horizons gave also an illite K-Ar ages of 347–343 Ma (Kowalska et al., 2019), showing approximately the time of maximum paleotemperature. Therefore, the ZHe age probably represents cooling after the early Carboniferous thermal peak. A linear VR profile (Fig. 8b) shows a discontinuity across a base Permian unconformity between Ludlow (Silurian; 2.0 % VR) and Rotliegend (Permian; 0.8 % VR). Also, illite/smectite profile shows such a break (Kowalska et al., 2019). The paleogeothermal gradient of 35 ∘C km−1 was calculated for the late Paleozoic, the assessment implying exhumation of the Silurian–Devonian, and likely lowest Carboniferous strata by 5.6 km (Fig. 8c). This estimate agrees with the maturity modelling results by Botor et al. (2019a). The inferred Mesozoic temperature profile for the Polik IG-1 borehole suggests 700 m of exhumation experienced by the late Mesozoic strata and paleogeothermal gradient of 23 ∘C km−1, similar to the present-day gradient of 24 ∘C km−1 (Fig. 8c).
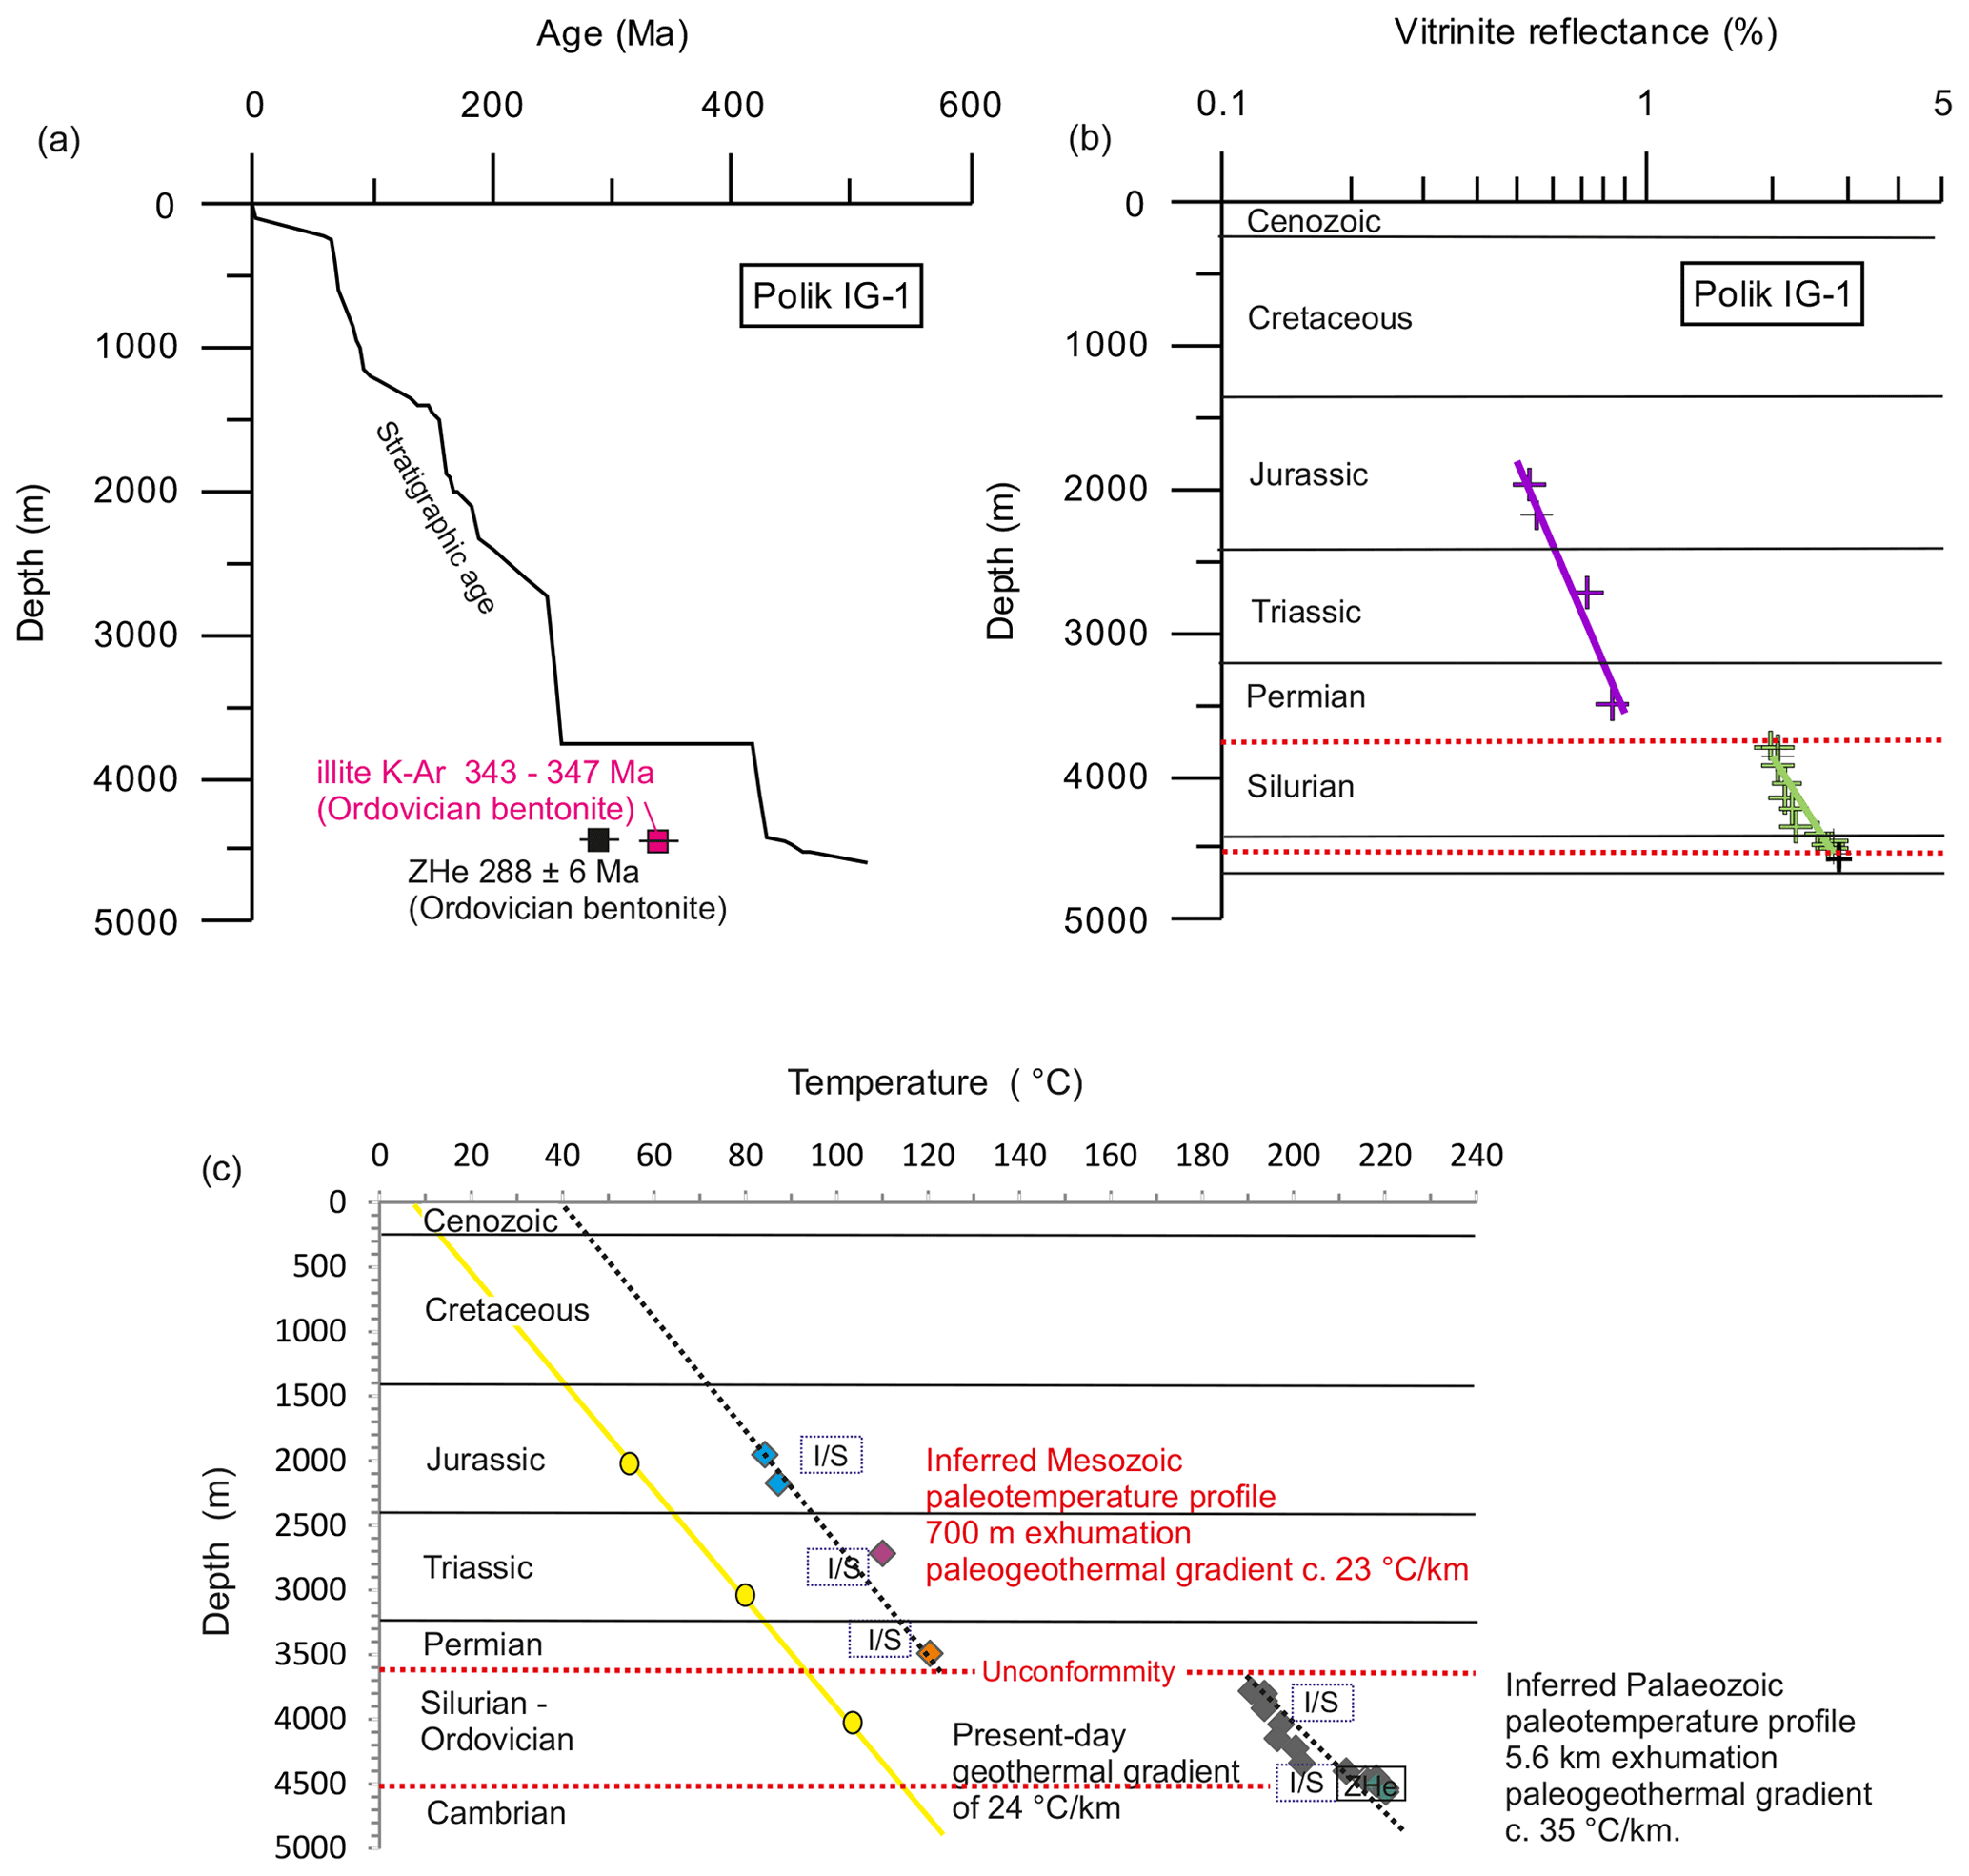
Figure 8Polik IG-1 borehole data (SW part of the Baltic Basin). (a) Thermochronological data vs. stratigraphic age, (b) vitrinite reflectance (VR) profile, (c) paleotemperature profile. Note a thermal maturity break at the unconformity between the Permian–Mesozoic and Silurian. Other explanations are as in Figs. 6 and 7.
5.3.4 Tłuszcz IG-1
Two sandstone samples, B44 (Triassic) and B45 (Cambrian), were collected from the Tłuszcz IG-1 borehole (Tables 1–3; Fig. 9a). In both samples, AFT ages are younger than depositional ages and track lengths are shortened (Table 3). Sample B45 has a broader fission track distribution with a 1.9 µm standard deviation that suggests reheating or longer stay in the apatite partial annealing zone. Single ZHe ages from the B45 sample are in the range of 1088–292 Ma, indicating partial reset. Based on the difference in sensitivity of the helium system in zircons (130–220 ∘) and fission tracks in apatites (60–120 ∘C), it can be concluded that sample B45 was exposed to a maximum paleotemperature of about 120–130 ∘C. A nonlinear VR profile of the Tłuszcz IG-1 borehole is similar to that in the Siedliska IG-1 well (Fig. 10b), suggesting a fluid flow event (e.g. Ziagos and Blackwell, 1986). There are no Carboniferous strata in the Tłuszcz IG-1 borehole, where a base Permian unconformity incises upper Silurian sediments (Fig. 9). At the bottom of the Permian–Mesozoic succession, paleotemperature was relatively high, reaching ≈ 90 ∘C in Permian sediments. The illite/smectite data indicate ≈ 120 ∘C at the top of the Silurian strata that is higher than the VR-derived paleotemperature, the relationship indicative of possible fluid flow influence (Fig. 9c). Alternatively, the gap between the VR- and illite-/smectite-derived paleotemperatures might be the effect of contamination by detrital illite. However, in such a case, the results should be highly incoherent, whereas in the Tłuszcz IG-1 and other studied boreholes the VR-derived paleotemperatures are consistently lower than those calculated based on illite/smectite data.

Figure 9Tłuszcz IG-1 borehole data (Podlasie Basin). (a) Thermochronological data vs. stratigraphic age, (b) VR profile, (c) paleotemperature profile. Note a thermal maturity break at the unconformity between the Permian–Mesozoic and Silurian. The Mesozoic paleotemperature profile shows 700 m of exhumation with a paleogeothermal gradient of 34 ∘C km−1. The inferred Paleozoic paleotemperature profile shows 4.5 km of apparent exhumation with a paleogeothermal gradient of 16 ∘C km−1. A nonlinear VR profile suggests a fluid flow event. Other explanations are as in Figs. 6 and 7. Illite K-Ar ages from Silurian bentonites are 334–311 Ma (mid-late Carboniferous) in the adjacent Goździk OU-1 well (Kowalska et al., 2019).
5.3.5 Siedliska IG-1
Bashkirian (upper Carboniferous) sandstone sample B38 (Table 1) yielded an AFT central age of 198 Ma (MTL 11.6 ± 1.7 µm – Table 3). This result shows the importance of a late to post-Carboniferous thermal event for thermal maturity of Paleozoic succession in the area. There is a regional unconformity and stratigraphic gap between the upper Carboniferous (Moscovian) and Middle Jurassic. A non-linear VR profile below the unconformity (Fig. 10) shows that fluid flow may have contributed to maturation of organic matter (e.g. Ziagos and Blackwell, 1986). A discontinuity in the vitrinite reflectance profile exists at the unconformity since thermal maturity of Mesozoic strata is below 0.5 % VR (Fig. 10). Due to a non-linear VR profile, an assessment of post-Carboniferous exhumation might be overestimated, and it is not attempted herein.
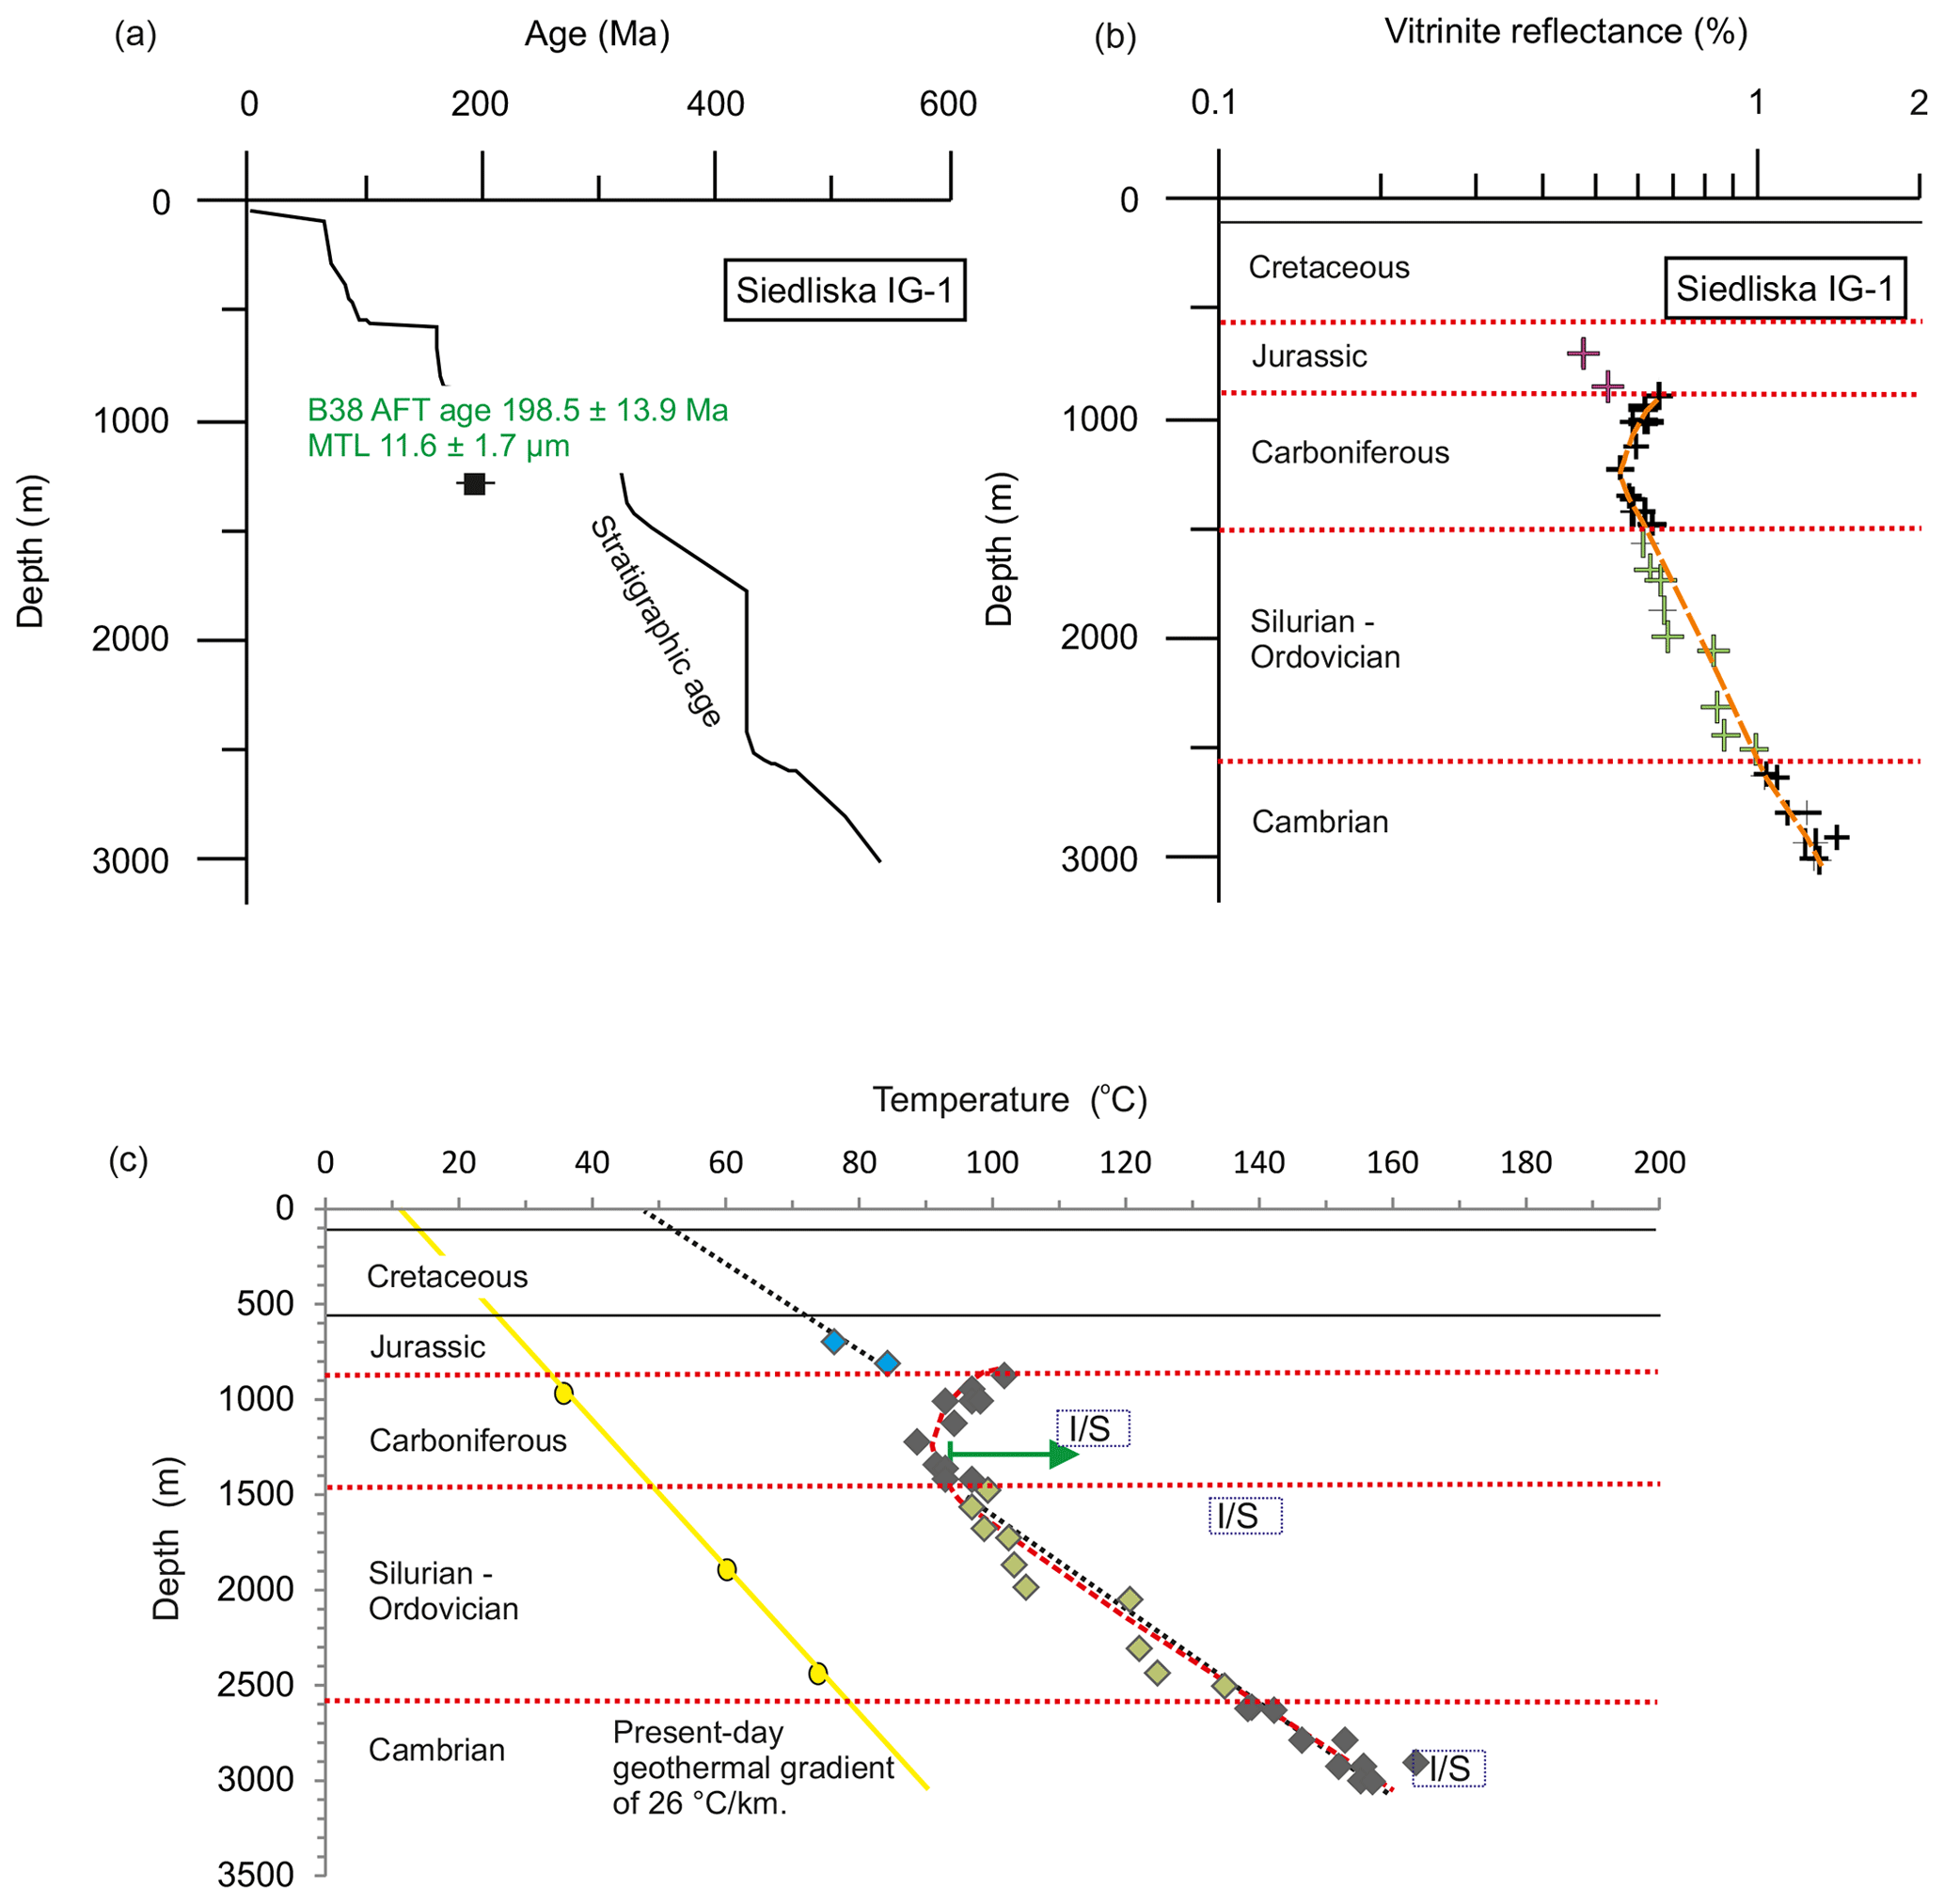
Figure 10Siedliska IG-1 borehole data (Lublin Basin). (a) Thermochronological data vs. stratigraphic age, (b) VR profile, (c) paleotemperature profile. VR and paleotemperature profiles suggest that the fluid flow event is responsible for the pattern revealed. Other explanations are as in Figs. 6 and 7. Illite K-Ar ages from Silurian bentonites are 344–336 Ma (early Carboniferous) in the adjacent Wojcieszków-1 well (Kowalska et al., 2019).
5.3.6 Łopiennik IG-1
Sample B19 was collected from the bottom of the Viséan succession (Table 1, Fig. 5b) in the Łopiennik IG-1 borehole that is located in the Lublin Basin (Figs. 1, 4). Five zircons were dated in this sandstone sample by means of the ZHe method. An average ZHe age of this sample is 287 Ma after omitting the single-grain age that is older than a stratigraphic age (562 Ma; Table 2, Fig. 11a). The VR value of 1.0 % for sampled depth shows a maximum paleotemperature of ≈ 140 ∘C, suggesting only partial reset of the ZHe age (Fig. 11b). The Ediacaran to Carboniferous VR profile allows us to estimate VR and paleogeothermal gradients for the late Paleozoic (Fig. 11b, c). Although no VR data exist in the upper part of Carboniferous and Mesozoic sections of the profile, average VR values in the adjacent wells are ≈ 0.8 %–1.0 % and 0.45 % VR–0.55 % VR for the uppermost Carboniferous and Jurassic–Cretaceous strata, respectively (Botor et al., 2002, 2019a; Grotek, 2005). The Paleozoic and Mesozoic parts of the profile are separated by an unconformity between Carboniferous (Namurian C, Bashkirian) and Middle Jurassic. The illite/smectite and VR data indicate similar paleotemperatures (Kowalska et al., 2019). A linear gradient of VR data with fitting for Paleozoic (R2=0.80) allows us to estimate post-Namurian exhumation at 3700 m (assuming 0.2 % VR as an initial value). Alternatively, it can be calculated from a paleogeothermal gradient (24 ∘C; R2=0.89) that a 4300 m thick pile of the sediments was removed, assuming 20 ∘C as a surface temperature from the late Carboniferous to Early Jurassic (Fig. 11c). Both estimates are similar to that from maturity modelling based on the VR and porosity data (Botor, 2018; Botor et al., 2019a). However, assuming overpressure retardation in Silurian sediments, a paleogeothermal gradient of 23 ∘C would suggest exhumation up to 7 km (Fig. 11c).

Figure 11Łopiennik IG-1 borehole data (Lublin Basin). (a) Thermochronological data vs. stratigraphic age, (b) VR profile, (c) paleotemperature profile. Mesozoic VR data from the Siedliska IG-1 and Potok IG-1 boreholes are from the Middle–Upper Jurassic sediments (sampling depth is not to scale). Carboniferous VR data change rapidly in a short profile section, and different VR and paleogeothermal gradients can be established. Other explanations are as in Figs. 6 and 7.
5.3.7 Lubycza Królewska-1
Bentonite sample LK1/1 was collected from the upper Silurian strata in the Lubycza Królewska-1 borehole in the southern part of the Lublin Basin (Tables 1–3, Figs. 1, 4, 12). Single-grain ZHe ages are 293, 253, and 219 Ma, giving a late Permian mean ZHe age of 255 Ma with standard error of 22 Ma. There are no AFT data for this sample, but the second upper Silurian sample LK1/2 gives an AFT central age of 178 ± 67.5 Ma, based on three apatite grains (Table 3, Fig. 12a). A low precision of this age is demonstrated by a large 1σ error. The timing of a maximum paleotemperature in the studied samples can be estimated based on illite K-Ar ages of 298–272 Ma (Kowalska et al., 2019). A short time gap between K-Ar ages and ZHe ages suggests a rapid decrease of temperature and can be related to late Carboniferous to early Permian rapid uplift. A pre-Middle Jurassic unconformity splits the VR profile into the matured Paleozoic part (≈ 1.7 % VR–2.0 % VR) and the immature (below 0.65 % VR) Mesozoic part (Fig. 12b). The Mesozoic and Paleozoic VR profiles are shifted relative each other across the unconformity. The VR profile break suggests significant exhumation between the Silurian and Middle Jurassic. The LK1/1 sample, showing Permian ZHe ages, was heated up to ≈ 180 ∘C according to the VR data (Table 1). However, the inferred Paleozoic paleotemperature profiles of the Lubycza Królewska-1 and Narol IG-1/PIG-2 boreholes show unrealistic ≈ 11 km exhumation with a paleogeothermal gradient of ≈ 13 ∘C km−1. The measured VR profile is too short to confidently define a paleogeothermal gradient, and thus the tentatively calculated 11 km exhumation is probably overestimated (Fig. 12).
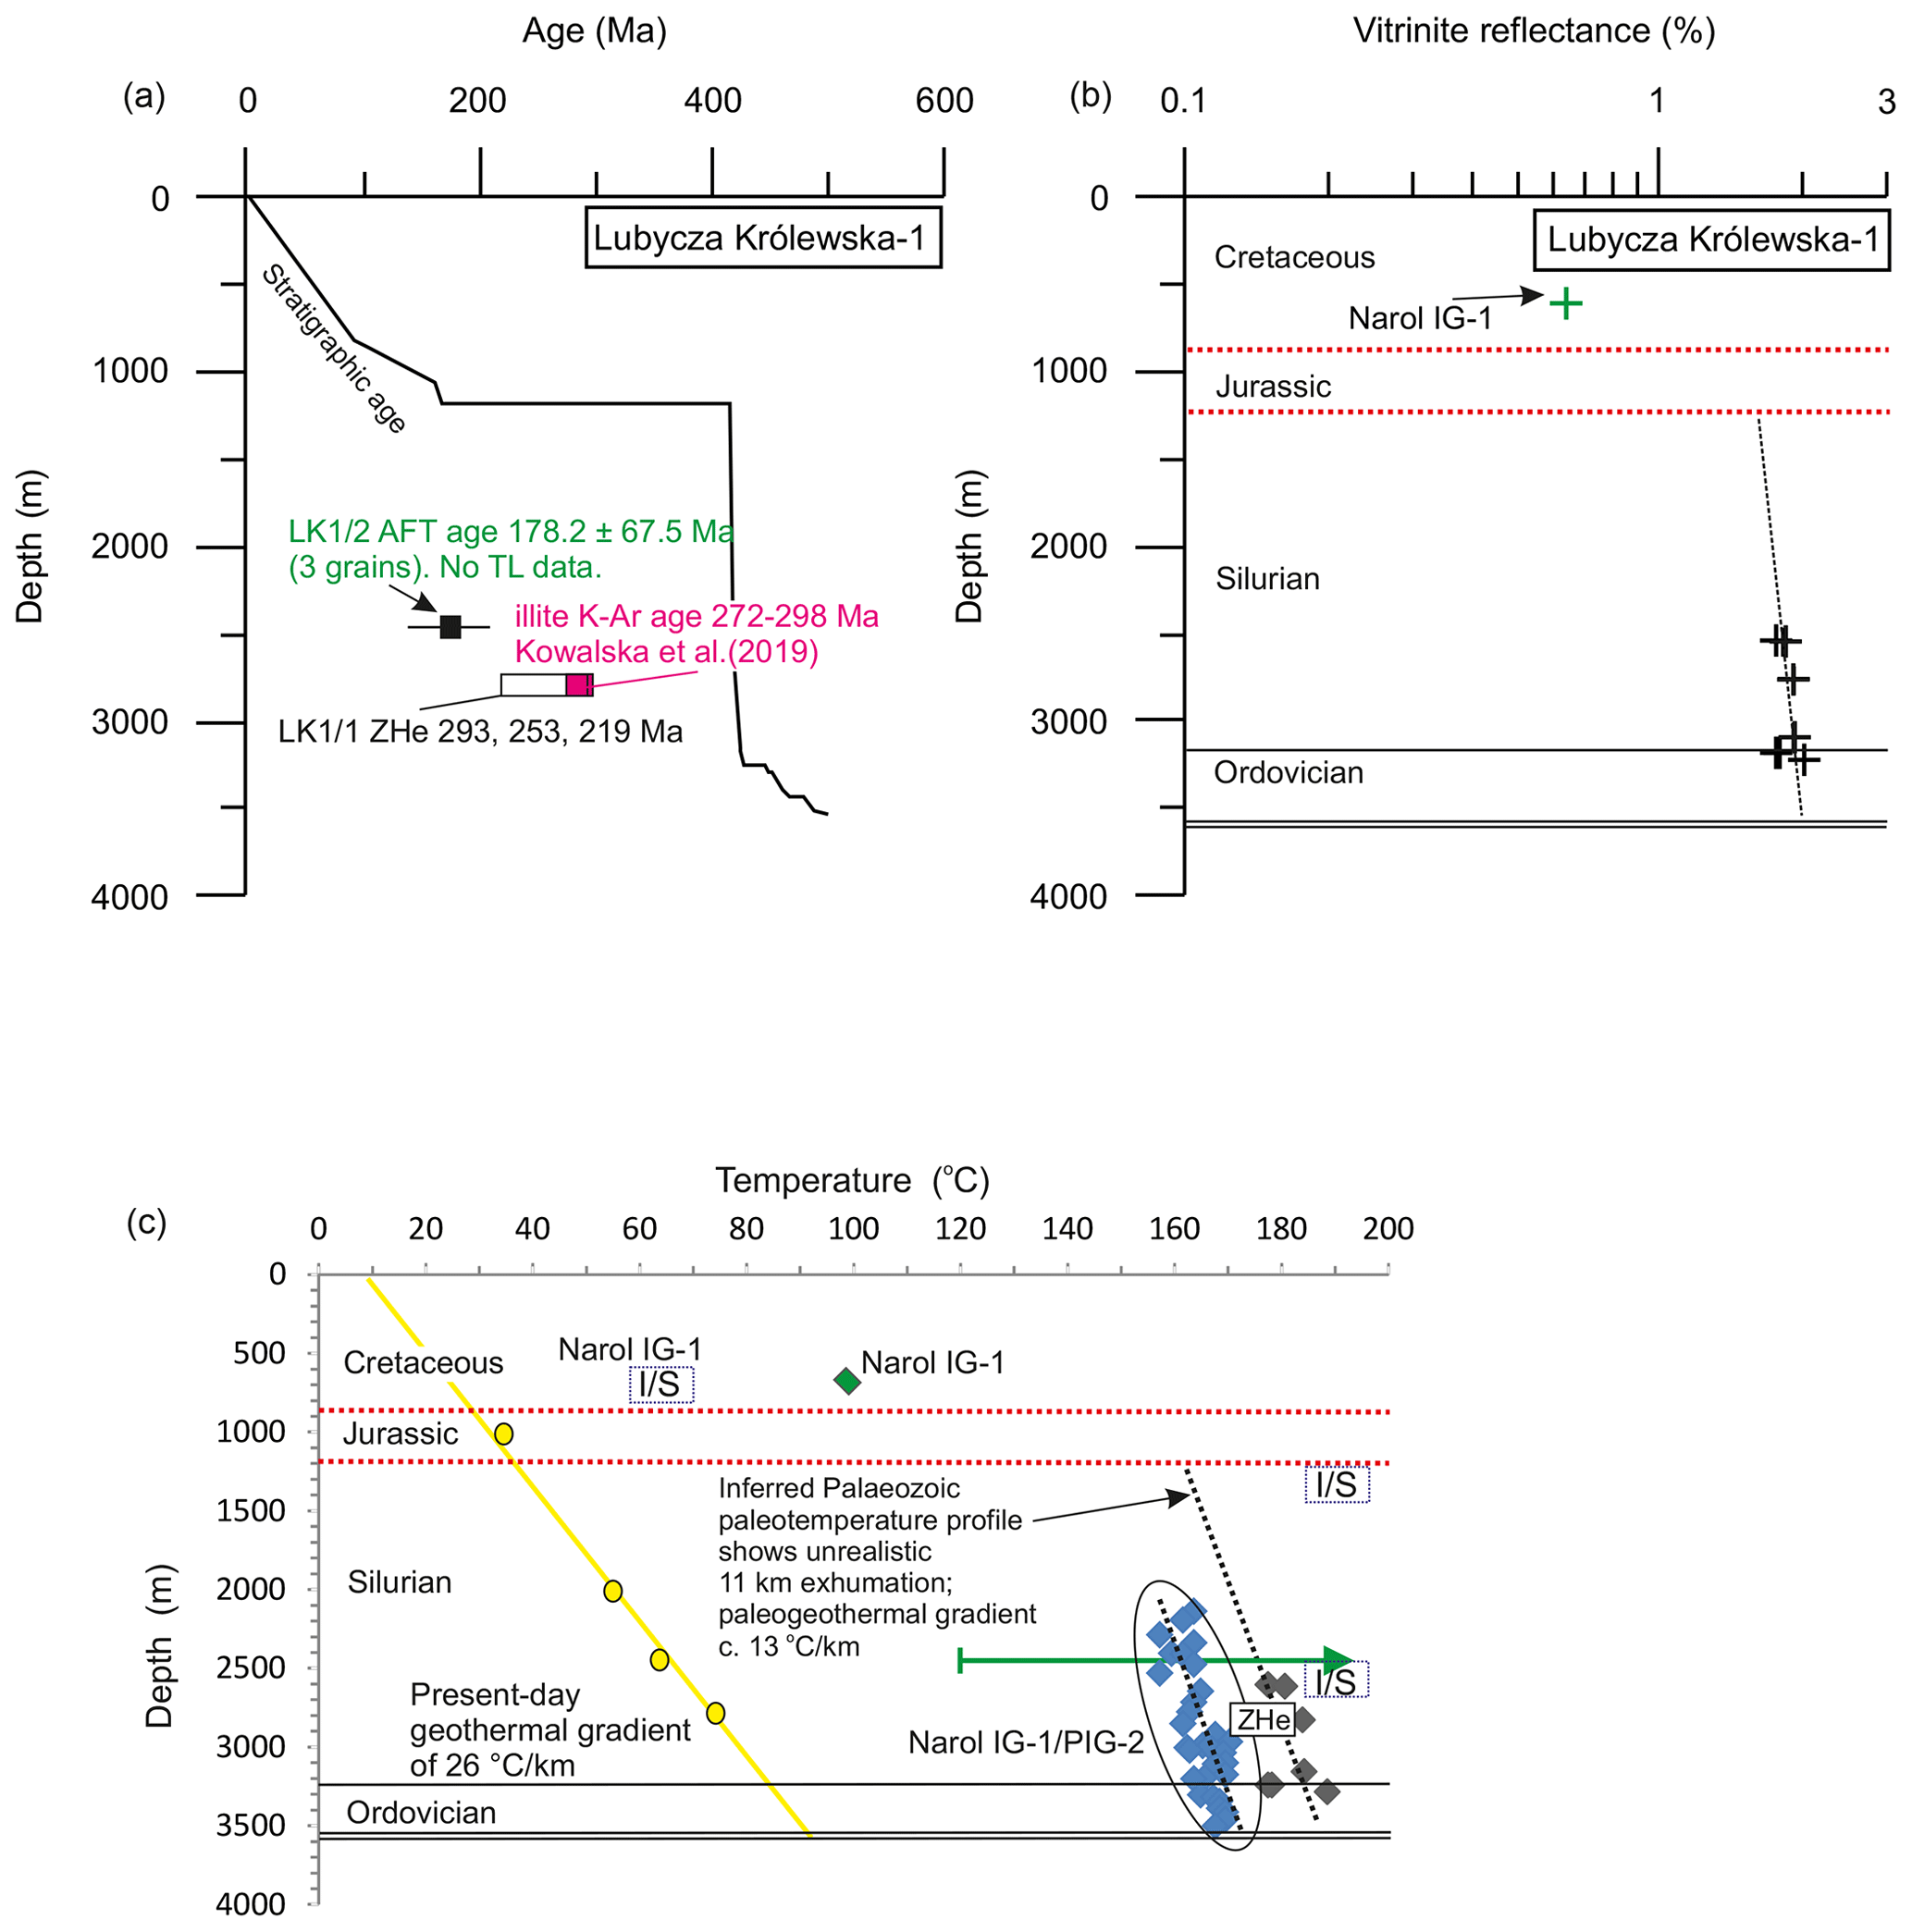
Figure 12Lubycza Królewska-1 borehole data (Lublin Basin). (a) Thermochronological data vs. stratigraphic age, (b) VR profile, (c) paleotemperature profile. Other explanations are as in Figs. 6 and 7. VR and illite/smectite (I/S) data from the Narol IG-1/PIG2 boreholes are not to scale. A thermal maturity break exists between the Mesozoic and Paleozoic. VR data from the Narol IG-1/PIG2 boreholes show a similar paleogeothermal gradient to that in the Lubycza Królewska-1. The inferred Paleozoic paleotemperature profile of the Lubycza Królewska-1 borehole shows an unrealistic 11 km of exhumation with a paleogeothermal gradient of 13 ∘C km−1.
5.4 Thermal modelling
Samples yielding the best quality analytical results were chosen for thermal history modelling by means of the HeFTy software (Ketcham, 2005; Ketcham et al., 2007b). For sedimentary samples, the beginning of the t–T paths was defined by an annual mean temperature estimated for the time of deposition (≈ 25 ± 5 ∘C). For sample B14 of Proterozoic granitoid, a starting point of modelling was assumed at the transition from Ediacaran to Cambrian since early Cambrian sedimentary rocks, overlying basement, confirm a near-surface temperature of ≈ 25 ± 5 ∘C at the that time (Table 1). The end of t–T paths in both cases (sedimentary and crystalline samples) was defined by an average present-day temperature at a sampling depth (Table 1 and 4). A contemporary temperature in the analysed boreholes is much lower than the sensitivity range of the thermochronological method. Thus, temperature fluctuations of ±10 ∘C in the boreholes from the study area that were reported in the paper by Szewczyk and Gientka (2009) do not affect the results obtained. In the HeFTy modelling, the t–T constrained boxes were based on burial history (Fig. 5; Botor et al., 2019a), calibrated by thermal maturity data and geological evidence, i.e. unconformities (Table 1). The temperature range of 60–200 ∘C was established based on sensitivity of both AFT and ZHe systems. Time windows for constrained boxes corresponded to subsidence periods limited by regional unconformities. Input data and results of thermal modelling are provided in Table 4. Except for the B47 sample (Jurassic sandstone, Tyniewicze IG-1) and B39 sample (Permian sandstone, Słupsk IG-1), the AFT and ZHe ages are considerably younger than the age of deposition. Therefore, we did not consider a pre-depositional thermal history of the detrital grains. The thermal modelling results are compiled in Fig. 13, where the best-fit results are shown. High GOF values (0.90 to 1.00) suggest that the resulted time–temperature (t–T) paths are plausible.
Table 4Basic data and results applied in the thermal modelling.
Temp. present-day temperature in the well (from Table 1). Temp.1: max. paleotemperature from organic maturity data (from Table 1). Temp.2: max. paleotemperature from HeFTy modelling. a Sample B9 in adjacent well (Bodzanów IG-1), b from illite/smectite data (Kowalska et al., 2019). LK1: Lubycza Królewska-1 well; c sample LK1/2.
5.4.1 Baltic Basin
In the western part of the Baltic Basin, thermal modelling was performed for the O2/2 sample (Upper Ordovician bentonite; Tables 1–3, Fig. 1) from the Opalino-2 borehole using ZHe data only and based on the assumption of a positive correlation between effective uranium (; in ppm) and ZHe single-grain ages. Constrained boxes for the O2/2 sample were established to represent following regional subsidence and heating events: development of a Caledonian foreland basin (450–400 Ma), subsidence of the passive Laurussian margin (370–320 Ma), Variscan shortening and subsequent continental rifting (300–240 Ma), renewed tectonic subsidence of the Permian–Mesozoic basin (220–160 Ma), and tectonic inversion of the Permian–Mesozoic basin (100–60 Ma). The resultant model (Fig. 13a) shows a maximum temperature in earliest Carboniferous, probably due to burial beneath a Caledonian foreland basin and Devonian passive margin cover as suggested by geological evidence (e.g. Narkiewicz, 2007). Although details of the best-fit curve are difficult to verify due to the missing upper Paleozoic sedimentary record, both the weighted mean path and best-fit curve indicate an important exhumation event in the early Carboniferous (360–330 Ma). This is consistent with the illite K-Ar ages (360–322 Ma) from the same area (Kowalska et al., 2019). Subsequent Variscan shortening had a little impact on the thermal model in accord with a tectonic setting of the Opalino-2 well that is located beyond the Variscan deformation front (Fig. 1). In its late Carboniferous–Mesozoic section, the best-fit curve suggests limited middle to late Mesozoic reheating. This corollary is difficult to verify due to the lack of AFT data. Finally, the model shows acceleration of cooling coeval with the tectonic inversion of the Permian–Mesozoic basin.
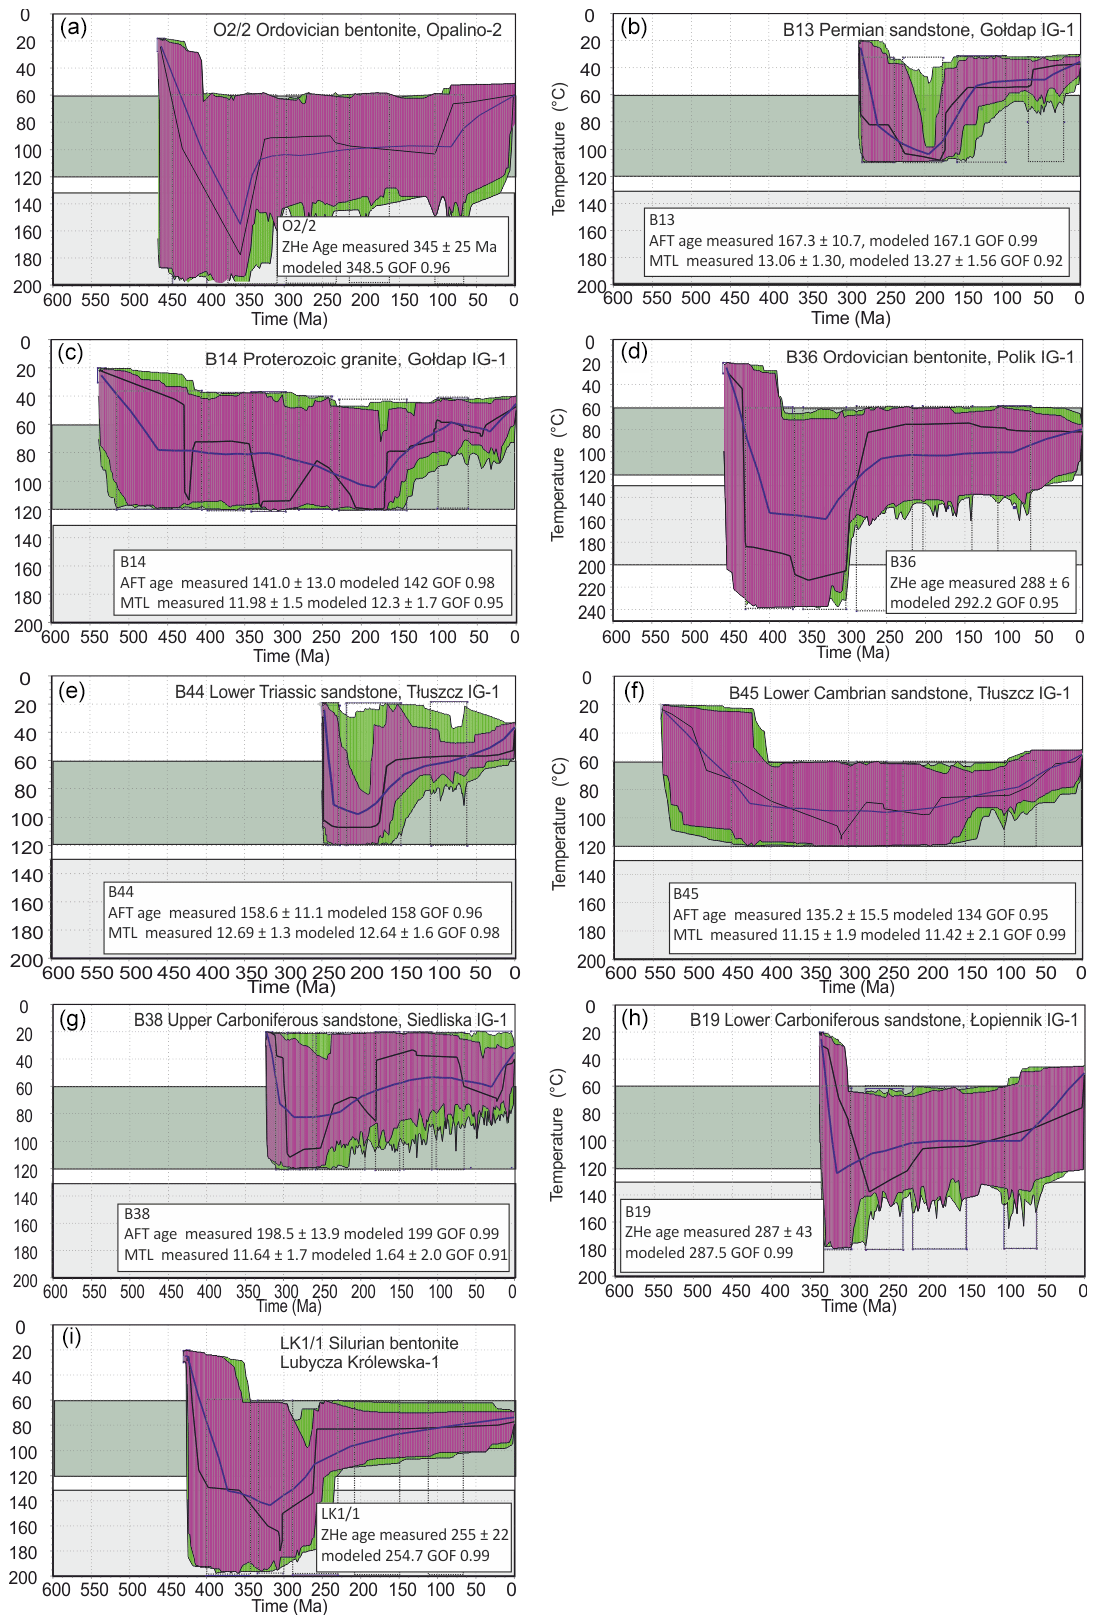
Figure 13Thermal modelling results from HeFTy software (Ketcham, 2005). The light green range corresponds to the envelope of thermal paths with acceptable fit (GOF > 0.05); the magenta range shows the envelope for thermal paths with good fit (GOF > 0.5). The bold dark blue curve shows weighted mean path, whereas thin black line is the best-fit curve. Black rectangles correspond to constrained boxes. Grey rectangles show apatite partial annealing zone (60–120 ∘C) and zircon partial retention zone (130–200 ∘C). Further explanations are in the text.
In the eastern part of the Baltic Basin, the thermal maturity of lower Paleozoic strata is one of the lowest in the Polish part of the EEP (Table 1; Fig. 4; Grotek, 2006, 2016; Pletsch et al., 2010). The sedimentary cover on the crystalline basement is the thinnest across the study area. Two samples were analysed in the Gołdap IG-1 borehole: Permian sandstone B13 and Proterozoic granitoid B14 (Table 1, Fig. 1). Since a negative correlation between eU and ZHe single-grain ages in the B14 sample did not allow for helium data modelling (Green and Duddy, 2018), only AFT data were used. Constrained boxes for sample B13 (Fig. 13b) represent consecutive subsidence and thermal events: a time period following continental rifting and initiation of the Permian–Mesozoic basin (290–240 Ma), two periods of renewed Mesozoic subsidence (230–180 and 160–100 Ma), and inversion of the Permian–Mesozoic basin (70–30 Ma). The model shows progressive heating up to 100 ∘C until 200–190 Ma (earliest Jurassic). This temperature is higher than that predicted by VR and illite/smectite data (≈ 60–70 ∘C); (Kowalska et al., 2019). Therefore, we interpret early Mesozoic heating as a cumulative effect of increasing sedimentary burial and transient fluid flow in the late Permian and Triassic. The latter effect is confirmed by a bell-shaped paleotemperature profile in the nearby Bartoszyce IG-1 borehole (Fig. 7d). Consequently, the model predicts cooling after cessation of fluids' influence for the remaining part of the Mesozoic and Cenozoic despite continued subsidence and sedimentation. Importantly, Mesozoic–Cenozoic sedimentary cover is thin and discontinuous. For instance, the Lower–Middle Jurassic sediments, corresponding to the time of the fastest cooling predicted by the model, are 100 m thick, and their impact on a thermal state of the B13 sample was probably negligible. The total thickness of post-Triassic sediments in the Gołdap IG-1 borehole is 675 m, a sedimentary pile that generates a temperature increase of 15.5 ∘C under the present-day geothermal gradient (23 ∘C km−1). At the same time, sample B13 from a depth of 1075 m was exposed to a present-day temperature of 35 ∘C (Table 1, Fig. 7). Regardless of whether sample B13 was subjected to a maximum paleotemperature of 60–70 ∘C (VR and illite/smectite data) or ≈ 100 ∘C, as predicted by the thermal model (Fig. 13b), a post-Triassic period was the time of net cooling (down to 35 ∘C) despite ongoing sedimentation. We built a model for sample B14 (Fig. 13c) starting from the earliest Cambrian (540 Ma) with a near-surface temperature of 20–40 ∘C, as the B14 sample was taken 20 m below the Cambrian unconformity (Fig. 7; Table 1). Constrained boxes for this model were at 520–410 Ma (Baltica passive margin and Caledonian foreland basin), 400–350 Ma (Laurussian passive margin), 340–300 Ma (time equivalent of the Variscan orogeny), 280–240 Ma (an initial stage of the Permian–Mesozoic basin starting from continental rifting), 230–140 Ma (subsidence of the Permian–Mesozoic basin), and 100–70 Ma (inversion of the Permian–Mesozoic basin). The weighted mean path of the model shows a maximum temperature in the earliest Jurassic (Fig. 13c), similarly to model B13 (Fig. 13b), and subsequent cooling. This phenomenon was already discussed above in relation to sample B13. The weighted mean path of the model predicts a maximum paleotemperature of 100 ∘C for the earliest Jurassic, i.e. 25 ∘C more than suggested by the Permian–Mesozoic geothermal gradient (75 ∘C). This difference might be related to the influence of fluids. The best-fit curve reveals several details that cannot be directly verified due to incomplete sedimentary record: (1) a thermal peak in the latest Silurian potentially related to burial by a Caledonian foreland basin, (2) a thermal peak in early Carboniferous related to burial or increased heat flow (magmatism), and (3) early Mesozoic thermal peak related to burial beneath Permian–Mesozoic basin and supposed transient fluid flow. Sample B14 left the apatite partial annealing zone (141.0 ± 13.0 Ma) after sample B13 (167.3 ± 10.7 Ma), which was located shallower in a sedimentary section.
5.4.2 Podlasie Basin
Thermal modelling for the B36 sample (Upper Ordovician bentonite, Polik IG-1) was performed based on ZHe results as no AFT data were available (Fig. 13d). All three zircons dated have a similar eU content up to 100 ppm and their mean ZHe age reveals low standard error (Table 2). A distinct break in thermal maturity profile (Fig. 8) proves that a maximum paleotemperature was achieved in the pre-Permian time. The VR-derived maximum paleotemperature calculated for sample B36 is 215 ∘C (Table 1). Constrained boxes in the model were set at 440–390 Ma (Caledonian foreland basin), 360–300 Ma (Laurussian passive margin and Variscan shortening), 290–230 Ma (initial stage of the Permian–Mesozoic basin), 200–140 Ma (further subsidence of the Permian–Mesozoic basin), and 100–60 Ma (inversion of the Permian–Mesozoic basin). The weighted mean path shows an increase of temperature until ≈ 420 Ma, corresponding to burial beneath a Caledonian foreland basin and fast cooling in the Carboniferous (starting 340–330 Ma). The latter must have been related to extensive exhumation as demonstrated by a significant break in the paleotemperature profile across the base Permian unconformity (Fig. 8). The best-fit curve reveals a thermal peak at 350 Ma (earliest Carboniferous), the effect that may have been related not only to burial but also increased heat flow (magmatism). A maximum paleotemperature in the early Carboniferous is consistent with the illite K-Ar ages obtained from Ordovician bentonites (347–343 Ma; Kowalska et al., 2019). The weighted mean path of the model suggests that the Mesozoic was the time of thermal stability with only minor acceleration of cooling at the time of the Permian–Mesozoic basin inversion (Fig. 13d).
In the Tłuszcz IG-1 borehole, two samples were analysed. Thermal modelling for sample B44 (Lower Triassic sandstone; Fig. 13e) was performed using constrained boxes for Triassic basin subsidence (250–230 Ma), further Mesozoic subsidence (220–150 Ma), and Permian–Mesozoic basin inversion (100–60 Ma). A thermal peak of 100 ∘C is predicted by the weighted mean path of the model for the earliest Jurassic (≈ 200 Ma). This is close to a VR-based paleotemperature of 90 ∘C in Permian sediments (Fig. 9). The post-Early Jurassic period was the time of gradual cooling despite ongoing sedimentation as already discussed above (model B13). The overlying sedimentary pile generated temperature of ≈ 50–55 ∘C, using the Mesozoic geothermal gradient, which is less than the 90 ∘C noted in the Permian strata (Karnkowski, 2003). A present-day temperature at a depth of sample B44 is only 36 ∘C (Table 1). Therefore, the Mesozoic was the time of net cooling that was enhanced by 700 m of exhumation calculated for the Permian–Mesozoic profile (Fig. 9).
Thermal modelling of sample B45 (lower Cambrian sandstone) was performed using AFT data only, because the e–U trend is unclear (Table 2). Constrained boxes were set at 450–400 Ma (subsidence of a Caledonian foreland basin), 370–300 Ma (subsidence and shortening of the Variscan foreland), 290–250 Ma (initial subsidence of the Permian–Mesozoic basin), 230–150 Ma (further subsidence of the Permian–Mesozoic basin), and 100–60 Ma (Permian–Mesozoic basin inversion). The model predicts heating until 420 Ma (Fig. 13f), the result probably related to burial beneath a Caledonian foreland basin. Although the weighted mean path of the model does not show a clear temperature peak in the late Paleozoic, the best-fit curve indicates a thermal peak of 110 ∘C at 310 Ma (Fig. 13f). This prediction is in accord with a VR-derived paleotemperature of 116 ∘C (Table 1). The thermal peak corresponds to a big erosional gap between the Silurian and Permian as well as a break in the paleotemperature profiles between the lower Paleozoic and Permian–Mesozoic strata (Fig. 9). In the post-Carboniferous period, the model shows cooling down to a present-day temperature of 55 ∘C.
5.4.3 Lublin Basin
Thermal modelling was performed for upper Carboniferous (Bashkirian) sandstone sample B38 that was collected from the Siedliska IG-1 borehole (Figs. 1, 4). In the model for sample B38 (Fig. 13g), constrained boxes were set to represent a few succeeding subsidence and thermal events: Variscan shortening and subsequent continental rifting (320–260 Ma), subsidence of the Permian–Mesozoic basin (255–195 Ma), two periods of further subsidence (180–150 and 145–110 Ma), and Permian–Mesozoic basin inversion (100–60 Ma). The model shows a temperature peak of 80 ∘C (the weighted mean path) in the latest Carboniferous–earliest Permian. This is less than VR-derived paleotemperature in the range of 90–100 ∘C (Fig. 10). However, the best-fit curve reveals a maximum temperature of ≈ 110 ∘C for roughly the same age range. The latest Carboniferous–earliest Permian thermal peak is consistent with a big erosional gap between the Carboniferous and Jurassic and a break of the paleotemperature profile (Fig. 10). The thermal peak was followed by gradual cooling through the Mesozoic and Cenozoic down to the present-day temperature of 35 ∘C.
A positive correlation between e–U and ZHe ages in sample B19 of Carboniferous sandstone from the Łopiennik IG-1 borehole favours thermal modelling despite the lack of AFT data. Modelling was carried out for a single zircon grain (B-19z4) due to dispersion of the ZHe ages (Table 2, Fig. 13h). Four constrained boxes were used in the model: 340–300 Ma (subsidence and subsequent shortening of the Variscan foreland), 280–240 Ma (initial subsidence of the Permian–Mesozoic basin), 230–150 Ma (further subsidence of the Permian–Mesozoic basin), and 100–60 Ma (Permian–Mesozoic basin inversion). The weighted mean path of the model reveals rapid heating until a thermal peak at 320 Ma. The best-fit curve predicts a thermal peak in the early Permian (280 Ma). The results are consistent with a big erosional gap between the Carboniferous and Upper Jurassic as well as a major break in the paleotemperature profile across the unconformity (Fig. 11). The post-early Permian time was characterized by a gradual cooling with some acceleration at the time of the Permian–Mesozoic basin inversion (Fig. 13h).
For modelling of sample LK1/1 (Silurian bentonite; Fig. 13i), the following constrained boxes were assumed: (1) post-Caledonian subsidence (400–350 Ma), (2) Variscan subsidence and shortening (340–300 Ma), (3) initial subsidence of the Permian–Mesozoic basin (290–240 Ma), and (4) further subsidence of the Permian–Mesozoic basin (230–150 Ma), and Permian–Mesozoic basin inversion (100–60 Ma). The weighted mean path indicates a thermal peak of 140 ∘C at ≈ 320 Ma. The best-fit curve points to thermal peak of 180 ∘C at ≈ 300 Ma. The latter modelled temperature is consistent with a VR-derived paleotemperature of 175 ∘C (Fig. 12). Furthermore, an age of ≈ 300 Ma is close to the illite K-Ar ages of 298–272 Ma from the same borehole (Kowalska et al., 2019). The latest Carboniferous thermal peak is consistent with a major erosional gap between Carboniferous and Jurassic in the Lubycza Królewska borehole and an important break of the paleotemperature profile across the unconformity (Fig. 12). The thermal peak is followed by gradual cooling through Mesozoic and Cenozoic down to the present-day temperature of 65 ∘C (Fig. 13i).
Characteristic features of the SW slope of the East European Platform in Poland include an increasing thickness of sediments towards the TTZ and an erosional unconformity at the top of the lower Paleozoic. An exception is the Lublin Basin, where the unconformity is at the top of Devonian (e.g. Narkiewicz, 2007). Another regional unconformity is located at the base of Permian to Jurassic strata. However, in the area, where Devonian and Carboniferous strata are missing (Fig. 14), there is only one major unconformity between the lower Paleozoic and Permian. These unconformities must represent a succession of major tectonic events, but separation of their effects is impossible without thermal maturity and thermochronological data due to an incomplete sedimentary record.
6.1 Thermochronological constraints
The SW-ward increase of the total sediment thickness on the slope of the EEP has been well known for decades based on borehole and seismic data (e.g. Młynarski, 1982; Poprawa and Pacześnia, 2002; Mikołajczak et al., 2019). Thermal maturity results are consistent with this trend (Fig. 4) since the highest paleotemperatures, based on VR data, are recorded in those boreholes that are located close to the TTZ (Table 1; Figs. 1, 4). Consequently, the only ZHe ages that may represent fully reset zircons are those obtained from the Polik IG-1 borehole (Table 2) in agreement with the VR-derived pre-Permian paleotemperature of 217 ∘C (Fig. 8). An early Permian ZHe mean age of 288 Ma corresponds to cooling below the ZHe closure temperature of 130 ∘C, the corollary consistent with the illite-/smectite-derived paleotemperature (Fig. 8). The remaining ZHe ages represent partial reset or source ages (Sect. 5.1). Therefore, the ZHe ages obtained, besides sample B36, cannot be directly used to constrain the time of cooling and must be supplemented by thermal modelling.
Considering significant thickness of the Permian–Mesozoic sedimentary cover on the SW slope of the EEP (Figs. 1, 4), it is not unexpected that AFT ages are dispersed in the range of 235.8 ± 17.3 to 42.1 ± 11.1, providing a record of Mesozoic to Cenozoic cooling (Sect. 5.2). The highest frequency of the AFT ages is in the Jurassic and Early Cretaceous (Table 3); i.e. they are older than inversion of the German–Polish Basin (e.g. Senglaub et al., 2005; Resak et al., 2010; Łuszczak et al., 2020). Consequently, the results obtained suggest that cooling through the apatite partial annealing zone occurred in the Mesozoic before tectonic inversion in the Late Cretaceous. This might be related to the fact that tectonic inversion was significantly weaker in the part of the German–Polish Basin onlapping the EEP (Krzywiec et al., 2017b). Although inversion structures are undoubtedly recognized in this area (Krzywiec, 2009), the offset of vertical movements is probably below the sensitivity of the AFT method. Further inferences on timing and rate of Mesozoic cooling can be derived from thermal modelling. Nevertheless, the AFT data are not suitable for constraining a pre-Permian thermal history of the area.
6.2 Pre-Permian thermal history
Three regional unconformities at the top of crystalline basement, at the top of lower Paleozoic, and at the base of Permian or Mesozoic provide important geological constraints on thermal models limiting the number of viable solutions. Moreover, VR-derived paleotemperatures and ZHe data put important limits on the pre-Permian thermal histories modelled (Sect. 5.4). Out of nine models in total, seven provide solutions for the part or entire Paleozoic (Table 4, Fig. 13). Among the latter, two groups can be distinguished: (1) models predicting latest Devonian to early Carboniferous maximum paleotemperature followed by rapid cooling throughout the Carboniferous and (2) models predicting a temperature peak at the end of Carboniferous (300 Ma), succeeded by cooling in the Permian–Mesozoic (Fig. 13). All four models in the first group were built for samples that were collected from boreholes in the Baltic and Podlasie basins, the area missing Devonian and Carboniferous sedimentary rocks (Figs. 13, 14). Despite a regional base Permian unconformity and an important shift of the VR profile across this unconformity (Figs. 6–9), the age of the unconformity and a Paleozoic thermal event has remained so far unconstrained, being broadly limited to the interval between the end of Silurian and beginning of Permian. Therefore, our models make an important step forward predicting maximum heating at the transition from the Devonian to Carboniferous and rapid cooling soon afterwards (Fig. 13). This result is consistent with the early Carboniferous illite K-Ar ages by Kowalska et al. (2019).
The second group of models represents samples collected from boreholes in the Lublin Basin (Figs. 13, 14). Although in the Lubycza Królewska-1 borehole, Silurian strata are directly overlain by Jurassic sediments, in the Łopiennik IG-1 and Siedliska IG-1 boreholes, parts of Devonian and Carboniferous sedimentary sections are preserved (Figs. 10, 11). In the latter two, no break in the VR profile is observed across the boundary between the lower Paleozoic and Devonian or Carboniferous (Figs. 10, 11). This is consistent with the latest Carboniferous thermal peak modelled (Fig. 13) and earliest Permian illite K-Ar ages (Kowalska et al., 2019). Consequently, although a top Silurian or top Devonian unconformity exists in the Lublin Basin, it is not associated with a major gap in the thermal history. In contrast to the Baltic and Podlasie basins, a peak paleotemperature was achieved there in the latest Carboniferous.
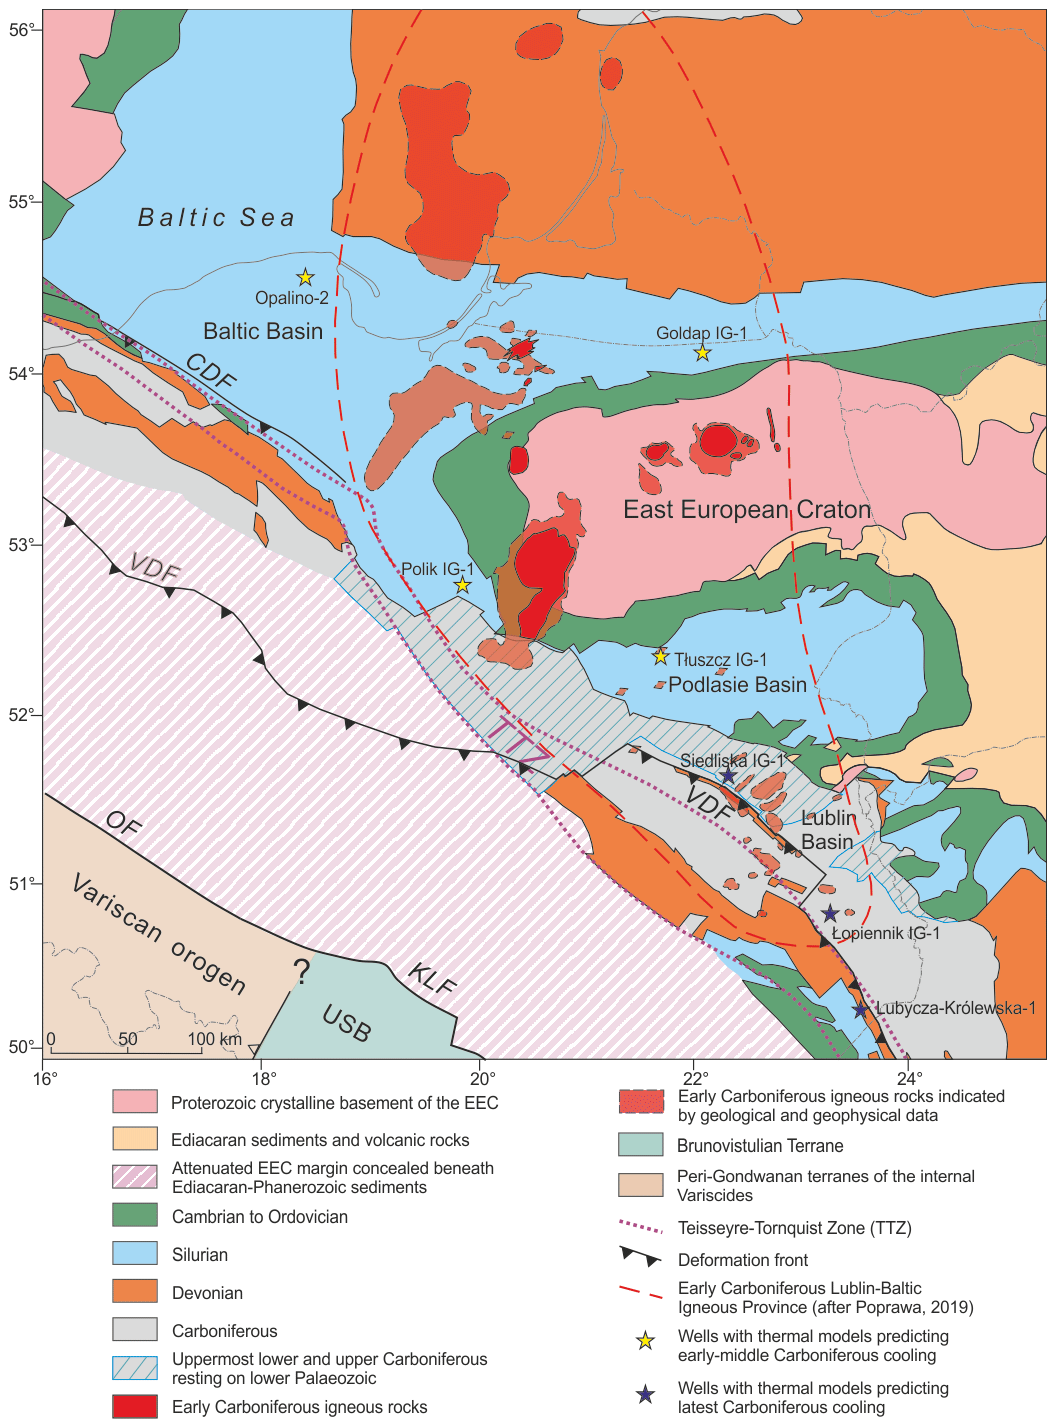
Figure 14Pre-Permian geology map for the SW slope of the East European Platform in Poland and adjacent areas (partly based on Pożaryski and Dembowski, 1983). The extent of early Carboniferous igneous rocks and the Lublin–Baltic Igneous Province is shown after Poprawa (2019). Location of the Variscan Deformation Front is from Mazur et al. (2021). Further explanations are in the text. CDF – Caledonian Deformation Front; KLF – Kraków–Lubliniec Fault; OF – Odra Fault; TTZ – Teisseyre–Tornquist Zone; USB – Upper Silesia Block; VDF – Variscan Deformation Front.
6.3 Permian–Mesozoic thermal history
Two models for Permian and Lower Triassic samples show exclusively the Mesozoic thermal history (Fig. 13). They both reveal a paleotemperature peak at the transition from the Triassic to Jurassic and subsequent cooling (Fig. 13). Since both samples (B13 and B44) come from relatively shallow part of the Permian–Mesozoic basin (≈ 1000–1500 m; Figs. 7, 9) AFT and VR data suggest that burial heating was strengthen by transient fluid flow in the Triassic. The Proterozoic granite sample (B14) from the Gołdap IG-1 borehole yielded the same Phanerozoic thermal history (Fig. 13c), including a peak temperature at the Triassic–Jurassic boundary and subsequent cooling.
Our data show that Mesozoic was the time of cooling despite ongoing sedimentation that might be considered a contradiction. On the other hand, we know a present-day temperature at sampling depths and a maximum paleotemperature for sampled strata from VR data (Table 1). Furthermore, VR data are consistent with illite/smectite data, where available. A comparison between VR data for the Permian–Mesozoic samples and present-day temperatures shows that sampled strata must have been cooled during Mesozoic–Cenozoic regardless the cause is. Of course, the simplest solution would be erosional unroofing. Indeed, the Permian–Mesozoic–Cenozoic sedimentary cover is relatively thin and full of sedimentary gaps. Nevertheless, the well logs did not show any clear erosional or angular unconformities. Furthermore, paleogeothermal gradients calculated based on VR data suggest only little to no exhumation throughout the Mesozoic (Figs. 6–12). Therefore, decreasing heat flow appears a main cause of Mesozoic cooling. Consequently, the mostly Jurassic–Early Cretaceous AFT data obtained, or earliest Jurassic thermal peaks predicted by thermal models, do not represent any specific tectonic events or erosional episodes. Instead, they correspond to the time when the AFT samples left the apatite partial annealing zone. This is possible because the VR-derived paleotemperatures for the Permian–Mesozoic samples do not exceed 90 ∘C (besides the Bodzanów IG-1 borehole with a present-day temperature of 75 ∘C).
The models predicting an early Carboniferous thermal peak show relatively slow cooling during the Mesozoic (Fig. 13). In addition, the models built for samples O2/2 and B19 reveal acceleration of cooling at the time of Late Cretaceous basin inversion (Fig. 13a). The models characterized by a latest Carboniferous temperature maximum also demonstrate cooling throughout the Mesozoic (Fig. 13). However, this is related to sensitivity of the AFT method. The samples (B38, B45) that were at depths within the apatite partial annealing zone at the beginning of Mesozoic were unable to record early Mesozoic reheating.
6.4 Geological implications
A deep erosional incision within the sedimentary cover of the East European Platform has been conventionally attributed to the effects of the Variscan orogeny (e.g. Żelichowski, 1987; Narkiewicz, 2007). This approach was consistent with wide-scale observations of a regional early Stephanian hiatus over much of the Variscan foreland with Stephanian and lower Permian red beds unconformably overlying truncated Westphalian series (e.g. McCann, 1996). However, our models indicate early Carboniferous exhumation of the lower Paleozoic strata in the Baltic and Podlasie basins of NE Poland on the SW slope of the EEP. This agrees with the presence of Carboniferous sediments resting on the deeply eroded Silurian substratum over a significant area of the Lublin and Podlasie basins (Fig. 14; Pożaryski and Dembowski, 1983; Żelichowski, 1987; Narkiewicz, 2007). Furthermore, early Carboniferous exhumation is consistent with data obtained on the island of Bornholm (Denmark) and southern Sweden (Fig. 15; Hansen, 1995; Japsen et al., 2016; Guenthner et al., 2017).
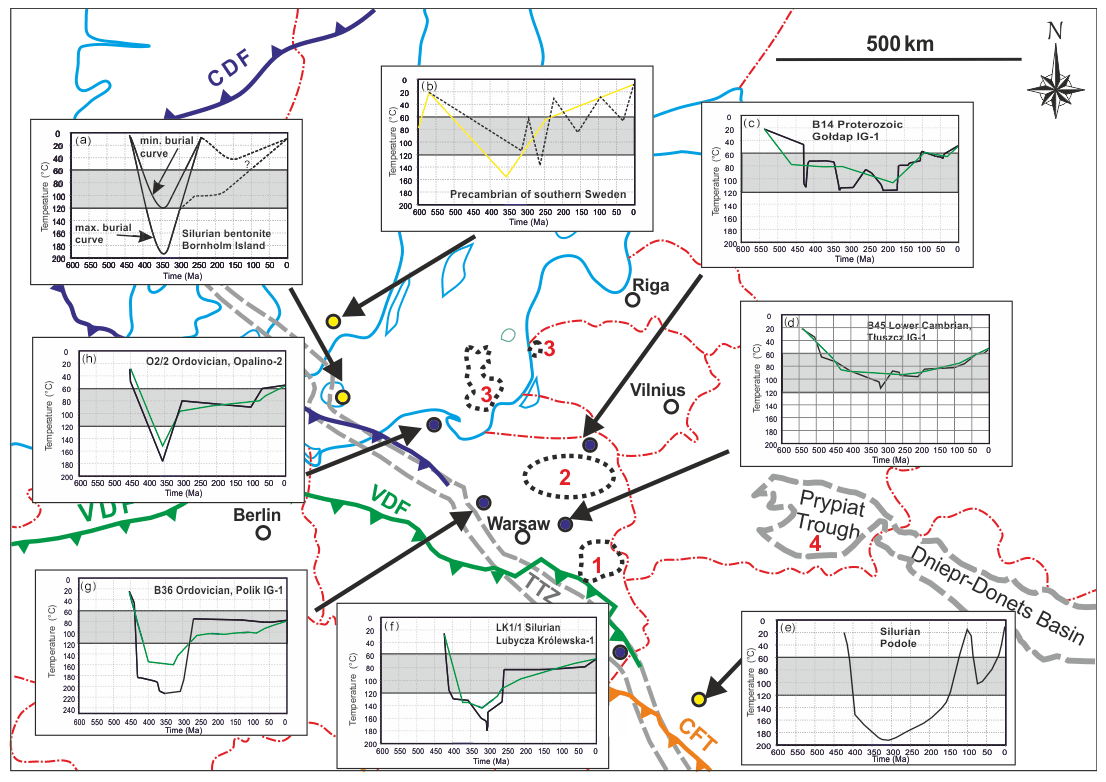
Figure 15Simplified thermal history of different parts of the study area and adjacent regions. (a) Silurian bentonite from the island of Bornholm; dashed line shows possible options for t–T history in the Mesozoic (Hansen, 1995); (b) Precambrian of southern Sweden: dashed line from (Japsen et al., 2016), bold yellow curve form (Guenthner et al., 2017); (c) Gołdap IG-1, well this study; (d) Tłuszcz IG-1, this study, (e) Silurian bentonite from Podolia (Środoń et al., 2013), (f) Lubycza Królewska-1, this study; (g) Polik IG-1 this study; (h) Opalino-2, this study. In panels (c)–(d), (f)–(h) the black curve is the best-fit model, whereas the green curve is the average. Grey box – apatite partial annealing zone (60–120 ∘C). Black dots show localities from this study, yellow dots – from other studies. Dotted black polygons on the map indicate the latest Devonian to early Carboniferous volcanic rocks in the study area and surroundings: (1) (Pańczyk and Nawrocki, 2015): 348 ± 0.8 Ma, alkaline basalts; (2) (Demaiffe et al., 2013): 345–354 Ma, alkaline intrusions; (3) (Motuza et al., 2015): dolerite sills 355 Ma and a granite vein 349 Ma; (4) (Kusznir et al., 1996): 367–364 Ma rifting and magmatism. CDF – Caledonian Deformation Front; CFT – Carpathian Frontal Thrust; TTZ – Teisseyre–Tornquist Zone; VDF – Variscan Deformation Front.
A maximum paleotemperature achieved in the latest Devonian to earliest Carboniferous was probably related to coeval deposition of marine sediments within the Laurussian shelf basin. Thick successions of such sediments have been drilled in Pomerania (NW Poland) west of the TTZ (Żelichowski, 1987; Narkiewicz, 2007). However, based on sedimentary facies models, it is postulated that the Devonian and lower Carboniferous succession could have initially extended further north and east than now, covering large areas of the SW slope of the EEP (Żelichowski, 1987; Matyja, 2006). This corollary is also supported by early Carboniferous illite K-Ar ages from the lower Paleozoic sediments of the Baltic and Podlasie basins (Kowalska et al., 2019).
The timing of the postulated early Carboniferous uplift and exhumation coincide with activity of the Lublin–Baltic igneous province defined by Poprawa (2019). This was a period of intra-plate alkaline magmatism in the time interval from the late Tournaisian to mid-Viséan (Pańczyk and Nawrocki, 2015). The area affected by magmatism overlaps the SW slope of the EEP from the Lublin to Baltic Basin (Fig. 14). The time of this event was roughly coeval with the extensional reactivation of the Dnieper–Donets–Donbas Rift in the early Viséan (Fig. 15; Stephenson et al., 2006). The formation of an igneous province is usually a manifestation of thermal anomaly in the lithosphere. Regardless a specific tectonic setting, the anomaly promotes uplift and exhumation.
The early Carboniferous uplift and exhumation must have affected the entire study area as indicated by a regional erosional unconformity over the top of Silurian or Devonian. However, in SE Poland (Lublin Basin) sedimentation resumed in the late Viséan after a period of intra-plate volcanism (e.g. Narkiewicz, 2007), whereas the rest of the study area remind uplifted until the Permian. Furthermore, thermal models for the Lublin Basin predict peak temperatures for the latest Carboniferous and the VR-derived paleotemperature vertical profile reveals no break across the base Carboniferous unconformity (Figs. 13, 14). Consequently, the early Carboniferous uplift and exhumation in the Lublin Basin must have been not only shorter but also less significant than further NW.
Surprisingly, the Lublin Basin, the least affected by early Carboniferous exhumation in the study area, was the only area on the SW slope of the EEP, where this event has been so far recognized and correlated with “Bretonnian phase” (Narkiewicz, 2007; Krzywiec et al., 2017a). A top Devonian unconformity, equivalent to a top Silurian unconformity further NW, was accordingly termed a “Bretonnian unconformity”. The “Bretonnian” tectonic event might have been also responsible for the termination of the Late Devonian subsidence in the nearby Pripyat Trough (Fig. 15; Kusznir et al., 1996). Although the earliest Carboniferous event is reflected in the Lublin Basin by block tectonics of considerable magnitude (Narkiewicz, 2007), the latter was probably insufficient to influence the low-T thermochronometers. The effects of the tectonic uplift at the transition from the Devonian to Carboniferous were not recognized further north-west in the Podlasie and Baltic Basin because all Devonian and Carboniferous sediments were removed. Paradoxically, the north-westward increasing magnitude of uplift prevented identification of its results due to the ensuing exhumation. Therefore, thermochronology remains the best tool to recognize the scale of the early Carboniferous event, in the absence of sedimentary record.
The Lublin Basin in SE Poland was the only part of the SW slope of the EEP that was overridden by the Variscan orogenic wedge in the late Carboniferous (Fig. 14; Mazur et al., 2021). Therefore, we hypothesize that Carboniferous uplift and exhumation in this area was interrupted by tectonic loading associated with the adjacent orogenic wedge. Therefore, after initial uplift and exhumation at the transition from the Devonian to Carboniferous, sedimentation resumed in the late Viséan and lasted until latest Carboniferous Variscan shortening (Fig. 2c; Krzywiec et al., 2017a). Recent seismic data indicate a Variscan thin-skinned fold-and-thrust belt emplaced on SW slope of the EEP within the Lublin Basin and west of it (Krzywiec et al., 2017a, b). Hence, latest Carboniferous heating might have been caused by a combined effect of tectonic and sedimentary burial (Fig. 5b; Botor et al., 2019a). A significant cover of the Variscan foreland basin was also inferred by Środoń et al. (2013) for western Ukraine (Fig. 15) based on combined clay mineralogy, K-Ar, and AFT data.
From the beginning of Permian, the SW slope of the EEP was onlapped by marginal part of an extensive Permian–Mesozoic basin (Figs. 2, 4). Considering a present-day Permian–Mesozoic thickness (Figs. 2, 4), i.e. omitting effects of the Late Cretaceous inversion, a thermal effect of Mesozoic burial should be significant. Nevertheless, among the methods used, only the AFT thermochronometer is sensitive enough to record this event. Furthermore, only models for Permian–Mesozoic samples are capable to reveal a Mesozoic thermal history. Consequently, only three models predict Mesozoic reheating with a maximum paleotemperature at the transition from Triassic to Jurassic (Fig. 13), but this result is probably representative of the entire study area. Comparable results were obtained by Schito et al. (2018) in the Ukrainian part of the EEP, who postulated that exhumation through the 45–120 ∘C temperature range took place between the Late Triassic and Early Jurassic, and that no significant burial occurred afterwards.
The case of the SW slope of the EEP demonstrates a successful application of integrative approach to studying a long-term thermal history. A series of tectonic events in the area has not been yet fully resolved because of incomplete sedimentary record. Therefore, the combination of ZHe and AFT thermochronometers with VR data was necessary to recognize those events that led to deep erosion and complete removal of sedimentary sequences. The same approach might be applied to craton margins elsewhere to separate superimposed effects of successive tectonic events.
Significant heating of Ediacaran to Carboniferous sedimentary successions occurred before the Permian with maximum paleotemperatures in the earliest and latest Carboniferous in the Baltic–Podlasie Basin and Lublin Basin, respectively. The results obtained suggest an important role of early Carboniferous uplift and exhumation at the SW margin of the EEP. This event was associated with a period of intra-plate magmatism in the area (Poprawa, 2019) lasting from the late Tournaisian to mid-Viséan (Pańczyk and Nawrocki, 2015). Effects of uplift and magmatism jointly suggest thermal perturbation of lithosphere. The time of this event was roughly coeval with the extensional reactivation of the Dnieper–Donets–Donbas Rift (e.g. Stephenson et al., 2006) and termination of the Late Devonian continental rifting in the Pripyat Trough (Kusznir et al., 1996).
The SW slope of the EEP was overridden in SE Poland (Lublin Basin) by the Variscan orogenic wedge (Krzywiec et al., 2017a; Mazur et al., 2021). This event interrupted Carboniferous uplift because of tectonic loading and caused resumption of sedimentation from the late Viséan. Consequently, a thermal history of the Lublin Basin is different from that in the Podlasie and Baltic basins but similar to other sections of the Variscan foreland. The latter is characterized by maximum burial at the end of Carboniferous and regional uplift and exhumation at the transition from the Carboniferous to the Permian (e.g. McCann, 1996).
Our data are consistent with the decreasing heat flow during the Mesozoic. The elevated Permian–Triassic heat flow was probably a consequence of early Permian continental rifting. In the light of our results, the decrease of post-Permian heat flow appears an important cause of Mesozoic cooling. Our thermal models show mostly gradual cooling with little effects of the Late Cretaceous basin inversion. Although inversion structures are recognized in the part of the German–Polish Basin onlapping the EEP (Krzywiec, 2009), their vertical offset was probably below the sensitivity of the AFT method.
All data are included in the paper in Sect. 5.1, 5.2, 5.3, 5.4, Tables 1–4, Figs. 1, 3, 6–15, and S1 (Supplement).
The supplement related to this article is available online at: https://doi.org/10.5194/se-12-1899-2021-supplement.
DB was responsible for conceptualization, methodology, resources, investigation, visualization, and writing (original draft). SM was responsible for validation, investigation, writing (review and editing), and visualization. AAA was responsible for the methodology, resources, and investigation. ID was responsible for the methodology, software, and investigation. JG was responsible for supervision and project administration.
The authors declare that they have no conflict of interest.
Publisher's note: Copernicus Publications remains neutral with regard to jurisdictional claims in published maps and institutional affiliations.
We thank Mateusz Rechowicz and Anna Zagórska for mineral separation, Polish Oil and Gas Company (PGNiG) for access to core samples from the Borcz-1, Lubycza Królewska-1, and Opalino-2 wells, and the National Geological Archive in Warsaw for access to other core samples. Anonymous reviewers and journal editors are thanked for their insightful comments.
This research has been funded by the Polish National Centre for Research and Development (NCBiR) grant under the Blue Gas – Polish Shale Gas programme – BG1/GAZGEOLMOD/13 (AGH no. 17.17.866660) and AGH statutory project no. 16.16.140.315.
This paper was edited by Patrice Rey and reviewed by two anonymous referees.
Armstrong, P. A.: Thermochronometers in sedimentary basins, Reviews in Mineralogy and Geochemistry, 58, 499–525, https://doi.org/10.2138/rmg.2005.58.19, 2005. a
Barker, C. and Pawlewicz, M. J.: Calculation of vitrinite reflectance from thermal histories: a comparison of methods, in: Vitrinite reflectance as a maturity parameter: applications and limitations, edited by: Mukhopadhyay, P. K. and Dow, W. G., 216–229, American Chemical Society Symposium Series, Washington D.C., 1994. a
Botor, D.: Tectono-thermal Evolution of the Lower Paleozoic Petroleum Source Rocks in the Southern Lublin Trough: Implications for Shale Gas Exploration from Maturity Modelling, E3S Web of Conferences, 35, 02002, https://doi.org/10.1051/e3sconf/20183502002, 2018. a, b
Botor, D., Kotarba, M., and Kosakowski, P.: Petroleum generation in the Carboniferous strata of the Lublin Trough (Poland): an integrated geochemical and numerical modelling approach, Org. Geochem., 33 461–476, https://doi.org/10.1016/S0146-6380(01)00170-X, 2002. a, b, c, d
Botor, D., Anczkiewicz, A. A., Dunkl, I., Golonka, J., Paszkowski, M., and Mazur, S.: Tectonothermal history of the Holy Cross Mountains (Poland) in the light of low-temperature thermochronology, Terra Nova, 30, 270–278, https://doi.org/10.1111/ter.12336, 2018. a
Botor, D., Golonka, J., Anczkiewicz, A. A., Dunkl, I., Papiernik, B., Zając, J., and Guzy, P.: Burial and thermal history of the Lower Paleozoic petroleum source rocks in the SW margin of the East European Craton (Poland), Ann. Soc. Geol. Pol., 89, 31–62, https://doi.org/10.14241/asgp.2019.12, 2019a. a, b, c, d, e, f, g, h, i, j, k, l, m
Botor, D., Golonka, J., Zając, J., Papiernik, B., and Guzy, P.: Petroleum generation and expulsion in the Lower Palaeozoic petroleum source rocks at the SW margin of the East European Craton (Poland), Ann. Soc. Geol. Pol., 89, 63–89, 2019b. a, b, c
Dadlez, R., Kowalczewski, Z., and Znosko, J.: Some key problems of the pre-Permian tectonics of Poland, Geol. Q., 38, 169–189, 1994. a
Dadlez, R., Narkiewicz, M., Stephenson, R. A., Visser, M. T. M., and Van Wees, J. D.: Tectonic evolution of the Mid-Polish Trough: modelling implications and significance for central European geology, Tectonophysics, 252, 179–195, https://doi.org/10.1016/0040-1951(95)00104-2, 1995. a, b, c
Demaiffe, D., Wiszniewska, J., Krzemińska, E., Williams, I. S., Stein, H., Brassinnes, S., Ohnenstetter, D., and Deloule, E.: A hidden alkaline and carbonatite province of Early Carboniferous age in Northeast Poland: Zircon U-Pb and pyrrhotite Re-Os geochronology, J. Geol., 121, 91–104, https://doi.org/10.1086/668674, 2013. a
Derkowski, A., Środoń, J., Goryl, M., Marynowski, L., Szczerba, M., and Mazur, S.: Long distance fluid migration defines the diagenetic history of unique Ediacaran sediments in the East European Craton, Basin Res., 33, 570–593, https://doi.org/10.1111/bre.12485, 2021. a, b
Donelick, R. A., O'Sullivan P. B., and Ketcham, R. A.: Apatite fission track analysis, Reviews in Mineralogy and Geochemistry, 58, 49–94, 2005. a
Drygant, D.: Conodont colour as indicator of the geological processes (Volyn-Podolia), Paleontologiceskij Zbirnyk, 29, 35–137, 1993 (in Ukrainian). a, b
Dumitru, T.: A new computer-automated microscope stage system for fission track analysis, Nucl. Tracks Rad. Meas., 21, 575–580, 1993. a
Dunkl, I.: Trackkey: a Windows program for calculation and graphical presentation of fission track data, Computers and Geosciences, 28, 3–12, 2002. a, b, c
Epstein, A. G., Epstein, J. B., and Harris, L. D.: Conodont color alteration-an index to organic metamorphism, USGS Professional Paper 995, 1–27, US Geological Survey, Denver, 1977. a
Farley, K. A.: dating: Techniques, calibrations, and applications, Reviews in Mineralogy and Geochemistry, 47, 819–844, https://doi.org/10.2138/rmg.2002.47.18, 2002. a, b
Farley, K. A., Wolf, R. A., and Silver, L. T.: The effects of long alpha-stopping distances on ages, Geochim. Cosmochim. Ac., 60, 4223–4229, 1996. a, b
Galbraith, R. F.: On statistical models for fission track counts, Math. Geol., 13, 471–478, 1981. a, b, c
Galbraith, R. F.: The radial plot: graphical assessment of spread in ages, Nucl. Tracks Rad. Meas., 17, 207–214, 1990. a
Galbraith, R. F. and Laslett, G. M.: Statistical models for mixed fission track ages, Nucl. Tracks Rad. Meas., 21, 459–470, 1993. a, b, c
Gleadow, A. J. W., Duddy, I. R., Green, P. F., and Lovering, J. F.: Confined fission track lengths in apatite: a diagnostic tool for thermal history analysis, Contrib. Mineral. Petr., 94, 405–415, 1986. a
Górecki, W. (Ed.), Szczepański, A., Sadurski, A., Hajto, M., Papiernik, B., Kuźniak, T., Kozdra, T., Soboń, J., Szewczyk, J.,Sokołowski, A., Strzetelski, W., Haładus, A., Kania, J., Kurzydłowski, K., Gonet, A., Capik, M., Śliwa, T., Ney, R., Kępińska, B., Bujakowski, W., Rajchel, L., Banaś, J., Solarski, W., Mazurkiewicz, B., Pawlikowski, M., Nagy, S., Szamałek, K., Feldman-Olszewska, A., Wagner, R., Kozłowski, T., Malenta, Z., Sapińska-Śliwa, A., Sowiżdżał, A., Kotyza, J., Leszczyński, K. P., and Gancarz, M.: Atlas of Geothermal Resources of Mesozoic Formations in the Polish Lowlands, Wydawnictwo AGH, Kraków, 484 pp., 2006a. a, b, c
Górecki, W. (Ed.), Szczepański, A., Sadurski, A., Hajto, M., Papiernik, B., Szewczyk, J., Sokołowski, A., Strzetelski, W., Haładus, A., Kania, J., Rajchel, L., Feldman-Olszewska, A., Wagner, R., Leszczyński, K. P., and Sowiżdżał, A.: Atlas of Geothermal Resources of Paleozoic Formations in the Polish Lowlands. Wydawnictwo AGH, Kraków, 240 pp., 2006b. a, b, c
Grad, M., Guterch, A., and Mazur, S.: Seismic refraction evidence for crustal structure in the central part of the Trans-European Suture Zone in Poland, Geol. Soc. Lond. Spec. Publ., 201, 295–309, https://doi.org/10.1144/GSL.SP.2002.201.01.14, 2002. a, b
Gradstein, F. M., Ogg, J. G., and Hilgen, F. J.: On the geologic time scale, Newsl. Stratigr., 45, 171–188, 2012. a
Green, P. F. and Duddy, I. R.: Interpretation of apatite ages and fission track ages from cratons, Earth Planet. Sc. Lett., 244, 541–547, https://doi.org/10.1016/j.epsl.2006.02.024, 2006. a
Green, P. F. and Duddy, I. R.: Thermal history reconstruction in sedimentary basins using apatite fission-track analysis and related techniques, Analyzing the Thermal History of Sedimentary Basins: Methods and Case Studies SEPM Special Publication No. 103, SEPM (Society for Sedimentary Geology), 65–104, 2012. a, b, c
Green, P. F. and Duddy, I. R.: Apatite (U-Th-Sm)/He thermochronology on the wrong side of the tracks, Chem. Geol., 488, 21–33, https://doi.org/10.1016/j.chemgeo.2018.04.028, 2018. a
Grotek, I.: Origin and thermal maturity of the organic matter in the Lower Palaeozoic rocks of the Pomeranian Caledonides and their foreland (northern Poland), Geol. Q., 43, 297–312, 1999. a, b, c, d, e
Grotek, I.: Alteration of the coalification degree of the organic matter dispersed in the Carboniferous sediments along border of the East-European Platform in Poland, Biuletyn Państwowego Instytutu Geologicznego, 413, 5–80, 2005 (in Polish with English summary). a, b, c, d, e
Grotek, I.: Thermal maturity of organic matter from the sedimentary cover deposits from Pomeranian part of the TESZ, Baltic Basin and adjacent area, Prace Państwowego Instytutu Geologicznego, 186, 253–270, 2006 (in Polish with English summary). a, b, c, d, e, f, g
Grotek, I.: A petrologic study and thermal maturity of organic matter from the Cambrian, Ordovician and Silurian deposits in the Baltic and Podlasie-Lublin areas, Przegląd Geologiczny, 64, 1000–1004, 2016. a, b, c, d, e
Guenthner, W. R., Reiners, P. W., Ketcham, R. A., Nasdala, L., and Giester, G.: Helium diffusion in natural zircon: Radiation damage, anisotropy, and the interpretation of zircon thermochronology, Am. J. Sci., 313, 145–198, https://doi.org/10.2475/03.2013.01, 2013. a, b, c
Guenthner, W.R., Reiners, P., Drake, W., and Tillberg, M.: Zircon, titanite, and apatite ages and age-eU correlations from the Fennoscandian Shield, southern Sweden, Tectonics, 36, 1254–1274, https://doi.org/10.1002/2017TC004525, 2017. a, b, c
Guenthner, W. R.: Implementation of an alpha damage annealing model for zircon thermochronology with comparison to a zircon fission track annealing model, Geochem. Geophy. Geosy., 22, 1525–2027, https://doi.org/10.1029/2019GC008757, 2020. a, b
Guterch, A., Grad, M., Materzok, R., and Perchuć, E.: Deep structure of the Earth's crust in the contact zone of the Palaeozoic and Precambrian platforms in Poland (Tornquist-Teisseyre Zone), Tectonophysics, 128, 251–279, https://doi.org/10.1016/0040-1951(86)90296-9, 1986. a
Guterch, A., Grad, M., Thybo, H., Keller, G. R., and the POLONAISE Working Group: POLONAISE'97-An international seismic experiment between Precambrian and Variscan Europe in Poland, Tectonophysics, 314, 101–121, https://doi.org/10.1016/S0040-1951(99)00239-5, 1999. a
Guterch, A., Wybraniec, S., Grad, M., Chadwick, A., Krawczyk, C. M., Ziegler, P. A., Thybo, H., and De Vos, W.: Chapter 2: Crustal structure and structural framework, in: Petroleum Geological Atlas of the Southern Permian Basin Area, edited by: Doornebal, H. and Stevenson, A., EAGE Publications, Houten, 11–23, 2010. a
Hansen, K.: Fennoscandian Border zone thermal and tectonic history of a tufaceous sandstone and granite from fission track analysis, Bornholm, Denmark, Tectonophysics, 244, 153–160, https://doi.org/10.1016/0040-1951(94)00223-V, 1995. a, b, c
Hendriks, B. W. H. and Redfield, T. F.: Apatite fission track and data from Fennoscandia: An example of underestimation of fission track annealing in apatite, Earth Planet. Sc. Lett., 236, 443–458, https://doi.org/10.1016/j.epsl.2005.05.027, 2005. a
Hendriks, B. W. H., Andriessen, P. A. M., Huigen, Y., Leighton, C., Redfield, T., Murrell, G., Gallagher, K., and Nielsen, S. B.: A fission track data compilation for Fennoscandia, Norw. J. Geol., 87, 143–155, 2007. a
Hourigan, J. K., Reiners, P. W., and Brandon, M. T.: U-Th zonation-dependent alpha-ejection in chronometry, Geochim. Cosmochim. Ac., 69, 3349–3365, 2005. a
Hurford, A. J.: Standardization of fission track dating calibration: recommendations by the Fission Track Working Group of the I.U.G.S. Subcommission on Geochronology, Chem. Geol., 80, 171–178, 1990. a, b
Hurford, A. J. and Green, P. F.: The zeta age calibration of fission track dating, Chem. Geol., 41, 285–312, 1983. a, b
Japsen, P., Green, P. F., Bonow, J. M., and Erlström, M.: Episodic burial and exhumation of the southern Baltic Shield: epeirogenic uplifts during and after break-up of Pangaea, Gondwana Res., 35, 357–377, https://doi.org/10.1016/j.gr.2015.06.005, 2016. a, b, c
Japsen, P., Green, P. F., Chalmers, J. A., and Bonow, J. M.: Mountains of southernmost Norway: uplifted Miocene peneplains and re-exposed Mesozoic surfaces, J. Geol. Soc., 175, 721–741, https://doi.org/10.1144/jgs2017-157, 2018. a
Kanev, S., Margulis, L., Bojesen-Koefoed, J. A., Weil, W. A., Merta, H., and Zdanaviciute, O.: Oils and hydrocarbon source rocks of the Baltic syneclise, Oil and Gas Journal, 92, 69–73, 1994. a
Karnkowski, P. H.: Carboniferous time in the evolution of the Lublin Basin as the main hydrocarbon formation stage in the Lublin area – results of the geological modelling (PetroMod), Przegląd Geologiczny, 51, 783–790, 2003. a, b
Ketcham, R. A.: Forward and inverse modeling of low-temperature thermochronometry data, Reviews in Mineralogy and Geochemistry, 58, 275–314, 2005. a, b, c, d, e, f
Ketcham, R. A., Carter, A., Donelick, R. A., Barbarand, J., and Hurford, A. J.: Improved measurement of fission track annealing in apatite using c-axis projection, Am. Mineral., 92, 789–798, https://doi.org/10.2138/am.2007.2280, 2007a. a
Ketcham, R. A., Carter, A., Donelick, R. A., Barbarand, J., and Hurford, A. J.: Improved modeling of fission track annealing in apatite, Am. Mineral., 92, 799–810, 2007b. a, b, c
Kosakowski, P., Wróbel, M., and Krzywiec, P.: Modelling hydrocarbon generation in the Palaeozoic and Mesozoic successions in SE Poland and west Ukraine, J. Petrol. Geol., 36, 139–161, https://doi.org/10.1111/jpg.12548, 2013. a
Kowalska, S., Wójtowicz, A., Hałas, S., Wemmer, K., Mikołajewski, Z., and Buniak, A.: Thermal history of Lower Palaeozoic rocks from the East European Platform margin of Poland based on K-Ar age dating and illite-smectite palaeothermometry, Ann. Soc. Geol. Pol., 89, 481–509, https://doi.org/10.14241/asgp.2019.21, 2019. a, b, c, d, e, f, g, h, i, j, k, l, m, n, o, p, q, r, s
Krzemińska, E., Krzemiński, L., Petecki, Z., Wiszniewska, J., Salwa, S., Żaba, J., Gaidzik, K., Williams, I. S., Rosowiecka, O., Taran, L., Johansson, G., Demaiffe, D., Grabowski, J., and Zieliński, G.: Geological Map of Crystalline Basement in the Polish part of the East European Platform 1 : 1 000 000, Państwowy Instytut Geologiczny, Warszawa, 2017. a
Krzywiec, P.: Mid-Polish Trough inversion – seismic examples, main mechanisms and its relationship to the Alpine-Carpathian collision, in: Continental Collision and the Tectonosedimentary Evolution of Forelands, edited by: Berotti, G., Schulmann K., and Cloetingh, S., European Geosciences Union, Stephan Mueller Special Publication Series, 1, 151–165, 2002. a, b, c
Krzywiec, P.: Devonian-Cretaceous repeated subsidence and uplift along the Teisseyre-Tornquist zone in SE Poland – Insight from seismic data interpretation, Tectonophysics, 475, 142–159, https://doi.org/10.1016/j.tecto.2008.11.020, 2009. a, b, c, d, e
Krzywiec, P., Mazur, S., Gągała, Ł., Kufrasa, M., Lewandowski, M., Malinowski, M., and Buffenmyer, V.: Late Carboniferous thin-skinned compressional deformation above the SW edge of the East European craton as revealed by seismic reflection and potential field data – Correlations with the Variscides and the Appalachians, in: Linkages and Feedbacks in Orogenic Systems, edited by: Law, R. D., Thigpen, J. R., Merschat, A. J., and Stowell, H. H., 213, 353–372, Geological Society of America Memoir, New York, 2017a. a, b, c, d, e, f, g
Krzywiec P., Gągała, Ł., Mazur, S., Słonka, Ł., Kufrasa, M., Malinowski, M., Pietsch, K., and Golonka, J.: Variscan deformation along the Teisseyre-Tornquist Zone in SE Poland: Thick-skinned structural inheritance or thin-skinned thrusting?, Tectonophysics, 718, 83–91, https://doi.org/10.1016/j.tecto.2017.06.008, 2017b. a, b, c
Kusznir, N. J., Kovkhuto, A., and Stephenson, R. A.: Syn-rift evolution of the Pripyat Trough: constraints from structural and stratigraphic modelling, Tectonophysics, 268, 221–236, 1996. a, b, c
Kutek, J.: The Polish Permo-Mesozoic Rift Basin, Mémoires du Muséum National d'histoire Naturelle, 186, 213–236, 2001. a
Kutek, J. and Głazek, J.: The Holy Cross area, central Poland, in the Alpine cycle, Acta Geol. Pol., 22, 603–651, 1972. a
Lamarche, J. and Scheck-Wenderoth, M.: 3D structural model of the Polish Basin, Tectonophysics, 397, 73–91, https://doi.org/10.1016/j.tecto.2004.10.013, 2005. a
Lampe, C., Person, M., Nöth, S., and Ricken, W.: Episodic fluid flow within continental rift basins: some insights from field data and mathematical models of the Rhinegraben, Geofluids, 1, 42–52, 2001. a
Larson, S. A. and Tullborg, E. L.: Why Baltic Shield zircons yield late Paleozoic, lower-intercept ages on U-Pb concordia, Geology, 26, 919–922, https://doi.org/10.1130/0091-7613(1998)026<0919:WBSZYL>2.3.CO;2, 1998. a
Larson, S. A., Tullborg, E. L., Cederbom, C., and Stiberg, J. P.: Sveconorwegian and Caledonian foreland basins in the Baltic Shield revealed by fission-track thermochronology, Terra Nova, 11, 210–215, https://doi.org/10.1046/j.1365-3121.1999.00249.x, 1999. a
Larson, S. A., Cederbom, C., Tullborg, E. L., and Stilberg, J. P.: Comment on “Apatite fission track and data from Fennoscandia: An example of underestimation of fission track annealing in apatite” by Hendriks and Redfield [Earth Planet. Sci. Lett. 236 (443–458)], Earth Planet. Sc. Lett., 248, 561–568, https://doi.org/10.1016/j.epsl.2006.06.018, 2006. a
Lidmar-Bergström, K.: Denudation surfaces and tectonics in the southernmost part of the Baltic Shield, Precambrian Res., 64, 337–345, https://doi.org/10.1016/0301-9268(93)90086-H, 1993 a
Lidmar-Bergström, K.: Long term morphotectonic evolution in Sweden, Geomorphology, 16, 33–59, https://doi.org/10.1016/0169-555X(95)00083-H, 1996. a
Łuszczak, K., Wyglądała, M.,Śmigielski, M., Waliczek, M., Matyja, B. A., Konon, A., and Ludwiniak, M.: How to deal with missing overburden – investigating Late Cretaceous exhumation of the Mid-Polish anticlinorium by a multi-proxy approach, Mar. Petrol. Geol., 114, 104229, https://doi.org/10.1016/j.marpetgeo.2020.104229, 2020. a, b
Matyja, H.: Stratigraphy and facies development of Devonian and Carboniferous deposits in the Pomeranian Basin and in the western part of the Baltic Basin and palaeogeography of the northern TESZ during Late Paleozoic times, edited by: Poprawa, P. and Matyja, H., Prace Państwowego Instytutu Geologicznego 186, 79–122, 2006 (in Polish with English summary). a
Maystrenko, Y. P. and Scheck-Wenderoth, M.: 3D lithosphere-scale density model of the Central European Basin System and adjacent areas, Tectonophysics, 601, 53–77, https://doi.org/10.1016/j.tecto.2013.04.023, 2013. a
Mazur, S., Scheck-Wenderoth, M., and Krzywiec, P.: Different modes of the Late Cretaceous-Early Tertiary inversion in the North German and Polish basins, Int. J. Earth Sci., 94, 782–798, https://doi.org/10.1007/s00531-005-0016-z, 2005. a
Mazur, S., Aleksandrowski, P., Turniak, K., Krzemiński, L., Mastalerz, K., Górecka-Nowak, A., Kurowski, L., Krzywiec, P., Żelaźniewicz, A., and Fanning, M. C.: Uplift and late orogenic deformation of the Central European Variscan belt as revealed by sediment provenance and structural record in the Carboniferous foreland basin of western Poland, Int. J. Earth Sci., 99, 47–64, https://doi.org/10.1007/s00531-008-0367-3, 2010. a
Mazur, S., Mikołajczak M., Krzywiec P., Malinowski M., Buffenmyer V., and Lewandowski, M.: Is the Teisseyre-Tornquist Zone an ancient plate boundary of Baltica?, Tectonics, 34, 2465–2477, https://doi.org/10.1002/2015TC003934, 2015. a, b, c, d
Mazur, S., Mikołajczak, M., Krzywiec, P., Malinowski, M., Lewandowski, M., and Buffenmyer, V.: Pomeranian Caledonides, NW Poland – A collisional suture or thin-skinned fold-and-thrust belt?, Tectonophysics, 692, 29–43, https://doi.org/10.1016/j.tecto.2016.06.017, 2016. a
Mazur, S., Krzywiec, P., Malinowski, M., Lewandowski, M., Aleksandrowski, P., and Mikołajczak, M.: On the nature of the Teisseyre-Tornquist Zone, Geol. Geophys. Environ., 44, 17–30, https://doi.org/10.7494/geol.2018.44.1.17, 2018a. a, b
Mazur, S., Porębski, S. J., Kędzior, A., Paszkowski, M., Podhalańska, T., and Poprawa, P.: Refined timing and kinematics for Baltica-Avalonia convergence based on the sedimentary record of a foreland basin, Terra Nova, 30, 8–16, https://doi.org/10.1111/ter.12302, 2018b. a, b, c
Mazur, S., Malinowski, M., Maystrenko, Y. P., and Gągała, Ł.: Pre-existing lithospheric weak zone and its impact on continental rifting – the Mid-Polish Trough, Central European Basin System, Global Planet. Change, 198, 103417, https://doi.org/10.1016/j.gloplacha.2021.103417, 2021. a, b, c, d
McCann, T.: Pre-Permian of the Northeast German Basin, Geol. J., 31, 159–177, https://doi.org/10.1002/(SICI)1099-1034(199606)31:2<159::AID-GJ705>3.0.CO;2-8, 1996. a, b
Middleton, D. W. J., Parnell, J., Green, P. F., Xu, G., and McSherry, M.: Hot fluid flow events in Atlantic margin basins: an example from the Rathlin Basin, Geol. Soc. Lond. Spec. Publ., 188, 91–105, https://doi.org/10.1144/GSL.SP.2001.188.01.05, 2001. a
Mikołajczak, M., Mazur, S., and Gągała, Ł.: Depth-to-basement for the East European Craton and Teisseyre-Tornquist Zone in Poland based on potential field data, Int. J. Earth Sci., 108, 547–567, https://doi.org/10.1007/s00531-018-1668-9, 2019. a, b, c, d
Milesi, G., Monié, P., Münch, P., Soliva, R., Taillefer, A., Bruguier, O., Bellanger, M., Bonno, M., and Martin, C.: Tracking geothermal anomalies along a crustal fault using apatite thermochronology and rare-earth element (REE) analyses: the example of the Têt fault (Pyrenees, France), Solid Earth, 11, 1747–1771, https://doi.org/10.5194/se-11-1747-2020, 2020. a
Młynarski, S.: The structure of deep basement in Poland in the light of refraction seismic surveys, Geol. Q., 26, 285–296, 1982 (In Polish, with English summary). a
Modliński, Z., Jaworowski, K., Miłaczewski, L., Podhalańska, T., Sikorska, M., Szymański, B., and Waksmundzka, M. I.: Paleogeological atlas of the sub-Permian Paleozoic of the East-European craton in Poland and neighbouring areas, 1 : 2 000 000, Polish Geological Institute, Warsaw, 2010. a
Motuza, G., Šliaupa, S., and Timmerman, M. J.: Geochemistry and 40Ar 39Ar age of Early Carboniferous dolerite sills in the southern Baltic Sea, Est. J. Earth Sci., 64, 233–248, https://doi.org/10.3176/earth.2015.30, 2015. a
Narkiewicz, M.: Development and inversion of Devonian and Carboniferous basins in the eastern part of the Variscan foreland (Poland), Geol. Q., 51, 231–256, 2007. a, b, c, d, e, f, g, h, i, j, k, l
Nehring-Lefeld, M., Modliński, Z., and Swadowska, E.: Thermal evolution of the Ordovician in the western margin of the East-European Platform: CAI and Ro data, Geol. Q., 41, 129–136, 1997. a, b, c, d
Pańczyk, M. and Nawrocki, J.: Tournaisian 40Ar 39Ar age for alkaline basalts from the Lublin Basin (SE Poland), Geol. Q., 59, 473–478, 2015. a, b, c
Papiernik, B., Botor, D., Golonka, J., and Porębski, S. J.: Unconventional hydrocarbon prospects in Ordovician and Silurian mudrocks of the East European Craton (Poland): Insight from three-dimensional modelling of total organic carbon and thermal maturity, Ann. Soc. Geol. Pol., 89, 511–533, https://doi.org/10.14241/asgp.2019.26, 2019. a
Petersen, H. I., Schovsbo, N. H., and Nielsen, A. T.: Reflectance measurements of zooclasts and solid bitumen in Lower Paleozoic shales, southern Scandinavia: Correlation to vitrinite reflectance, Int. J. Coal Geol., 114, 1–18, https://doi.org/10.1016/j.coal.2013.03.013, 2013. a, b
Pharaoh, T. C.: Palaeozoic terranes and their lithospheric boundaries within the Trans-European Suture Zone (TESZ): A review, Tectonophysics, 314, 17–41, https://doi.org/10.1016/S0040-1951(99)00235-8, 1999. a
Pletsch, T., Appel, J., Botor, D., Clayton, C. J., Duin, E. J. T., Faber, E., Górecki, W., Kombrink, H., Kosakowski, P., Kuper, G., Kus, J., Lutz, R., Mathiesen, A., Ostertag, C., Papiernik, B., and van Bergen, F.: Petroleum generation and migration, in: Petroleum Geological Atlas of the Southern Permian, Basin Area, edited by: Doornenbal, J. C. and Stevenson, A., EAGE Publications, Houten, 225–253, 2010. a, b
Poprawa, P.: Development of the Caledonian collision zone along the western margin of Baltica and its relation to the foreland basin, Prace Instytutu Geologicznego, 186, 189–214, 2006 (in Polish with English abstract). a
Poprawa, P.: Shale gas potential of the Lower Palaeozoic complex in the Baltic and Lublin-Podlasie basins (Poland), Przegląd Geologiczny, 58, 226–249, 2010. a, b
Poprawa, P.: Geological setting and Ediacaran-Palaeozoic evolution of the western slope of the East European Craton and adjacent regions, Ann. Soc. Geol. Pol., 89, 347–380, https://doi.org/10.14241/asgp.2019.23, 2019. a, b, c, d
Poprawa, P. and Pacześnia, M. J.: Late Neoproterozoic to Early Palaeozoic development of a rift at the Lublin-Podlasie slope of the East European Platform-analysis of subsidence and facies record (eastern Poland), Przegląd Geologiczny, 50, 49–63, 2002. a, b
Poprawa, P. and Żywiecki, M.: Heat transfer during development of the Lublin basin (SE Poland): maturity modelling and fluid inclusion analysis, Mineralogical Society of Poland – Special Papers, 26, 241–250, 2005. a
Poprawa, P., Sliaupa, S., Stephenson, R., and Lazauskiene, J.: Late Vendian-Early Palaeozoic tectonic evolution of the Baltic Basin: regional tectonic implications from subsidence analysis, Tectonophysics, 314, 219–239, https://doi.org/10.1016/S0040-1951(99)00245-0, 1999. a
Poprawa, P., Kosakowski, P., and Wróbel, M.: Burial and thermal history of the Polish part of the Baltic region, Geol. Q., 54, 131–142, 2010. a, b, c, d
Poprawa, P., Radkovets, N., and Rauball, J.: Ediacaran-Paleozoic subsidence history of the Volyn-Podillya-Moldavia basin (Western and SW Ukraine, Moldavia, NE Romania), Geol. Q., 62, 459–486, https://doi.org/10.7306/gq.1418, 2018. a
Pożaryski, W. and Brochwicz-Lewiński, W.: On the Polish Trough, Geologie en Mijnbouw, 57, 545–557, 1978. a
Pożaryski, W. and Dembowski, Z.: Geological map of Poland and neighbouring countries without Cenozoic, Mesozoic and Permian deposits, 1 : 1 000 000, Instytut Geologiczny Warszawa, 1983. a, b
Reiners, P. W.: Zircon thermochronometry, Reviews in Mineralogy and Geochemistry, 58, 151–179, https://doi.org/10.2138/rmg.2005.58.6, 2005. a, b, c
Resak, M., Glasmacher, U. A., Narkiewicz, M., and Littke, R.: Maturity modelling integrated with apatite fission-track dating: Implications for the thermal history of the Mid-Polish Trough (Poland), Mar. Petrol. Geol., 27, 108–115, 2010. a
Schito, A., Andreucci, B., Aldega, L., Corrado, S., Di Paolo, L., Zattin, M., Szaniawski, R., Jankowski, L., and Mazzoli, S.: Burial and exhumation of the western border of the Ukrainian Shield (Podolia): a multi-disciplinary approach, Basin Res., 30, 532–549, 2018. a
Senglaub, Y., Brix, M. R., Adriasola, A. C., and Littke, R.: New information on the thermal history of the southwestern Lower Saxony Basin, northern Germany, based on fission track analysis, Int. J. Earth Sci., 94, 876–896, 2005. a
Skręt, U. and Fabiańska, M. J.: Geochemical characteristics of organic matter in the Lower Palaeozoic rocks of the Peribaltic Syneclise (Poland), Geochem. J., 43, 343–369, https://doi.org/10.2343/geochemj.1.0034, 2009. a, b
Söderlund, P., Juez-Larre, J., Page, L. M., and Dunai, T. J.: Extending the time range of apatite thermochronometry in slowly cooled terranes: Palaeozoic to Cenozoic exhumation history of southeast Sweden, Earth Planet. Sc. Lett., 239, 266–275, https://doi.org/10.1016/j.epsl.2005.09.009, 2005. a
Stephenson, R. A., Yegorova, T., Brunet, M. F., Stovba, S., Wilson, M., Starostenko, V., Saintot, A., and Kusznir, N.: Late Palaeozoic intra- and pericratonic basins on the East European Craton and its margins, Geological Society of London, Memoir, 32, 463–479, 2006. a, b
Swadowska, E. and Sikorska, M.: Burial history of Cambrian constrained by vitrinite-like macerals in Polish part of the East European Platform, Przegląd Geologiczny, 46, 699–706, 1998. a
Środoń, J., Clauer, N., Huff, W., Dudek, T., and Banaś, M.: K-Ar dating of Ordovician bentonites from the Baltic Basin and the Baltic Shield: implications for the role of temperature and time in the illitization of smectite, Clay Miner., 44, 361–387, https://doi.org/10.1180/claymin.2009.044.3.361, 2009. a, b
Środoń, J., Paszkowski, M., Drygant, D., Anczkiewicz, A., and Banaś, M.: Thermal History of Lower Paleozoic Rocks on the Peri-Tornquist Margin of the East European Craton (Podolia, Ukraine) inferred from Combined XRD, K-Ar, and AFT Data, Clay. Clay Miner., 61, 107–132, https://doi.org/10.1346/CCMN.2013.0610209, 2013. a, b, c, d, e
Świdrowska, J., Hakenberg, M., Poluhtovič, B., Seghedi, A., and Višnǎkov, I.: Evolution of the Mesozoic basins on the southwestern edge of the East European Platform (Poland, Ukraine, Moldova, Romania), Studia Geologica Polonica, 130, 3–130, 2008. a
Szewczyk, J. and Gientka, D.: Terrestrial heat flow density in Poland – a new approach, Geol. Q., 53, 125–140, 2009. a
Wauschkuhn, B., Jonckheere, R., and Ratschbacher, L.: The KTB apatite fission-track profiles: Building on a firm foundation?, Geochim. Cosmochim. Ac., 167, 27–62, https://doi.org/10.1016/j.gca.2015.06.015, 2015. a
Więcław, D., Kotarba, M. J., Kosakowski, P., Kowalski, A., and Grotek, I.: Habitat and hydrocarbon potential of the lower Paleozoic source rocks in the Polish part of the Baltic region, Geol. Q., 54, 159–182, 2010. a
Więcław, D., Kosakowski, P., Kotarba, M. J., Koltun, Y. V., and Kowalski, A.: Assessment of hydrocarbon potential of the Lower Palaeozoic strata in the Tarnogród-Stryi area (SE Poland and western Ukraine), Ann. Soc. Geol. Pol., 82, 65–80, 2012. a
Ziagos, J. P. and Blackwell, D. D.: A model for the transient temperature effects of horizontal fluid flow in geothermal systems, J. Volcanol. Geoth. Res., 27, 371–397, 1986. a, b, c
Żelichowski, A. M.: Outline of sedimentation and paleotectonics. Pre-Permian Palaeozoic, in: Geological Structure of the Pomeranian Swell and its Basement, edited by: Raczyńska, A., Prace Instytutu Geologicznego, 119, 152–155, 1987 (in Polish with English summary). a, b, c, d, e, f, g