the Creative Commons Attribution 4.0 License.
the Creative Commons Attribution 4.0 License.
 | 04 Jan 2022
Virtual field trip to the Esla Nappe (Cantabrian Zone, NW Spain): delivering traditional geological mapping skills remotely using real data
Manuel I. de Paz-Álvarez
Thomas G. Blenkinsop
David M. Buchs
George E. Gibbons
Lesley Cherns
The restrictions implemented to contain the spread of the COVID-19 pandemic during 2020 and 2021 have forced university-level educators from around the world to seek alternatives to the residential physical field trips that constitute a fundamental pillar of Geoscience programmes. The field-mapping course for second-year Geology BSc students from Cardiff University was replaced with a virtual mapping course set in the same area as previous years, the Esla Nappe (Cantabrian Zone, NW Spain). The course was designed with the aim of providing the students with the same methodology employed in physical mapping, including such skills as gathering discrete data at stops located along five daily itineraries. Data included bedding attitude, outcrop descriptions with a certain degree of ambiguity, photographs and/or sketches, panoramic photos, and fossil images. Data were provided to the students through georeferenced KMZ files in Google Earth. Students were asked to keep a field notebook, define lithological units of mappable scale, identify large structures such as thrust faults and folds with the aid of age estimations from fossils, construct a geological map on a hard-copy topographic map, draw a stratigraphic column and cross sections, and plot the data in a stereonet to perform structural analysis. The exercise allowed for successful training of diverse geological field skills. In light of the assessment of reports and student surveys, a series of improvements for the future is considered. Though incapable of replacing a physical field course, the virtual exercise could be used in preparation for the residential field trip.
- Article
(14302 KB) - Full-text XML
-
Supplement
(28841 KB) - BibTeX
- EndNote


Fieldwork has traditionally been an integral part of Geoscience teaching programmes and of Geology in particular (Compton, 1958; Boyle et al., 2007; Butler, 2008; Mogk and Goodwin, 2012). The benefits of fieldwork teaching are varied and include an appraisal of theoretical concepts through practice and sensorial experiences (Gibson, 2007); the learning of practical geological skills needed by researchers and practitioners (Butler, 2008; Whitmeyer et al., 2009); an increase in student engagement and enjoyment (Boyle et al., 2007; McConnel and van der Hoeven Kraft, 2011); and the development of transferable competencies such as teamwork, communication, critical thinking, and autodidacticism (Arrowsmith et al., 2011). Fieldwork relevance is recognised by bodies that regulate Geology degree programmes, which either establish a minimum curricular content (e.g. 60 d for 3-year degrees in the UK; Geological Society of London, 2013), or tacitly consider it essential curricular content (e.g. 40–80 d for 4-year degrees in different Spanish universities).
Fieldwork has traditionally involved different pedagogical methods. Among these methods, one of the most traditional consists of delivering a lecture in a specific location in the field while students take notes, observe the explained phenomenon and attempt to memorise it. This generates an enhanced passive learning environment where the students may gain knowledge thanks solely to the lecturer's expertise. However, it is well known among the cognitive science community that the knowledge gained through passive learning is more superficial than that gained through active learning, where students are involved in the learning process through practise and the undertaking of lecturer-designed activities (e.g. Higgs and McCarthy, 2005; Moran, 2018). While the benefits of fieldwork have long been assumed by educators, it has been difficult to demonstrate them clearly (e.g. Elkins and Elkins, 2007; Stokes and Boyle, 2009), a proviso that applies even more to virtual fieldwork.
Circumstances can limit the field access in the learning environment. Although exceptional, these situations have proved to be very trying to both staff and students, as substitute activities need to be implemented, usually in a limited time interval. This was the case, for example, during the outbreak of foot and mouth disease in 2001, when travel restrictions were imposed when travelling outside the UK, thus limiting curricular fieldwork activities (Placing and Fernandez, 2002), or during the 2010–2011 Canterbury earthquake swarm in New Zealand, which prompted a rapid substitution of college lectures with virtual lessons (Mackey et al., 2012). The ongoing coronavirus pandemic (COVID-19) has caused a major disturbance in education worldwide (Sahu, 2020), especially in highly practical disciplines where fieldwork and face-to-face practical activities are essential curricular activities (e.g. Ferrel and Ryan, 2020; Day et al., 2021; Rotzien et al., 2021). In these circumstances, many lectures have been moved to the virtual environment, where social interactions are reduced and the spread of the disease is minimised (e.g. Sahu, 2020). While this transition may be challenging for theory lessons, it is especially arduous for practical activities and especially for fieldwork (Bryson and Andres, 2020; Day et al., 2021; Rotzien et al., 2021).
Virtual fieldwork has then come to the rescue of these particular curricular formative activities, although it has been in use long before the COVID-19 crisis. Virtual fieldwork refers to the recreation of field-based activities in a classroom environment, most commonly aided by technology (Maskall and Stokes, 2008). The advantages of virtual fieldwork include, among others, (i) an absence of field-related logistical issues, (ii) accessibility to differently abled students and to those unable to attend a physical trip for other reasons, (iii) flexibility of teaching resources, (iv) ease of repetition and adaption of the exercises as many times as necessary, (v) ability to incorporate and interact with non-outcrop features such as geochemical data or seismic lines, (vi) ability to use a variety of observation scales, (vii) training of field skills prior to physical fieldwork, and (viii) opportunity to visit, even if virtually, locations that otherwise would be difficult, and in some cases impossible, to access (Hurst, 1998; Stokes et al., 2012; Cliffe, 2017).
Just like real fieldwork, its virtual counterpart has many different possible delivery modes, all of which have advantages and drawbacks. These modes include (i) virtual video field trips, recorded lectures based on field information, and photographs; (ii) textbook supplements with field case studies, each with data and related exercises (Ford and Hipple, 1999); (iii) virtual lab experiences where a lab environment is simulated in order to learn the basics of a certain subject, such as fossil identification (Placing and Fernandez, 2002); (iv) adaptive e-learning exercises where feedback is provided to students based on their responses and decisions (e.g. Mead et al., 2019); (v) virtual educational games where students use an avatar to interact with different information and scenarios where a certain learning task needs to be performed (e.g. Pringle, 2013, Virtual Landscapes, 2020; Needle et al., 2021); (vi) virtual-reality tours that provide the students with an immersive 3D experience using a head-mounted display through which they may interact with a virtual environment and utilise different data; (vii) virtual globe experiences, where a 3D visualisation of rocks, structures, and topography is possible that may be supplemented with photographs, sketches, and outcrop descriptions (Blenkinsop, 2012; Whitmeyer et al., 2012; Whitmeyer and Dordevic, 2020; Rotzien et al., 2021; Bond and Cawood, 2021; Toy et al., 2021; Mahan et al., 2021; Marshall and Higley 2021). The effectiveness of these approaches depends largely on the degree of student engagement in the learning process itself, the type of information available to the students, the way in which the working data are provided and the nature of the final outcome of the activity. In many cases, the virtual fieldwork is little more than a “show and tell” activity in which students are presented with images and data with which they do not work with, thereby losing much of the pedagogical potential that virtual fieldwork can provide.
In this paper we present a virtual fieldwork course, the Esla Mapping Project, designed during the spring of 2020 for second-year Geology BSc students of the School of Earth and Environmental Sciences of Cardiff University. The virtual fieldwork was produced as a substitute mapping exercise for students in the academic years 2019/2020 and 2020/2021 as a consequence of the COVID-19-related restrictions in place that resulted in the closure of the campus and the generalised lockdown in the UK and elsewhere. The Esla Mapping Project was designed to achieve as many of the aims as possible of the original field-based mapping, including a strong emphasis on development and testing of hypotheses, development of 3D and 4D thinking, and understanding of how structural and stratigraphic knowledge iteratively converge to a solution. The results reported in this contribution largely refer to the 2019/2020 version of the Esla Mapping Project, which has been slightly improved during the second 2020/2021 run.
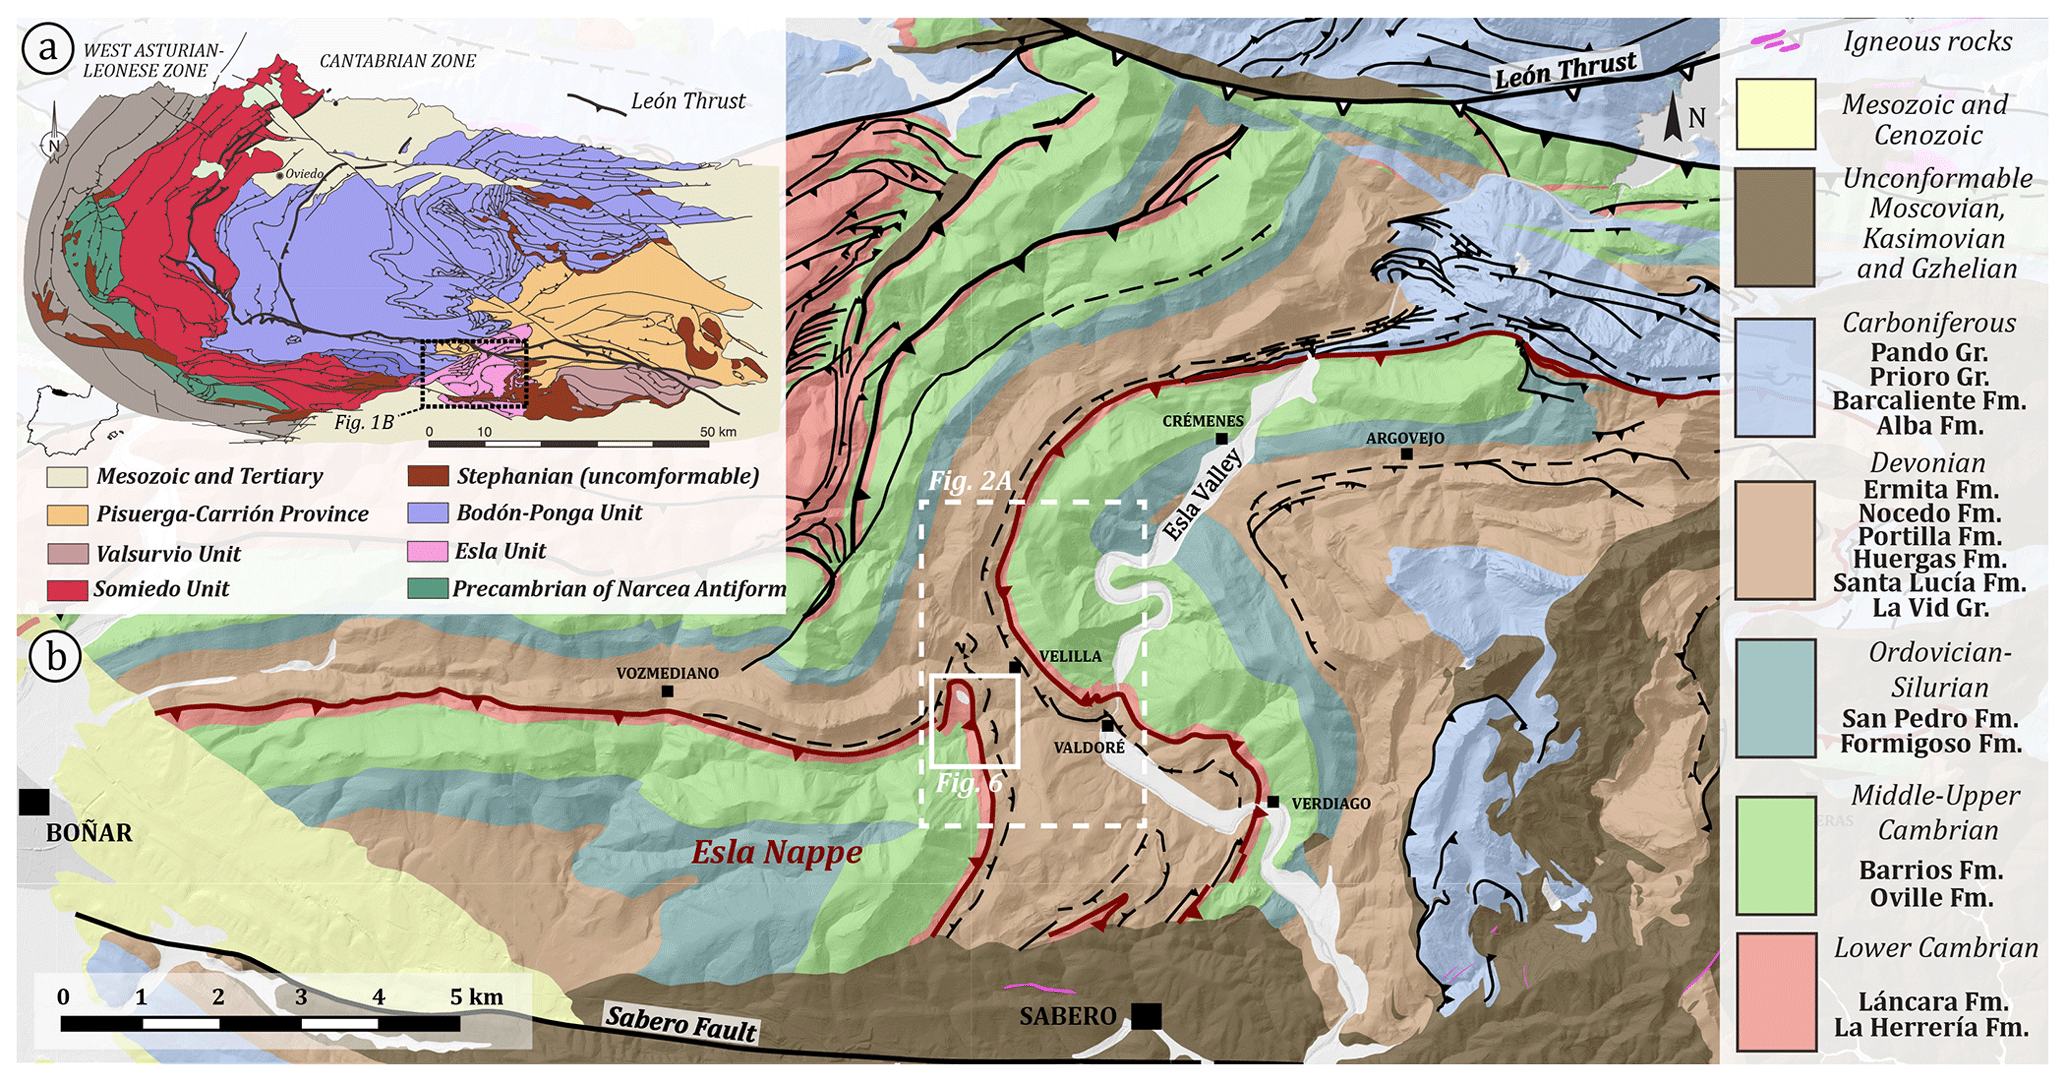
Figure 1(a) Geological map of the Cantabrian Zone modified from Alonso et al. (2009). (b) Simplified geological map of the Esla Nappe modified from Merino-Tomé et al. (2014).
2.1 Working area
In previous years, a 5 d field-mapping course was run in the Cantabrian Mountains of NW Spain for second-year students of Cardiff University. The trip was centred on the Esla Nappe, one of the main thrust units that comprise the Cantabrian Zone, the foreland fold-and-thrust belt of the Variscan Orogen in the NW Iberian Massif (Fig. 1; de Sitter, 1959; Rupke, 1965; Arboleya, 1978; Alonso, 1987; Alonso et al., 2009; and references therein). The major geological features of the mapping area are a sequence of Cambrian to Devonian carbonates and siliciclastic rocks deformed at sub-greenschist facies in the Variscan orogeny. The major structure consists of a nappe (the Esla nappe) that carries Cambrian and Ordovician formations over Silurian–Devonian rocks along a bedding-parallel thrust in the mapping area (i.e. with both hanging-wall and footwall flats). The nappe has been folded in two major different orientations, giving rise to a relatively complex outcrop pattern. The recognition of the thrust depends on the correct interpretation of the age sequence via fossil evidence and is locally supported by breccia outcrops on or near the thrust plane. The area is exceptional for geological mapping training owing to the outstanding exposure, the variety of sedimentary rocks, the good preservation of thrust sheet geometry and structures, and the subsequent deformation of the nappe through a set of folds that result in a variety of cartographic patterns within a relatively small area.
The virtual Esla Mapping Project was designed to cover the same area used in previous years around the locality of La Velilla de Valdoré. The location selection was made based on three key motives: (i) using the same location would allow for continuity in the learning of students across different years, (ii) the virtual exercise could be used in later years as an introduction to the real field trip, and most importantly (iii) the authors' detailed knowledge of the Esla Nappe from both a research and educational point of view.
2.2 Student background
The Esla Mapping Project was planned for second-year students of the 3-year Geology and Exploration Geology BSc degrees at Cardiff University, a group of 60 students. At this stage the students have had limited field experience, including only basic mapping training. Students had, however, previously received training in the description and interpretation of structural, sedimentary and palaeontological features adapted to the geological complexity of the mapping area. The residential field trip to the Esla Nappe was intended to provide them with the necessary geological and organisational skills to undertake a 5-week independent mapping project during the summer between their second and third years, which eventually results in their Geology dissertation, presented in their third year as a key part of their BSc degree.
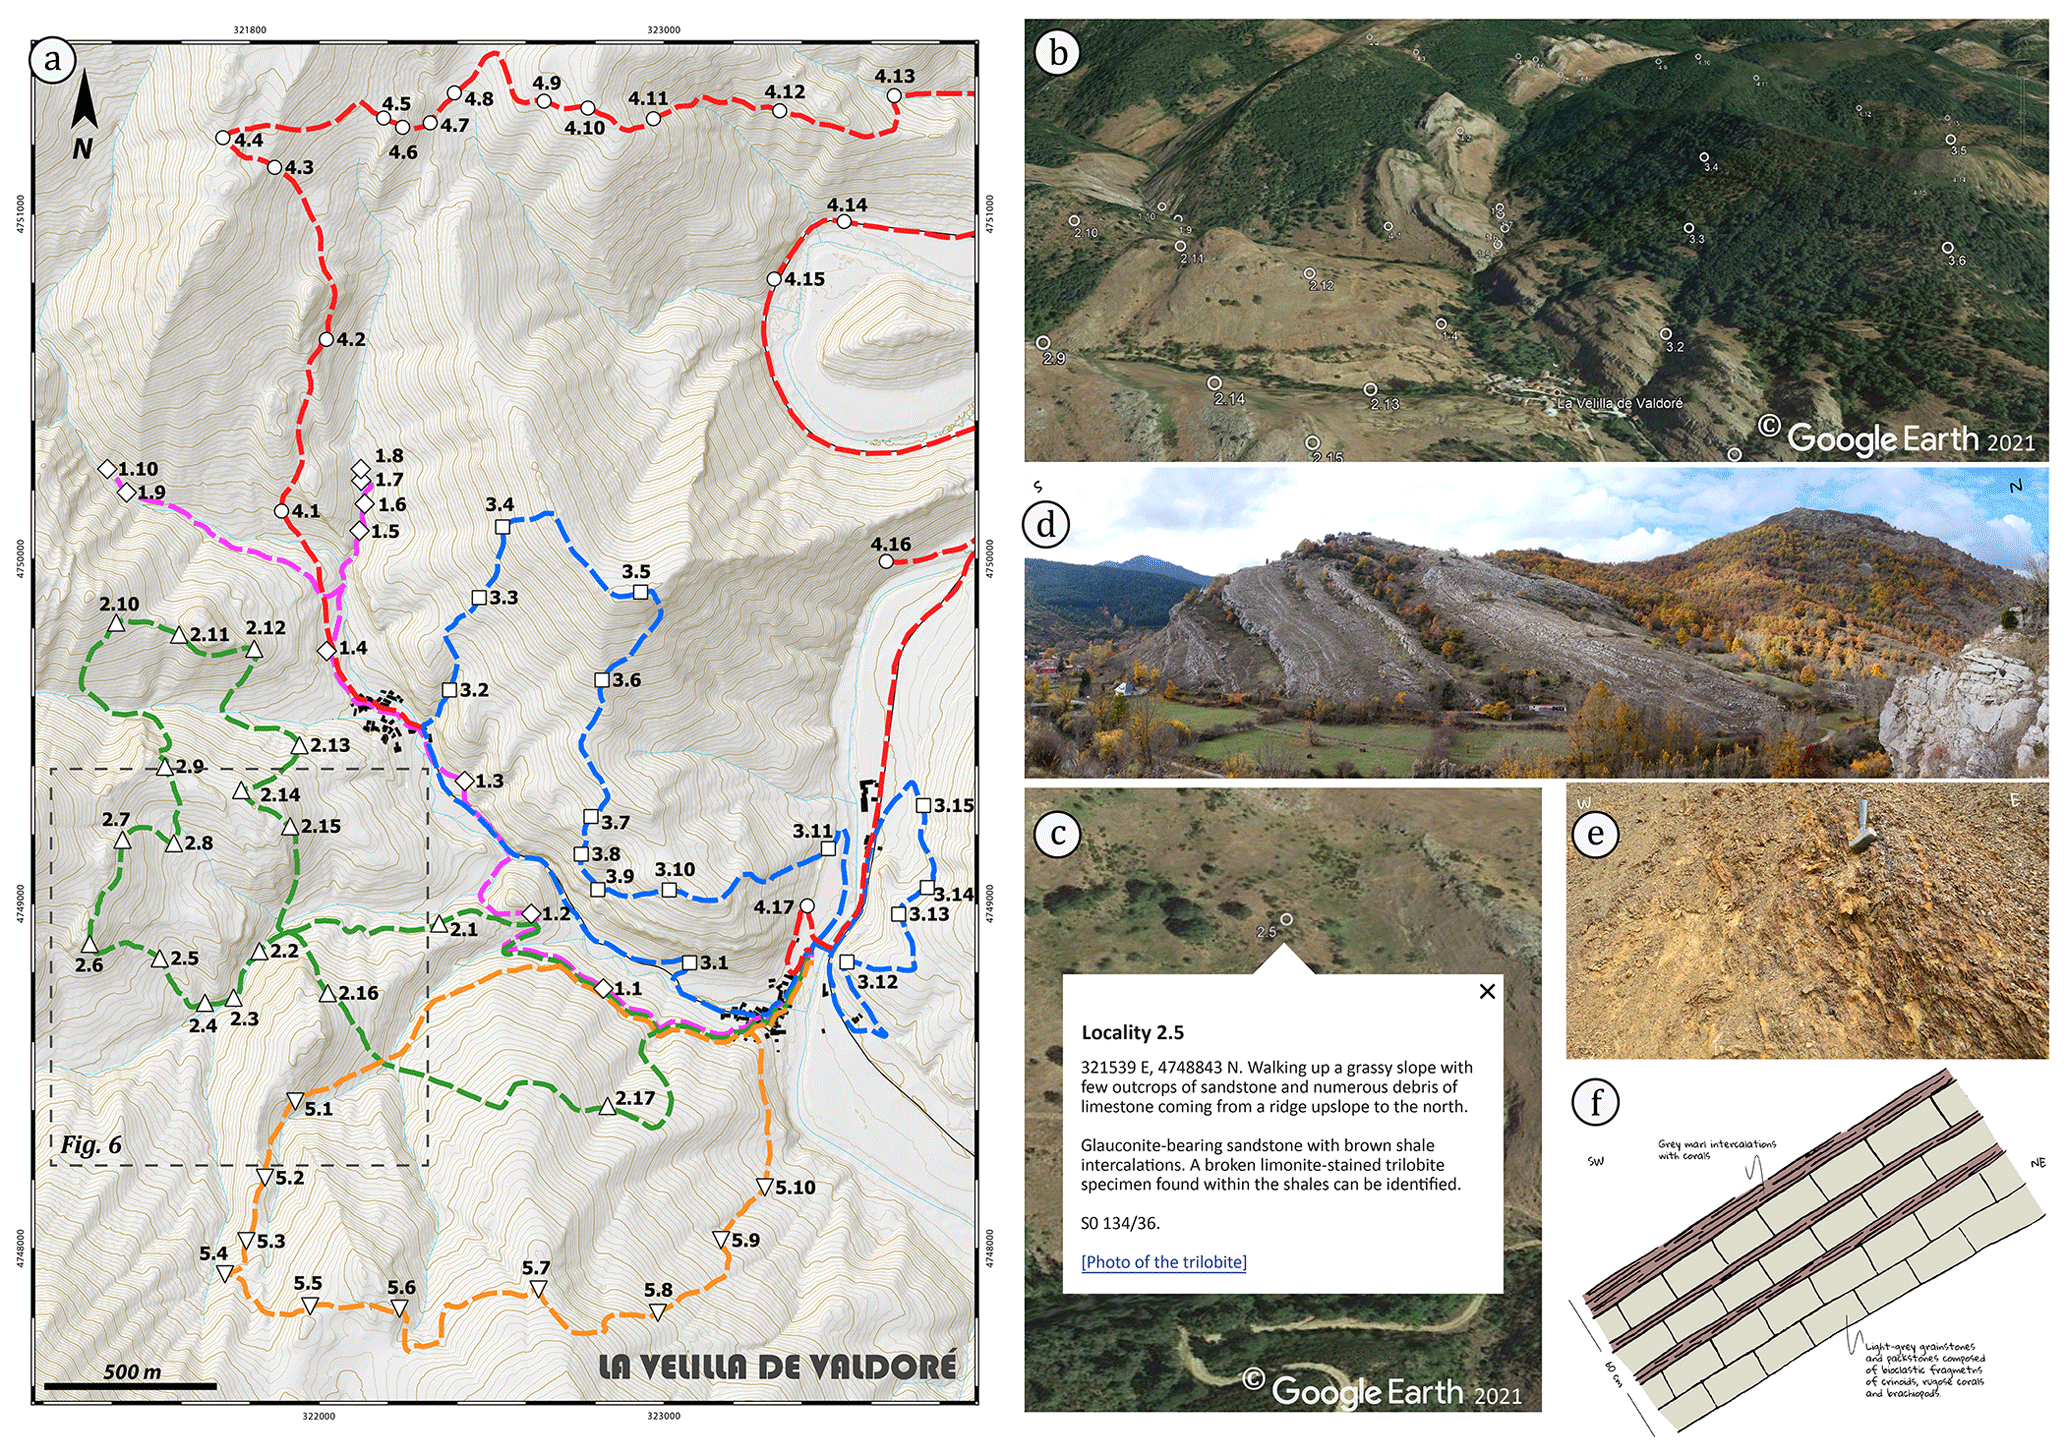
Figure 2Outline of different elements of the Esla Mapping Project. (a) Daily itineraries of realistic walking distance with a number of stops along the way. The XY notation refers to the day (X) and the stop (Y). Map derived from digital elevation model provided by IGN (National Geographic Institute of Spain). See Fig. 1a for the location. (b) Tilted view of the northern part of the mapping area looking north with the stops shown as white symbols (© Google Earth 2021). Based on the information contained on each of the stops, students coloured the pins accordingly. (c) Example of data provided to the students at one of the stops. The photo of the trilobite is accessed by a link to an image stored in the GitHub repository, opened within Google Earth (© Google Earth 2021). (d) Panoramic view provided at stop 3.13 looking west: students were asked to inspect it and draw an annotated field sketch. (e) Outcrop photograph provided at stop 4.3 to familiarise the students with the provided rock description. (f) Outcrop sketch provided as data to the students at stop 5.1.
2.3 Field trip organisation
The virtual field trip was designed to mimic physical mapping methodology and experiences as closely as possible. The ultimate goal of the exercise was for the students to be able to generate a geological map of a portion of the Esla Nappe remotely while at the same time getting a feel for some of the field-based procedures. The exercise involves an adapted conventional field methodology where the students keep a record of field observations, annotations and bedding attitude in a field notebook taken in certain localities recorded on a topographic map. For this purpose, five realistic daily itineraries were designed with similar lengths to those covered during real fieldwork days, with between 10 and 17 localities per day (Fig. 2). A variety of information is provided to the students in the form of field annotations for each of the stops and included (i) field outcrop descriptions of the rock types, sedimentary structures and structural features, (ii) outcrop photographs, (iii) annotated outcrop field sketches, (iv) outcrop-scale stratigraphic columns, (v) fossil photographs and/or fossil species found in the locality, (vi) panoramic photographs taken from the location, (vii) bedding attitude, and in some cases (viii) way-up criteria (Fig. 2). The data are distributed among the different stops so that not all of them contain the same type of information. In addition, all locations include their geographic coordinates in the WGS 84 coordinate system. All the provided data are a truthful representation of real locations in the Esla Nappe, except in the case of some fossils, which have been found in other areas of the Cantabrian Zone. With the exception of the fossil images and species, which were obtained from the literature (Supplement), all the bedding measurements, field descriptions, photographs and sketches are original data collected by the authors throughout the years for educational and research purposes. The wealth of these data has been key to the successful implementation of the Esla Mapping Project.
2.4 Materials used
All the information was made available to the students in the form of a KMZ file to be opened in Google Earth. The selection of Google Earth as the platform was based on its ease of installation, its performance on average personal computers, and the students' previous learning experience with the software, which has included a basic mapping exercise. Other geographic information systems were considered, such as QGis® but were rejected due to their steeper learning curve for the students. Nonetheless, some of the material provided to the students was produced with the aid of QGis® software and then exported as KMZ files to be used in Google Earth. Each of the stops in the KMZ file contained a text description with the provided data, as well as a link to web-hosted material such as photographs or sketches. In order to minimise computing resources on the students' varied range of computers, the decision was made to host the graphic material such as sketches and field photographs in a web application, instead of inserting them within the KMZ file, which could have resulted in an unsatisfactory Google Earth performance in some cases. The chosen web application was GitHub repository due to (i) its widespread use among the coding community, which ensures a long-term storage of the files, (ii) the fact that it is free for open-source projects, (iii) its good performance for repositories with less than 1 Gb, (iv) and its ample file size limit of 100 Mb, more than enough for photographs and sketches. The repository generates readily accessible file links that can be inserted into the text in the KMZ files. The links redirect to the material from within Google Earth without the need to open third-party web browsers.
In addition to this KMZ file with the outcrop locations, data and observations, students were also provided with topographic contours in a KMZ file with 5 m intervals generated in QGis® from a digital elevation model obtained from the IGN (National Geographic Institute of Spain), a SK2 spreadsheet to generate 3D structural symbols showing the orientation of planar and linear features in Google Earth (Blenkinsop, 2012), a fossil guide with identification keys and related ages based on specimens sampled in the area over the years, and a mapping guide. The mapping guide informed the students of the materials available to them for the completion of the Esla Mapping Project, the required software operation, the learning outcomes of the exercise and instructions for the different tasks to be performed. In addition to the digital dataset, the students were provided with the physical materials necessary to complete the exercise. This material included (i) a hard copy of a topographic map with basic topographic contours, elevation points, coordinates, and a northing and easting grid (see the Supplement); (ii) a hard copy of a stereographic projection net, tracing paper, and pin; (iii) graph paper for the cross sections, and (iv) a field notebook. Owing to the lockdown in place, this material was delivered by post to all the students.
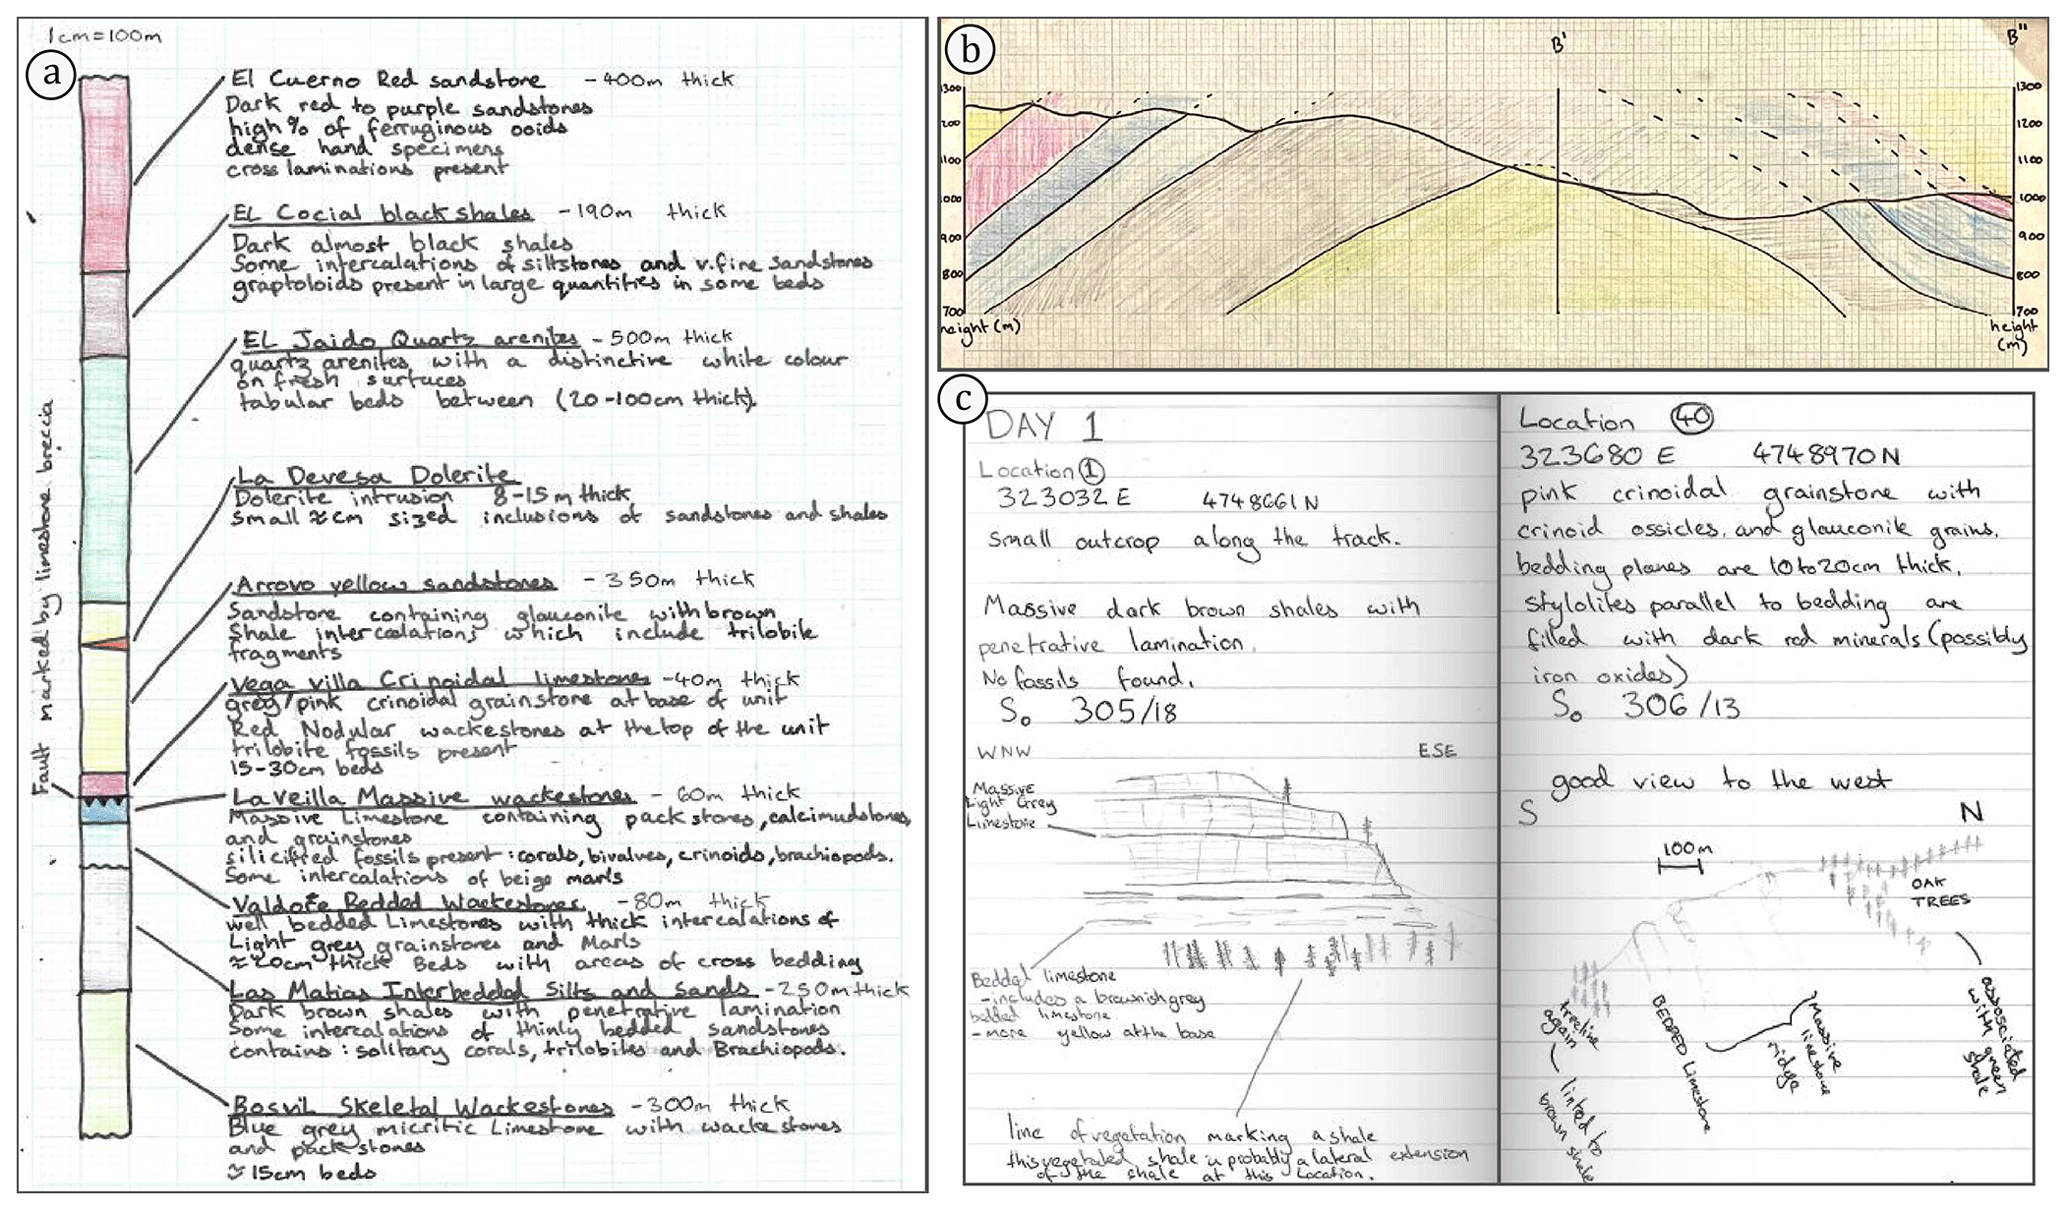
Figure 3Tasks performed by students during of the Esla Mapping Project. (a) Stratigraphic log of the lithological units identified in the area, displayed in a tectono-stratigraphic order. (b) Cross section through the central part of the mapping area showing the Pardominos Anticline. (c) Example of field notebook pages where a student has transcribed the information provided and drawn field sketches from panoramic photographs (see Fig. 2d for comparison with the lower-right sketch).
2.5 Learning outcomes
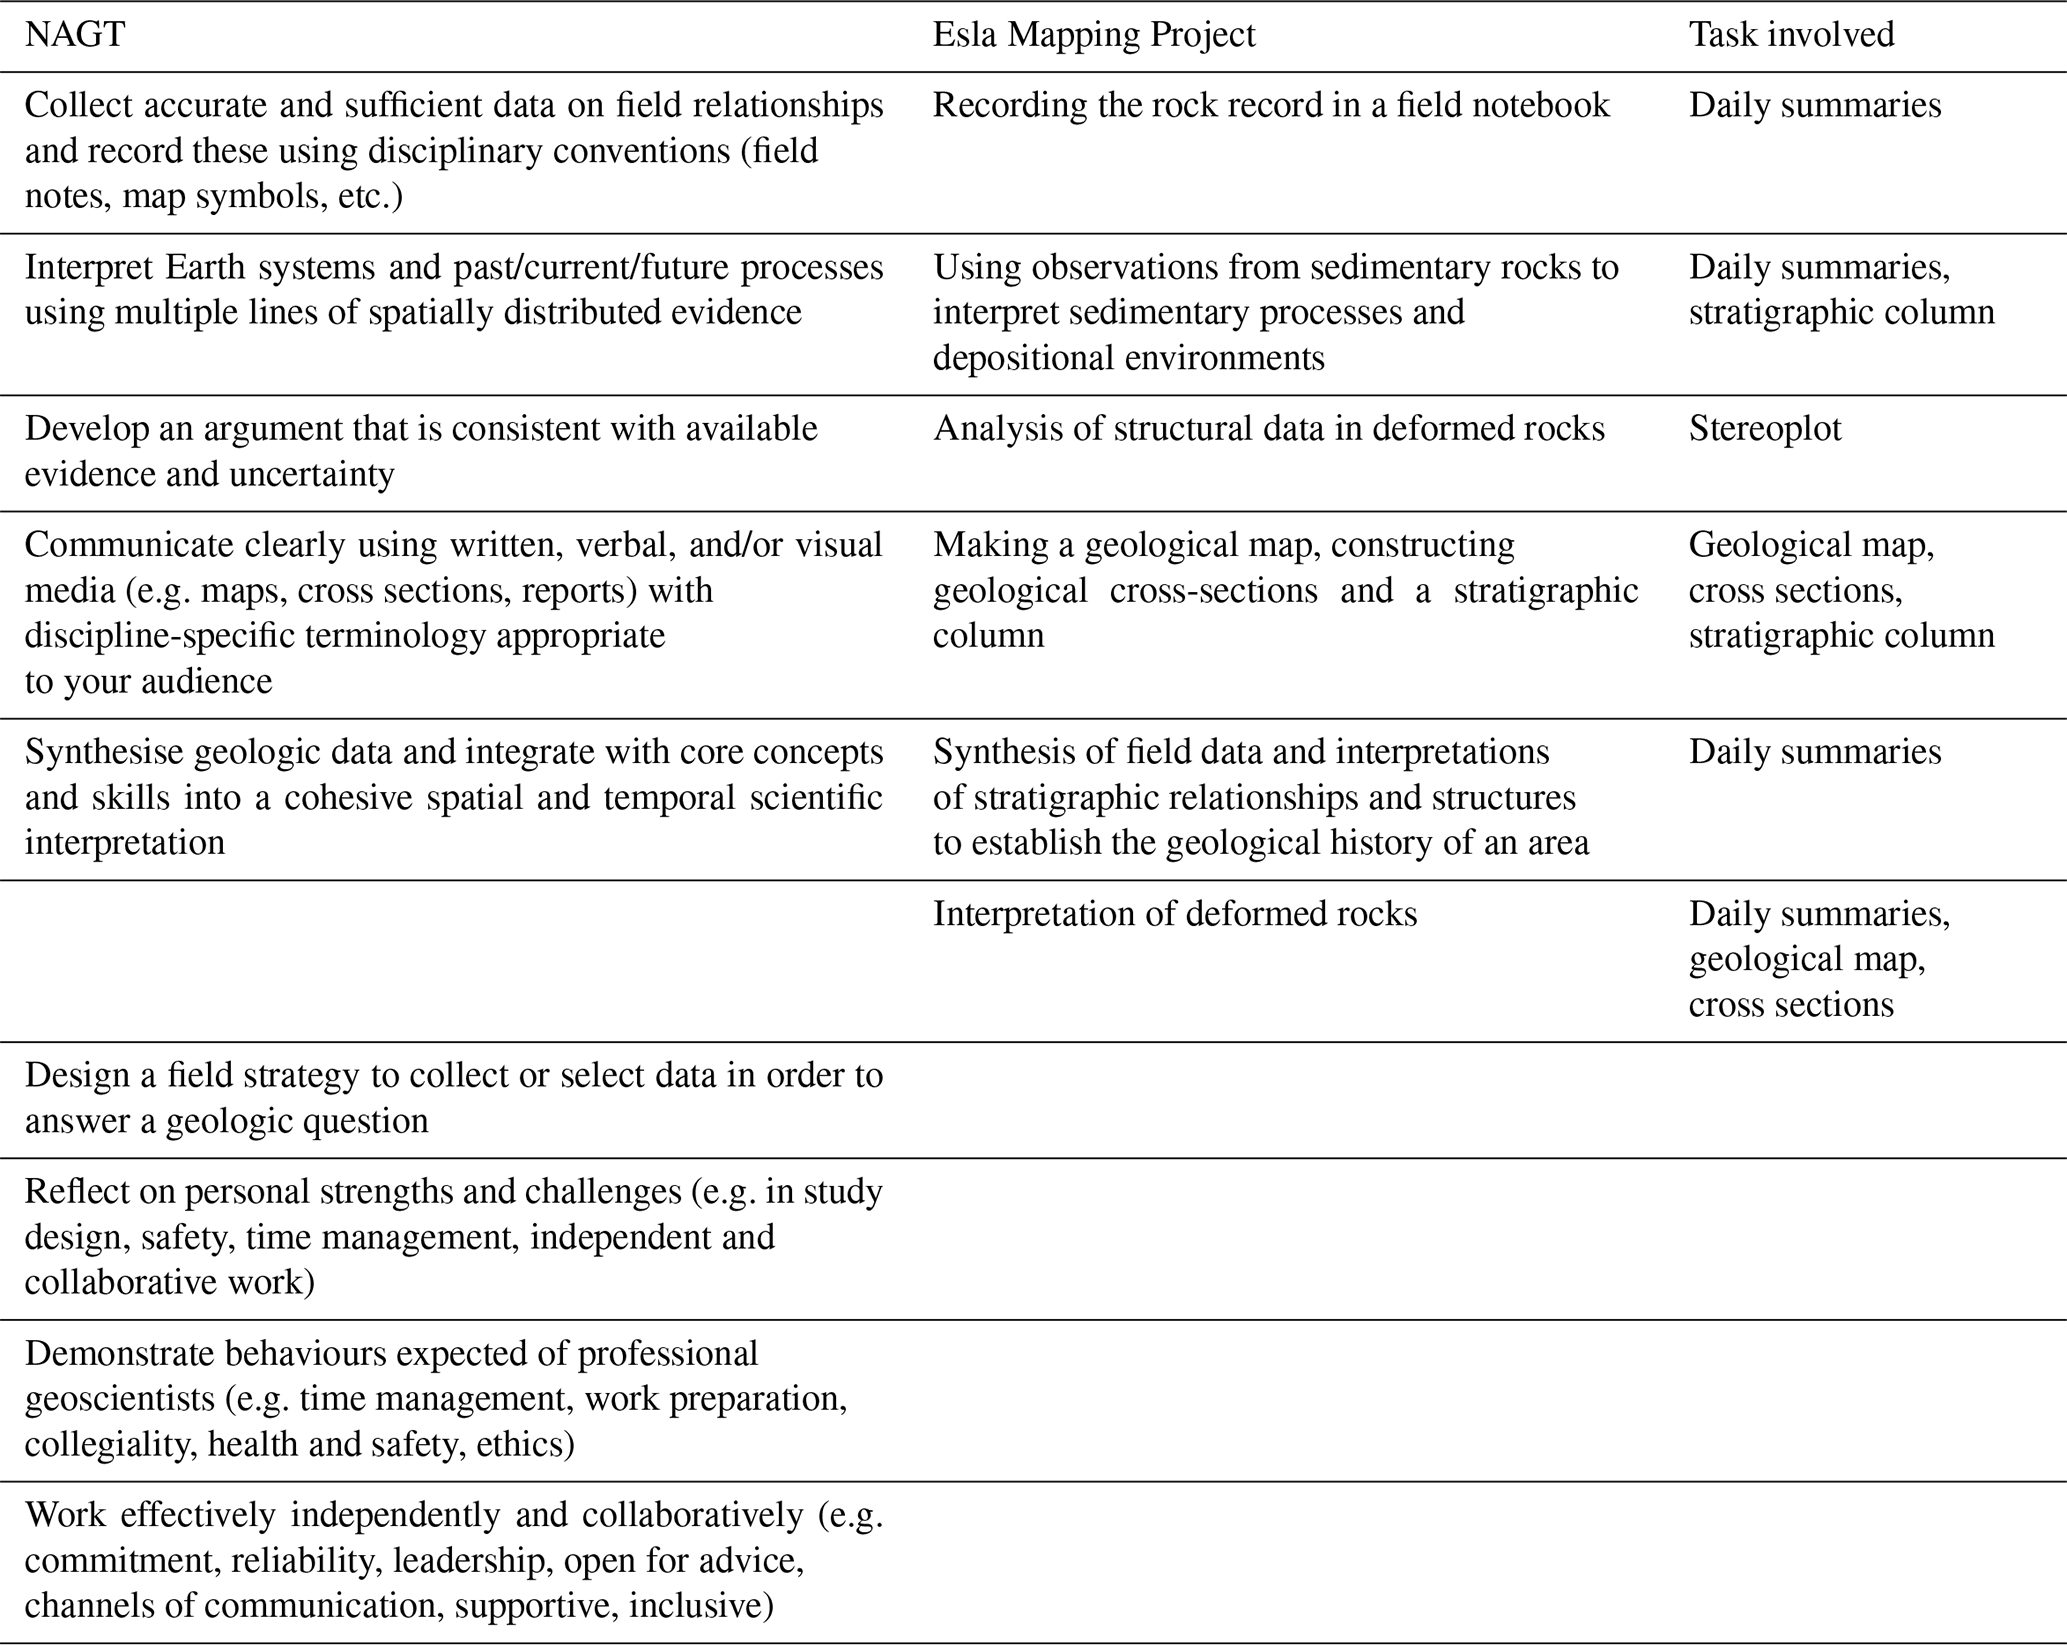
The field trip was designed to achieve the learning outcomes that are specified in Table 1. The table also shows the learning outcomes created for virtual field experiences by the National Association of Geoscience Teachers (NAGT, 2020). These have similarities with some of the more specific learning outcomes of the Esla Mapping Project. The learning outcomes of the exercise are the same as those for the physical trip that was run in previous years: the obvious difference between the trips is that the list of skills expected from the physical trip includes practical aspects such as the use of a compass-clinometer and locating oneself in the field on a topographic map.
Table 1Learning outcomes from the National Association of Geoscience Teachers (NAGT) for virtual field experiences and for the Esla Mapping Project, indicating the tasks in which they are involved.
2.6 Objectives and assessment
The objectives of the Esla Mapping Project were to produce a report with five assessed sections (Fig. 3). The first one consisted of a daily summary of the field notebook that contained (i) some of the information explicitly provided in the stops; (ii) information inferred from outcrop photographs and sketches such as rock type, age, younging direction, sedimentary structures, and tectonic structures; (iii) bedding data provided and calculated by the students from structural contours, making use of the drawn geological contacts and the topographic map; (iv) annotated sketches drawn from panoramic photographs; (v) interpretation of depositional environments; (vi) provisional stratigraphic columns; (vii) and a table of geological events. The second section was the production of an A3 geological map from the information provided and inferred. Students were instructed to colour each of the KMZ stops according to their descriptions, from which they had to infer the different lithological units and the nature of their contacts (i.e. conformable, unconformable, tectonic) and correlate them throughout the area in a similar way to the physical mapping exercise. With the aid of topographic contours and Google Earth satellite images, they drew form lines for different lithologies, identified high-angle faults affecting the sequence and obtained bedding data from structural contours in areas where none were provided. All the information was to be transferred to the topographic hard-copy map, where students were asked to draw the contacts of the different identified lithological units, colour them, identify and draw fold axial traces, and draw bedding and younging symbols. The third section consisted of drawing two cross sections in the south and north of the map, choosing appropriate locations normal to the local strike of the lithological units. The fourth section was a stratigraphic column with the defined lithological units, with an estimation of their thickness from the geological map and cross sections, an estimated age based on fossil content, a brief lithological description, and an inference of their depositional environment. Finally, the fifth section consisted of plotting bedding plane measurements on a lower-hemisphere equal-area stereoplot and recognising and calculating fold hinges using π pole girdles from selected data.
2.7 Duration and implementation of the Esla Mapping Project
After a 1 h virtual briefing about the virtual exercise, the students had 20 d before electronic submission of the daily journals, map, cross sections, stereoplots and stratigraphic columns. During this period three online question and answer sessions of 1 h each were run by teaching staff, and six 1 h online clinics were run by postgraduate demonstrators, which mimicked the style and level of contact teaching that would have been carried out in the field. Students were encouraged to work in pairs or groups of three, but it was emphasised that they needed to submit their work individually and that plagiarism would be checked. Students were expected to work on the project for about 40 h, which is a similar amount as during previous years' residential field trips. The deadline of 20 d was given in order to ensure all students had enough time to adequately complete the exercise bearing in mind their different personal circumstances during lockdown.
In this section, results of the implementation of the mapping exercise are described based on a qualitative comparison between the final outcome of the physical and virtual trip in the same area, an evaluation of the student reports, and the analysis of student feedback through questionnaires, adapting previous field trip evaluations described in the literature (e.g. Boyle et al., 2007; Elkins and Elkins, 2007; Stokes and Boyle, 2009).
3.1 Comparison between the outcomes of the physical and virtual trips
The report produced by a second-year student in the field during the 2019 campaign was compared with a report produced by the same student via the Esla Mapping Project in 2020. Although the student had gained considerable experience in the time between both reports, this comparison allowed differences in the mapping experiences to be evaluated. The time spent on both trips was similar, around 8 h d−1 over 5 d. The area covered in the Esla Mapping Project is larger than during the physical trip (10 vs. 6 km2), which results in the recognition of more lithological units (stratigraphic column of 2.2 vs. 0.85 km) and a refinement of the data used for fold axes calculations. However, this came at the expense of the level of detail attained through the virtual exercise, which is lower than what could be achieved in the field, especially in complex areas where geological changes occur at a small spatial scale, such as some exposures of the base of the Esla nappe.
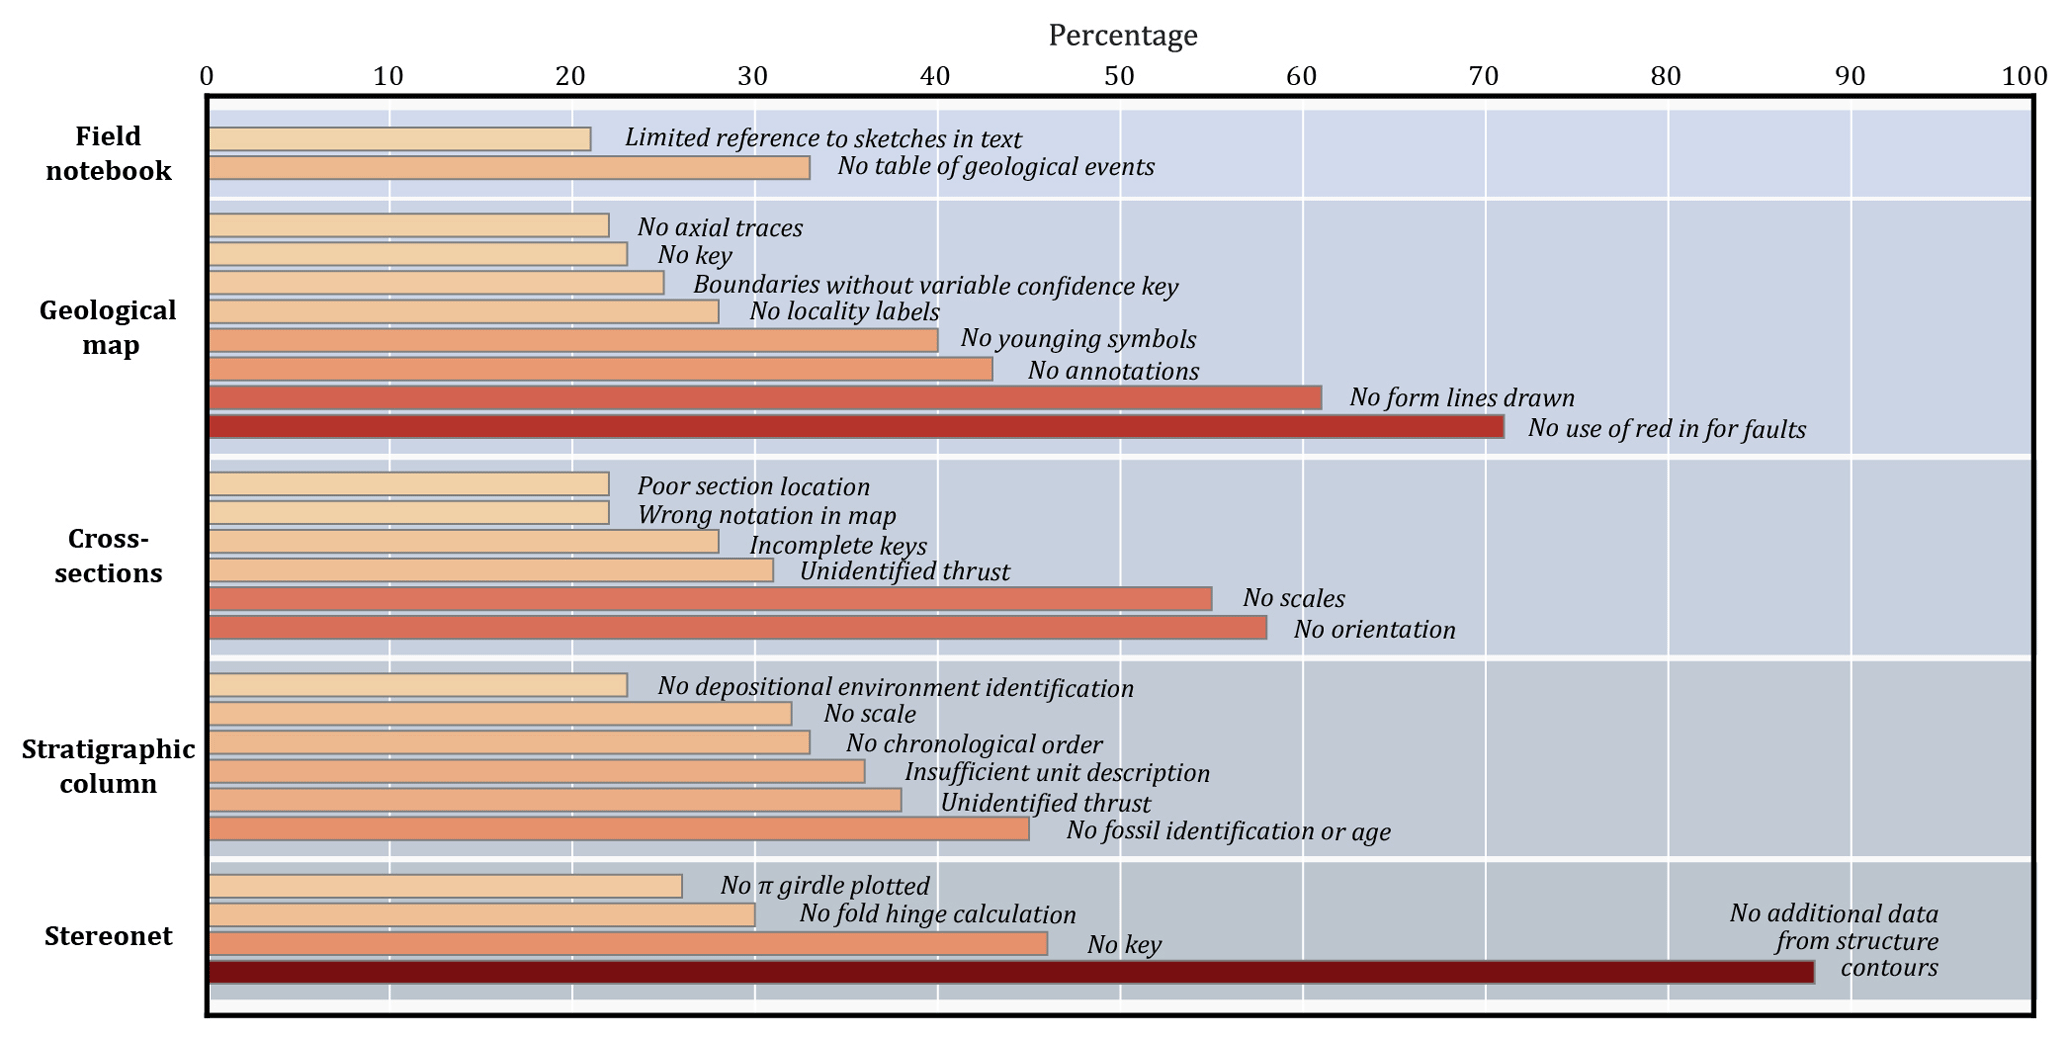
Figure 4Most common student mistakes in the different tasks that comprise the Esla Mapping Project. Most of them could be easily rectified with a more comprehensive set of instructions and preparatory lessons. Percentage is calculated from a total number of students of 60.
3.2 Evaluation of student reports
Most students identified and grouped formations appropriately and mapped geological boundaries in approximately the correct places. The majority also identified the critical Esla thrust. The major weaknesses of the maps, apart from failing to follow good mapping conventions, such as using a different colour for structures and omitting younging symbols or a key, was the lack of form lines on the maps, which inevitably meant that geological boundaries were not realistic with respect to topography (Fig. 4). The geological summaries were sometimes little more than repetitions of supplied information with no consideration of its significance. Sketches in the summaries were commonly of the photographs supplied and rarely of landscape views visible in Google Earth. Cross sections mainly lacked conventional section information such as orientations or one or both vertical and horizontal scales. Stratigraphic columns lacked fossil identification and ages or formation descriptions. The most common weakness of the stereoplots was failure to add data obtained from structure contour measurements, but a lack of a key, fold hinges and pi-pole girdles were common. The reports produced from the Esla Mapping Project obtained lower marks than the reports produced during physical trips in previous years (56 % vs. a 5-year average of 62 %).
3.3 Analysis of student feedback
Students that attended the Esla Mapping Project were given two questionnaires: one at the end of the exercise (Q1) and another after 8 months (Q2). Students that attended the physical field trip in 2019 were asked to complete a different questionnaire 20 months after their trip (Q3).
The main outcome of the student text box comments in Q1 and Q2 is in agreement with the results derived from the report assessment. Students felt the need for a more extensive taught section prior to the start of the Esla Mapping Project, including a reminder of geological concepts needed to adequately complete the exercise and a basic crash course in the use of Google Earth (though this was included in the briefing), as well as more detailed instructions about the different tasks and the estimated time they should spend on each of them. The results of the score-based questionnaires are shown in Fig. 5. The spread in student answers shows that there was a range of experiences for the students. While for some of them the experience seems to have been very positive, others feel that their geological skills have not particularly improved as a result of the virtual exercise. There were three common answers to Q2 and Q3, related to the perceived student ability to undergo future independent mapping campaigns after the Esla Mapping Project (Q2) or the physical field trip (Q3). Unsurprisingly, students feel much less prepared to face a mapping project on their own after the virtual mapping exercise than after the physical trip ( vs. , respectively).
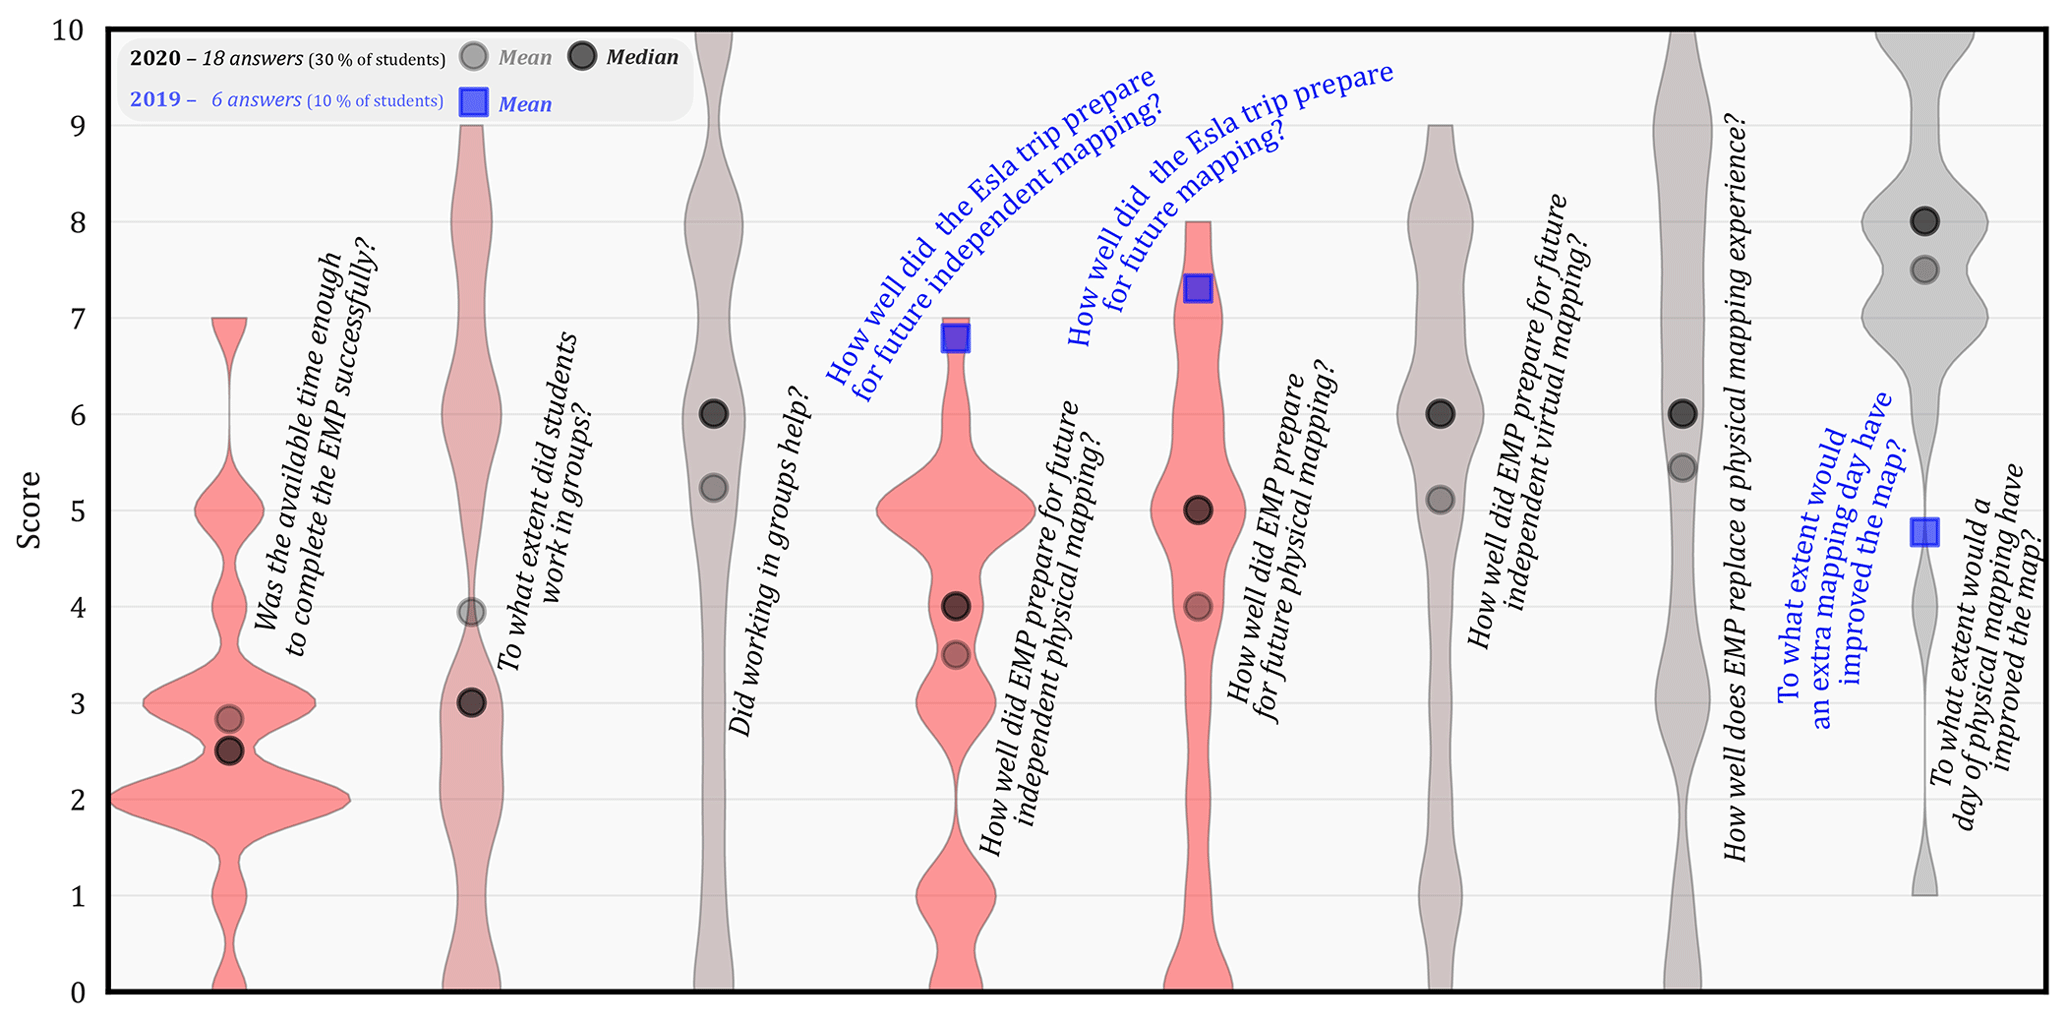
Figure 5Violin plots (i.e. two-sided histograms) of the students' answers to a score-based questionnaire (Q2) that surveyed their responses to the Esla Mapping Project. Note the large spread in their answers. In three cases, the same question was posed to previous year students (Q3) that participated in the residential field trip to the Esla Nappe: they are labelled in blue. The 2019 and 2020 percentages are calculated from a number of students of 57 and 60, respectively.
4.1 Evaluation of the learning outcomes
The Esla Mapping Project can be considered an overall satisfactory experience for the students in developing key geological skills. A comparison between the continuous digital geological map of Spain (GEODE) from the Spanish Geological Survey (IGME; Merino-Tomé et al., 2014) and a selected area of the geological map produced by students in the virtual exercise is provided in Fig. 6. The map attests to the success in the students' learning in the virtual project of the extrapolation skills necessary for the elaboration of a geological map. As would be expected from any geological survey at a 1:10 000 scale, it allows the differentiation of lithologies at the member scale of officially defined formations.
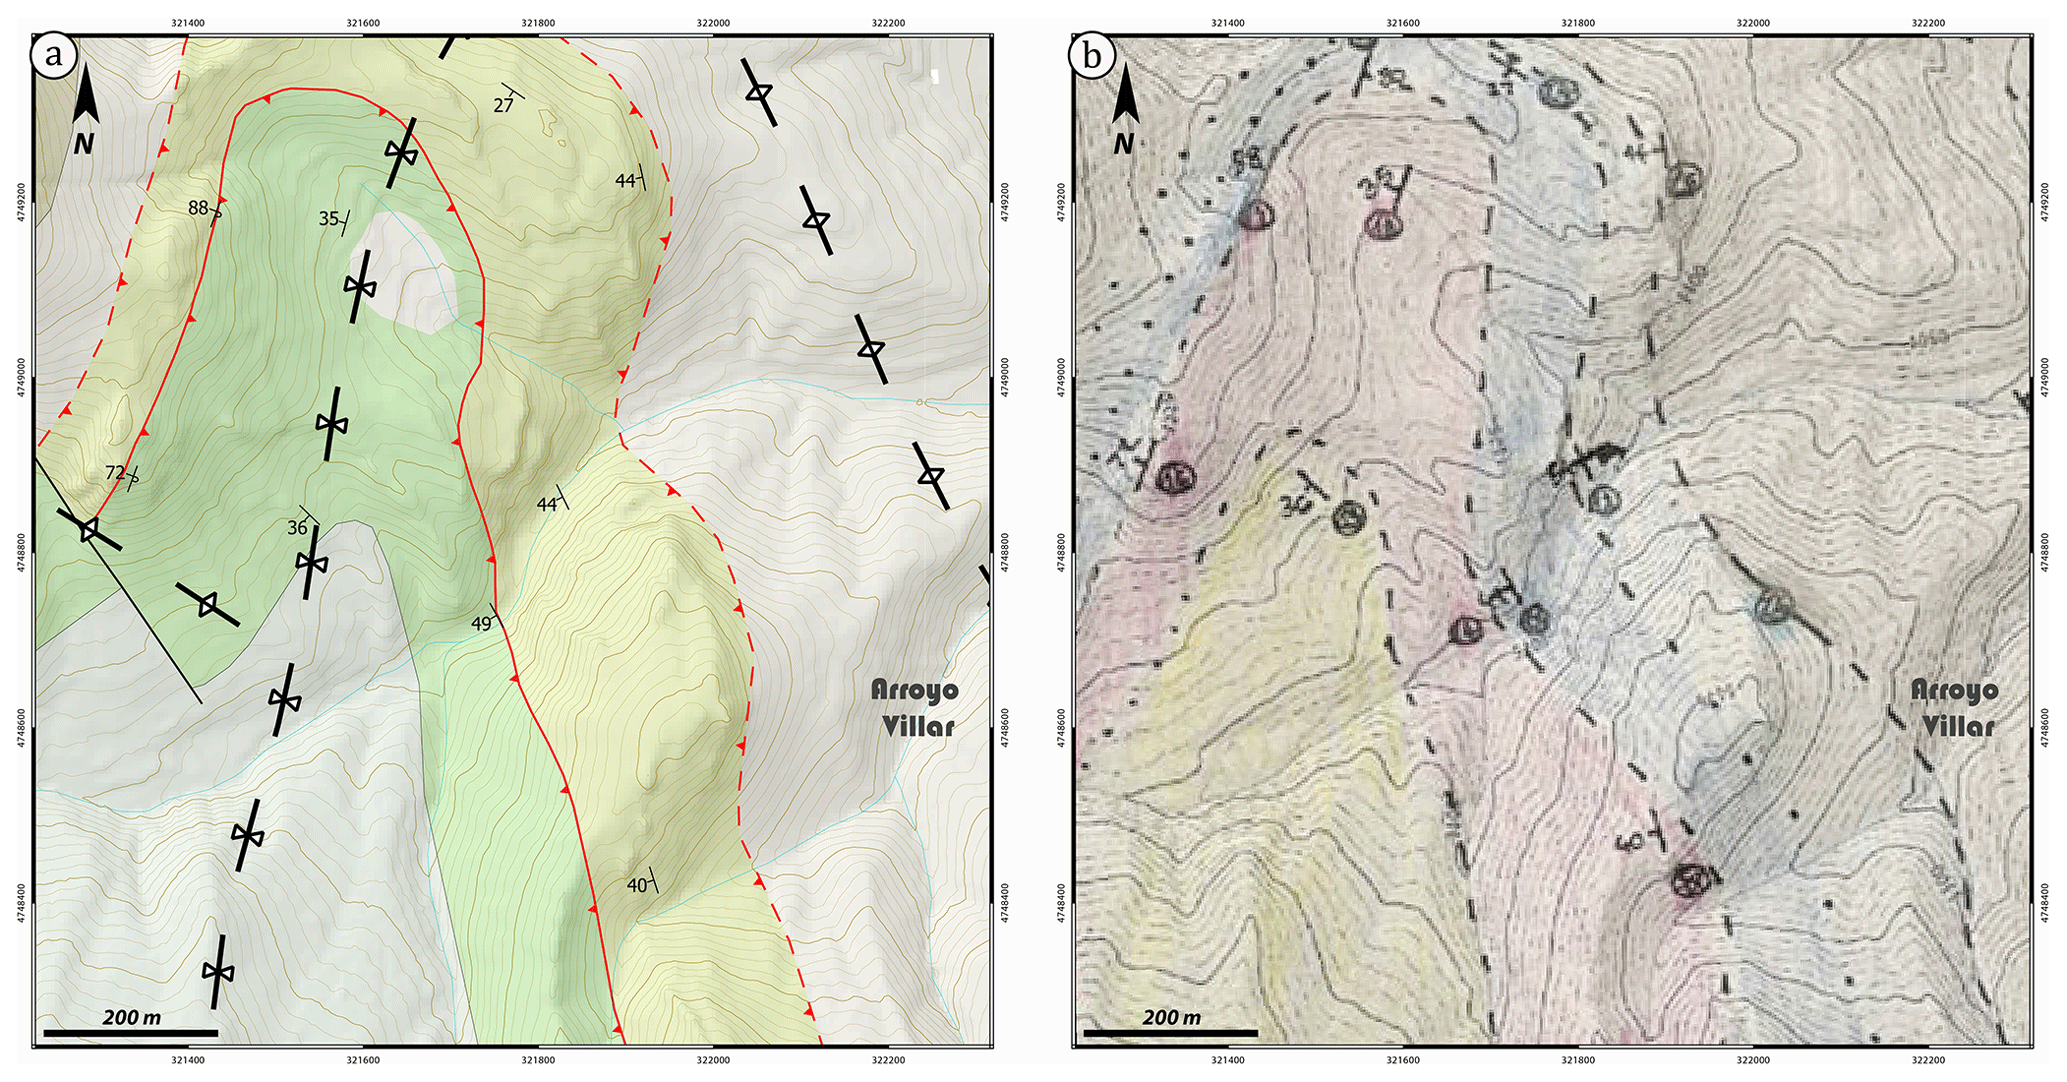
Figure 6Detail of the geological map of the Esla Nappe immediately west from the locality of La Velilla de Valdoré (see Fig. 1b for the location). (a) Modified version of the continuous digital geological map of Spain (GEODE) from the Spanish Geological Survey (modified from Merino-Tomé et al., 2014). Bedding data are the same as those provided to the students in the Esla Mapping Project. (b) Geological map produced by one of the students as a result of the Esla Mapping Project. Note that the cross section shown in Fig. 3b was not drawn through the syncline shown in this map but through the more eastern Pardominos Anticline (axial trace shown on the NE corner of a).
The learning outcomes were variably met by the students, as attested by the large spread in the grades achieved in the different tasks (Fig. 7). The grades related to the field notebook and the geological map are lower than in previous years of the physical trip (Fig. 8). On the other hand, the grades of the cross sections, stratigraphic columns and stereoplots are in the same range as in previous years. This is not surprising, since these tasks have the lowest degree of field interaction. The lower overall marks attained by the students doing the virtual project than previous year's physical mapping trips is a cause for concern about the relative effectiveness of the virtual trip in achieving the learning outcomes. Several factors may have played a role. Preparation of students may have been at a lower level prior to the Esla Mapping Project, arising from the COVID-19 lockdown and the associated decrease in practical training. There may have been less training in digital mapping techniques than in physical mapping. However, the majority of marks were lost due to a mundane failure to follow standard protocols for preparation of maps, sections, stratigraphic columns and stereoplots, such as omission of keys and scales. One major factor behind this may be the lack of peer-to-peer learning that is greatly facilitated on a physical trip by contact in the field and in the evening when maps are revised and “inked-in”. Another possible explanation is that mapping in the field requires a high level of physical and intellectual engagement by the students, which could foster deep learning but is difficult to fully replicate with a virtual exercise.

Figure 7Violin plots (i.e. two-sided histograms) of the students' grades on the different evaluated tasks. Note the large spread in the grades.
From the evaluation of student reports and surveys, the implementation of the Esla Mapping Project lacked some areas that would have helped the students in improving their learning outcomes. These largely refer to preparatory teaching and the instruction document. Some students struggled with (i) the drawing and annotation of geological sketches, (ii) the nomenclature of important geological structures, (iii) the relation between the attitude of lithological units and topography, which hindered the calculation of their own bedding data from structural contours, (iv) the adequate construction and annotation of a cross section, (v) the construction of stratigraphic columns and how they are different from sedimentary logs, (vi) the plotting of data on a stereonet and its use to derive structural data such as fold hinges and hinge surfaces, (vii) the basic functioning of Google Earth, and (viii) the taking of document photographs, some of which were of low quality (largely due to lighting conditions). Although some of this content is addressed in other courses during the first and second year of their degrees, students would benefit from a short revision of each of the problematic areas through online lectures prior to the undertaking of the virtual exercise. The instructions provided for the completion of the exercise were unsatisfactory for some students, who felt uncertain as to the time to be spent on each section of the report, which resulted in some students spending longer hours than others, affecting the quality of the reports and the students' time management. In some tasks, particularly the daily summaries, the students felt doubtful about what was expected to be included, which resulted in a general decrease in the potential grades. During the 2020–2021 version of the course, students were better briefed on the tasks to be completed, which has apparently resulted in an overall improvement of the grades (Fig. 8).
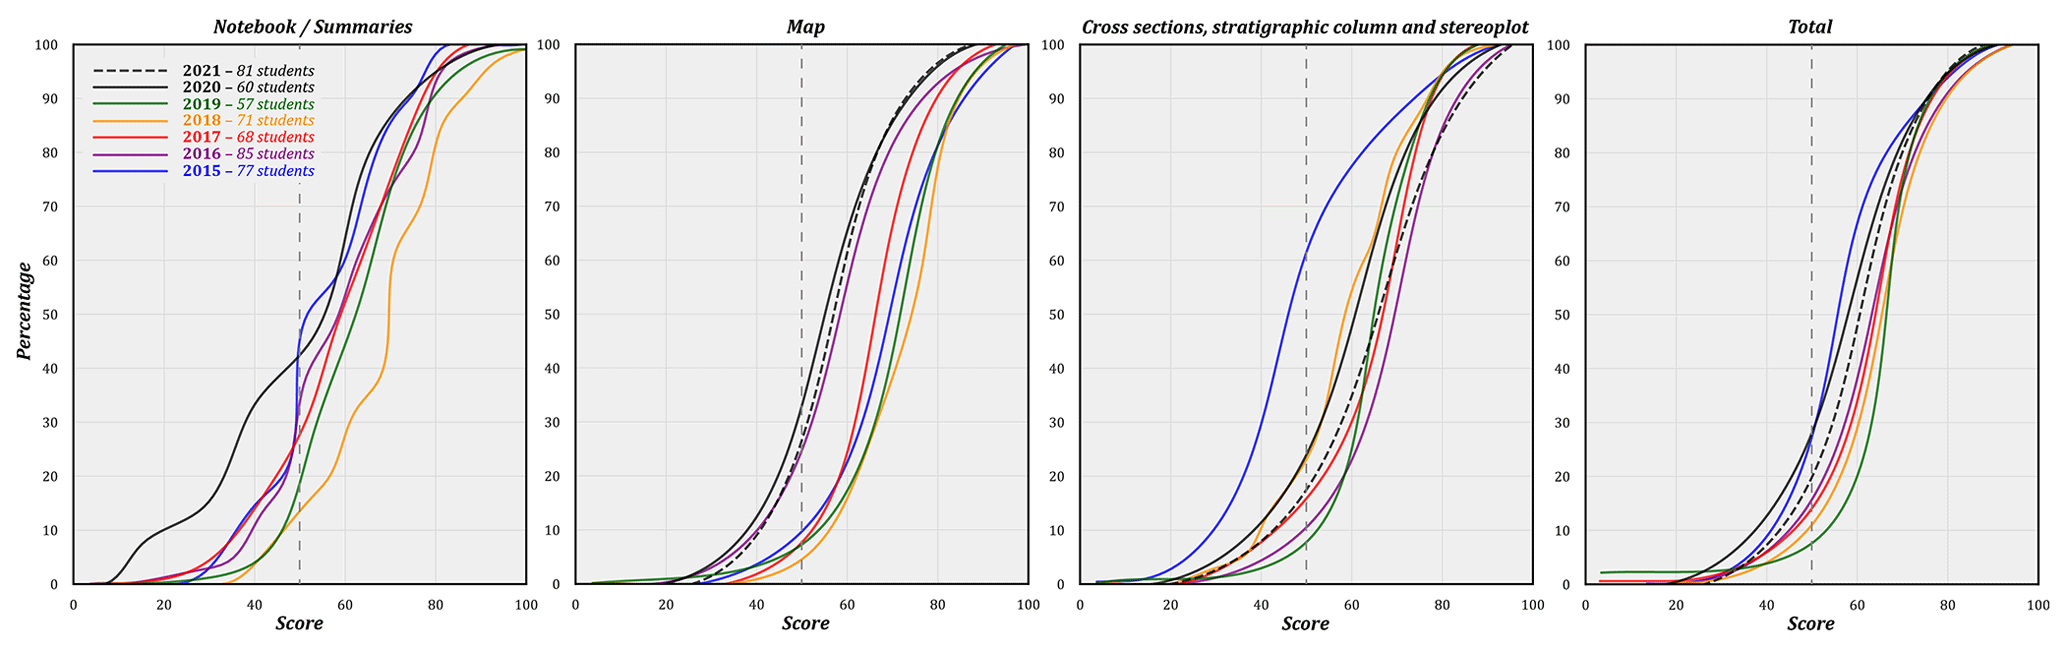
Figure 8Cumulative plots of the students' grades on different tasks throughout the years. The grades from the Esla Mapping Project (black colours, years 2020 and 2021) are, in general, lower than previous years'. Note that during 2021 summaries were not evaluated and were not accounted for in the final grade.
Some of the above problems are common mistakes for the weaker students in any circumstances, but they may have been made more frequently in the virtual environment due to a lack of confidence and due to the lack of peer-to-peer learning.
Unfortunately, the percentage of students that filled in the questionnaires was low, which hinders the extraction of truly representative conclusions. This is a recurrent issue when assessing educational outcomes, especially in the case of small student groups (e.g. Chapman and Joines, 2017). In the case of a course with 60 students, as is the case for second year in the Geology BSc at Cardiff University, Nulty (2008) suggests that a minimum response rate of 31 % is required to ensure the representativeness of the survey answers. In our case, the response rate for the three questionnaires was 21 %, 30 % and 10 %, respectively.
An important consideration is that the Esla Mapping Project was only possible thanks to the wealth of data previously collected by the authors over the years, the extent of which covers the entire mapping area and thus makes a realistic field trip possible. In addition to the geological data, the abundant photographs from the area have allowed us to convey the outcrop descriptions adequately to the students and to train the students' ability to draw realistic field sketches from the same area as if they were there physically. In our view, this data and material abundance is a decisive factor for a successful implementation of a similar virtual mapping exercise in any other area.
4.2 Advantages and disadvantages of the Esla Mapping Project
Despite its success in training numerous field geological skills, when undertaking the virtual exercise the students do not gather the geological data themselves. Students are not trained in procedures inherent to field geology, such as observing the rocks at the outcrop scale, extracting samples to be inspected with a hand lens, identifying their lithology, using a compass to measure strike and dip of bedding and/or any other structures, looking for deformation and sedimentary structures and polarity indicators, or looking for fossils and identifying them. Students are also not trained in more logistical issues, such as the ability to make real-time itinerary modifications, itinerary planning for future days based on available data, and (crucially) terrain navigation and self-location in the field. These are all fundamental skills that a field geologist needs to develop and are in our view very difficult to replicate adequately in a virtual environment. The lack of social interaction between students, fundamental to foster peer-based learning, has likely influenced the lower grades of the exercise in comparison with previous years. These are important drawbacks of the virtual training as a substitutive activity for a physical residential field trip, as is true for any other virtual fieldwork exercise (e.g. Hurst, 1998; Arrowsmith et al., 2005).
However, the students have met the learning outcomes of the Esla Mapping Project to a similar extent as in previous years, as attested by their grades in the different tasks (Fig. 8). Furthermore, the project allows students to learn skills not implemented in the physical trip in previous years. These include (i) fieldwork planning using aerial imagery, (ii) drawing of form lines, (iii) visualising the three-dimensional interactions of the geological structure with the topographic surface in a virtual globe environment (Google Earth), and (iv) making geological interpretations based on observations made by other geologists, a fundamental ability for professional geologists in an increasingly time-deprived society and the growing multidisciplinary approaches in industry and academia.
The Esla Mapping Project provides a curricular opportunity for students who are unable to attend residential physical field trips for various reasons, including students with mobility issues or those responsible for a person reliant on care. There is an increasing demand for inclusive learning and equality of learning opportunities for these students, who have traditionally been neglected (Hall et al., 2004; Stokes et al., 2012; Atchison et al., 2019). The exercise provides these students with an exercise where important geological field skills are learnt, and the implementation of the activity can greatly benefit them.
Finally, the virtual project is easily adaptable to new circumstances and learning needs. For example, during the 2020/2021 academic year, the day 4 of the exercise was deleted, leaving it with a total of 4 d instead of 5 d. This preserves the learning outcomes unaltered, while at the same time relieving the time pressure imposed on the students in the last weeks of the academic year when the activity is carried out. Furthermore, once the field trip workflow has been implemented and the results tested, the format can be applied to different field areas where abundant data are available to produce a similar exercise.
4.3 Possible improvements
Most student mistakes could be minimised in the future by even more emphasis on the prescriptive list of what needs to be included in each of the evaluated sections and with further preparatory lessons on basic geological skills such as the generation of geological sketches, mapping symbology, the information recorded in a cross section, the production of stratigraphic columns and the plotting of data on a stereonet. These are all basic skills that the students practised throughout their first and second year, but the virtual training experience has shown that they still have not internalised them, at least not well enough to work independently without the support of lecturers and assistants and, critically, peer-to-peer learning.
There are other aspects of the trip that could be improved for future runs of the Esla Mapping Project. One addition to the field trip would be to promote more involvement of the students in recognising some of the lithologies present in the area. This could be implemented virtually in some of the stops, for example by showing a thin section scan or a series of microphotographs taken with an optical microscope. This approach, in combination with outcrop photographs, could improve their petrographic skills and their linking with outcrop-scale sedimentary features at the same time (e.g. Marshall and Higley, 2021). Another improvement could be to allow the students to plan their own daily itineraries based on the collected data in previous days so that they can decide where to focus their efforts based on which areas look more promising, just as in physical fieldwork. This would foster their ability to manage their available time in the field in the future. This could be implemented, for example, by generating a series of stops that they could link at their will, generating many possible itineraries. When choosing the right combination, students would get the sense of the structure in a few stops. If they choose poorly, they would soon realise that there were better combinations to suit their mapping needs and react accordingly. A similar method has been implemented by Mahan et al. (2021), who give the students the chance to choose their mapping stations.
Physical field geology is an irreplaceable curricular activity in any Earth science undergraduate and postgraduate programme and in Geology in particular. In a situation (even prior to COVID-19) where universities are subjected to increasing financial pressure, the number of field-based Geoscience curricular activities is progressively decreasing (e.g. Boyle et al., 2007; Mullens et al., 2012). This has caused alarm among geoscientists, who advocate for the maintenance of physical field trips (e.g. Boyle et al., 2007; Butler, 2008). Our experience with the Esla Mapping Project agrees with this view: the virtual field trip experience, though satisfactory as a substitute experience in a period of crisis and effective in the training of numerous skills, cannot replace a physical mapping course in the field (e.g. Spicer and Stratford, 2001). Nonetheless, we consider the virtual project as having inherent benefits, and some of its parts could be implemented in combination with the physical trip in the future. Some of the activities of the Esla Mapping Project, such as form line drawing and inspection of the interaction between geological structure and topography, could provide an outstanding introduction to the mapping area in preparation for a physical trip. This would allow for a better time management on the trip, with the targeting of especially problematic areas that require a more detailed attention in the field (e.g. where aerial imagery is not conclusive, in lithological contacts, fold hinges). This positive combination of virtual and physical trips is also supported by other educators after their analysis of student learning outcomes, both prior to and during the COVID-19 pandemic (e.g. Stainfield et al., 2000; Arrowsmith et al., 2005; Granshaw and Duggan-Haas, 2012; Litherland and Stott, 2012; Cliffe, 2017; Rotzien et al., 2021; Toy et al., 2021; Bond and Cawood, 2021, Evelpidou et al., 2021).
The KMZ files, outcrop descriptions and photographs,are all stored in a GitHub repository that can be accessed through the following link: https://github.com/EslaUnit/EslaMappingProject (https://doi.org/10.5281/zenodo.5801276, de Paz-Álvarez et al., 2021). The references used to obtain fossil images and information and stratigraphic logs that are not mentioned in the text are listed in the Supplement. The topographic map supplied to the students can also be found in the Supplement. The fossil guide and the set of instructions provided to the students is also provided in the Supplement.
The supplement related to this article is available online at: https://doi.org/10.5194/se-13-1-2022-supplement.
TGB, DMB and MIdPA designed the Esla Mapping Project and provided real geological data and photographs for the exercise. TGB designed the activities to be performed by the students and produced the instruction manual for the students. TGB, DMB and other staff implemented the Esla Mapping Project at Cardiff University. GEG conducted the student surveys and analysed the students' marks. LC compiled the fossil guide for the students. TGB outlined the manuscript structure, which was expanded upon by MIdPA with contributions from the co-authors.
The contact author has declared that neither they nor their co-authors have any competing interests.
Publisher's note: Copernicus Publications remains neutral with regard to jurisdictional claims in published maps and institutional affiliations.
This article is part of the special issue “Virtual geoscience education resources”. It is not associated with a conference.
This contribution results from a collaboration between the Cardiff University and the University of Oviedo. It has been made possible by the research cooperation between researchers from different countries, economically crystallised through the research project PETROCANTÁBRICA (MINECO-18-CGL2017-86487-P) supported by the Ministry of Economy and Competitiveness of Spain (MINECO). Manuel I. de Paz-Álvarez acknowledges a pre-doctoral contract from the FPU program of the Ministry of Education of Spain. The staff of Cardiff University involved in the Esla trip is thanked for their support and implementation of the Esla Mapping Project. Students in their second and third year from the Geology BSc of the Cardiff University are thanked for their participation in the survey. The authors would like to thank the editor Steven Whitmeyer and the reviewers Lidia Lonergan and Jaime Toro for their comments and recommendations.
This paper was edited by Steven Whitmeyer and reviewed by Lidia Lonergan and Jaime Toro.
Alonso, J. L.: Sequences of thrusts and displacement transfer in the superposed duplexes of the Esla Nappe Region (Cantabrian Zone, NW Spain), J. Struct. Geol., 9, 969–983, https://doi.org/10.1016/0191-8141(87)90005-8, 1987.
Alonso, J. L., Marcos, A., and Suárez, A.: Paleogeographic inversion resulting from large out of sequence breaching thrusts: The León Fault (Cantabrian Zone, NW Iberia), A new picture of the external Variscan Thrust Belt in the Ibero-Armorican Arc, Geol. Acta, 7, 451–473, https://doi.org/10.1344/105.000001449, 2009.
Arboleya, M. L.: Estudio estructural del manto del Esla (Cordillera Cantábrica, León), Unpublished Ph.D. Thesis, Universidad Autónoma de Barcelona, Barcelona, 227 pp., 1978.
Arrowsmith, C., Counihan, A., and McGreevy, D.: Development of a multi-scaled virtual field trip for the teaching and learning of geospatial science, Int. J. Educ. Dev., 1, 42–56, 2005.
Arrowsmith, C., Bagoly-Simó, P., Finchum, A., Oda, K., and Pawson, E.: Student employability and its implications for geography curricula and learning practices, J. Geogr. Higher Educ., 35, 365–377, https://doi.org/10.1080/03098265.2011.563379, 2011.
Atchison, C. L., Marshall, A. M., and Collins, T. D.: A multiple case study of inclusive learning communities enabling active participation in geoscience field courses for students with physical disabilities, J. Geosci. Educ., 67, 472–486, https://doi.org/10.1080/10899995.2019.1600962, 2019.
Blenkinsop, T. G.: Visualizing structural geology: from Excel to Google Earth, Comput. Geosci., 45, 52–56, https://doi.org/10.1016/j.cageo.2012.03.007, 2012.
Bond, C. E. and Cawood, A. J.: A role for virtual outcrop models in blended learning – improved 3D thinking and positive perceptions of learning, Geosci. Commun., 4, 233–244, https://doi.org/10.5194/gc-4-233-2021, 2021.
Boyle, A., Maguire, S., Martin, A., Milsom, C., Nash, R., Rawlinson, S., Turner, A., Wurthmann, S., and Conchie, S.: Fieldwork is good: The student perception and the affective domain, J. Geogr. Higher Educ., 31, 299–317, https://doi.org/10.1080/03098260601063628, 2007.
Bryson, J. R. and Andres, L.: Covid-19 and rapid adoption and improvisation of online teaching: curating resources for extensive versus intensive online learning experiences, J. Geogr. Higher Educ., 44, 608–623, https://doi.org/10.1080/03098265.2020.1807478, 2020.
Butler, R.: Teaching geoscience through fieldwork, GEES Subject Centre Learning and Teaching Guide, Higher Education Academy Subject Centre in Geography, The Higher Education Academy, Plymouth, UK, Earth Environ. Sci., 56 pp., ISBN 1-84102-1458-8, 2008.
Chapman, D. D. and Joines, J. A.: Strategies for Increasing Response Rates for Online End-of-Course Evaluations, Int. J. Teach. Learn. High. Educ., 29, 47–60, 2017.
Cliffe, A. D.: A review of the benefits and drawbacks to virtual field guides in today's Geoscience higher education environment, Int. J. Educ. Technol. High. Educ., 14, 1–14, https://doi.org/10.1186/s41239-017-0066-x, 2017.
Compton, R. R.: Manual of field geology, John Wiley & Sons, New York, 378 pp., ISBN-10 0471166987, 1962.
Day, T., Chang, I. C. C., Chung, C. K. L., Doolittle, W. E., Housel, J., and McDaniel, P. N.: The immediate impact of COVID-19 on postsecondary teaching and learning, Prof. Geogr., 73, 1–13, https://doi.org/10.1080/00330124.2020.1823864, 2021.
de Paz-Álvarez, M. I., Blenkinsop, T. G., Buchs, D. M., Gibbons, G. E., and Cherns, L.: Esla Mapping Project data repository, Zenodo [data set], https://doi.org/10.5281/zenodo.5801276, 2021.
de Sitter, L. U.: The Río Esla nappe in the zone of León of the Asturian Cantabric mountain chain, Notas y Comunicaciones del Instituto Geológico y Minero de España, 56, 3–24, 1959.
Elkins, J. T. and Elkins, N. M.: Teaching geology in the field: Significant geoscience concept gains in entirely field-based introductory geology courses, J. Geosci. Educ., 55, 126–132, https://doi.org/10.5408/1089-9995-55.2.126, 2007.
Evelpidou, N., Karkani, A., Saitis, G., and Spyrou, E.: Virtual field trips as a tool for indirect geomorphological experience: a case study from the southeastern part of the Gulf of Corinth, Greece, Geosci. Commun., 4, 351–360, https://doi.org/10.5194/gc-4-351-2021, 2021.
Ferrel, M. N. and Ryan, J. J.: The impact of COVID-19 on medical education, Cureus, 12, e7492, https://doi.org/10.7759/cureus.7492, 2020.
Ford, R. E. and Hipple, J. D.: Geosystems today: an interactive casebook, John Wiley & Sons, New York, 112 pp., ISBN-13 978-0-471-19598-6, 1999.
Geological Society of London: Requirements for accreditation, available at: https://www.geolsoc.org.uk/Education-and-Careers/Universities/Degree-Accreditation/Aims-and-Requirements-for-Accreditation (last access: 23 December 2021), 2013.
Gibson, C.: Geography in higher education in Australia, J. Geogr. High. Educ., 31, 97–119, https://doi.org/10.1080/03098260601033050, 2007.
Granshaw, F. D. and Duggan-Haas, D.: Virtual fieldwork in geoscience teacher education: Issues, techniques, and models, Geol. S. Am. S., 492, 285–303, https://doi.org/10.1130/2012.2492(20), 2012.
Hall, T., Healey, M., and Harrison, M.: Fieldwork and disabled students: Discourses of exclusion and inclusion, J. Geogr. Higher Educ., 28, 255–280, https://doi.org/10.1080/0309826042000242495, 2004.
Higgs, B. and McCarthy, M.: Active learning – from lecture theatre to field-work, in: Emerging issues in the practice of university learning and teaching, All Ireland Society for Higher Education (AISHE), Maynooth, Ireland, edited by: O'Neill, G., Moore, S., and McMullin, B., 37–44, ISBN-13: 978-0955013409, 2005.
Hurst, S. D.: Use of “virtual” field trips in teaching introductory geology, Comput. Geosci., 24, 653–658, https://doi.org/10.1016/S0098-3004(98)00043-0, 1998.
Litherland, K. and Stott, T. A.: Virtual field sites: Losses and gains in authenticity with semantic technologies, Technol. Pedagog. Educ., 21, 213–230, https://doi.org/10.1080/1475939X.2012.697773, 2012.
Mackey, J., Gilmore, F., Dabner, N., Breeze, D., and Buckley, P.: Blended learning for academic resilience in times of disaster or crisis, MERLOT Journal of Online Learning and Teaching, 8, 35–48, 2012.
Mahan, K. H., Frothingham, M. G., and Alexander, E.: Virtual mapping and analytical data integration: a teaching module using Precambrian crystalline basement in Colorado's Front Range (USA), Geosci. Commun., 4, 421–435, https://doi.org/10.5194/gc-4-421-2021, 2021.
Marshall, M. S. and Higley, M. C.: Multi-scale virtual field experience: sedimentology and stratigraphy of Grand Ledge, Michigan, USA, Geosci. Commun., 4, 461–474, https://doi.org/10.5194/gc-4-461-2021, 2021.
Maskall, J. and Stokes, A.: Designing Effective Fieldwork for the Environmental and Natural Sciences, GEES Subject Centre Learning and Teaching Guide, Higher Education Academy Subject Centre in Geography, The Higher Education Academy, Plymouth, UK, Earth Environ. Sci., 78 pp., ISBN 978-1-84102-201-7, 2008.
McConnell, D. A. and van Der Hoeven Kraft, K. J.: Affective domain and student learning in the geosciences, J. Geosci. Educ., 59, 106–110, https://doi.org/10.5408/1.3604828, 2011.
Mead, C., Buxner, S., Bruce, G., Taylor, W., Semken, S., and Anbar, A. D.: Immersive, interactive virtual field trips promote science learning, J. Geosci. Educ., 67, 131–142, https://doi.org/10.1080/10899995.2019.1565285, 2019.
Merino-Tomé, O., Suárez, A., and Alonso, J. L.: Mapa digital continuo E: 1:50 000, Zona Cantábrica (zona-1000), in: GEODE, Mapa Geológico Digital Continuo de España, available at: http://info.igme.es/cartografiadigital/geologica/geodezona.aspx?Id=Z1000 (last access: 23 December 2021), 2014.
Mogk, D. and Goodwin, C.: Learning in the Field: Synthesis of Research on Thinking and Learning in the Geosciences, Geol. S. Am. S., 486, 13–163, https://doi.org/10.1130/2012.2486(24), 2012.
Moran, A.: Managing your own learning at University. A practical guide, 3rd Edn., University College Dublin Press, Dublin, Ireland, 224 pp., ISBN-13: 978-1910820261, 2018.
Mullens, J. B., Bristow, R. S., and Cuper, P.: Examining trends in international study: A survey of faculty-led field courses within American departments of geography, J. Geogr. Higher Educ., 36, 223–237, https://doi.org/10.1080/03098265.2011.619521, 2012.
NAGT (National Association of Geoscience Teachers): Designing Remote Field Experiences, available at: https://nagt.org/nagt/teaching_resources/field/designing_remote_field_experie.html (last access: 23 December 2021), 2020.
Needle, M. D., Crider, J. G., Mooc, J., and Akers, J. F.: Virtual field experiences in a web-based videogame environment: Open-ended examples of existing and fictional field sites, Geosci. Commun. Discuss. [preprint], https://doi.org/10.5194/gc-2021-17, in review, 2021.
Nulty, D. D.: The adequacy of response rates to online and paper surveys: what can be done?, Assess. Eval. High. Edu., 33, 301–314, https://doi.org/10.1080/02602930701293231, 2008.
Placing, K. and Fernandez, A.: Virtual experiences for secondary science teaching, Austral. Sci. Teach. J., 48, 40–43, 2002.
Pringle, J. K.: Educational environmental geoscience e-gaming to provide stimulating and effective learning, Planet, 27, 21–28, https://doi.org/10.11120/plan.2013.27010021, 2013.
Rotzien, J. R., Sincavage, R., Pellowski, C., Gavillot, Y., Filkorn, H., Cooper, S., Shannon, J., Yildiz, U., Sawyer, F., and Uzunlar, N.: Field-Based Geoscience Education during the COVID-19 Pandemic: Planning, Execution, Outcomes, and Forecasts, GSA Today, 31, 4–10, https://doi.org/10.1130/GSATG483A.1, 2021.
Rupke, J.: The Esla Nappe, Cantabrian Mountains (Spain), Leidse Geologische Mededelingen, 32, 1–74, 1965.
Sahu, P.: Closure of universities due to coronavirus disease 2019 (COVID-19): impact on education and mental health of students and academic staff, Cureus, 12, e7541, https://doi.org/10.7759/cureus.7541, 2020.
Spicer, J. I. and Stratford, J.: Student perceptions of a virtual field trip to replace a real field trip, J. Comput. Assist. Lear., 17, 345–354, https://doi.org/10.1046/j.0266-4909.2001.00191.x, 2001.
Stainfield, J., Fisher P., Ford, B., and Solem, M.: International virtual field trips: A new direction?, J. Geogr. Higher Educ., 24, 255–262, https://doi.org/10.1080/713677387, 2000.
Stokes, A. and Boyle, A. P.: The undergraduate geoscience fieldwork experience: Influencing factors and implications for learning, in: Field Geology Education – Historical Perspectives and Modern Approaches, edited by: Whitmeyer, S. J., Mogk, D. W., and Pyle, E. J., Geol. Soc. Am. S., 461, 291–312, https://doi.org/10.1130/2009.2461(23), 2009.
Stokes, A., Collins, T., Maskall, J., Lea, J., Lunt, P., and Davies, S.: Enabling remote access to fieldwork: Gaining insight into the pedagogic effectiveness of “direct” and “remote” field activities, J. Geogr. Higher Educ., 36, 197–222, https://doi.org/10.1080/03098265.2011.619004, 2012.
Toy, V., Abe, S., Bons, P., Buckley, S. J., Deckert, H., Fenske, S., Kirilova, M., Lewis, C., Mutz, S., Owin, J., Sachau, T., Schuck, B., and Seelos, P.: A blended learning approach to structural field mapping: combining local geology, virtual geology, and web-based tools , EGU General Assembly 2021, online, 19–30 Apr 2021, EGU21-3581, https://doi.org/10.5194/egusphere-egu21-3581, 2021.
Virtual Landscapes: University of Leeds, available at: https://www.see.leeds.ac.uk/virtual-landscapes/ (last access: 25 May 2021), 2020.
Whitmeyer, S. J. and Dordevic, M.: Creating virtual geologic mapping exercises in a changing world, Geosphere, 17, 226–243, https://doi.org/10.1130/GES02308.1, 2020.
Whitmeyer, S. J., Mogk, D. W., and Pyle, E.J.: An introduction to historical perspectives on and modern approaches to field geology education, Geol. Soc. Am. S., 461, 7–9, https://doi.org/10.1130/2009.2461(00), 2009.
Whitmeyer, S. J., Bailey, J. E., De Paor, D., and Ornduff, T.: Google earth and virtual visualizations in geoscience education and research, Geol. Soc. Am. S., 492, https://doi.org/10.1130/SPE492, 2012.