the Creative Commons Attribution 4.0 License.
the Creative Commons Attribution 4.0 License.
 | 05 Apr 2023
The influence of crustal strength on rift geometry and development – insights from 3D numerical modelling
John B. Naliboff
Ken J. W. McCaffrey
Sophie Pan
Jeroen van Hunen
Malte Froemchen
The lateral distribution of strength within the crust is non-uniform, dictated by crustal lithology and the presence and distribution of heterogeneities within it. During continental extension, areas of crust with distinct lithological and rheological properties manifest strain differently, influencing the structural style, geometry, and evolution of the developing rift system. Here, we use 3D thermo-mechanical models of continental extension to explore how pre-rift upper-crustal strength variations influence rift physiography. We model a km volume containing 125 km wide domains of mechanically “strong” and “weak” upper crust along with two reference domains, based upon geological observations of the Great South Basin, New Zealand, where extension occurs parallel to the boundaries between distinct geological terranes. Crustal strength is represented by varying the initial strength of 5 km3 blocks. Extension is oriented parallel to the domain boundaries such that each domain is subject to the same 5 mm yr−1 extension rate. Our modelling results show that strain initially localises in the weak domain, with faults initially following the distribution of initial plastic strain before reorganising to produce a well-established network, all occurring in the initial 100 kyr. In contrast, little to no localisation occurs in the strong domain, which is characterised by uniform strain. We find that although faults in the weak domain are initially inhibited at the terrane boundaries, they eventually propagate through and “seed” faults in the relatively strong adjacent domains. We show characteristic structural styles associated with strong and weak crust and relate our observations to rift systems developed across laterally heterogeneous crust worldwide, such as the Great South Basin, New Zealand, and the Tanganyika Rift, East Africa.
- Article
(19361 KB) - Full-text XML
-
Supplement
(79974 KB) - BibTeX
- EndNote


The continental lithosphere is highly heterogeneous, with distinct areas of relative strength and weakness ubiquitous across multiple scales of observation (e.g. Thomas, 2006; Kirkpatrick et al., 2013). This non-uniform distribution of strength and heterogeneity within the crust influences strain localisation, exerting a great influence over the geometry and development of rift systems developed during continental extension (e.g. Holdsworth et al., 2001; Kirkpatrick et al., 2013; Brune et al., 2017; Phillips et al., 2019; Howell et al., 2019; Wright et al., 2020; Gouiza and Naliboff, 2021)
Structures deep within the lithosphere and in the mantle have previously been shown to focus deformation during tectonic events, for example, controlling the locations of orogenic fronts (Heron et al., 2019). On larger scales, areas of relatively undeformed cratonic lithosphere are surrounded by relatively highly deformed mobile orogenic belts, which often control the siting of rift systems (Daly et al., 1989; Schiffer et al., 2020). Similarly, lithospheric thickness, and the vertical stratification of strength within it, may influence the development of rift systems and continental margins (Duretz et al., 2016; Brune et al., 2017; Schiffer et al., 2020; Gouiza and Naliboff, 2021; Beniest et al., 2018). However, whilst lithospheric-scale features may influence first-order rift geometry and evolution, we here focus on how the distribution of strength and heterogeneity within the upper crust influences rift geometry and evolution, particularly at the basin scale and during the early stages of rifting.
The upper crust comprises a mosaic of geological bodies and units, each with unique lithologies and tectonic histories. Typically strong crustal volumes may include rheologically strong cratons or relatively homogeneous granitic batholiths (e.g. Thomas, 2019; Howell et al., 2020), whilst weak areas may include rheologically weaker sedimentary sequences. Large strength contrasts exist between these different lithologies, often across short distances as distinct areas of crust are created, deformed, and juxtaposed against one another throughout multiple tectonic events (Thomas, 2006). In addition to their rheology, heterogeneities associated with prior deformation, such as shear zones within orogenic belts (Daly et al., 1989) or pre-existing faults within older rift systems (Cowie et al., 2005; Henza et al., 2011; Naliboff and Buiter, 2015), may also influence bulk crustal strength by acting as focal points for deformation (e.g. Sutton and Watson, 1986; Holdsworth et al., 2001). Such structures have been shown to reactivate during extension or segment rift systems depending on their orientation with respect to the regional stress field (Doré et al., 1997; Mortimer et al., 2002; Fossen et al., 2017; Phillips et al., 2019; Vasconcelos et al., 2019). Whilst rifting can occur in strong cratonic lithosphere (e.g. Larsen et al., 2008; Tiberi et al., 2019), previous studies have demonstrated that, across multiple scales, strain preferentially localises into relatively weak areas with stronger bodies proving resistant to extension (e.g. Beniest et al., 2018; Lang et al., 2020; Wright et al., 2020; Samsu et al., 2021). However, less is known about how the characteristic geometry and development of fault networks and rift systems vary across these relatively “strong” and “weak” areas during extension.

Figure 1(a) Map showing the basement terranes present beneath the South Island of New Zealand and their offshore projections beneath the Great South Basin. Offshore terrane projections follow Ghisetti (2010) and Mortimer et al. (2002). MB stands for Median Batholith, and M stands for Murihiku Terrane. The main faults shown follow Sahoo et al. (2020). (b) Two-way-time (TWT) structure map showing how faults splay and rotate along internal strength contrasts following Phillips and McCaffrey (2019). (c) Generalised crustal structure offshore of the eastern coast of the South Island of New Zealand based on the South East South Island (SESI) seismic survey following Mortimer et al. (2002). The southern end of the line is projected to incorporate the Separation Point Batholith along the southern margin of the Median Batholith Zone, and the hypothesised location of panel (b) is also shown.
Our study is primarily influenced by geological observations from the Great South Basin, offshore of New Zealand, where rifting occurred roughly perpendicular to the boundaries between multiple elongate basement terranes of varying lithology (Phillips and McCaffrey, 2020; Sahoo et al., 2020; Tulloch et al., 2019; Barrier et al., 2020), including the dominantly granitic Median Batholith and the dominantly sedimentary Murihiku Terrane, a relict forearc basin (Fig. 1a) (Campbell et al., 2003, 2019). Due to this geometry, where terrane boundaries are oriented parallel to regional extension, each terrane is subject to the same stress, offering insights into how strain is accommodated across areas of differing strength and the effect of this on rift geometry and development. As well as the bulk strength of the various terranes, the boundaries between them form prominent upper-crustal structures that may be exploited during later tectonic events (Fig. 1c) (Mortimer et al., 2002; Tarling et al., 2019; Phillips and McCaffrey, 2019; Phillips and Magee, 2020). The structural style and evolution of rift systems reflects the geologically and rheologically complex crustal substrate beneath them, but how strain is manifested across and within these areas of differing strength and lithology remains relatively unknown.
In this study, we use 3D thermo-mechanical simulations of continental rifting to investigate how rift physiography varies across crustal units of varying initial strength and their respective boundaries. We extend a km region consisting of four 125 km wide domains that are each assigned different crustal strengths and oriented parallel to the extension direction (Fig. 1c). The relative strengths of each domain is represented by randomly varying the initial brittle strength (parameterised through plastic strain softening) between 5 km3 “unit blocks”, with weaker domains containing weaker unit blocks and a greater contrast between blocks. We explore a range of different parameters representing the strength of our various domains, varying the degree of strain weakening and the amount of initial plastic strain within the models. Our modelling results highlight how crustal strength and heterogeneities related to prior deformation control strain localisation and rift physiography. We document characteristic structural styles associated with strong and weak crust, examine how faults behave at the boundaries between different domains, and highlight how faults developed in weaker domains influence those developing in adjacent, relatively strong material. We compare our 3D observations and analyses to previous analogue and numerical modelling studies, relate our findings to the Great South Basin and other rift systems globally, and apply our observations to general continental rifting concepts.
2.1 Modelling design and geometry
We model the 3D thermo-mechanical evolution of extending continental lithosphere using the mantle convection and lithospheric dynamics ASPECT (Kronbichler et al., 2012; Heister et al., 2017; Glerum et al., 2018; Naliboff et al., 2020; Pan et al., 2022). The simulations span km, and fixed outward velocities of 2.5 mm yr−1 on the lateral boundaries drive extension at a constant total rate of 5 mm yr−1 (Fig. 2a). As insufficient data exist to assess the rift velocities, we selected this extension rate as an intermediate value commonly used in studies of continental extension (e.g. Naliboff et al., 2020). Inflow along the lower boundary balances outflow, while a stress-free upper boundary allows the development of topography (Rose et al., 2017). Diffusion of the free surface at each time step minimises solver instabilities arising from localised deformation along faults and acts as a coarse approximation of landscape evolution.
The initial lithospheric structure contains distinct lithologies with thermodynamic and rheological properties characteristic of unstretched upper crust (0–20 km depth), lower crust (20–40 km depth), and mantle lithosphere (40–100 km depth) (Fig. 2a). The rheological structure follows a visco-plastic constitutive relationship, which captures both brittle (plastic) and ductile (viscous) deformation processes observed within rifts and rifted margins. Coupling brittle strain softening of cohesion and the internal angle of friction with randomised initial plastic strain (IPS) enables the formation of distributed normal fault networks (Naliboff et al., 2017, 2020; Duclaux et al., 2020; Pan et al., 2022). We use variable distributions of the IPS along the model length to define upper-crustal volumes of differing strength (e.g. distinct geologic terranes), with the cohesion and angle of internal friction decreasing linearly between defined IPS values (e.g. strain softening interval). Aside from the initial variations in IPS, the crustal structure and rheological parameters are identical between distinct model domains.
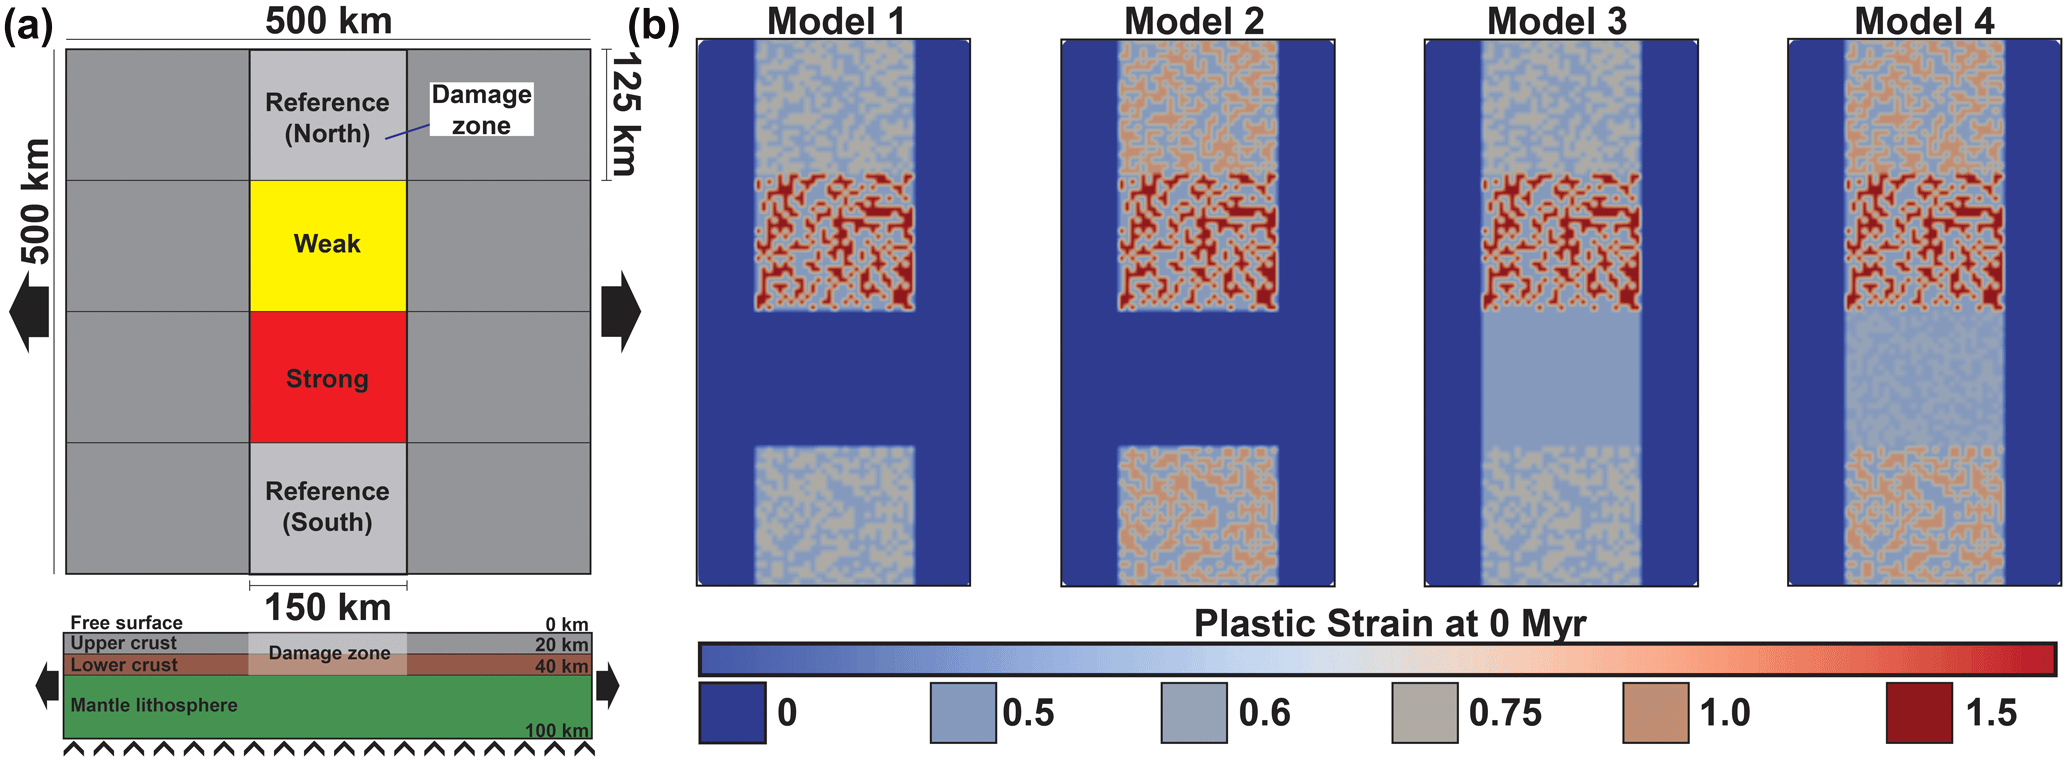
Figure 2(a) Diagram showing the map view and cross-sectional setups for the model. Strain is applied across a 500 km wide and 100 km deep area, with a 150 km wide “damage zone” extending to 40 km depth across the centre of the model where IPS is assigned to unit blocks. (b) Images of the IPS distribution applied to each model prior to extension at 0 Myr. Variations in IPS values between 5 km3 unit blocks define various strength terranes.
The initial resolution throughout the model is set to 5 km and refined to 1.25 km in the upper 20 km (i.e. upper crust) across the central 150 km of the model. This approach enables a relatively high resolution in the region of interest (upper crust), while producing “natural” boundary conditions at its base. The full details of the model design and numerical methods are provided in Appendix A, including the underlying governing equations.
2.2 Exploring upper-crustal strength
We assign IPS values to 5 km3 blocks, termed unit blocks, in the upper crust across the central 150 km of the model, termed the damage zone. IPS values were randomly assigned to unit blocks in a binary fashion, such that a block has either the minimum or maximum value specific to that strength. We define four 125 km wide upper-crustal domains of varying strength, oriented parallel to the extension direction (Fig. 2a). From north to south, the domains are assigned “reference (north)”, “weak”, “strong”, and “reference (south)” strengths (Fig. 2a). The 5 km3 block size corresponds to 4× the numerical resolution of 1.25 km; Pan et al. (2022) show that these values sufficiently localise deformation at the onset of extension.
We generated four models with varying values and combinations of IPS in each of the domains. The initial cohesion (20 MPa) and internal angle of friction (30∘) decrease by a factor of 4 between plastic strain values of 0.5–1.5. For each of our models we assign specified IPS values to unit blocks within the damage zone, with zero IPS outside of the zone. The assigned IPS values vary between unit blocks in the strong, weak, or reference domains (Fig. 2). The greater the value of IPS, and the greater the contrast in IPS between adjacent unit blocks, the weaker the domain. Unit blocks in the weak domain have values of 0.5 or 1.5 across all models. In models 1 and 2, we characterise the strong domain as having zero IPS and the reference domains as having IPS values of 0.5 or 0.75 (model 1) and 0.5 or 1.0 (model 2). In model 3, the strong domain is characterised by a constant IPS of 0.5 across all unit blocks within the domain, whilst IPS values for unit blocks in the reference domains are either 0.5 or 0.75. In model 4, the strong domain is characterised by IPS of either 0.5 or 0.6 between different unit blocks and a reference domain that varies between 0.5 and 1.0. In addition, we performed two runs of model 4 using different randomised distributions of IPS between unit blocks, highlighting that whilst the randomised IPS may influence individual fault geometries, they do not affect the first-order patterns identified in each domain.
Each of our models is subject to the same 5 mm yr−1 extension rate. How strain localises across each model varies markedly between models and each of the domains. For each model, we now describe the overall fault geometries (defined by strain rates, IPS, or viscosity) across the weak, strong, and north and south reference domains (Fig. 2a). Notably, all descriptions of fault geometries by strain strictly refer to strain accumulated through brittle (plastic) deformation (i.e. non-initial plastic strain).
3.1 Model 1
Model 1 consists of a strong domain with no initial strain perturbations and a relatively strong reference domain. Strain rapidly localises into the weak domain, producing a well-defined fault network from early in the model run (Fig. 3a). These high-strain zones represent faults and interact with one another laterally, forming linkages and abandoned splays (Fig. 3a). Outside of this developed high-strain fault network the background strain is relatively low, forming strain shadows between the highly localised faults. As the initial strain parameters for the weak domain remain the same for each model, this domain is not discussed for the other models but will be examined in greater detail later.
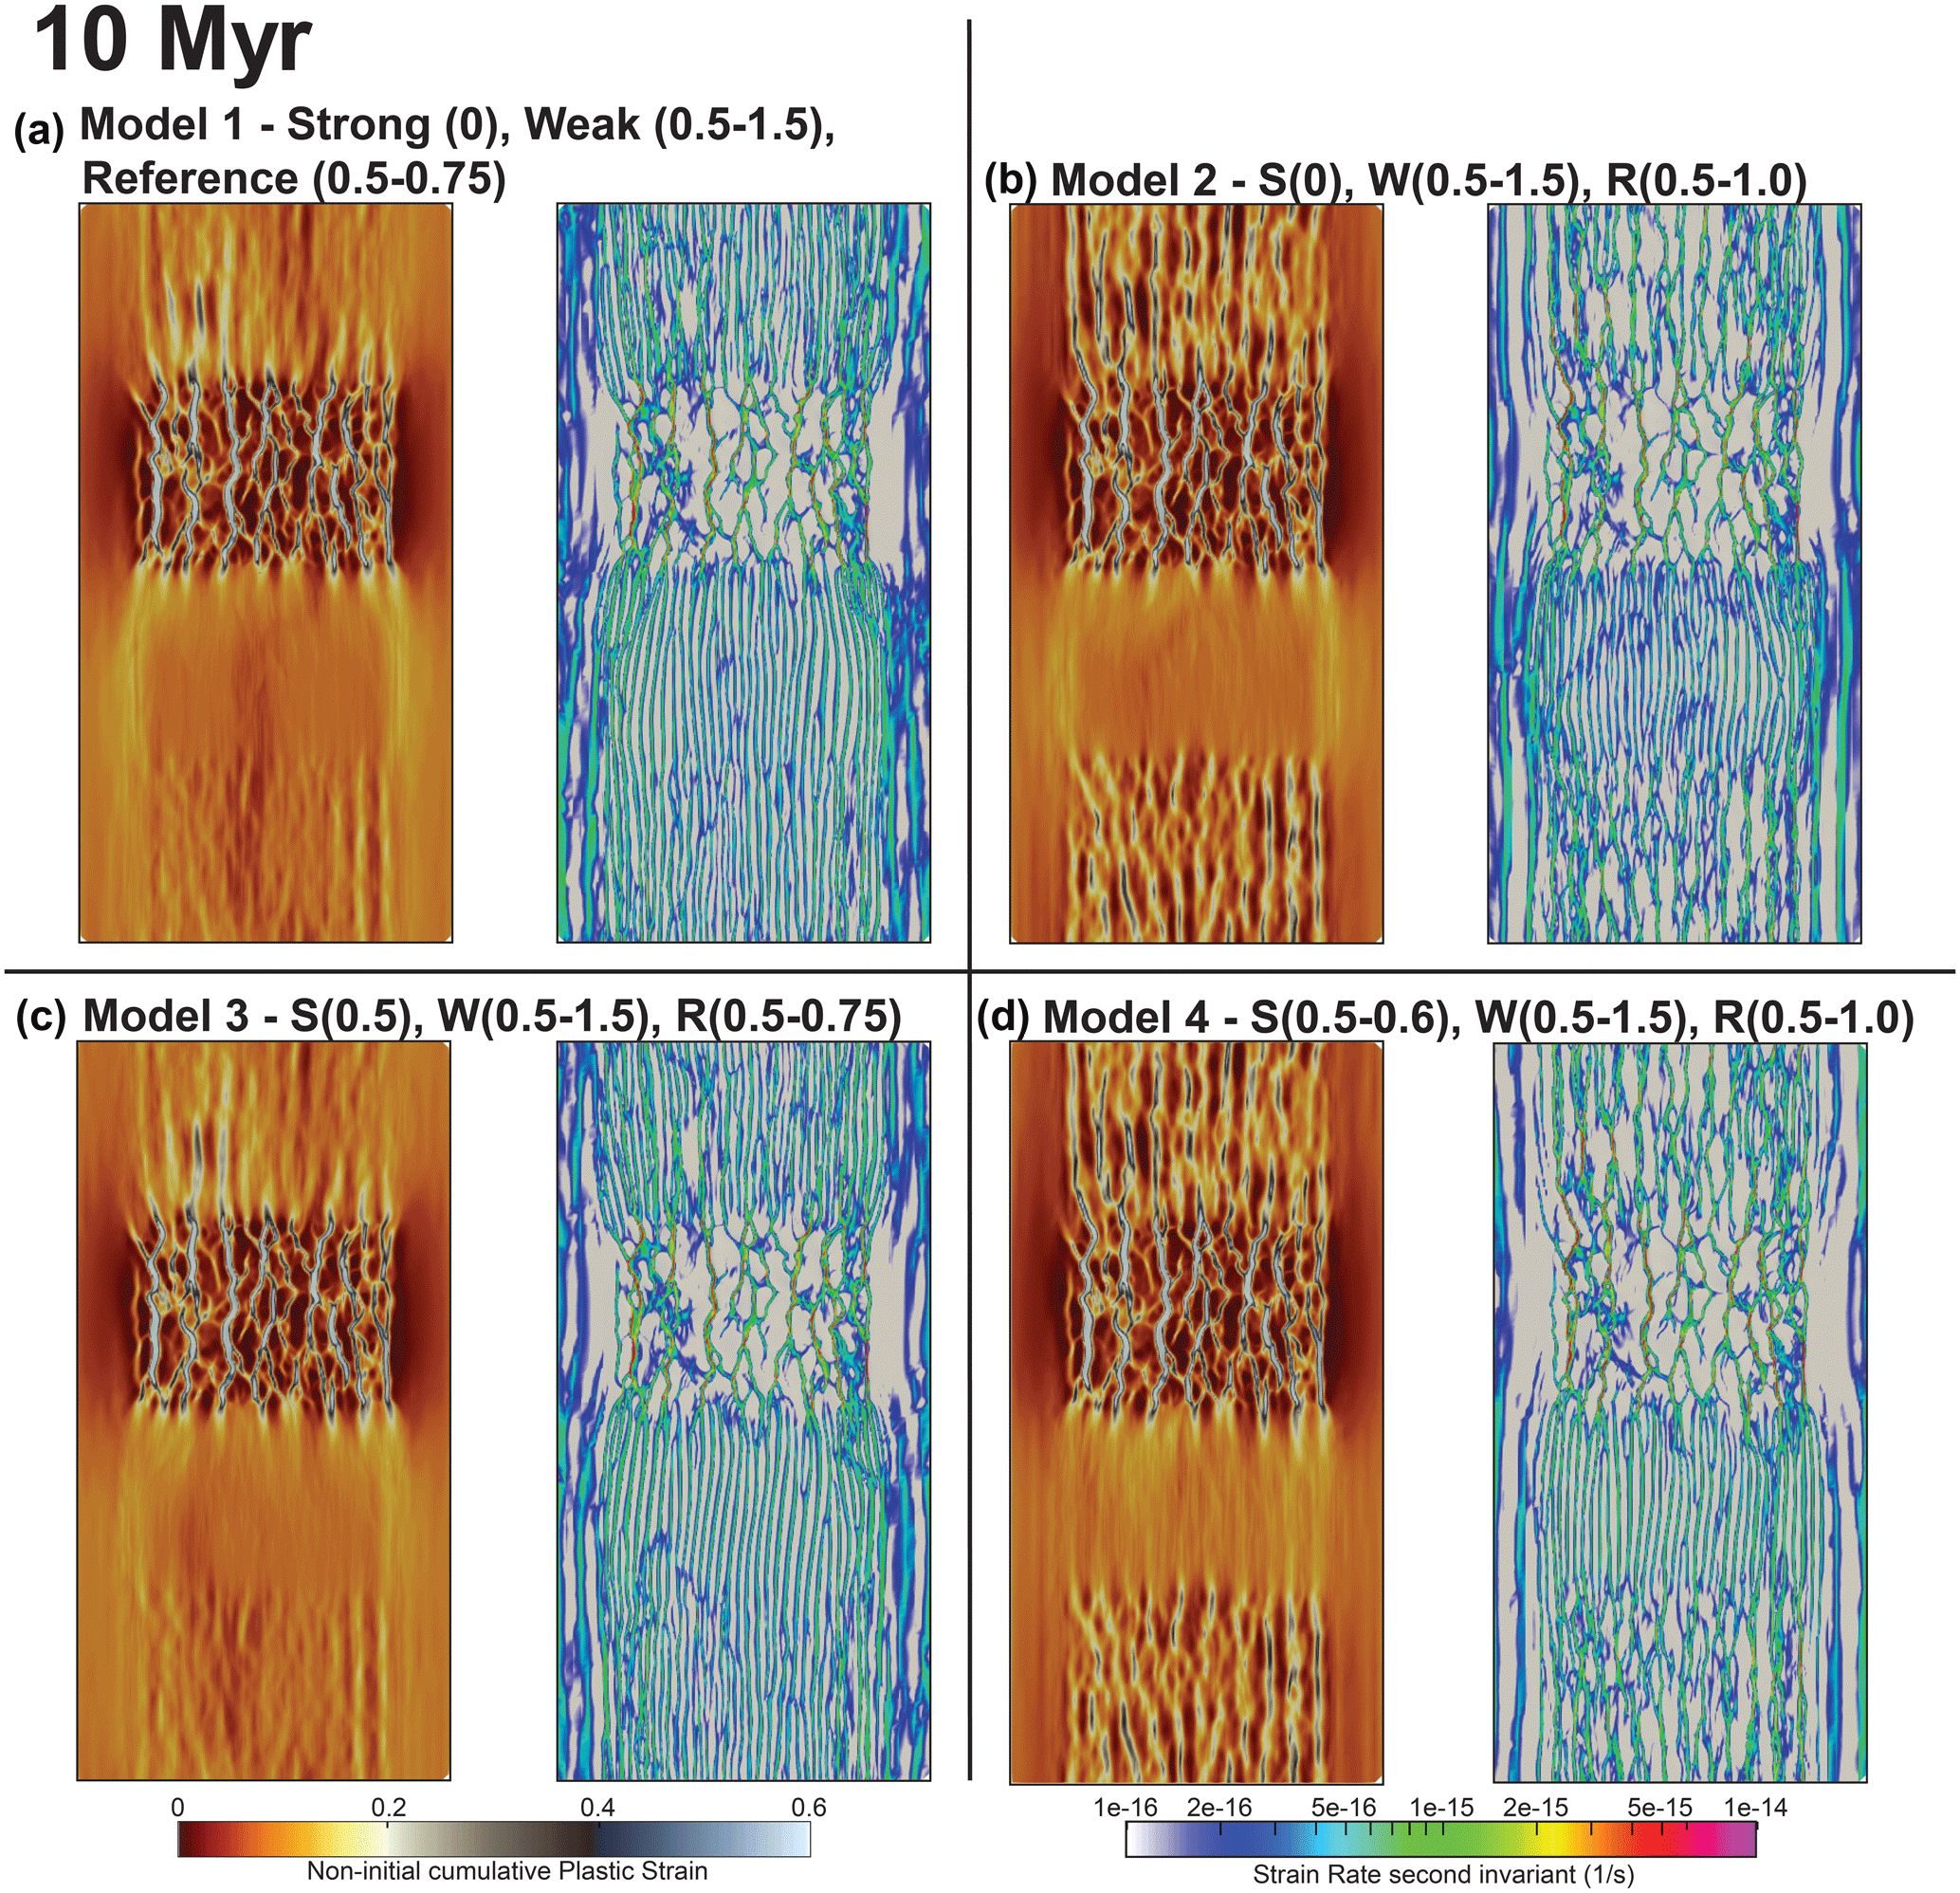
Figure 3Map view images of each model (a–d) showing the non-initial plastic strain (a, c) and strain-rate-invariant (b, d) attributes at 10 Myr.
The strong domain in model 1 is characterised by zero strain weakening. At 10 Myr strain is distributed uniformly across the model, with little localisation occurring. Some higher strain is observed at the edge of the strong domain in this model, potentially representing edge effects at the edge of the damage zone as the entire domain forms a rigid, strong body that does not extend.
The reference domains in model 1 are relatively strong compared to the reference domain in the other models. After 10 Myr some localisation appears to have occurred in both reference domains, with increased localisation occurring in the north reference domain (adjacent to the weak domain) compared to the south reference domain, located adjacent to the strong domain. In the north reference domain increased localisation occurs close to the boundary with the weak domain. No clear differentiation can be identified from north to south within the south reference domain.
3.2 Model 2
As with model 1, no strain weakening occurs in the strong domain of model 2. Accordingly, this produces similar patterns of deformation to model 1, with little localisation across the entire domain, and some increased strain observed at the boundaries of the damage zone.
The reference domain in this model is weaker than that of model 1, with unit blocks assigned IPS values of 0.5 or 1.0. Accordingly, the reference domain in model 2 shows increased localisation compared to model 1 (Fig. 3b). A similar differentiation can be identified between the north and south reference domains, with the former showing increased strain localisation and better developed faults. Localisation does begin to occur in the south reference domain, with some increased localisation seemingly occurring at the southern edge of the domain (and the model) compared to the boundary with the strong domain at the northern edge of the domain (Fig. 3b).
3.3 Model 3
In model 3, the reference domain is characterised by the same IPS range as that in model 1 (0.5–0.75), producing similar strain patterns. In contrast to models 1 and 2, the strong domain in model 3 is assigned a constant IPS value of 0.5, with no variation between adjacent unit blocks. Although strain weakening is permitted in the strong domain of this model, we still do not identify any strain localisation. As with models 1 and 2, where no strain weakening was present, the strong domain undergoes relatively uniform strain, with some increased localisation at the edge of the domain where there is a contrast in IPS between the outside of the model, where no IPS is present, and the damage zone where IPS is prescribed (Fig. 3c).
3.4 Model 4
Model 4 is characterised by varying IPS values in the strong, reference and weak domains (Fig. 2b). IPS varies between 0.5 and 1.5 in the weak domain, 0.5–1.0 in the normal domain (as in model 2), and (in contrast to the previous models) varying IPS of 0.5–0.6 in the strong domain. We performed two runs of this model, keeping the same values but changing how they were distributed across the unit blocks prior to extension.
As in model 2, strain localisation varies between the north and south reference domains, with increased localisation occurring in the north reference domain, located adjacent to the weak domain (Fig. 3d). At the end of the model run, we begin to see some strain localisation within the strong domain with broad zones of increased strain beginning to develop (Fig. 3d). We now analyse this model in detail, examining the localisation of strain through time and in three dimensions.
Model 4 shows the greatest variation within each domain across the 10 Myr model run. We qualitatively and quantitatively analyse the results of this model in three dimensions at 2.5 Myr intervals (Fig. 4).
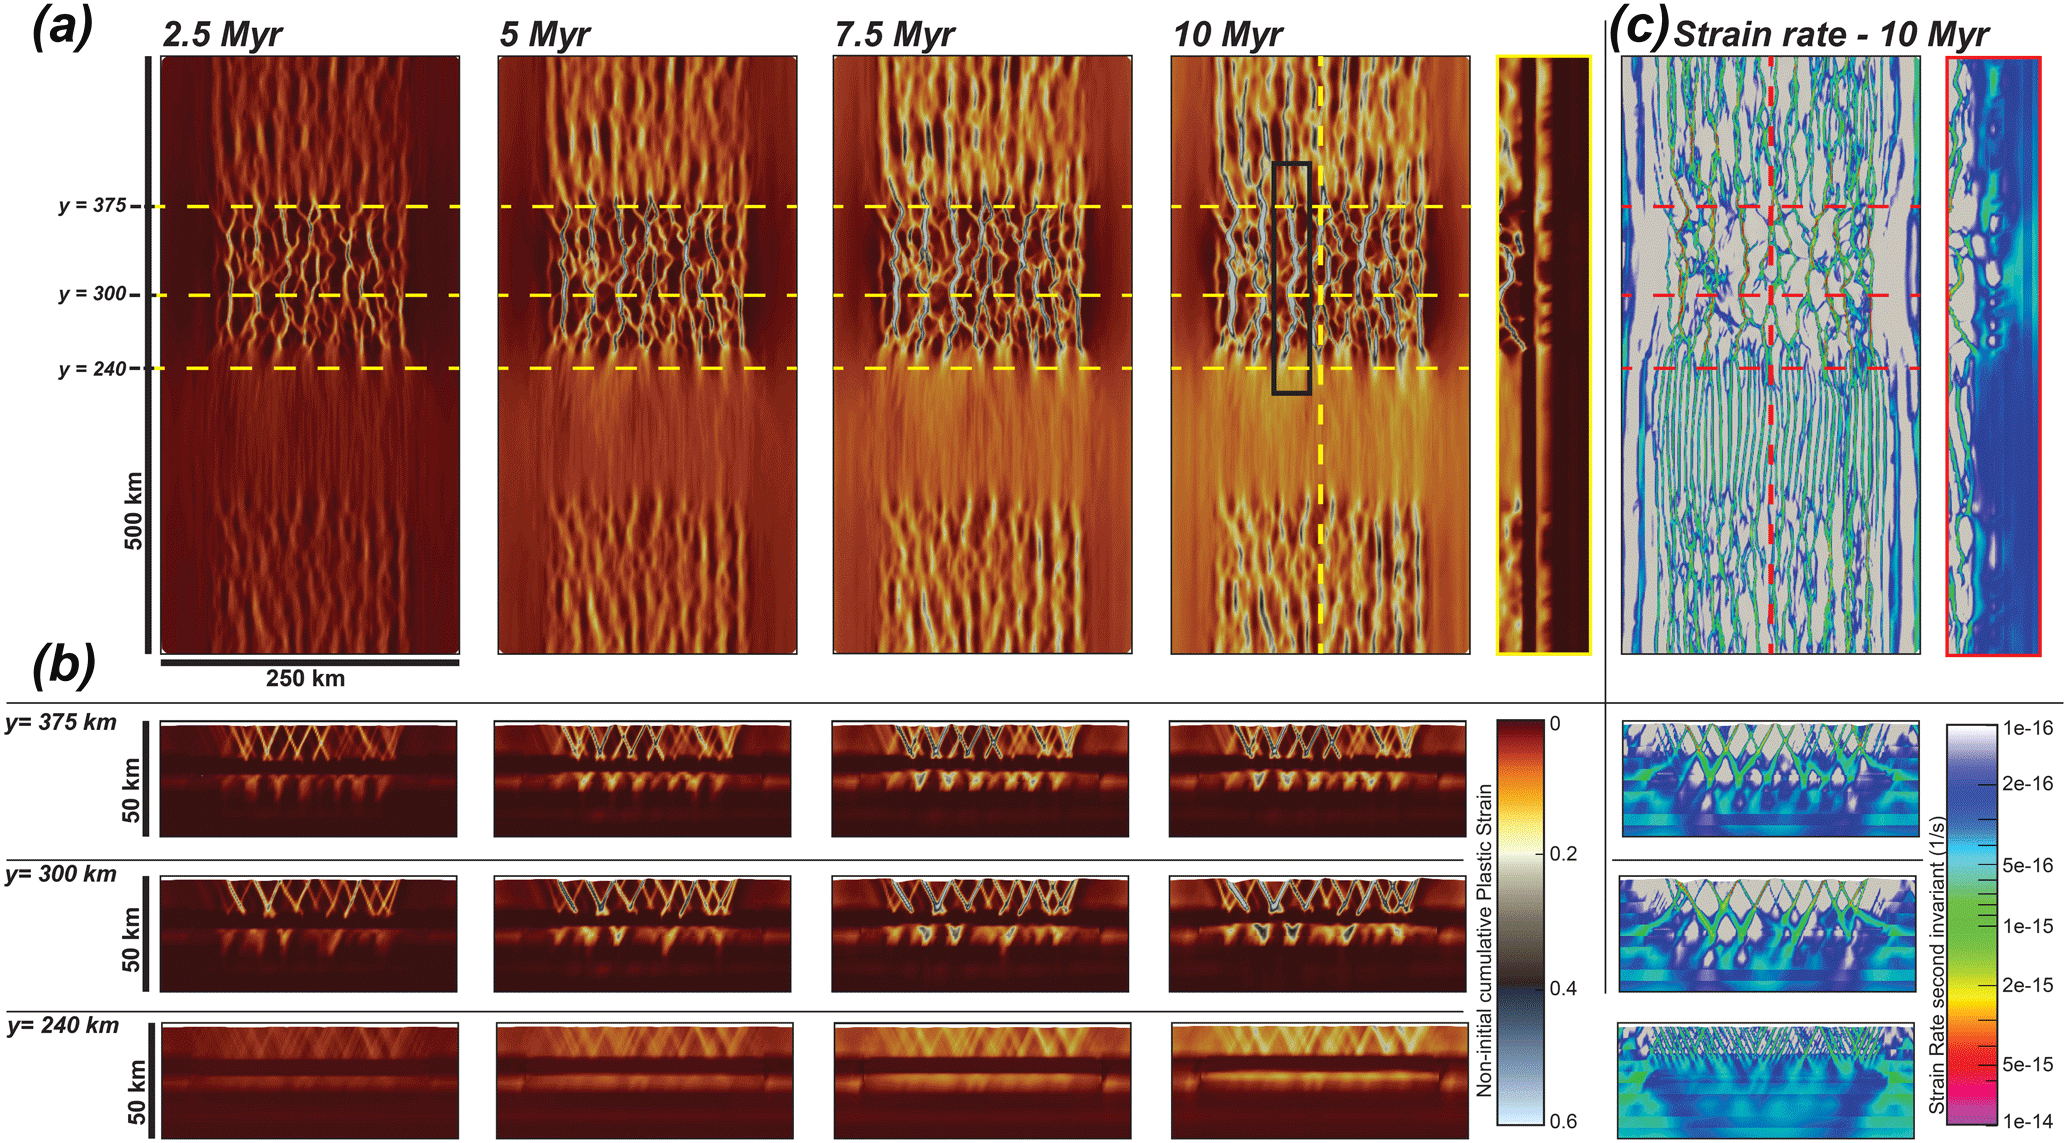
Figure 4(a) Map view images highlighting the fault evolution across the model using the non-initial plastic strain attribute at 2.5, 5, 7.5, and 10 Myr. The black box shown for the 10 Myr model time step shows the location of Fig. 6. (b) Cross-sectional views across the centre of the weak domain (y=300 km), the boundary between the north reference and weak domains (y=375 km), and within the strong domain 10 km from the weak domain boundary (y=240 km). Cross sections shown at 2.5× vertical exaggeration. (c) Map and cross-sectional views of the strain rate attribute highlighting the fault network at 10 Myr.
4.1 Qualitative observations
The weak domain is characterised by a network of widely spaced (10–15 km), high-strain localised zones, separated by low-strain shadows (Fig. 4). Faults are sub-perpendicular to the extension direction, although some variation occurs, particularly at fault tips (Fig. 4a). In cross section these faults form conjugate sets that join at the top of the ductile lower crust (Fig. 4b). Fault location and geometry, including the interactions and linkages between adjacent faults, are established within 100 kyr of the simulation. Strain continues to be accommodated along this fixed network throughout the model run, as evidenced by the fixed areas of high strain rate and non-initial plastic strain (Fig. 4a; see Appendix B for images of the entire model run).
Throughout the model run, the strong domain is characterised by uniform strain with little to no localisation onto faults. Strain rate across the model is highly variable, as evidenced by the strain-rate-invariant attributes (Fig. 4a). Bands of high instantaneous strain rate continually migrate across the model throughout the run; accordingly, plastic strain does not accumulate in any area, resulting in no strain localisation (Fig. 4a). Broad zones of elevated non-initial plastic strain start to develop towards the end of the run, extending outwards from the boundaries of the strong domain with the adjacent weak and reference domains (Fig. 4b).
Both reference domains display some evidence of strain localisation, intermediate between the complete localisation in the weak domain and the lack thereof in the strong domain. Faults are typically sub-linear in plan view with limited interaction occurring between adjacent structures. Looking at the strain rate, high-strain-rate structures display some transient properties throughout the model run as faults move, and strain does not fully localise onto established structures (Fig. 4). Strain localisation occurs diachronously between the north and south reference domains, with different degrees of localisation occurring in each domain (Fig. 4a). Increased strain localisation occurs in the north reference domain, with localisation in the latter also occurring earlier in the model run. The north reference domain is adjacent to the highly localised weak domain, whereas the south reference domain is adjacent to the strong domain, which experiences little strain localisation.
In map view, strain appears greatest in the centre of the faults in the reference and weak domains, decreasing towards the fault tips (Fig. 4a). High strain values are also identified along faults in the weak domain close to its boundaries. The faults are typically retarded at the domain boundary, and strain rapidly decreases to background levels. In some instances, particularly along the boundary between the weak and north reference domain, faults may extend across the boundary, with lower amounts of strain accommodated in the north reference compared to the weak domain. In cross section, faults typically dip at around 45–50∘ and display a high-strain, highly localised core, which decreases to background levels away from the fault (Fig. 4b). Faults appear more well defined in the centre of the weak domain compared to the boundaries and other domains.
4.2 Quantitative strain analyses
To quantitatively analyse our model results we measured the accumulated non-initial plastic strain along a series of transects through model 4. Cumulative strain was measured across the centre of each of the domains and also at 2.5 km intervals covering the boundary between the strong and weak domains (Fig. 5). Large vertical jumps in the cumulative strain show the location of faults, with the gap between these jumps representing the fault spacing. A line displaying a constant gradient represents uniform strain across the model. Individual faults may be difficult to distinguish, particularly those with less localised structures. As such, measurements of individual per-fault strain and fault spacing are approximate, although we can identify first-order differences between domains.
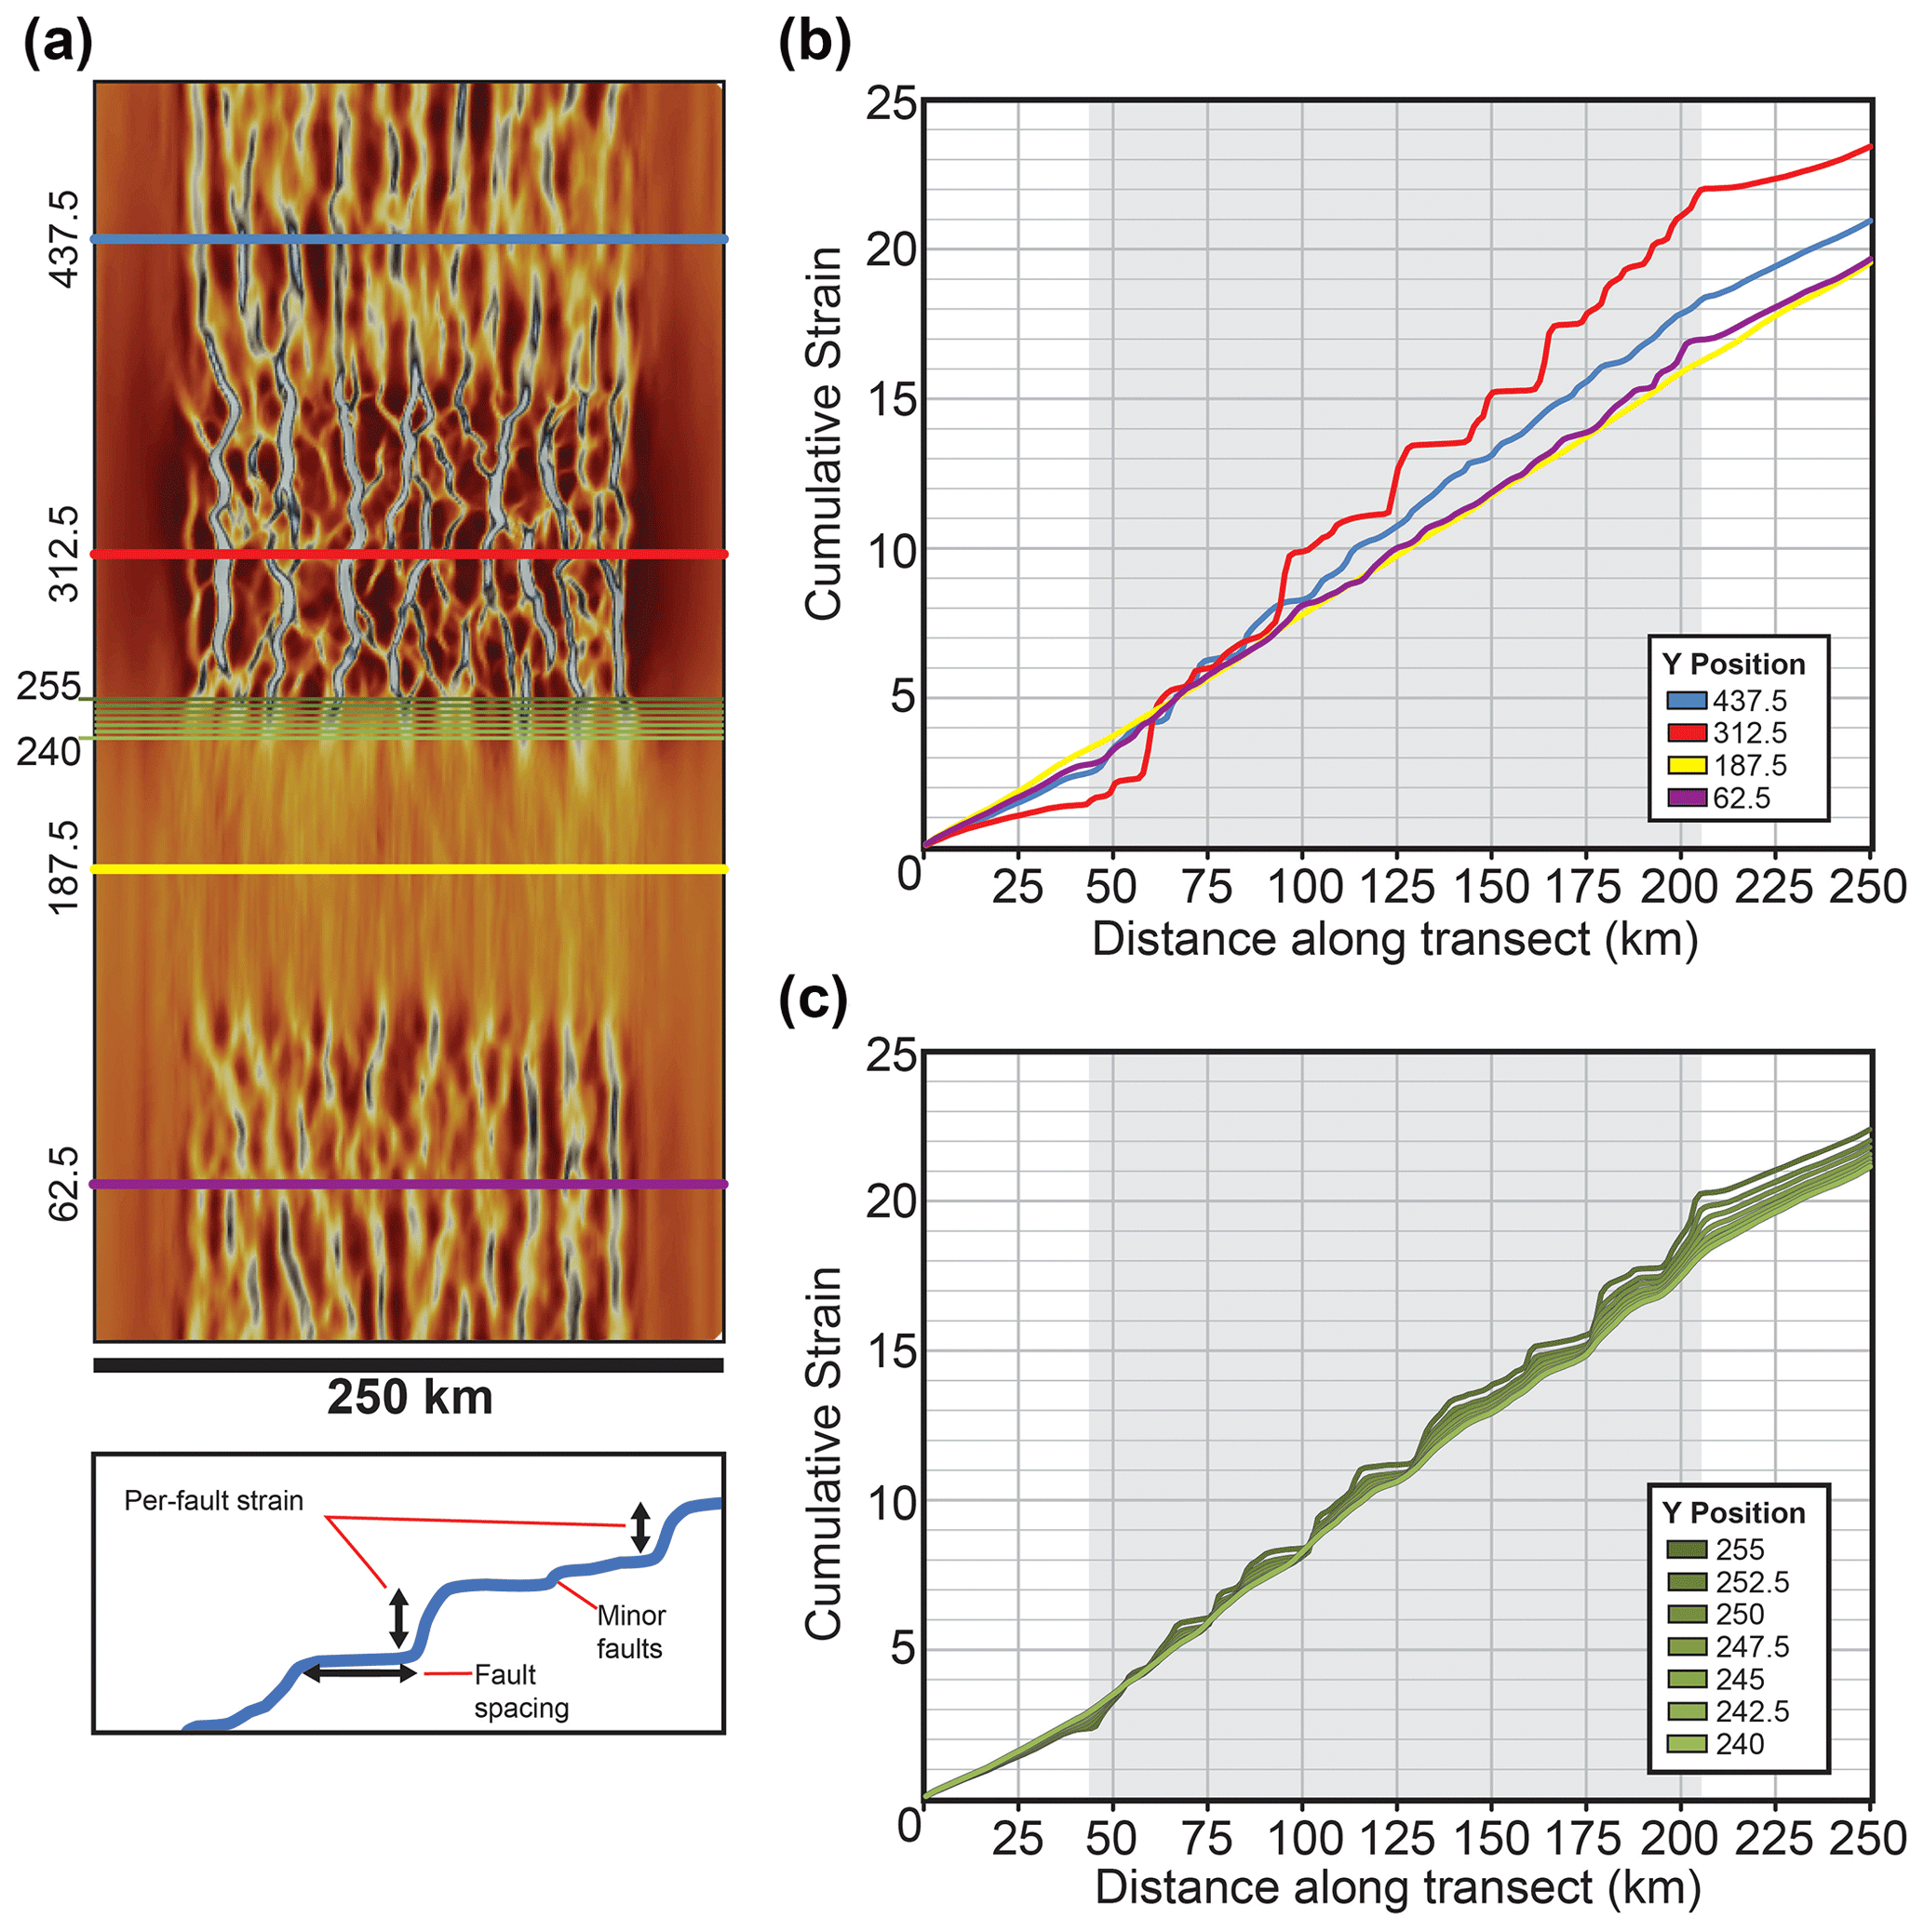
Figure 5(a) Map view image of non-initial plastic strain at 10 Myr across the central 250 km of the model. (b) Strain analysis of multiple transects across the centre of each domain of the model; see (a) for the location. The grey-shaded area represents the location of the damage zone initially across the central 150 km of the model. Note how fault spacing and per-fault strain are greatest in the weak domain, whilst the strong domain approximates uniform strain. (c) Strain analysis of a series of model transects spanning the boundary between the strong and weak domains. Fault spacing and per-fault strain decrease across the boundary into the strong domain.
The total accumulated strain across the strong domain is less (∼ 18) than that of the weak domain (∼ 22) (Fig. 5b). Although both domains are subject to the same strain and experience the same amount of total extension (5 km across the full model run), varying amounts of extension are focussed into the central damage zone depending on the domain. We find that relatively high strain is focussed into the damage zone in the weak domain compared to the strong domain; strain is more distributed between the 125 km wide damage zone and the rest of the model (375 km) in the strong domain compared to the weak domain.
The fault network maintains its overall pattern and topology in the weak domain throughout the model run, with individual faults displaying some advection outwards as the model extends. These faults are spaced at 10–15 km intervals with each fault accommodating strain of ∼ 0.5–1. The areas between the faults are characterised by low-to-zero strain of a magnitude similar to the model areas outside the damage zone. In the reference domains, some strain transfer and interactions occur between fault tips, as identified using the strain rate parameter. Isolated faults appear to progressively link with adjacent structures at various points throughout the model run, forming larger continuous structures (Fig. 4c).
Faults within the reference domains are more closely spaced and accommodate less strain than those in the weak domain. In the south reference domain, per-fault strain is ∼ 0.25–0.5 with spacing of around 25 km. Values in the north reference domain are relatively similar, with per-fault strains of 0.5–0.75 and spacing of 10–15 km. There are often less-developed faults between the more localised structures in the reference domains. We note a slight change in fault density across the north reference domain, with more well-developed and localised structures, producing larger steps in the transects, present to the left side of the model (Fig. 5). This may in part reflect the distribution of the initial plastic strain within the north reference domain or the prevalence of faults extending across the boundary from the adjacent weak domain.
A key point is that fault spacing and per-fault strain, and therefore strain localisation, are highest in the weak domain, decreasing into the north reference domain and the south reference domain. No localisation is identified in the centre of the strong domain, with no clear steps identified in the transect (Fig. 5), which appears to approximate uniform strain (Fig. 5b). Some localisation is identified towards the northern boundary of the domain, as faults from the weak domain begin to extend into the strong domain as broad zones of elevated strain (Fig. 4).
4.3 Strain accommodation across domain boundaries
We analyse fault geometry across the reference–weak and weak–strong domain boundaries (Fig. 4). Strain is more localised in the weak compared to the reference domain, with the latter having a higher background strain (i.e. more distributed) (Fig. 4a). The weak–reference boundary is characterised by a ∼ 10 km zone of diffuse strain (Fig. 4a). To the south, highly localised faults in the weak domain are inhibited at and dissipate towards the strong domain boundary (Fig. 4b). Broad zones of elevated strain characterise the boundary-proximal strong domain and persist up to 25 km away from the boundary (Fig. 5c).
This transition from localised to diffuse strain across domain boundaries demonstrates a “seeding” effect of faults in stronger domains by those in weaker domains (Fig. 4). Established faults propagate into adjacent stronger domains, initially as broad zones of elevated strain that become increasingly localised. This may account for the lateral variation in fault density across the north reference domain; this reflects the density of faults in the weak domain, with more seeding occurring to the left of the model (Fig. 5a). Faults in the north reference domain are partially seeded by those in the adjacent weak domain. However, as the south reference domain is weaker than the adjacent strong domain, faults here are not seeded and initiate independently, accounting for the differences between the reference domains (Fig. 3). In turn, faults in the south reference domain may, along with faults in the weak domain, seed faults in the strong domain (Fig. 4b).
4.4 Fault geometry
The fault network in the weak domain is established in the first 100 kyr of the model run. Faults within the network display a range of orientations and overall strain (Figs. 5a, 6). Numerous relay ramps, lateral fault linkages, and abandoned fault splays are present across the domain, with the larger faults associated with numerous synthetic and antithetic splays (Fig. 6b). Further faults are also present at lower strain values, cross-cutting the main fault and oriented at a relatively high angle(Fig. 6a, b). These high-angle structures appear to roughly follow the distribution of initial plastic strain within the model (Fig. 6b) and are cross-cut by the main fault in map and cross-sectional view (Fig. 6c). In some instances it seems that the cross-cut structures may also form antithetic or synthetic splays to the main structure (Fig. 6b). This suggests the higher-angle faults formed initially before being cross-cut by the main structure. This complex multi-generational faulting occurred within the first 100 kyr of the model run (Fig. 6).
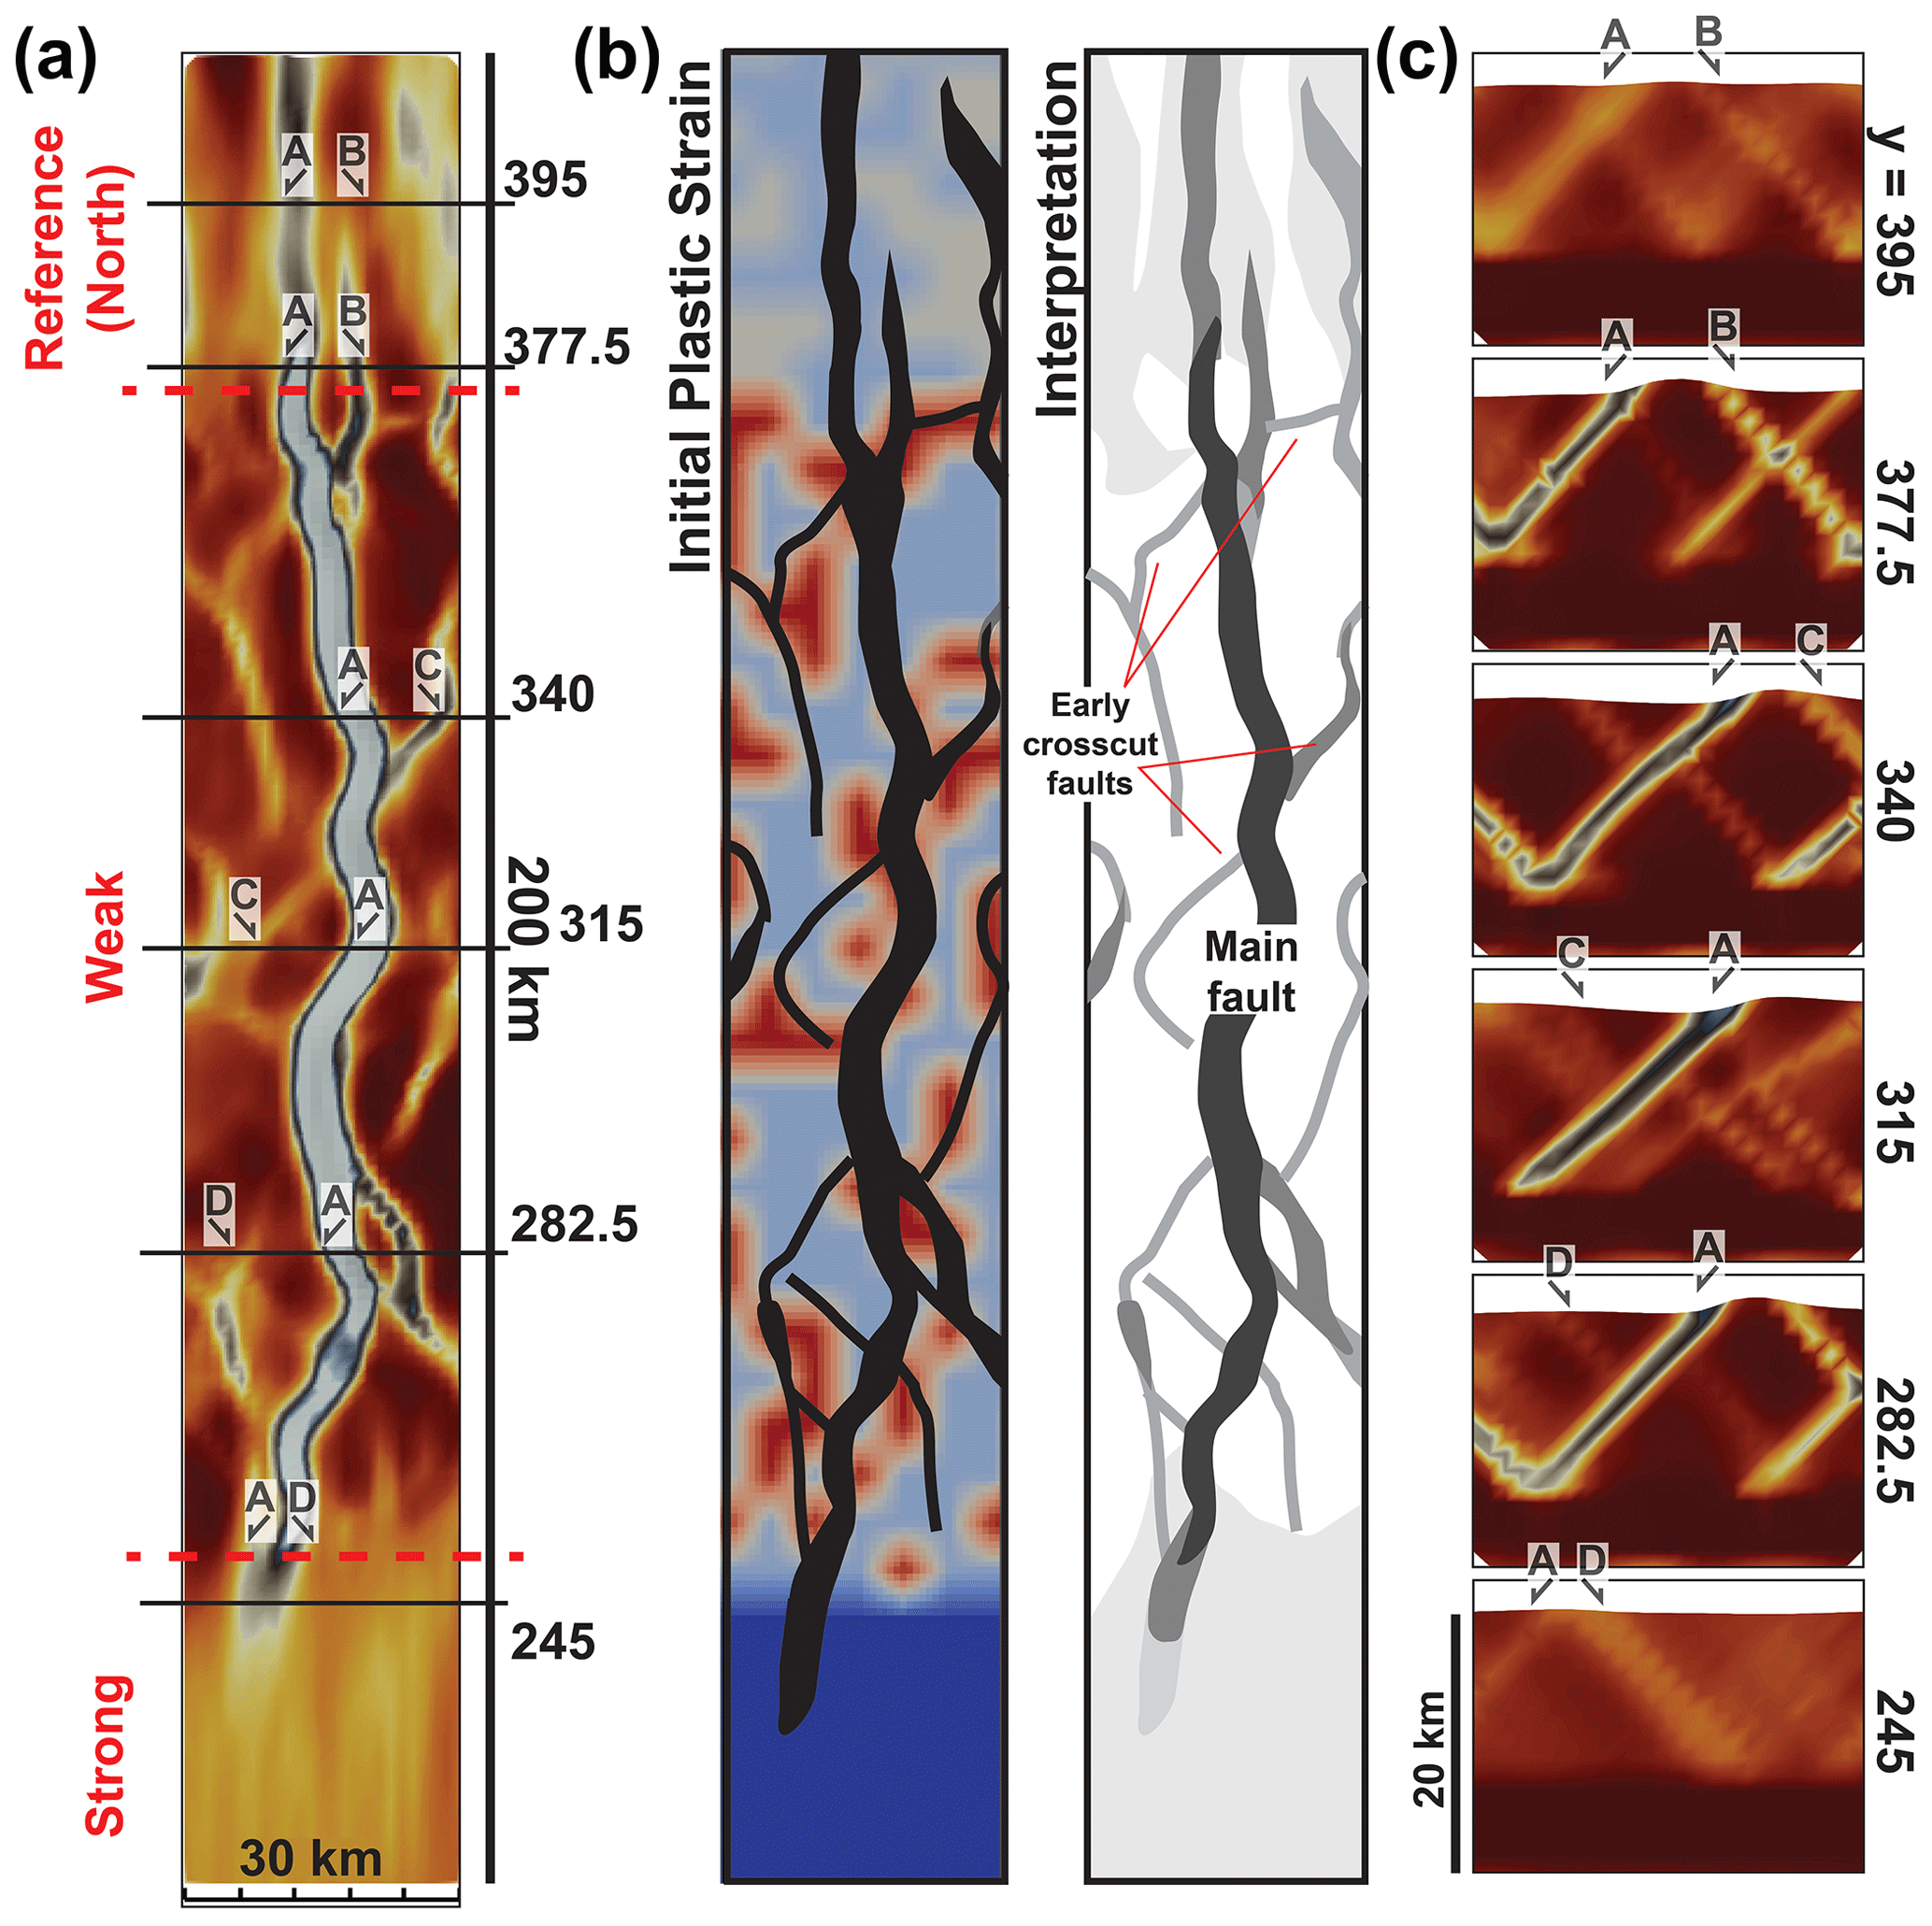
Figure 6(a) Close-up map view image of a fault within the weak domain; see Fig. 4a for the location. The locations of cross sections and key faults are shown. (b) Interpretation of fault geometries within and immediately adjacent to the weak domain. The interpretation and the distribution of initial plastic strain between unit blocks are shown with the interpretation. (c) Cross sections across the model, showing the cross-cutting fault systems. Cross sections shown at 1× vertical exaggeration. See (a) for the location.
At domain boundaries, faults are typically inhibited or greatly reduced in per-fault strain (Fig. 6a). At the boundary between the north reference and weak domains the main fault extends into the reference domain, albeit with lower overall strain (Fig. 6a, c). In contrast, the main fault terminates at the strong–weak domain boundary. Strain is much more distributed within the strong domain, although a wide zone of elevated strain associated with the fault can be identified (Fig. 6a, c).
5.1 Comparisons to previous numerical and analogue modelling studies
In this study we present a series of 3D thermo-mechanical numerical models examining the influence of crustal strength on rift development. Previous analogue modelling studies highlight the influence and interplay between discrete structures throughout the upper crust and lithosphere. Zwaan et al. (2021) show how arrays of intersecting discrete structures may produce complex fault geometries. Similarly, Samsu et al. (2021) use analogue models to show how discrete basement structures can influence the location of faults that formed later without reactivation, whilst Schmid et al. (2022) demonstrate how discrete structures may locally reorient the regional stress field. In our models we do not prescribe discrete individual heterogeneities, instead modelling a diffuse zone of randomised weakness; thus, our heterogeneities display no overall preferred orientation (Fig. 2). This is more representative of a pervasive weak rheology, similar to the analogue models presented in Samsu et al. (2021). A benefit of our numerical modelling approach is that we can assign weakness without relying upon discrete heterogeneities or a weak seed. By altering the contrast between adjacent unit blocks, we are able to effectively assign varying bulk strengths to different domains.
Beniest et al. (2018) use analogue modelling to investigate how lateral strength variations in the lithosphere influence rift style, showing that strain preferentially localises into weaker areas, with strong areas being resistant to strain and acting as rigid blocks. Whilst our model supports the findings of Beniest et al. (2018), a key difference is that it is oriented at 90∘, with each domain subject to strain rather than localised into one area. As a result of this we see some limited localisation within the strong domain, particularly where faults begin to propagate across the domain boundary from adjacent domains (Fig. 6). Where either no strain weakening (models 1 and 2, Fig. 4) or no variation in strain weakening (model 3, Fig. 4) was incorporated into the strong domain, it acts as a rigid block with strain localising around its margins (Fig. 4), in agreement with the observations of Beniest et al. (2018). We are able to identify along-strike changes in the rift physiography and examine how the faults behave at boundaries between domains (Figs. 5, 6). Both models are highly applicable to different geological areas, depending on the initial crustal configuration and orientation of rifting (e.g. Brune et al., 2017).
Previously, numerical modelling studies have often examined first-order controls on the geometry and development of rifts and rifted margins (e.g. Duretz et al., 2016; Naliboff and Buiter, 2015), rather than the three-dimensional upper-crustal-scale observations presented here. Some studies have attempted to replicate the complexity present within the crust and lithosphere (e.g. Duretz et al., 2016), although these are typically limited to two dimensions. One of the key tenets of our study is the ability to analyse rift development in 3D and to examine how rift physiography changes in the along-strike direction atop varying upper-crustal properties. Numerous studies have also focussed on how deeper lithospheric-scale heterogeneities influence tectonic processes (e.g. Heron et al., 2019; Schiffer et al., 2020). Gouiza and Naliboff (2021) use 3D numerical modelling to investigate how lithospheric strength and thickness affect continental rifting and breakup in the Labrador Sea, although this focuses on the first-order rift margin geometry, rather than rift-scale faults and features identified in our models. Whilst we do not incorporate any heterogeneities in the mantle lithosphere in our models, the 150 km wide damage zone controls the first-order rift location, perhaps fulfilling a similar role to mantle heterogeneities during rifting (Fig. 1c). Nevertheless, whilst deeper lithospheric-scale structures may govern first-order rift location, we suggest that rift structural style and physiography is primarily controlled by upper-crustal properties and structures.
Recently, a series of high-resolution 3D numerical investigations have explored fault network evolution and crustal-scale rifting processes (Duclaux et al., 2020; Naliboff et al., 2020; Jourdon et al., 2021; Pan et al., 2022). The models of Duclaux et al. (2020) and Jourdon et al. (2021) demonstrate the dynamics of normal fault network evolution during oblique rifting. Our models of orthogonal extension here share a similar setup to those of Pan et al. (2022) and build upon those of Naliboff et al. (2020), using a randomised distribution of initial plastic strain across a broad area rather than a single weak seed. These studies highlight how complex fault geometries may arise through fault interactions rather than individual heterogeneities. In contrast to these previous studies, our models highlight how fault geometries and rift physiographies vary across crust of varying strength. The cross-cutting fault networks developed during the initial 100 kyr of our models resemble transient fault networks generated in previous modelling studies that focus on fault evolution across smaller timescales (e.g. Cowie et al., 2000; Pan et al., 2022). We suggest that during the initial stages of extension faults exploit the weaknesses between the unit blocks, forming a complex fault network displaying a range of orientations. As extension progresses and strain increases during this initial 100 kyr, strain begins to localise onto larger faults oriented perpendicular to the regional stress (Fig. 6). Similar observations have been made in nature; fractures that initially exploit non-optimally oriented fabrics at low strains may join to form larger throughgoing structures, as identified in shear zones in East Africa (Daly et al., 1989). In addition, the Ekitale Basin along the East African Rift initially exploits low basement structures during low-strain extension, before being overprinted by more optimally oriented structures (Ragon et al., 2019).
5.2 Comparison to natural systems and implications for rifting processes
Our models showcase an idealised scenario where rifting occurs parallel to crustal terranes of varying strength separated by vertical boundaries. Here, we relate key first-order observations from our models to other rift systems globally, including the Great South Basin, New Zealand. In addition, we draw upon our model observations to inform our understanding of rifting processes generally.
Rift structural style varies markedly between different domains; the weak domain is characterised by a highly localised and widely spaced fault network that is established in the model within 100 kyr (Supplement animation S1), whereas the strong domain is characterised by a lack of localisation and relatively distributed strain (Fig. 7). Beneath the Great South Basin, the Murihiku Terrane is a dominantly sedimentary terrane sourced from a fore-arc setting (Tulloch et al., 2019; Sahoo et al., 2020) and is taken as an analogue for the weak domain in our models. The sedimentary nature of this terrane may cause it to be relatively weak, and it also may contain a multitude of pre-existing weaknesses such as bedding planes and pre-existing faults (Tulloch et al., 2019). Similarly, the Brook Street Terrane is primarily composed of volcaniclastic material. In contrast, the Median Batholith is predominantly granitic and relatively homogeneous; this is taken to represent an analogue for the strong domain in our models. Weaknesses are also likely present in the strong Median Batholith terrane, for example, internal shear zones or the boundaries between individual granitic plutons (Allibone and Tulloch, 2004; Phillips and McCaffrey, 2019). However, we suggest these heterogeneities are less pervasive and may display a lower difference in relative strength than heterogeneities in weak areas such as the Murihiku Terrane. Strong bodies, such as granites, typically resist strain localisation, as exemplified by their role as “blocks” in the “block and basin” geometry of UK Carboniferous rift systems (Fraser and Gawthorpe, 1990; Howell et al., 2020) and the Sierra Nevada Batholith in the USA, which buffers extension in the basin and range (Ryan et al., 2020).
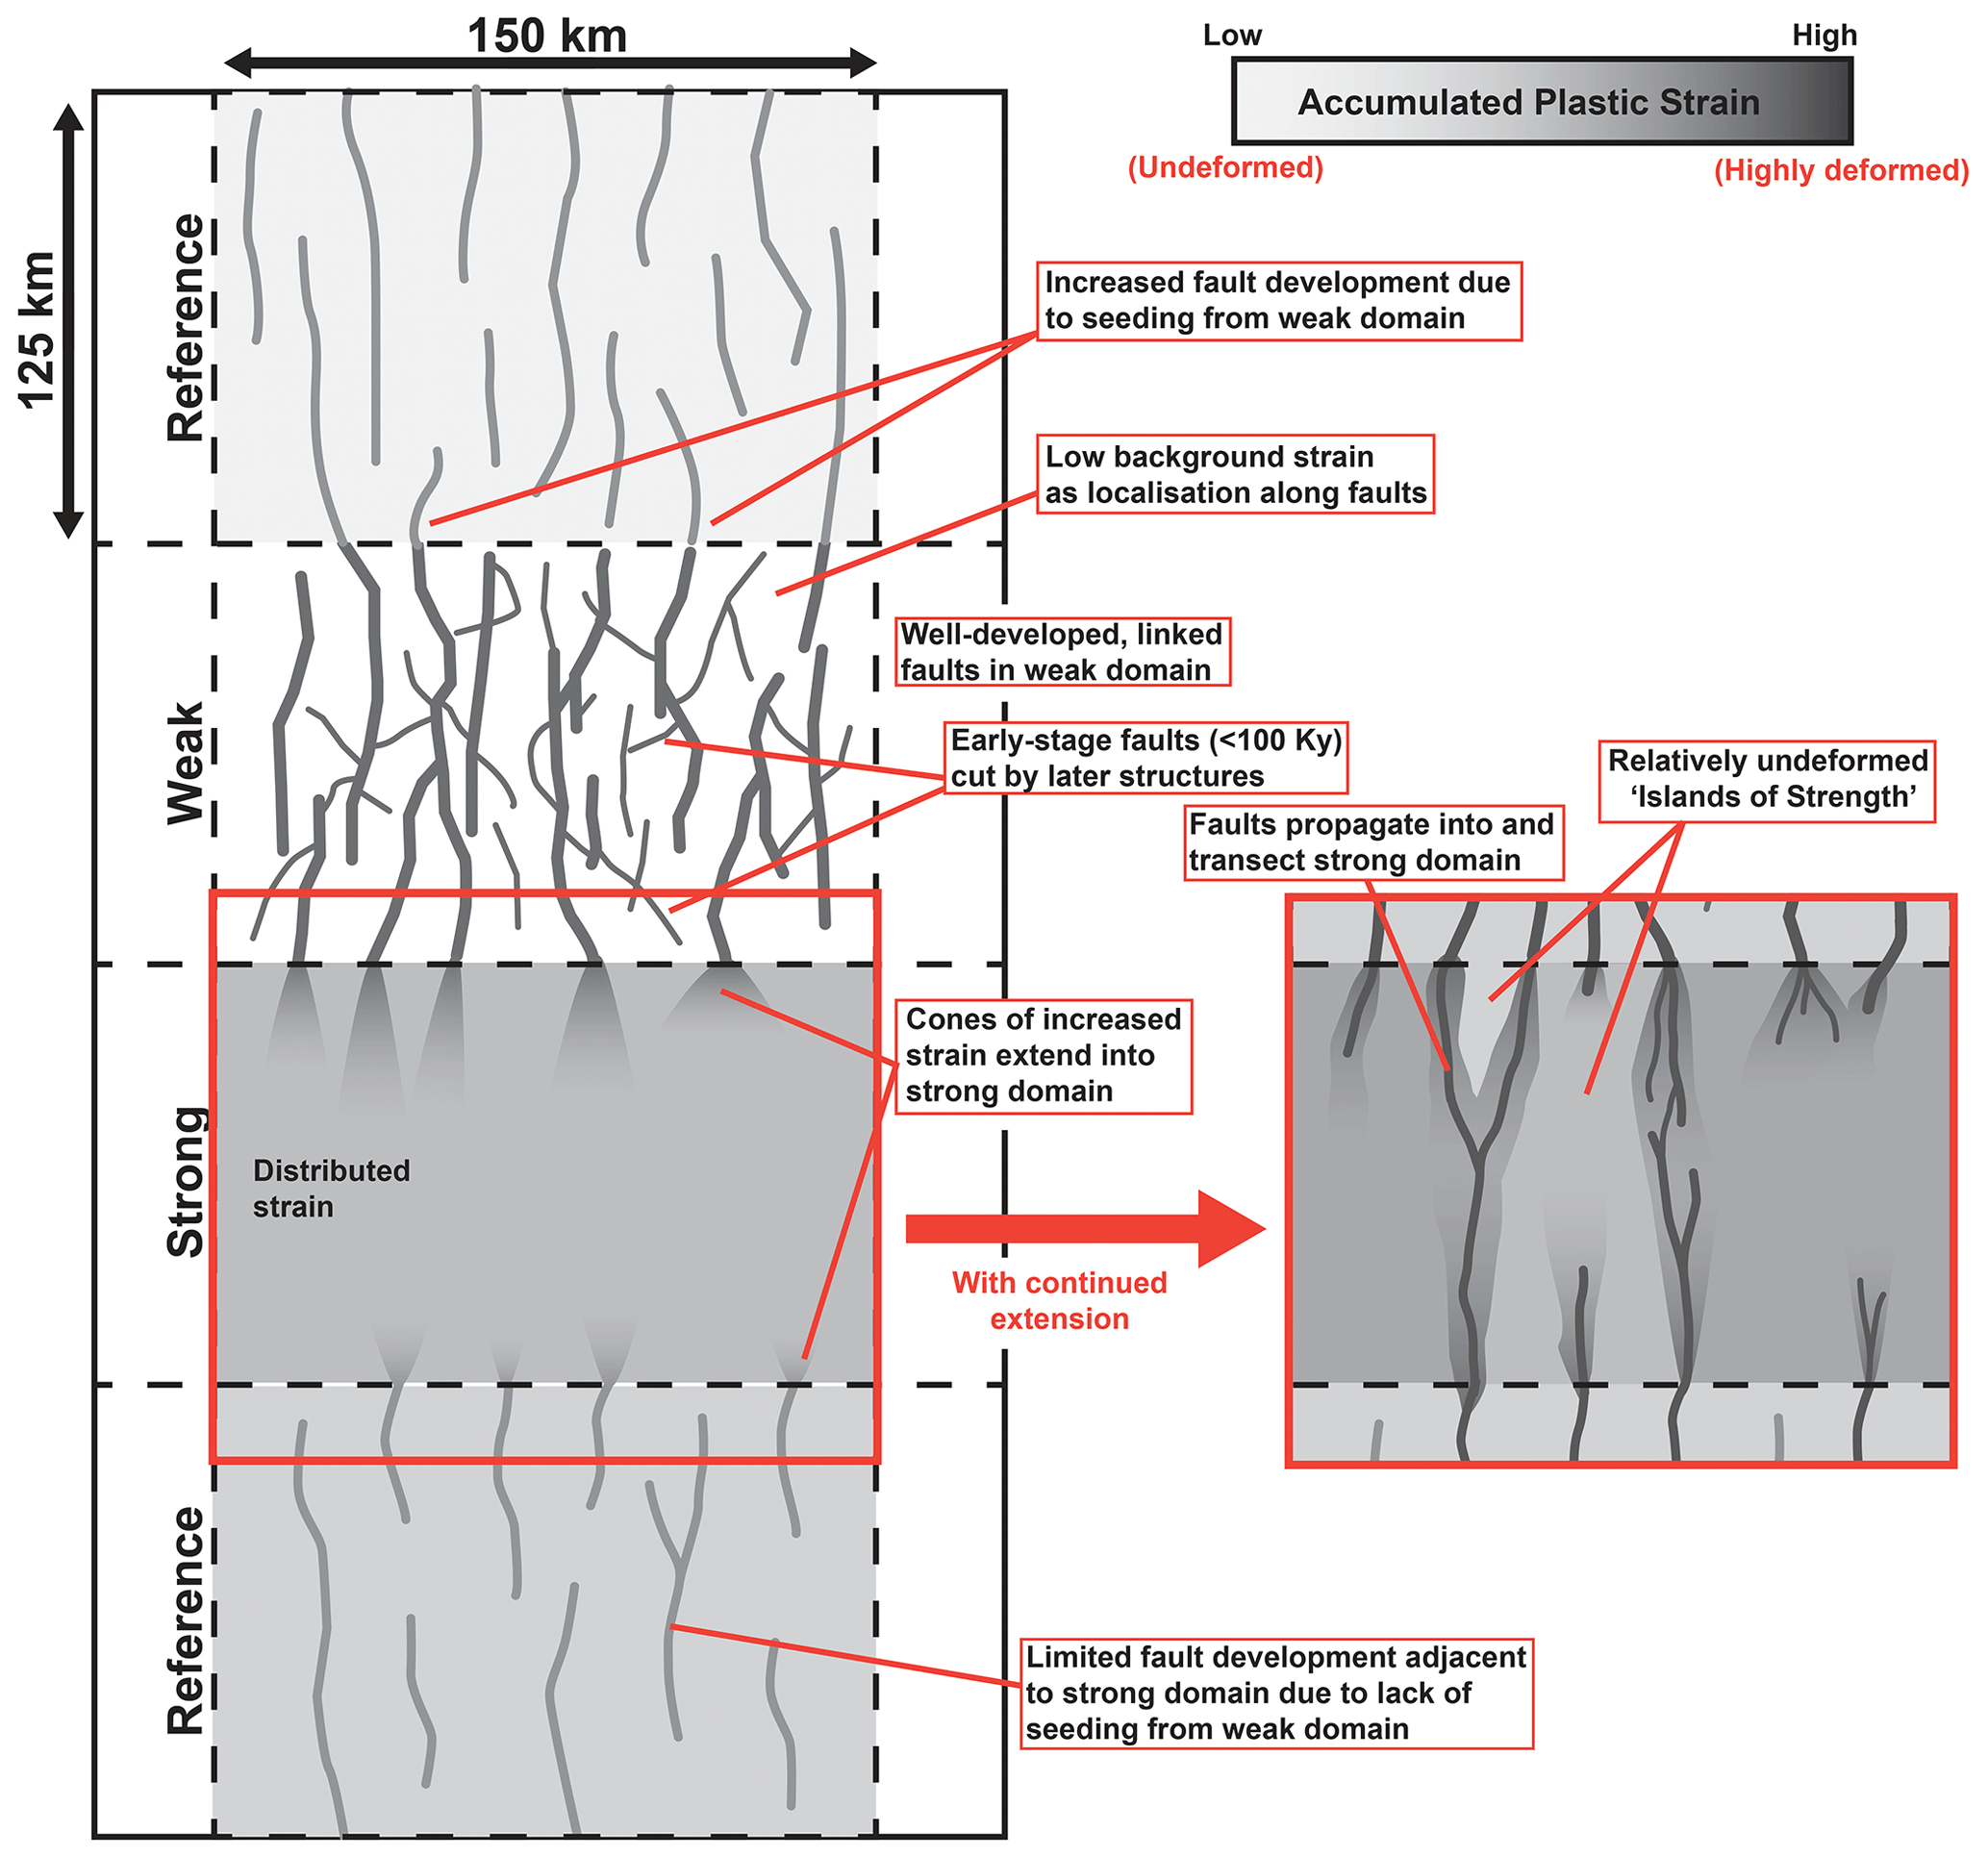
Figure 7The characteristic structural styles associated with each domain and the key concepts demonstrated in our model. Cones of increased strain extend into the strong domain. As extension progresses, faults would eventually propagate into the strong domain, forming throughgoing structures that localise strain and relatively undeformed islands of strength.
Strain localisation occurs diachronously across our model, first in the weak domain and last in the strong domain (Fig. 5a). This agrees with our assumptions of terrane strength from the Great South Basin, where rifting has been shown to initiate in the weak sedimentary and volcaniclastic Murihiku and Brook Street terranes prior to the strong granitic Median Batholith (Fig. 1a) (Sahoo et al., 2020). Similarly, extension in the Tanganyika Rift of the East African Rift system rapidly localises onto border faults where the rift traverses Proterozoic mobile belts but remains distributed across the cratonic Bangwelu Block (Fig. 1b) (Wright et al., 2020). Here, the mobile belts host prominent fabrics, forming weaknesses and acting similarly to the large IPS contrasts in the weak domain (Fig. 2a), thereby causing strain to preferentially localise. In contrast, the cratonic Bangwelu Block hosts only weakly developed fabrics, analogous to the small IPS contrasts present between unit blocks in the strong domain, inhibiting strain localisation (Wright et al., 2020). Similar observations have been made from analogue modelling studies, which show more distributed (uniform) deformation in areas of stronger basement (Samsu et al., 2021).
Gouiza and Naliboff (2021) show how continental rifting and breakup in the Labrador Sea first occurred in the strong North Atlantic Craton before proceeding to relatively weak adjacent basement terranes. The timing and style of breakup between these regions is directly linked to the lithospheric structure, where the geothermal gradient and crustal thickness and rheology control rapid localisation in the stronger (colder, thinner crust) northern regions. Upon first consideration, this would appear to contradict our model results and the geological observations described above, with continental rifting and breakup proceeding rapidly in the relatively stronger areas of crust and suppressed in weaker areas (Gouiza and Naliboff, 2021; Peace et al., 2018). However, these simulations contained randomised brittle heterogeneities of equivalent magnitudes (i.e. degree of initial plastic strain perturbations) within the crust and mantle lithosphere of the northern, central, and southern cratonic domains. As a result, rifting was able to initiate simultaneously across the distinct domains defined by variations in lithospheric structure, rather than randomised brittle strength heterogeneities as done in this study. The model design of Gouiza and Naliboff (2021) was based on the observations that rift initiation in the Labrador Sea was not significantly offset between distinct domains, and numerous heterogeneities are identified onshore in the strong North Atlantic Craton that extend beneath the Labrador Sea (Peace et al., 2018; Wilson et al., 2006) that could have reactivated to accommodate the initial rift fault networks. We suggest that the presence of these sparse weaknesses partition the strong, homogeneous body into multiple isolated “islands of strength” separated by numerous weaker heterogeneities (Fig. 7). Whilst the strong “islands” resist extension, as in our model's strong domain (Fig. 2), strain may rapidly localise along the surrounding weaker heterogeneities. Due to large differences in relative strength between the strong areas and intervening weaknesses, these areas may rapidly localise strain. At the rift scale, strong bodies such as the Median Batholith beneath the Great South Basin or the North Atlantic Craton beneath the Labrador Sea may resemble homogeneous areas similar to the strong domain in our models (Fig. 7). However, examining these areas in more detail highlights internal weaknesses that may localise strain and allow rift systems to propagate through these strong areas. Based on this, we suggest that the strong domain in our models may be more representative of these islands of strength within the rift.
At terrane boundaries, we find that faults are inhibited at boundaries with adjacent, stronger domains, before potentially propagating through them (Fig. 4). No faults are present in the strong domain, with faults arrested at its boundaries. However, faults do traverse the boundary between the weak and reference domains, albeit displaying lower strain in the relatively strong domain (Fig. 6). In the Great South Basin, we observe that faults commonly rotate into alignment with the boundary or segment and terminate against the stronger areas (Fig. 1a) (Phillips and McCaffrey, 2019; Sahoo et al., 2020). Our model observations show that as faults are initially arrested at the boundaries, diffuse areas of strain form in the stronger area, potentially analogous to damage zones in nature (Fig. 3b). We suggest that as extension progresses strain may continue to build up at the terrane boundaries, accommodated by localised structures in the weaker domains and diffuse strain in the stronger domains. These broad areas of elevated strain weaken the stronger domain, and once it is sufficiently weakened, faults from adjacent domains may propagate through the domain boundary and seed faults in the stronger domains (Fig. 3a). These faults are then able to propagate through the stronger area. With further extension, the seeded faults in the strong domain may lead to the development of the islands of strength and intervening weaknesses (Fig. 7). Strain continues to further weaken the established weaknesses, leading to a greater relative strength difference between them and the low-strain strong island. This creates a positive feedback cycle where strain is preferentially focussed into the weaker area (Fig. 7).
We document characteristic structural styles associated with strong and weak crust and examine how strain is manifested across boundaries between areas of different strength. We relate our findings to multiple rift systems globally, offering insights into their evolution and to fundamental continental rifting processes.
We demonstrate that well-developed fault networks develop in weaker areas containing numerous heterogeneities, whilst localisation is inhibited in relatively homogeneous, stronger areas. We find that strain initially localises in these weaker areas before eventually propagating into and traversing stronger areas (Fig. 7), similar to observations from rift systems globally.
Within the weak domain, multiple generations of cross-cutting faults develop in the first 100 kyr, in agreement with other studies examining fault evolution across shorter time intervals. We show how the faults that developed first initially form at non-optimal orientations and follow the weaknesses present within the initial model setup. With continued extension, the fault system reorganises, with new faults aligning perpendicular to the extension direction and cross-cutting the older structures (Fig. 6).
We also highlight how strain localisation and fault development is inhibited within the strong domain of our models. We find that faults are initially inhibited at the boundaries between different domains in our model, as they are at terrane boundaries in nature. Our models offer a temporal perspective, however, showing that broad areas of elevated strain develop in the stronger areas adjacent to fault tips before the barrier is eventually breached and the fault can continue to propagate. The presence of faults within relatively weak domains is able to seed the development of those in adjacent, stronger areas.
We are also able to highlight key differences between our idealised model observations and observations from geological examples. Whilst the strong domain in our models represents a large relatively homogeneous body with only little relative strength differences, similar examples in nature contain some weaknesses at the basin scale that localise strain and may lead to rapid fault development. We suggest that these weaknesses traverse the otherwise strong bodies, creating a series of isolated “islands of strength” that are resistant to extension and more resemble the strong domain in our models.
Our modelling highlights how upper-crustal strength distributions influence rift geometry and physiography. We relate our findings to other modelling studies and rift systems globally and highlight key implications for our understanding of continental rifting processes, particularly during early stages of rifting across a geologically complex crustal substrate.
We use the open-source, mantle convection and lithospheric dynamics code ASPECT (Kronbichler et al., 2012; Heister et al., 2017) to model 3D continental extension (Fig. 1a) following an approach modified from Naliboff et al. (2020) and Pan et al. (2022). The Stokes equations follow the incompressible Boussinesq approximation:
where u is the velocity, μ is the viscosity, is the second invariant of the deviatoric strain rate tensor, p is the pressure, ρ is the density, and g is the gravitational acceleration.
Temperature evolves through a combination of advection, heat conduction, and internal heating as follows:
where Cp is the heat capacity, T is the temperature, t is the time, κ is the thermal diffusivity, α is the linear thermal expansion coefficient, and H is the rate of internal heating.
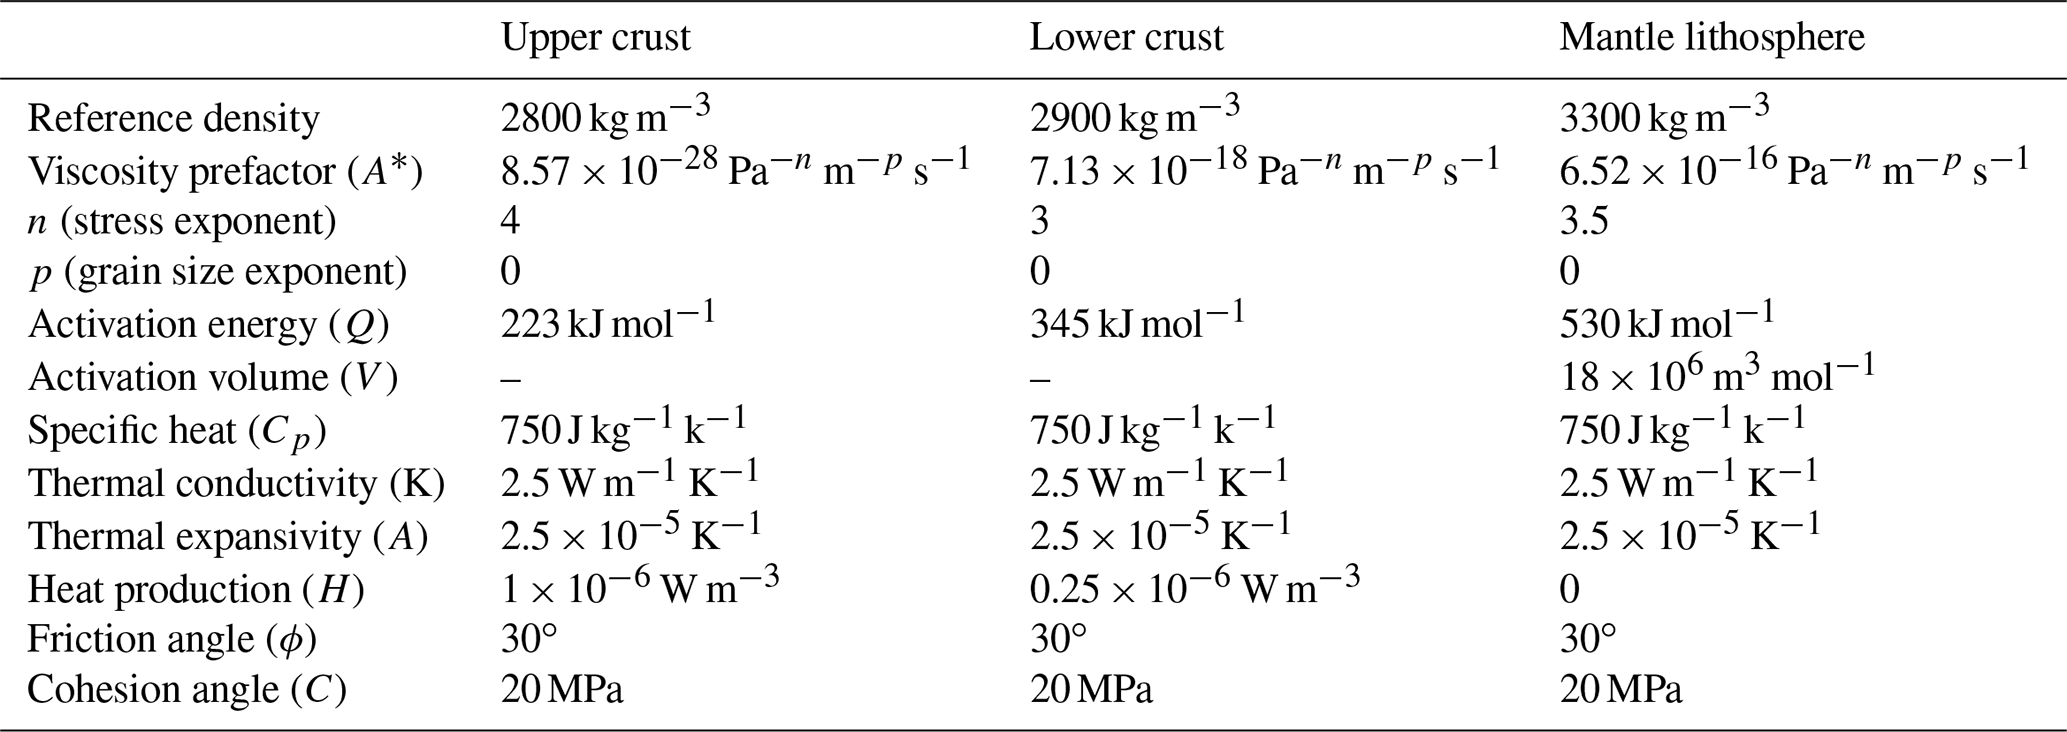
Table A1Material properties for distinct compositional layers.
Density varies linearly as a function of the reference density (ρ0), linear thermal expansion coefficient (α), reference temperature (T0), and temperature.
The model domain spans 500 by 500 km across the horizontal plane (X,Y) and 100 km in the depth (Z) direction (Fig. 1a). The grids are coarsest (5 km) on the sides and base of the model domain and are successively reduced using adaptive-mesh refinement, increasing the resolution to 1.25 km over a central region measuring km (Fig. 1a). Aside from mesh deformation related to free surface evolution, the numerical resolution otherwise stays constant through time with no further adaptive refinement steps. Broadly, this approach provides “natural” boundary conditions for the formation of a distributed fault network within the upper crust. Deformation is driven by prescribed velocities on the model sides to give a total extension rate of 5 mm yr−1 (2.5 mm yr−1 on the left and right walls), which is balanced by inflow at the base of the model.
The model domain contains three distinct compositional layers, representing the upper crust (0–20 km depth), lower crust (20–40 km depth), and lithospheric mantle (40–100 km depth). Distinct reference densities (2800, 2900, 3300 kg m−3) and viscous flow laws for dislocation creep (wet quartzite, Gleason and Tullis, 1995; wet anorthite, Rybacki et al., 2006; dry olivine, Hirth and Kohlstedt, 2003) distinguish these three layers, which deform through a combination of nonlinear viscous flow and brittle (plastic) deformation (e.g. Glerum et al., 2018; Naliboff et al., 2020; Table A1).
The initial temperature distribution follows a characteristic conductive geotherm for the continental lithosphere (Chapman, 1986). We solve for the conductive profile by first assuming a thermal conductivity of 2.5 W m−1 K−1, a surface temperature of 273 K, a surface heat flow of 55 mW m−2, and constant radiogenic heating in each compositional layer (Table A1) that we use to calculate the temperature with depth within each layer. The resulting temperatures at the base of the upper crust, lower crust, and mantle lithosphere are 633, 893, and 1613 K, respectively. The temperature remains fixed at the top and base of the model, while the sides are insulating. The values of the compositional fields are only fixed at the base of the model.
Rheological behaviour combines nonlinear viscous flow with brittle failure (see Glerum et al., 2018). Viscous flow follows dislocation creep, formulated as follows:
where is the second invariant of the deviatoric stress, A is the viscous prefactor, n is the stress exponent, is the second invariant of the deviatoric strain rate (effective strain rate), Q is the activation energy, P is pressure, V is the activation volume, T is temperature, and R is the gas constant. The viscosity (η) within ASPECT is calculated directly through
with the resulting viscous stress equal to .
Brittle plastic deformation follows a Drucker–Prager yield criterion, which accounts for softening of the angle of internal friction (ϕ) and cohesion (C) as a function of accumulated plastic strain:
When the viscous stress exceeds the plastic yield stress, the viscosity is reduced such that the stress lies exactly on the yield plane (i.e. viscosity rescaling method; see Moresi and Solomatov, 1998; Glerum et al., 2018).
The initial friction angle and cohesion are 30∘ and 20 MPa, respectively, and linearly weaken by a factor of 4 as a function of finite plastic strain, which is derived from the second invariant of strain rate in regions undergoing deformation. The initial plastic strain is partitioned into 5.0 km3 blocks that are randomly assigned binary values (e.g. 0.5–1.5) in the different tectonic domains (see Sect. 2.2). This pervasive brittle damage field produces rapid localisation of a well-defined normal fault network (e.g. Pan et al., 2022).
Nonlinearities from the Stokes equations are addressed by applying defect correction Picard iterations (Fraters et al., 2019) to a tolerance of with the maximum number of nonlinear iterations capped at 100. The maximum numerical time step is limited to 20 kyr.
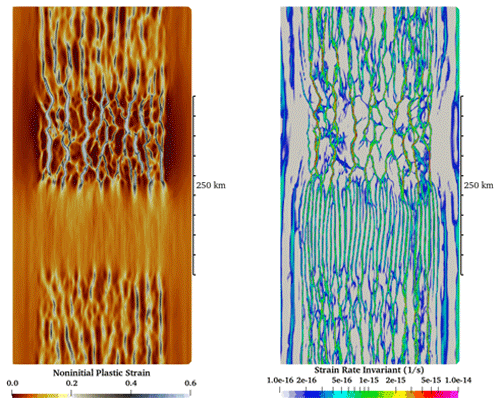
Figure B1Screenshot taken at 10 Myr. The left panel is a model 4 run showing the non-initial plastic strain interval across 10 Myr. The right panel is a model 4 run across 10 Myr showing the strain-rate-invariant attribute. See Fig. 4a and c for snapshots throughout the model run.
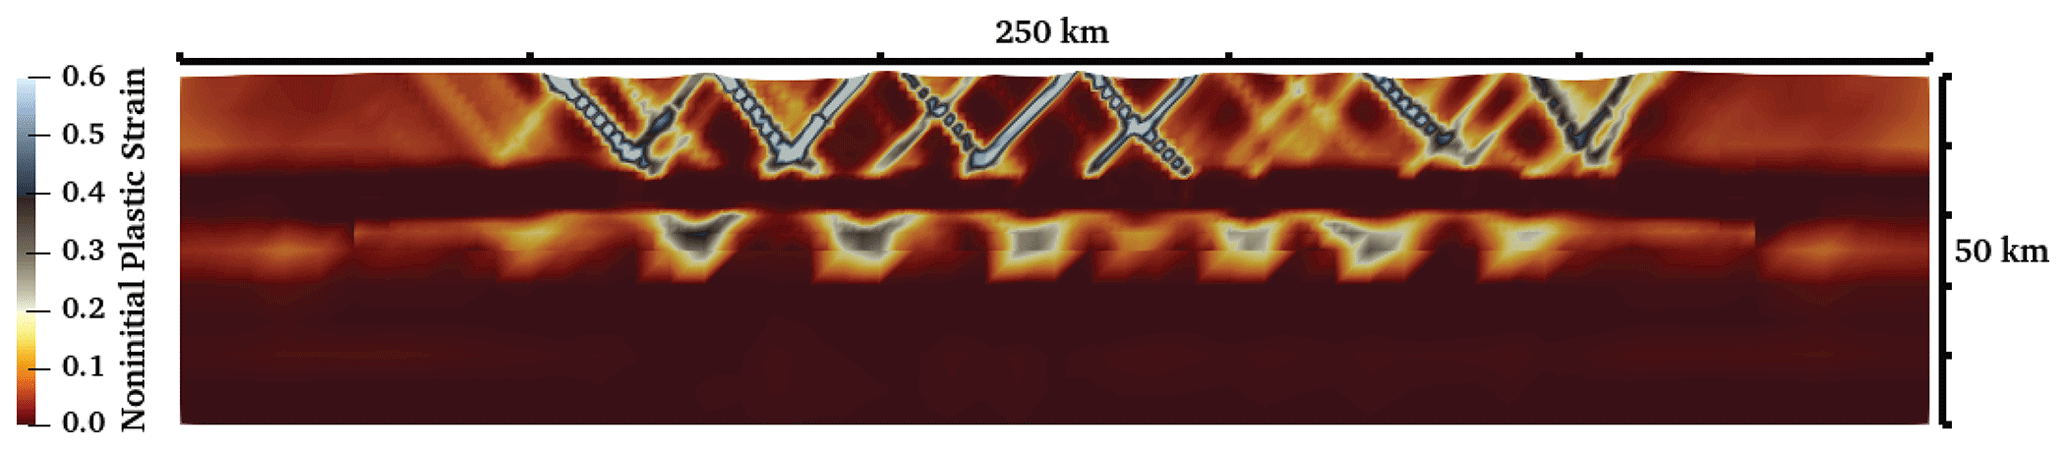
Figure B2Cross section at y=375 km, showing the non-initial plastic strain attribute through 10 Myr of the model run. This location corresponds to the boundary between the weak and reference (north) domains. See Fig. 4b for a 10 Myr snapshot. Screenshot taken at 10 Myr.
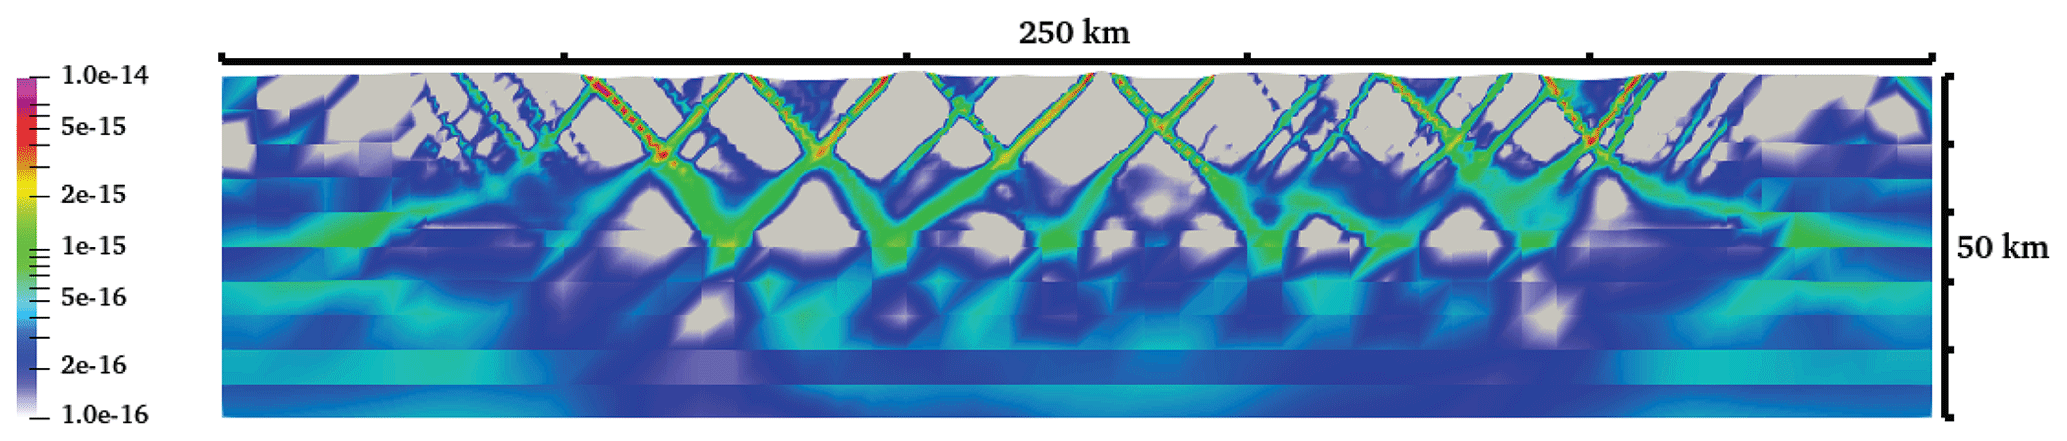
Figure B3Cross section at y=375 km, showing the strain rate attribute through 10 Myr of the model run. This location corresponds to the boundary between the weak and reference (north) domains. See Fig. 4c for a 10 Myr snapshot. Screenshot taken at 10 Myr.
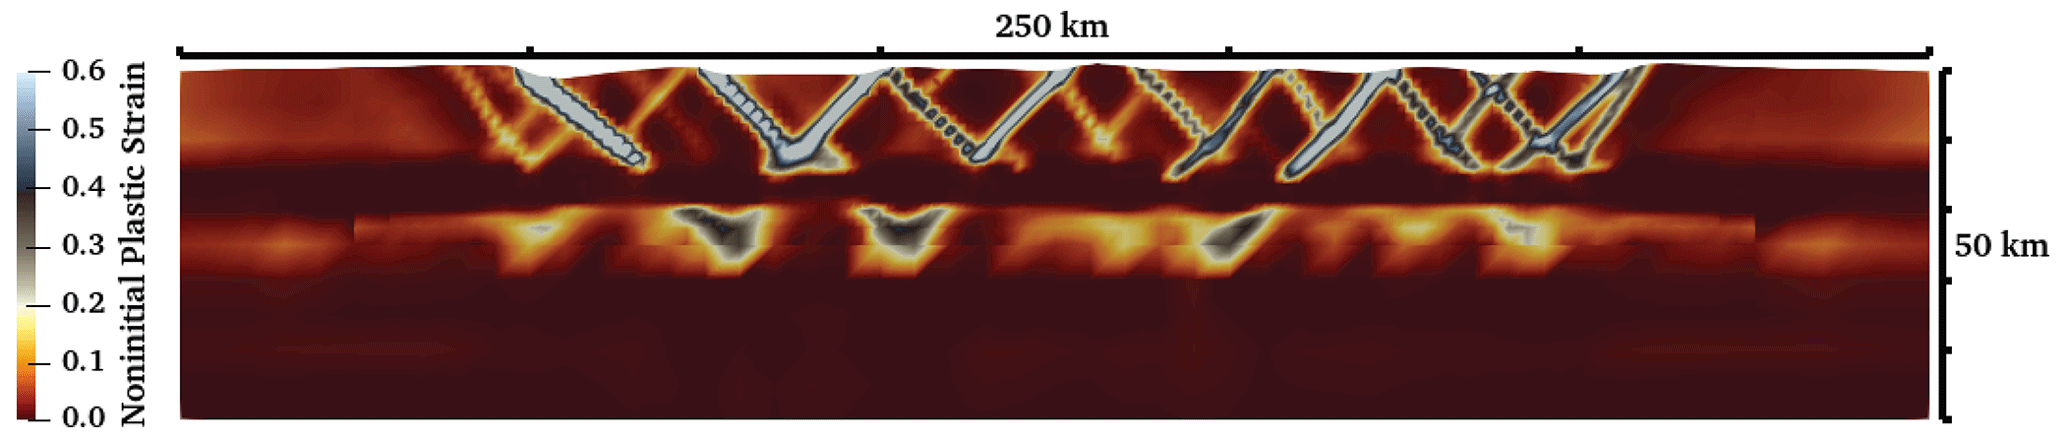
Figure B4Cross section at y=300 km, showing the non-initial plastic strain attribute through 10 Myr of the model run. This section crosses the centre of the weak domain. See Fig. 4b for a 10 Myr snapshot. Screenshot taken at 10 Myr.
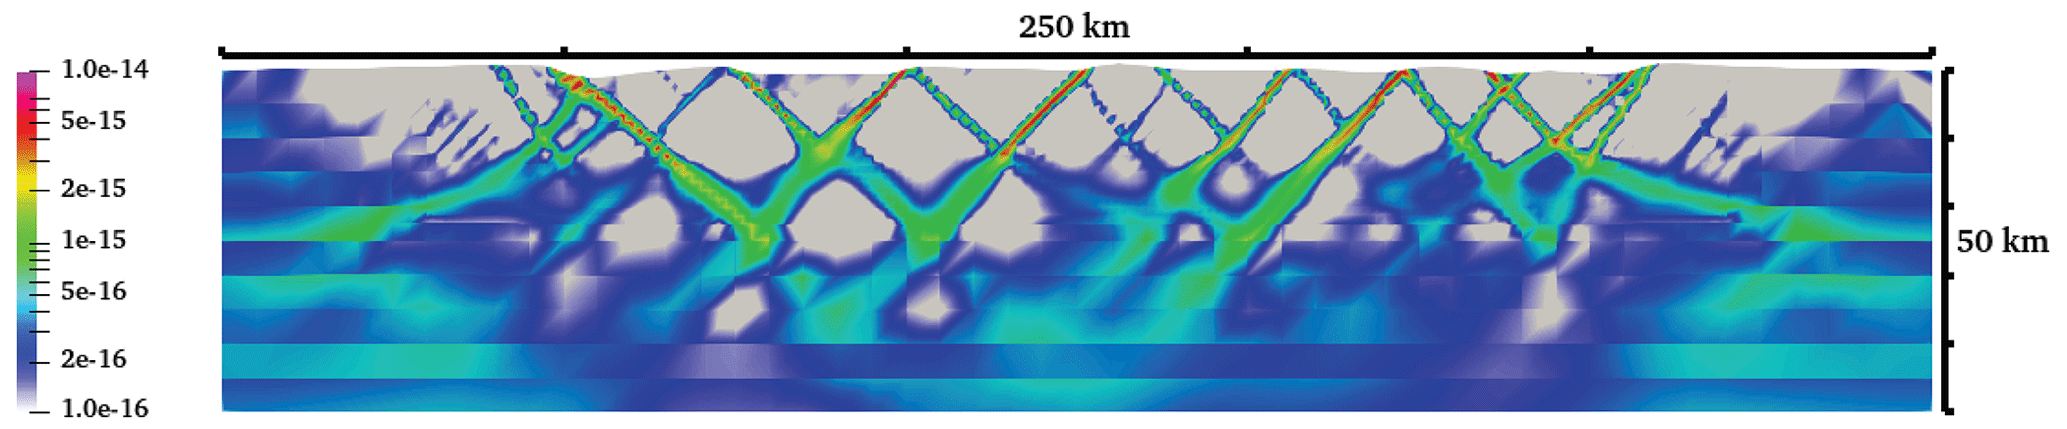
Figure B5Cross section at y=300 km, showing the strain rate attribute through 10 Myr of the model run. This section crosses the centre of the weak domain. See Fig. 4c for a 10 Myr snapshot. Screenshot taken at 10 Myr.
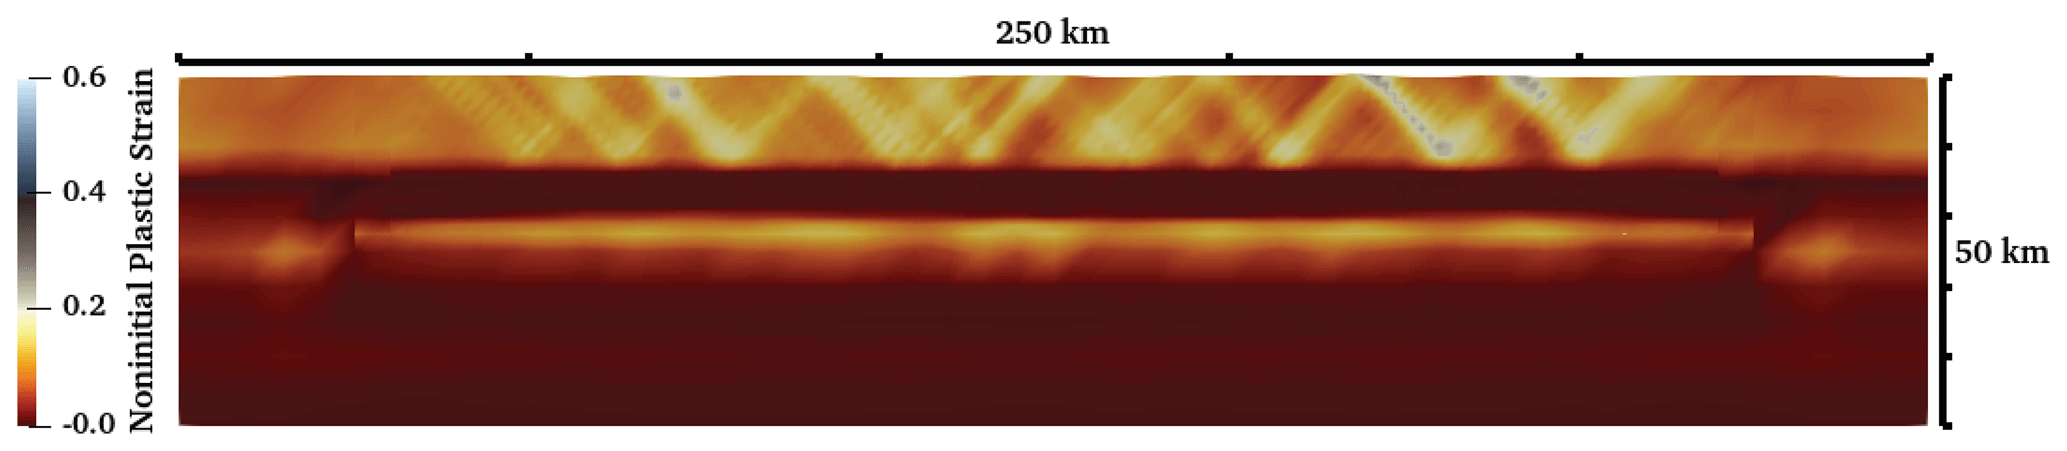
Figure B6Cross section at y=240 km, showing the non-initial plastic strain attribute through 10 Myr of the model run. This section is located 10 km into the strong domain, proximal to the boundary with the weak domain. See Fig. 4b for a 10 Myr snapshot. Screenshot taken at 10 Myr.
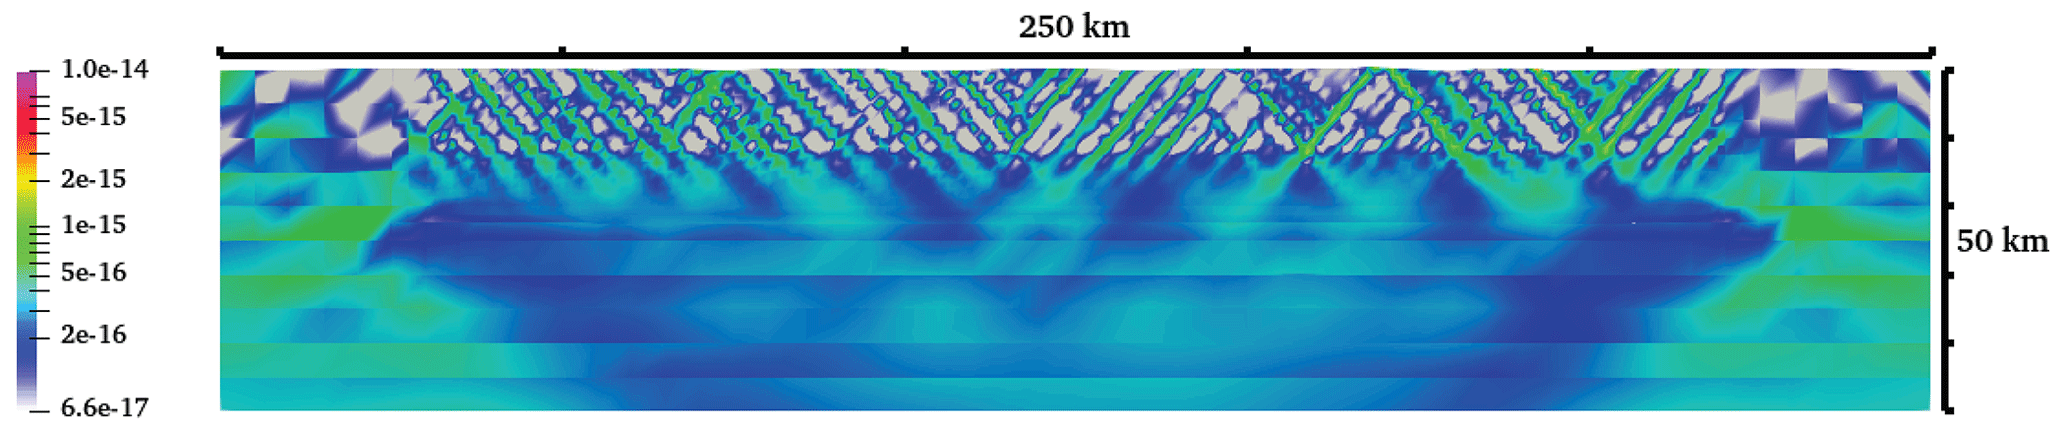
Figure B7Cross section at y=240 km, showing the strain rate attribute through 10 Myr of the model run. This section is located 10 km into the strong domain, proximal to the boundary with the weak domain. See Fig. 4c for a 10 Myr snapshot. Screenshot taken at 10 Myr.
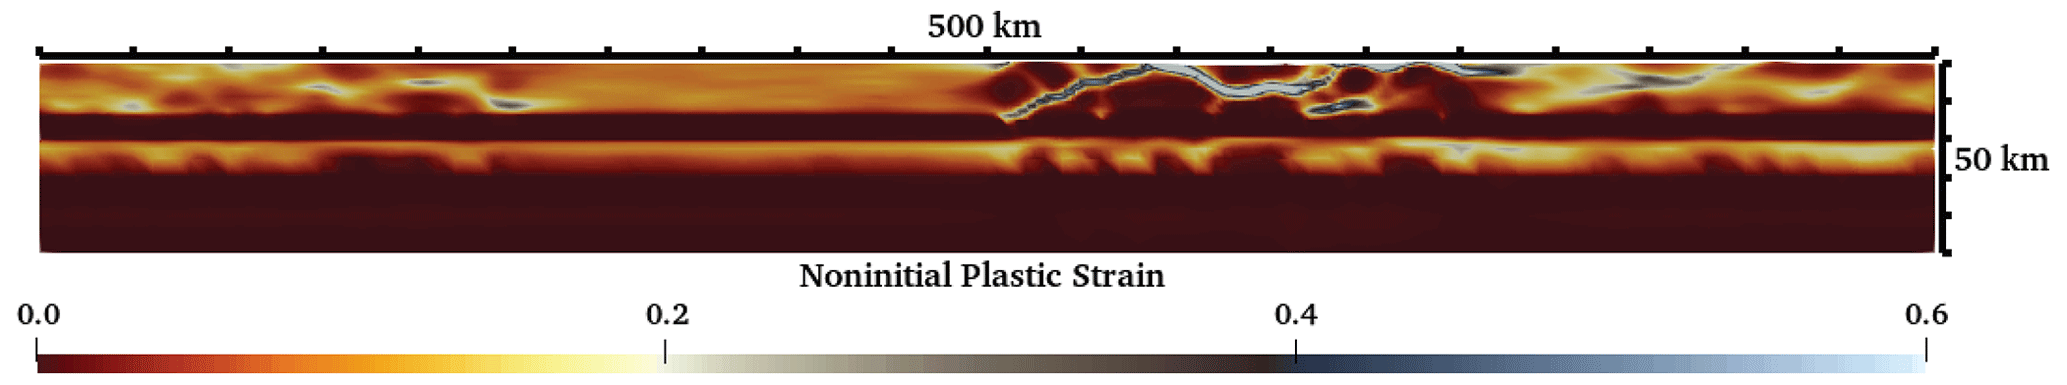
Figure B8Cross section traversing all domains at x=250 km, perpendicular to those shown in Figs. B2–B7. Cross section shows the non-initial plastic strain. See Fig. 4a for a 10 Myr snapshot. Screenshot taken at 10 Myr.
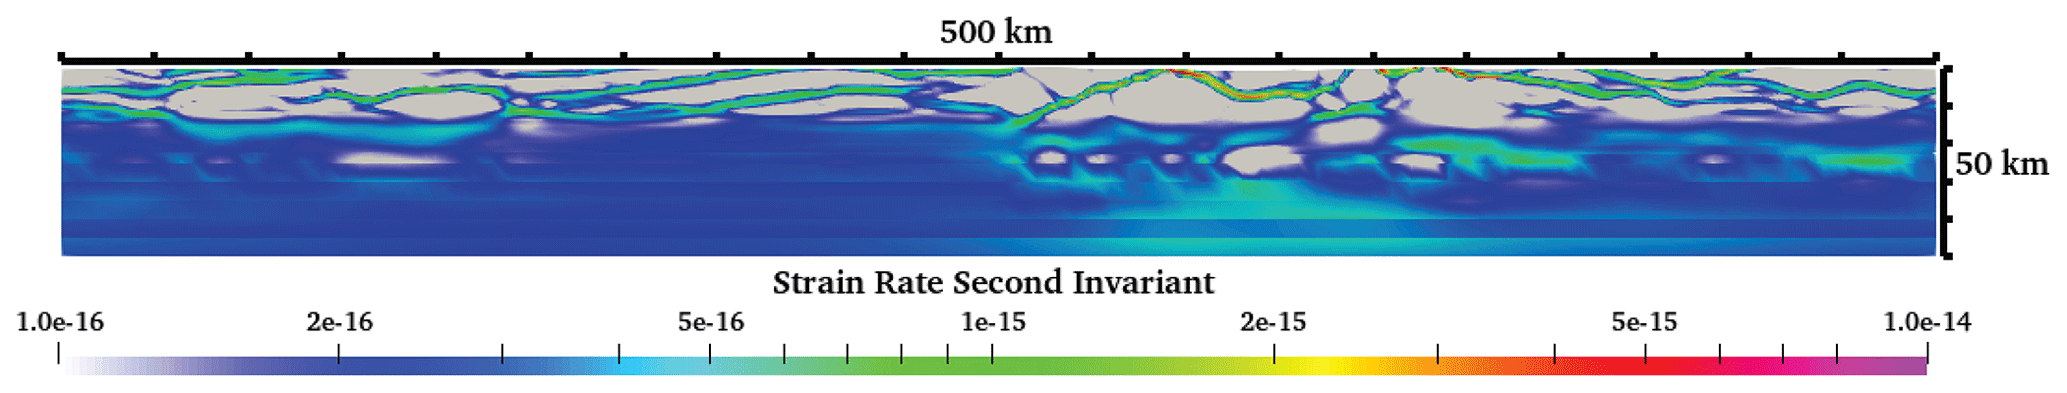
Figure B9Cross section traversing all domains at x=250 km, perpendicular to those shown in Figs. B2–B7. Cross section shows the strain rate attribute. See Fig. 4c for a 10 Myr snapshot. Screenshot taken at 10 Myr.
The numerical simulations were run with the open-source mantle convection and lithospheric dynamics code ASPECT (https://github.com/geodynamics/aspect, last access: 25 May 2022), version 2.4.0-pre (commit 9355aec07). A copy of the ASPECT version used in this study is located with the Zenodo repository associated with this publication (https://doi.org/10.5281/zenodo.7317598, Phillips et al., 2022).
The parameter files required to reproduce the numerical experiments are contained with the Zenodo repository associated with this publication (https://doi.org/10.5281/zenodo.7317598, Phillips et al., 2022). In addition, this Zenodo repository also contains the numerical solution files and postprocessing scripts used to create the images for each figure in this publication.
Animated images of the model runs used throughout this paper are available in the Supplement. The descriptions of each of these models are available in Appendix B. The supplement related to this article is available online at: https://doi.org/10.5194/se-14-369-2023-supplement.
TBP devised the conceptual model used to examine the data, and TBP, JBN, KJWM, and SP designed the experiments and model setup. The models were run by JBN and TBP. JBN and SP developed automated model analysis tools. TBP prepared the manuscript along with input from KJWM, JBN, and all other co-authors. All co-authors contributed to writing, revising, and preparing of the manuscript.
The contact author has declared that none of the authors has any competing interests.
Publisher's note: Copernicus Publications remains neutral with regard to jurisdictional claims in published maps and institutional affiliations.
This article is part of the special issue “(D)rifting into the future: the relevance of rifts and divergent margins in the 21st century”. It is not associated with a conference.
We thank Ake Fagereng and Guillaume Duclaux for providing constructive reviews of an earlier version of this paper, and we again thank Guillaume Duclaux and an anonymous reviewer for their constructive reviews on this version. The computational time for these simulations was provided under XSEDE project EAR18000. Thomas B. Phillips was funded for this research via a Leverhulme Early Career Fellowship at Durham University (ECF2018-065). Malte Froemchen is funded through the NERC-funded IAPETUS2 Doctoral Training Program (DTP).
This research has been supported by the Leverhulme Trust (grant no. ECF-2018-645) and the Natural Environment Research Council (grant no. NE/S007431/1).
This paper was edited by Tiago Alves and reviewed by Guillaume Duclaux and one anonymous referee.
Allibone, A. H. and Tulloch, A. J.: Geology of the plutonic basement rocks of Stewart Island, New Zealand, New Zeal. J Geol. Geop., 47, 233–256, https://doi.org/10.1080/00288306.2004.9515051, 2004
Barrier, A., Nicol, A., Browne, G. H., and Bassett, K. N.: Late Cretaceous coeval multi-directional extension in South Zealandia: Implications for eastern Gondwana breakup, Mar. Petrol. Geol., 118, 104383, https://doi.org/10.1016/j.marpetgeo.2020.104383, 2020.
Beniest, A., Willingshofer, E., Sokoutis, D., and Sassi, W.: Extending continental lithosphere with lateral strength variations: effects on deformation localization and margin geometries, Front. Earth Sci., 6, 148, https://doi.org/10.3389/feart.2018.00148, 2018.
Brune, S., Corti, G., and Ranalli, G.: Controls of inherited lithospheric heterogeneity on rift linkage: Numerical and analog models of interaction between the Kenyan and Ethiopian rifts across the Turkana depression, Tectonics, 36, 1767–1786, https://doi.org/10.1002/2017TC004739, 2017.
Campbell, H. J.: Biostratigraphic age review of New Zealand's Permian–Triassic central terranes, Geological Society, London, Memoirs, 49, 31-41, https://doi.org/10.1144/M49.6, 2019.
Campbell, H. J., Mortimer, N., and Turnbull, I. M.: Murihiku Supergroup, New Zealand: redefined, J. Roy. Soc. New Zeal., 33, 85–95, https://doi.org/10.1080/03014223.2003.9517722, 2003.
Chapman, D. S.: Thermal gradients in the continental crust, Geol. Soc. Spec. Publ., 24, 63–70, 1986.
Cowie, P. A., Gupta, S., and Dawers, N. H.: Implications of fault array evolution for synrift depocentre development: insights from a numerical fault growth model, Basin Res., 12, 241–261, https://doi.org/10.1111/j.1365-2117.2000.00126.x, 2000.
Cowie, P. A., Underhill, J. R., Behn, M. D., Lin, J., and Gill, C. E.: Spatio-temporal evolution of strain accumulation derived from multi-scale observations of Late Jurassic rifting in the northern North Sea: A critical test of models for lithospheric extension, Earth Planet. Sc. Lett., 234, 401–419, https://doi.org/10.1016/j.epsl.2005.01.039, 2005.
Daly, M. C., Chorowicz, J., and Fairhead, J. D.: Rift basin evolution in Africa: the influence of reactivated steep basement shear zones, Geol. Soc. Spec. Publ., 44, 309–334, https://doi.org/10.1144/GSL.SP.1989.044.01.17, 1989.
Doré, A. G., Lundin, E. R., Fichler, C., and Olesen, O.: Patterns of basement structure and reactivation along the NE Atlantic margin, J. Geol. Soc., 154, 85–92, https://doi.org/10.1144/gsjgs.154.1.0085, 1997.
Duclaux, G., Huismans, R. S., and May, D. A.: Rotation, narrowing, and preferential reactivation of brittle structures during oblique rifting, Earth Planet. Sc. Lett., 531, 115952, https://doi.org/10.1016/j.epsl.2019.115952, 2020.
Duretz, T., Petri, B., Mohn, G., Schmalholz, S. M., Schenker, F. L., and Müntener, O.: The importance of structural softening for the evolution and architecture of passive margins, Sci. Rep., 6, 1–7, https://doi.org/10.1038/srep38704, 2016.
Fossen, H., Khani, H. F., Faleide, J. I., Ksienzyk, A. K., and Dunlap, W. J.: Post-Caledonian extension in the West Norway–northern North Sea region: the role of structural inheritance, Geol. Soc. Spec. Publ., 439, 465–486, https://doi.org/10.1144/SP439.6, 2017.
Fraser, A. J. and Gawthorpe, R. L.: Tectono-stratigraphic development and hydrocarbon habitat of the Carboniferous in northern England, Geol. Soc. Spec. Publ., 55, 49–86, https://doi.org/10.1144/GSL.SP.1990.055.01.03, 1990.
Fraters, M. R., Bangerth, W., Thieulot, C., Glerum, A. C., and Spakman, W.: Efficient and practical Newton solvers for non-linear Stokes systems in geodynamic problems, Geophys. J. Int., 218, 873–894, 2019.
Ghisetti, F.: Seismic interpretation, prospects and structural analysis, Great South Basin, Ministry of Economic Development New Zealand, unpublished Petroleum Report PR4173, 2010.
Gleason, G. C. and Tullis, J.: A flow law for dislocation creep of quartz aggregates determined with the molten salt cell, Tectonophysics, 247, 1–23, 1995.
Glerum, A., Thieulot, C., Fraters, M., Blom, C., and Spakman, W.: Nonlinear viscoplasticity in ASPECT: benchmarking and applications to subduction, Solid Earth, 9, 267–294, https://doi.org/10.5194/se-9-267-2018, 2018.
Gouiza, M. and Naliboff, J.: Rheological inheritance controls the formation of segmented rifted margins in cratonic lithosphere, Nat. Commun., 12, 4653, https://doi.org/10.1038/s41467-021-24945-5, 2021.
Heister, T., Dannberg, J., Gassmöller, R., and Bangerth, W.: High accuracy mantle convection simulation through modern numerical methods–II: realistic models and problems, Geophys. J. Int., 210, 833–851, https://doi.org/10.1093/gji/ggx195, 2017.
Heron, P. J., Peace, A. L., McCaffrey, K. J., Welford, J. K., Wilson, R., van Hunen, J., and Pysklywec, R. N.: Segmentation of rifts through structural inheritance: Creation of the Davis Strait, Tectonics, 38, 2411–2430, https://doi.org/10.1029/2019TC005578, 2019.
Henza, A. A., Withjack, M. O., and Schlische, R. W.: How do the properties of a pre-existing normal-fault population influence fault development during a subsequent phase of extension?, J. Struct. Geol., 33, 1312–1324, https://doi.org/10.1016/j.jsg.2011.06.010, 2011.
Hirth, G. and Kohlstedf, D.: Rheology of the upper mantle and the mantle wedge: A view from the experimentalists, Geophys. Monogr., 138, 83–106, 2003.
Holdsworth, R. E., Handa, M., Miller, J. A., and Buick, I. S.: Continental reactivation and reworking: an introduction, Geol. Soc. Spec. Publ., 184, 1–12, https://doi.org/10.1144/GSL.SP.2001.184.01.01, 2001.
Howell, L., Egan, S., Leslie, G., and Clarke, S.: Structural and geodynamic modelling of the influence of granite bodies during lithospheric extension: application to the Carboniferous basins of northern England, Tectonophysics, 755, 47–63, https://doi.org/10.1016/j.tecto.2019.02.008, 2019.
Howell, L., Egan, S., Leslie, G., Clarke, S., Mitten, A., and Pringle, J.: The influence of low-density granite bodies on extensional basins, Geology Today, 36, 22–26, https://doi.org/10.1111/gto.12297, 2020.
Jourdon, A., Kergaravat, C., Duclaux, G., and Huguen, C.: Looking beyond kinematics: 3D thermo-mechanical modelling reveals the dynamics of transform margins, Solid Earth, 12, 1211–1232, https://doi.org/10.5194/se-12-1211-2021, 2021.
Kirkpatrick, J. D., Bezerra, F. H. R., Shipton, Z. K., Do Nascimento, A. F., Pytharouli, S. I., Lunn, R. J., and Soden, A. M.: Scale-dependent influence of pre-existing basement shear zones on rift faulting: a case study from NE Brazil, J. Geol. Soc., 170, 237–247, https://doi.org/10.1144/jgs2012-043, 2013.
Kronbichler, M., Heister, T., and Bangerth, W.: High accuracy mantle convection simulation through modern numerical methods, Geophys. J. Int., 191, 12–29, https://doi.org/10.1111/j.1365-246X.2012.05609.x, 2012.
Lang, G., ten Brink, U. S., Hutchinson, D. R., Mountain, G. S., and Schattner, U.: The Role of Premagmatic Rifting in Shaping a Volcanic Continental Margin: An Example From the Eastern North American Margin, J. Geophys. Res.-Sol. Ea., 125, e2020JB019576, https://doi.org/10.1029/2020JB019576, 2020.
Larsen, B. T., Olaussen, S., Sundvoll, B., and Heeremans, M.: The Permo-Carboniferous Oslo Rift through six stages and 65 million years, Episodes Journal of International Geoscience, 31, 52–58, https://doi.org/10.18814/epiiugs/2008/v31i1/008, 2008.
Moresi, L. and Solomatov, V.: Mantle convection with a brittle lithosphere: thoughts on the global tectonic styles of the Earth and Venus, Geophys. J. Int., 133, 669–682, 1998.
Mortimer, N., Davey, F. J., Melhuish, A., Yu, J., and Godfrey, N. J.: Geological interpretation of a deep seismic reflection profile across the Eastern Province and Median Batholith, New Zealand: crustal architecture of an extended Phanerozoic convergent orogen, New Zeal. J. Geol. Geop., 45, 349–363, https://doi.org/10.1080/00288306.2002.9514978, 2002.
Naliboff, J. and Buiter, S. J.: Rift reactivation and migration during multiphase extension, Earth Planet. Sc. Lett., 421, 58–67, https://doi.org/10.1016/j.epsl.2015.03.050, 2015.
Naliboff, J. B., Buiter, S. J., Péron-Pinvidic, G., Osmundsen, P. T., and Tetreault, J.: Complex fault interaction controls continental rifting, Nat. Commun., 8, 1–9, https://doi.org/10.1038/s41467-017-00904-x, 2017.
Naliboff, J. B., Glerum, A., Brune, S., Péron-Pinvidic, G., and Wrona, T.: Development of 3-D rift heterogeneity through fault network evolution, Geophys. Res. Lett., 47, e2019GL086611, https://doi.org/10.1029/2019GL086611, 2020.
Pan, S., Bell, R. E., Jackson, C. A. L., and Naliboff, J.: Evolution of normal fault displacement and length as continental lithosphere stretches, Basin Res., 34, 121–140, https://doi.org/10.1111/bre.12613, 2022.
Peace, A., McCaffrey, K., Imber, J., van Hunen, J., Hobbs, R., and Wilson, R.: The role of pre-existing structures during rifting, continental breakup and transform system development, offshore West Greenland, Basin Res., 30, 373–394, https://doi.org/10.1111/bre.12257, 2018.
Phillips, T. B. and Magee, C.: Structural controls on the location, geometry and longevity of an intraplate volcanic system: the Tuatara Volcanic Field, Great South Basin, New Zealand, J. Geol. Soc., 177, 1039–1056, https://doi.org/10.1144/jgs2020-050, 2020.
Phillips, T. B. and McCaffrey, K. J.: Terrane Boundary Reactivation, Barriers to Lateral Fault Propagation and Reactivated Fabrics: Rifting Across the Median Batholith Zone, Great South Basin, New Zealand, Tectonics, 38, 4027–4053, https://doi.org/10.1029/2019TC005772, 2019.
Phillips, T. B., Fazlikhani, H., Gawthorpe, R. L., Fossen, H., Jackson, C. A. L., Bell, R. E., Faleide, J. I., and Rotevatn, A.: The influence of structural inheritance and multiphase extension on rift development, the Northern North Sea, Tectonics, 38, 4099–4126, https://doi.org/10.1029/2019TC005756, 2019.
Phillips, T. B., Naliboff, J., McCaffrey, K., Pan, S., van Hunen, J., and Malte, F.: The influence of crustal strength on rift geometry and development – Insights from 3D numerical modelling, Zenodo [code and data set], https://doi.org/10.5281/zenodo.7317598, 2022.
Ragon, T., Nutz, A., Schuster, M., Ghienne, J. F., Ruffet, G., and Rubino, J. L.: Evolution of the northern Turkana Depression (East African Rift System, Kenya) during the Cenozoic rifting: New insights from the Ekitale Basin (28–25.5 Ma), Geol. J., 54, 3468–3488, https://doi.org/10.1002/gj.3339, 2019.
Rose, I., Buffett, B., and Heister, T.: Stability and accuracy of free surface time integration in viscous flows, Phys. Earth Planet. In., 262, 90–100, https://doi.org/10.1016/j.pepi.2016.11.007, 2017.
Ryan, J., Frassetto, A. M., Hurd, O., Jones, C. H., Unruh, J., Zandt, G., Gilbert, H., and Owens, T. J.: Unusually deep earthquakes in the central Sierra Nevada (California, USA): Foundering ultramafic lithosphere? Geosphere, 16, 357–377, https://doi.org/10.1130/GES02158.1, 2020.
Rybacki, E., Gottschalk, M., Wirth, R., and Dresen, G.: Influence of water fugacity and activation volume on the flow properties of fine‐grained anorthite aggregates, J. Geophys. Res.-Sol. Ea., 111, B03203, https://doi.org/10.1029/2005JB003663, 2006.
Sahoo, T. R., Nicol, A., Browne, G. H., and Strogen, D. P.: Evolution of a normal fault system along eastern Gondwana, New Zealand, Tectonics, 39, e2020TC006181, https://doi.org/10.1029/2020TC006181, 2020.
Samsu, A., Cruden, A. R., Molnar, N. E., and Weinberg, R. F.: Inheritance of penetrative basement anisotropies by extension-oblique faults: Insights from analogue experiments, Tectonics, 40, e2020TC006596, https://doi.org/10.1029/2020TC006596, 2021.
Schiffer, C., Doré, A. G., Foulger, G. R., Franke, D., Geoffroy, L., Gernigon, L., Holdsworth, R., Kusznir, N., Lundin, E., McCaffrey, K. J. W., Peace, A. L., Petersen, K. D., Phillips, T. B., Stephenson, R., Stoker, M. S., and Welford, J. K.: Structural inheritance in the North Atlantic, Earth-Sci. Rev., 206, 102975, https://doi.org/10.1016/j.earscirev.2019.102975, 2020.
Schmid, T. C., Brune, S., Glerum, A., and Schreurs, G.: Tectonic interactions during rift linkage: Insights from analog and numerical experiments, EGUsphere [preprint], https://doi.org/10.5194/egusphere-2022-1203, 2022.
Sutton, J. and Watson, J. V.: Architecture of the continental lithosphere, Philos. T. Roy. Soc. Lond. A, 317, 5–12, https://doi.org/10.1098/rsta.1986.0020, 1986.
Tarling, M. S., Smith, S. A. F., Scott, J. M., Rooney, J. S., Viti, C., and Gordon, K. C.: The internal structure and composition of a plate-boundary-scale serpentinite shear zone: the Livingstone Fault, New Zealand, Solid Earth, 10, 1025–1047, https://doi.org/10.5194/se-10-1025-2019, 2019.
Thomas, W. A.: Tectonic inheritance at a continental margin, GSA Today, 16, 4–11, https://doi.org/10.1130/1052-5173(2006)016<4:TIAACM>2.0.CO;2, 2006.
Thomas, W. A.: Tectonic inheritance at multiple scales during more than two complete Wilson cycles recorded in eastern North America, Geol. Soc. Spec. Publ., 470, 337, https://doi.org/10.1144/SP470.4, 2019.
Tiberi, C., Gautier, S., Ebinger, C., Roecker, S., Plasman, M., Albaric, J., Déverchère, J., Peyrat, S., Perrot, J., Ferdinand Wambura, R., Msabi, M., Muzuka, A., Mulibo, G., and Kianji, G.: Lithospheric modification by extension and magmatism at the craton-orogenic boundary: North Tanzania Divergence, East Africa, Geophys. J. Int., 216, 1693–1710, 4 https://doi.org/10.1093/gji/ggy521, 2019.
Tulloch, A. J., Mortimer, N., Ireland, T. R., Waight, T. E., Maas, R., Palin, J. M., Sahoo, T., Seebeck, H., Sagar, M. W., Barrier, A., and Turnbull, R. E.: Reconnaissance basement geology and tectonics of South Zealandia, Tectonics, 38, 516–551, https://doi.org/10.1029/2018TC005116, 2019.
Vasconcelos, D. L., Bezerra, F. H., Clausen, O. R., Medeiros, W. E., de Castro, D. L., Vital, H., and Barbosa, J. A.: Influence of Precambrian shear zones on the formation of oceanic fracture zones along the continental margin of Brazil, Mar. Petrol. Geol., 101, 322–333, https://doi.org/10.1016/j.marpetgeo.2018.12.010, 2019.
Wilson, R. W., Klint, K. E. S., Van Gool, J. A. M., McCaffrey, K. J. W., Holdsworth, R. E., and Chalmers, J. A.: Faults and fractures in central West Greenland: onshore expression of continental break-up and sea-floor spreading in the Labrador–Baffin Bay Sea, GEUS Bulletin, 11, 185–204, https://doi.org/10.34194/geusb.v11.4931, 2006.
Wright, L. J., Muirhead, J. D., and Scholz, C. A.: Spatiotemporal Variations in Upper Crustal Extension Across the Different Basement Terranes of the Lake Tanganyika Rift, East Africa, Tectonics, 39, e2019TC006019, https://doi.org/10.1029/2019TC006019, 2020.
Zwaan, F., Chenin, P., Erratt, D., Manatschal, G., and Schreurs, G.: Complex rift patterns, a result of interacting crustal and mantle weaknesses, or multiphase rifting? Insights from analogue models, Solid Earth, 12, 1473–1495, https://doi.org/10.5194/se-12-1473-2021, 2021.
- Abstract
- Introduction
- Numerical approach
- Exploring strength parameter space
- Strain accommodation through time (model 4)
- Discussion
- Conclusions
- Appendix A
- Appendix B
- Code availability
- Data availability
- Author contributions
- Competing interests
- Disclaimer
- Special issue statement
- Acknowledgements
- Financial support
- Review statement
- References
- Supplement
strongand
weakareas of crust. We find that faults become more developed in weak areas. Faults are initially stopped at the boundaries with stronger areas before eventually breaking through. We relate our model observations to rift systems globally.
- Abstract
- Introduction
- Numerical approach
- Exploring strength parameter space
- Strain accommodation through time (model 4)
- Discussion
- Conclusions
- Appendix A
- Appendix B
- Code availability
- Data availability
- Author contributions
- Competing interests
- Disclaimer
- Special issue statement
- Acknowledgements
- Financial support
- Review statement
- References
- Supplement