the Creative Commons Attribution 4.0 License.
the Creative Commons Attribution 4.0 License.
 | 15 Jan 2026
Deep crustal structure of the southern Baltic Sea in the light of seismic and potential field data
Małgorzata Ponikowska
Sergiy Stovba
Michał Malinowski
Quang Nguyen
Stanisław Mazur
The southern Baltic Sea lies within a critical transitional zone between two major geological provinces of Europe: the Precambrian East European Platform and the Palaeozoic Platform of Western Europe. While the shallow expression of this boundary is generally marked by the Caledonian deformation front, the deeper crustal configuration remains contentious due to thick Phanerozoic cover. This study integrates seismic interpretation with 2-D gravity and magnetic modelling to investigate the deep crustal architecture beneath the southern Baltic Sea. Four new seismic profiles (BGR16-256, BGR16-202, BGR16-257, BGR16-259), acquired during the BalTec (MSM52) expedition, were analysed alongside borehole and legacy seismic data. Seismic imaging reveals that the upper crust was primarily shaped by Permian–Mesozoic extension and Late Cretaceous inversion. Extensional basins such as the Mid-Polish Trough and Rønne Graben accumulated up to 4 km of sediments, later uplifted and folded during inversion, which caused displacements of 1.5–2 km and produced asymmetrical marginal troughs with NE-directed compressional vergence. The gravity and magnetic models, constrained by seismic horizons, enable imaging of deeper crustal levels including the top of the lower crust and the Moho, which lies between 38 and 42 km depth. These data reveal that thick Baltica-type crust extends south-westward beyond the Teisseyre-Tornquist Zone, contradicting interpretations that propose a sharp vertical lithospheric boundary along this zone. A key finding is the identification of a NE–SW-trending crustal lineament, likely inherited from Precambrian lithospheric fabric. Furthermore, evidence of pre-Triassic tilting and erosion of Silurian strata suggests a significant tectonic event, possibly related to early Carboniferous uplift. The combined data provide new insights into the complex tectonic evolution of the region, supporting a model of Baltica crustal affinity beneath the southern Baltic Sea and emphasising the interplay of inherited Precambrian structures, Permian-Mesozoic extension, and Late Cretaceous inversion.
- Article
(21862 KB) - Full-text XML
-
Supplement
(2468 KB) - BibTeX
- EndNote


The southern Baltic Sea occupies a key position within the transition zone between two major geological domains of Europe: the Precambrian Platform of Eastern Europe to the northeast and the Palaeozoic Platform to the southwest (Berthelsen, 1992; Pharaoh, 1999). The Precambrian Platform corresponds to the ancient Baltica paleocontinent, whereas the Palaeozoic Platform in NW Europe is underlain by the Caledonian orogenic belt and the Avalonian terrane (Torsvik and Rehnström, 2003; Cocks and Fortey, 2009). The near-surface boundary between these domains is typically marked by the Caledonian deformation front beneath the upper Palaeozoic (Fig. 1). However, the extent and configuration of Baltica and Avalonia crustal blocks in the deeper basement remain a subject of ongoing debate (e.g., Franke, 1995; Tanner and Meissner, 1996; Berthelsen, 1998; Bayer et al., 2002; Dadlez et al., 2005; Mazur et al., 2015, 2026). This uncertainty arises primarily because the boundary zone is deeply buried beneath thick Phanerozoic sediments, and knowledge of the deep crustal architecture relies largely on geophysical and borehole data.

Figure 1Seismic profiles and main structural elements in the transition zone from the East European Platform (EEC) to West European Platform (WEP) at the background of the bathymetry map. The blue lines are the locations of the BGR16-256, BGR16-202, BGR16-259, BGR16-257 profiles, and the black lines show the profiles described by Ponikowska et al. (2024). The zone of Late Cretaceous – early Paleogene inversion and the Sorgenfrei-Tornquist Zone (STZ) and Teisseyre-Tornquist Zone (TTZ) are shown after Ponikowska et al. (2024). MPA, Mid-Polish Anticlinorium.
Several earlier studies proposed pronounced Moho depth variations across the southern Baltic Sea, with a markedly shallower Moho southwest of Bornholm (e.g., Bleibinhaus et al., 1999; Meissner and Krawczyk, 1999; Krawczyk et al., 2002). However, recent research by Ponikowska et al. (2024) has shed new light on the crustal structure of the region through the interpretation of three long seismic profiles: PQ2-002, PQ2-004-005, and BGR16-212. These profiles revealed that thick cratonic crust (38–42 km), characteristic of Baltica, extends south-westward to the vicinity of Rügen and Usedom (Fig. 1). Their study also highlighted both the thin-skinned tectonics of the Caledonian thrust-and-fold belt and the thick-skinned deformation related to Late Cretaceous inversion. However, the limited spatial coverage and resolution of these sparsely spaced 2-D seismic lines constrained the ability to resolve finer-scale features of the crustal framework.
To address this gap, the current study presents interpretations of four additional seismic profiles – BGR16-256, BGR16-202, BGR16-259, and BGR16-257 – acquired during the 2016 BalTec (MSM52) expedition. These profiles, oriented NE–SW and NW–SE (Fig. 1), cross key tectonic structures within the southern Baltic Sea. Although the seismic data provide high-resolution imaging of the upper crust to depths of approximately 10 km, they do not capture the deeper crustal levels. To overcome this limitation, 2-D forward models of gravity and magnetic data were developed based on the seismic profiles. These models enabled interpretation of the deeper crustal structure, including the top of the lower crust and the Moho discontinuity – both located beneath the reach of seismic imaging. The depths to the Moho and the lower crust were constrained through intersections with neighbouring seismic lines (Janik et al., 2022; Ponikowska et al., 2024). The geometry for the profile BGR16-202 is also guided by previously interpreted Moho depths published by Maystrenko and Scheck-Wenderoth (2013).
Seismic interpretations provided the framework for potential field models and formed the basis for gravity inversion to map the Moho depth across the southern Baltic Sea. A parallel approach, supplemented with borehole data, was applied to derive a detailed depth-to-basement map, extending over a slightly broader area where well data provide additional constraints. This integrated methodology yielded crustal models with an order-of-magnitude improvement in spatial resolution compared to previous studies (e.g., Krawczyk et al., 2002; Maystrenko and Scheck-Wenderoth, 2013; Mazur et al., 2021).
Our results confirm the main conclusions of Ponikowska et al. (2024), including the substantial crustal thickness beneath the southern Baltic Sea and the southwestward extent of Baltica's crystalline crust. However, the present analysis provides new evidence for preserved features of the Baltica Precambrian crust, which have been modified by successive extensional phases and overprinted by Late Cretaceous inversion tectonics.
The southern Baltic Sea spans the boundary between two major geological domains: the East European Precambrian Platform to the northeast and the Palaeozoic Platform of Western Europe to the southwest (Fig. 1). The former, corresponding to the Baltica paleocontinent, comprises the East European Craton (EEC) basement overlain by a relatively undeformed Proterozoic–Phanerozoic sedimentary cover. In contrast, the latter, considered as part of Avalonia, comprises an early Palaeozoic, non- to low-grade metamorphic basement representing the North German-Polish Caledonides and a thick Devonian – Cenozoic sedimentary sequence (e.g., Berthelsen, 1992; Pharaoh, 1999).
A key point of debate is whether the northeastern portion of the Palaeozoic Platform is underlain by a thinned margin of the EEC (e.g., Berthelsen, 1992, 1998; Tanner and Meissner, 1996; Pharaoh, 1999; Lassen et al., 2001; Bayer et al., 2002; Krawczyk et al., 2002; Mazur et al., 2015, 2016a, b; Ponikowska et al., 2024), or if the EEC is abruptly truncated along the Teisseyre–Tornquist Zone (TTZ) (e.g., Franke, 1995; Dadlez et al., 2005; Narkiewicz et al., 2015). This uncertainty arises because the suture between Baltica and East Avalonia is concealed beneath thick Palaeozoic–Cenozoic sediments and remains poorly resolved in seismic data. Nevertheless, many studies suggest that the Precambrian crust of Baltica extends south-eastward beneath the North German-Polish Caledonides and the NE German Basin (e.g., DEKORP-BASIN Research Group, 1999; Gossler et al., 1999; Krawczyk et al., 1999), potentially reaching as far as the Elbe Lineament (e.g., Berthelsen, 1992; Tanner and Meissner, 1996; Bayer et al., 2002; Mazur et al., 2015, 2016b; Smit et al., 2016). This is consistent with recent seismological discoveries that the Scandinavian Mid-Lithospheric Discontinuity extends southward beneath the Caledonides and Variscides, reaching as far as the Bohemian Massif (Kind et al., 2025).
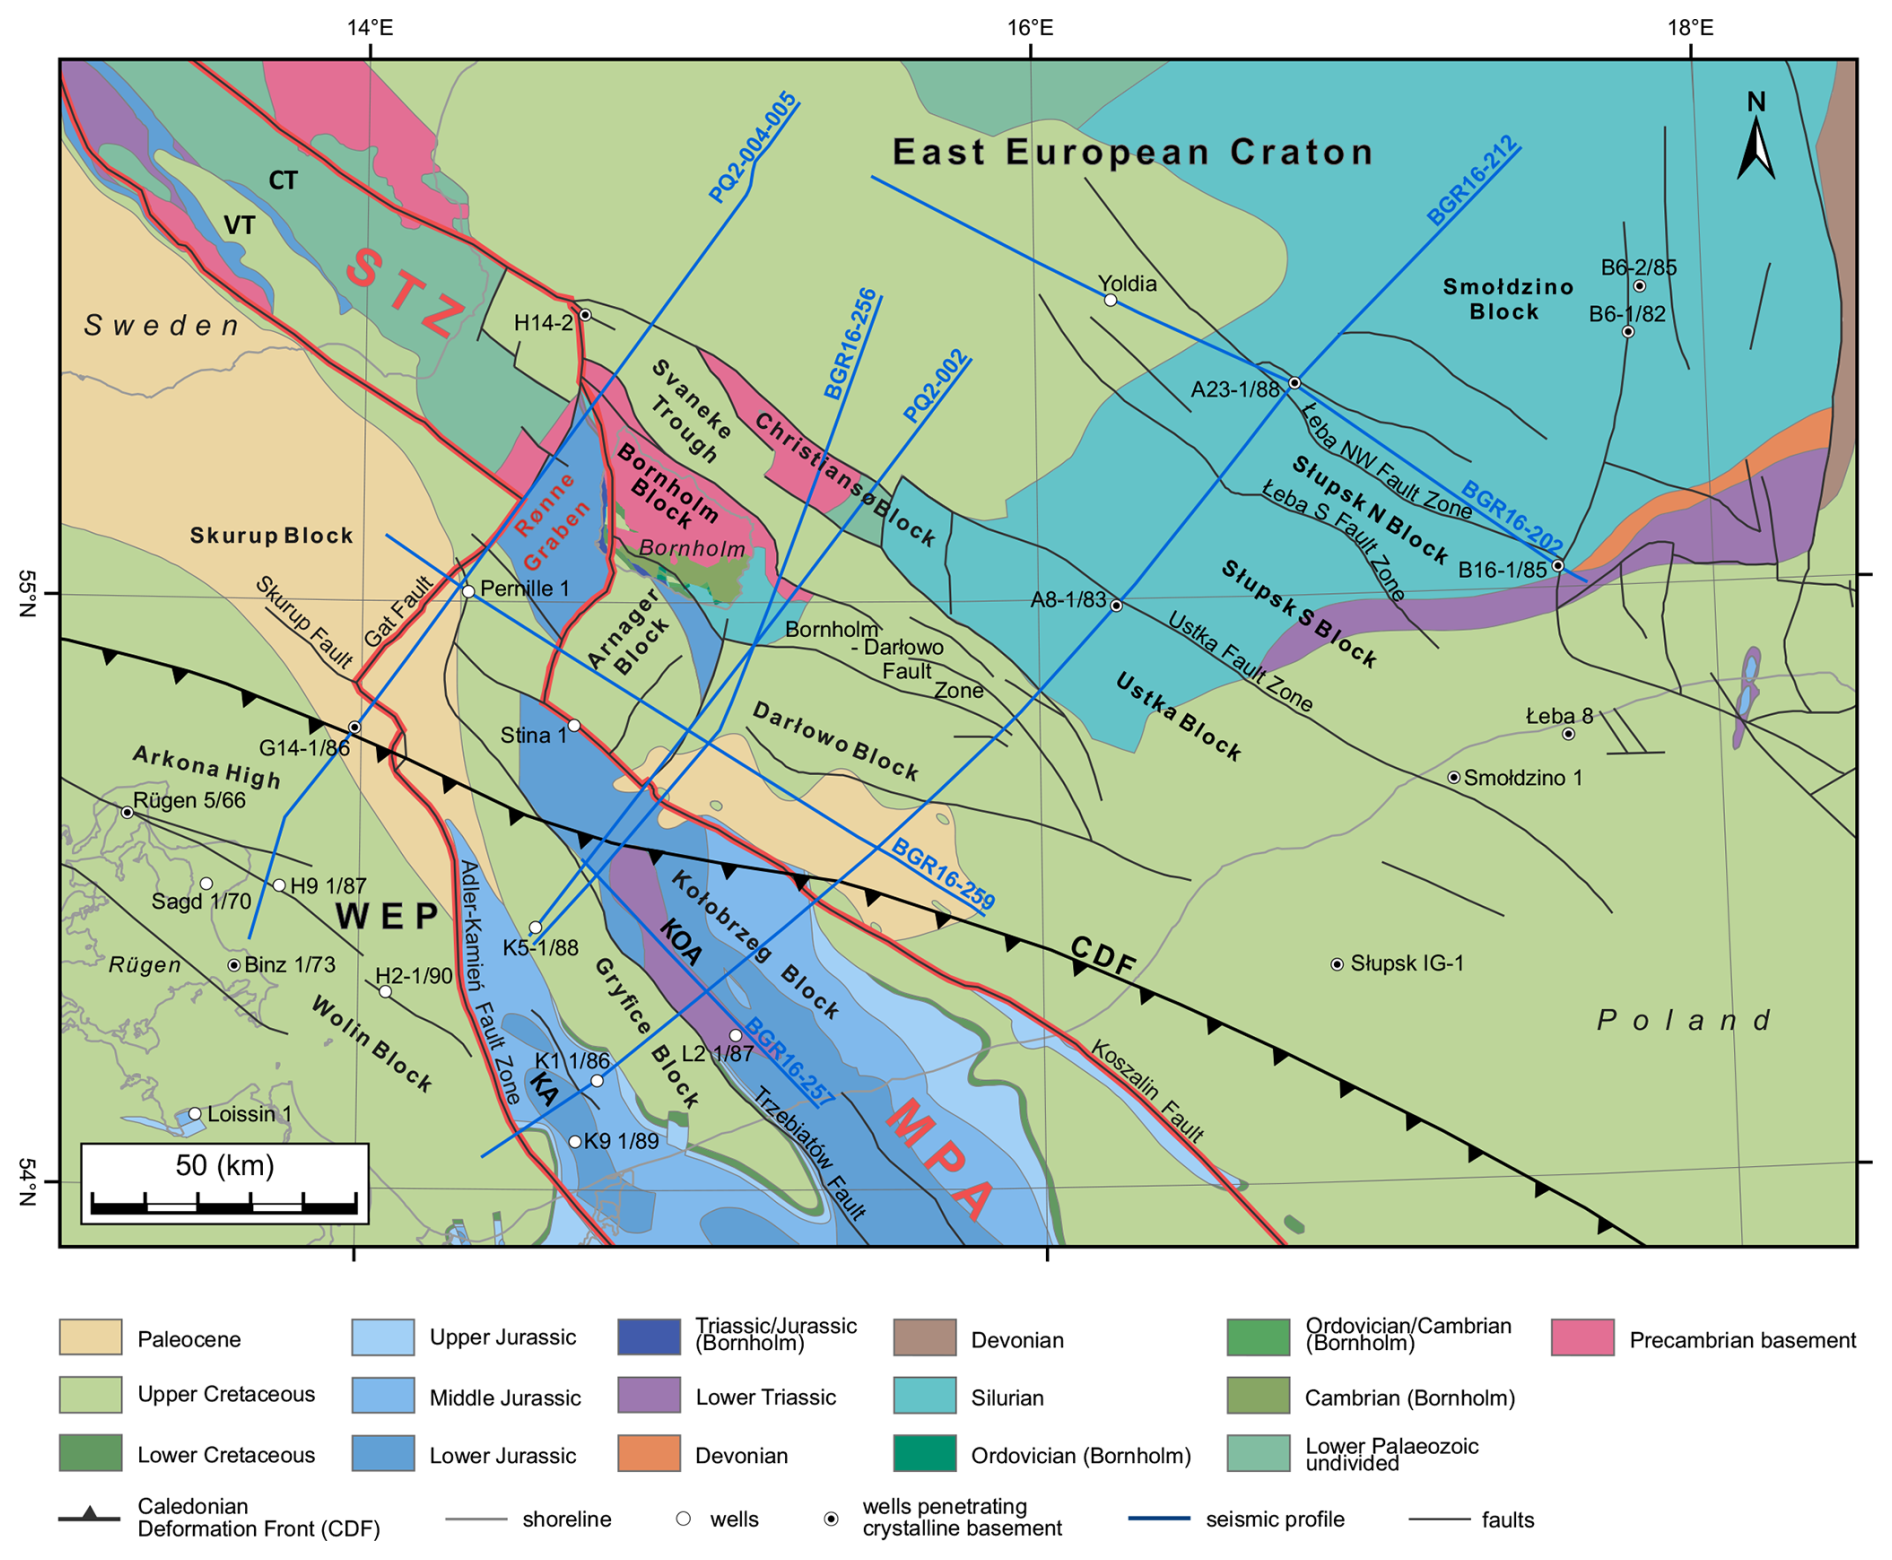
Figure 2Geological map of the southern Baltic Sea without post-Paleocene sediments after Kramarska et al. (1999), Schlüter et al. (1997), and Sopher et al. (2016) and Pre-Quaternary map of Bornholm (Hansen and Poulsen, 1977). Position of main faults and tectonic blocks are modified from Kramarska et al. (1999), Krzywiec et al. (2003), Jaworowski et al. (2010), Pokorski (2010), Seidel et al. (2018) and Ponikowska et al. (2024). Permian-Triassic depocentres are outlined in red. Abbreviations: CDF, Caledonian Deformation Front; CT, Colonus Trough; KA, Kamień Anticline; KOA, Kołobrzeg Anticline; MPA, Mid-Polish Anticlinorium; STZ, Sorgenfrei-Tornquist Zone; VT, Vomb Trough; WEP, West European Platform.
Dadlez et al. (2005) challenged this view, proposing instead that the TTZ marks a strike-slip suture developed along a transverse Baltica margin, where adjacent terranes were accreted during the Ordovician–early Silurian. However, this model does not account for the divergence between the TTZ and the Caledonian Deformation Front (CDF) in the southern Baltic Sea (Fig. 2), nor does it explain the apparent linkage between the TTZ and the Sorgenfrei–Tornquist Zone (STZ) near Bornholm, the latter being widely regarded as an intracratonic structure. Moreover, this strike-slip model is inconsistent with the thin-skinned style of the Caledonian fold-and-thrust belt observed onshore in NW Poland (Mazur et al., 2016b). Due to these contrasting interpretations, the southern Baltic Sea is a key area for resolving the nature of the TTZ and its relationships with the STZ and the Caledonian orogen.
The region is characterized by a mosaic of tectonic blocks delineated by numerous fault zones formed throughout the Phanerozoic (Fig. 2; Liboriussen et al., 1987; Berthelsen, 1992; Vejbæk et al., 1994; Pharaoh, 1999; Thybo, 2000; van Wees et al., 2000). The area is often considered part of the Trans-European Suture Zone (TESZ; Berthelsen, 1992; Pharaoh, 1999). Major, deep-seated faults (Fig. 2) controlled the subsidence and uplift of crustal blocks during several tectonic phases spanning the Palaeozoic, Mesozoic, and locally the Cenozoic (Dadlez, 1993; Erlström et al., 1997; Krzywiec et al., 2003; Al Hseinat and Hübscher, 2017). The most prominent tectonic features are the NW–SE-trending STZ and TTZ, which cross the southern Baltic Sea north and south of Bornholm, respectively (Figs. 1, 2).
The STZ is a major lithospheric boundary separating the Danish Basin from the Baltic Shield (Fig. 1), marked by a pronounced increase in lithospheric thickness from SW to NE (Babuška and Plomerová, 2004; Hansen et al., 2000) and a stepwise increase in Moho depth from 30–32 km beneath the Danish Basin to 35–48 km under the Baltic Shield (e.g., Thybo, 2001; Cotte et al., 2002). The TTZ is the longest tectonic and geophysical lineament in Europe, extending from the Baltic to the Black Sea (Fig. 1; Pharaoh, 1999). It delineates the transition from the thick crust of the EEC (Moho at 42–49 km) to the thinner crust of the Palaeozoic Platform (Moho at 31–38 km) (Guterch and Grad, 2006; Guterch et al., 2010; Mazur et al., 2021). This crustal step is associated with a SW-ward descent of the Precambrian basement by ∼ 10–12 km beneath thick Palaeozoic–Mesozoic sediments (Mazur et al., 2015, 2021; Grad and Polkowski, 2016; Mikołajczak et al., 2019). Lithospheric mantle thinning occurs across a broader region between the TTZ and the margin of the Bohemian Massif (Shomali et al., 2006; Janutyte et al., 2015; Knapmeyer-Endrun et al., 2017; Mazur et al., 2026).
Recent interpretations suggest the TTZ may represent a necking zone formed during the Ediacaran breakup of Rodinia and related passive margin development along Baltica (Mazur et al., 2016a, 2021; Mikołajczak et al., 2019). Alternatively, early Permian rifting may have contributed to crustal thinning (Mazur et al., 2021; Jóźwiak et al., 2022), consistent with Berthelsen (1998)'s interpretation of the TTZ as a Wernicke-style rift (Wernicke, 1985).
A crustal keel beneath the TTZ has been inferred in NW and central Poland through potential field modelling and PolandSPAN seismic data (Mazur et al., 2015, 2016b). In central Poland, the TTZ is overlain by undisturbed lower Palaeozoic strata, suggesting the keel is not of Caledonian origin. PolandSPAN™ profiles also show a smooth, westward-plunging basement surface, inconsistent with a Phanerozoic suture (Mazur et al., 2015, 2016a). In the southern Baltic Sea, BABEL profile A revealed a keel beneath the STZ (BABEL Working Group, 1991, 1993; Thybo et al., 1994), and similar deepening was observed along TTZ'92/II (Makris and Wang, 1994). These keels were attributed to Late Cretaceous–early Cenozoic inversion tectonics (e.g., BABEL Working Group, 1993), with the keel beneath the STZ interpreted as a subversion zone – a deep-crustal analogue to inversion structures. Another hypothesis attributes the crustal thickening to late Carboniferous–early Permian underplating (Thybo, 2000). However, subsequent seismic studies (e.g., PQ2, BalTec WARR) did not image these keels (Krawczyk et al., 2002; Janik et al., 2022), prompting renewed potential field modelling along PQ2 and reanalysis of BGR16-212 (BalTec) profiles.
In the Ediacaran, a broad sandy shelf covered SW Scandinavia, with sandstones overlying Precambrian basement (Erlström et al., 1997), and a < 100 m thick sequence of middle Cambrian to Early Ordovician bituminous alum shales (the “O-horizon”; Krawczyk et al., 2002). In the southwestern Baltic Sea, the north-vergent Caledonian deformation front thrusts Ordovician sediments over the EEC basement and its cover (e.g., Berthelsen, 1992; Katzung et al., 1993; Dallmeyer et al., 1999). It bends south-eastward toward the TTZ along a NW–SW trend (Fig. 1) and subcrops onshore in northern Poland (Dadlez et al., 1994). In this area, Ordovician–Silurian rocks are tightly refolded (Modliński and Podhalańska, 2010). A foreland basin developed in front of the advancing orogen during the Late Ordovician–Silurian, onlapping the EEC slope and accumulating up to 5000 m of siliciclastic sediments (Erlström et al., 1997; Poprawa et al., 1999; Mazur et al., 2018).
During the Devonian–Carboniferous, the region experienced widespread extension (Smit et al., 2018), and a system of half-grabens formed due to reactivated Caledonian thrusts (Piske et al., 1994; Lassen et al., 2001; Krzywiec et al., 2022). Uplift and erosion during the latest Carboniferous–early Permian left a widespread base-Permian unconformity, a key seismic marker (Vejbæk et al., 1994). Subsequent Permian–Mesozoic sedimentation established a link between the Danish Basin and the Mid-Polish Trough (MPT; Krawczyk et al., 2002; Maystrenko et al., 2008). This basin system was inverted during the Late Cretaceous–early Paleogene, driven by far-field effects of Alpine convergence (EUGENO-S Working Group, 1988; Erlström et al., 1997; Pan et al., 2022) and North Atlantic ridge push (Mogensen, 1994; Stephenson et al., 2020).
Inversion structures in Poland focus along the NW–SE Mid-Polish Anticlinorium (MPA, Fig. 1), formed by inversion of the MPT (Krzywiec, 2002), and extending offshore between the Koszalin and Adler–Kamień Fault Zones, where it splits into the Kamień and Kołobrzeg anticlines (Fig. 2). Farther north, the inversion axis bends NE into the Rønne Graben and toward the STZ (Fig. 2). The Rønne Graben originated as a late Carboniferous–early Permian strike-slip basin, subsided during the Mesozoic, and was later inverted (Liboriussen et al., 1987; Graversen, 2004). Farther northeast, inversion along the STZ produced pop-up structures and crustal exhumation, with simultaneous subsidence in adjacent troughs (Pan et al., 2022).
Ponikowska et al. (2024) demonstrated that the southern Baltic Sea is underlain by thick continental crust associated with the East European Craton (EEC), with Moho depths ranging between 38 and 42 km, gradually shallowing toward the southeast. All observed deep seismic reflectors are interpreted as representing a reflective lower crust. Accordingly, reflectors previously interpreted as sub-Moho structures are more likely to belong to the lower crust. These authors argue that present-day crustal architecture has been primarily shaped by three major extensional phases: during the early Palaeozoic, the Devonian–Carboniferous, and the Permian–Mesozoic. Each phase contributed to localized crustal thinning and the formation of sedimentary basins. The only Phanerozoic compressional event that affected the entire crust in this region was the Late Cretaceous to early Paleogene inversion, driven by far-field stresses associated with the Africa–Iberia continental collision. This inversion was largely confined to an 80–90 km wide zone that reactivated pre-existing crustal weaknesses, including the Vomb and Colonus Troughs north of Bornholm (Sorgenfrei–Tornquist Zone, STZ) and the Mid-Polish Trough (MPT) farther south. Inversion structures comprise systems of thrusts and backthrusts that penetrate the full crustal thickness, forming a crustal-scale pop-up structure.
In this study, we interpret four offshore seismic reflection profiles acquired during the BalTec project (MSM52 expedition) conducted by the German research vessel Maria S. Merian in 2016 (Hübscher et al., 2017). Three of the profiles – BGR16-202, BGR16-259, and BGR16-257 – are oriented NW–SE and run subparallel to each other. Profiles BGR16-257 and BGR16-259 are located west of the island of Bornholm, while BGR16-202 lies to the east. The fourth profile, BGR16-256, trends SW–NE and is positioned south of Bornholm, intersecting the NW–SE-oriented lines and providing important structural cross-links within the study area.
Table 1Acquisition parameters for the BalTec seismic survey (MSM52 expedition).
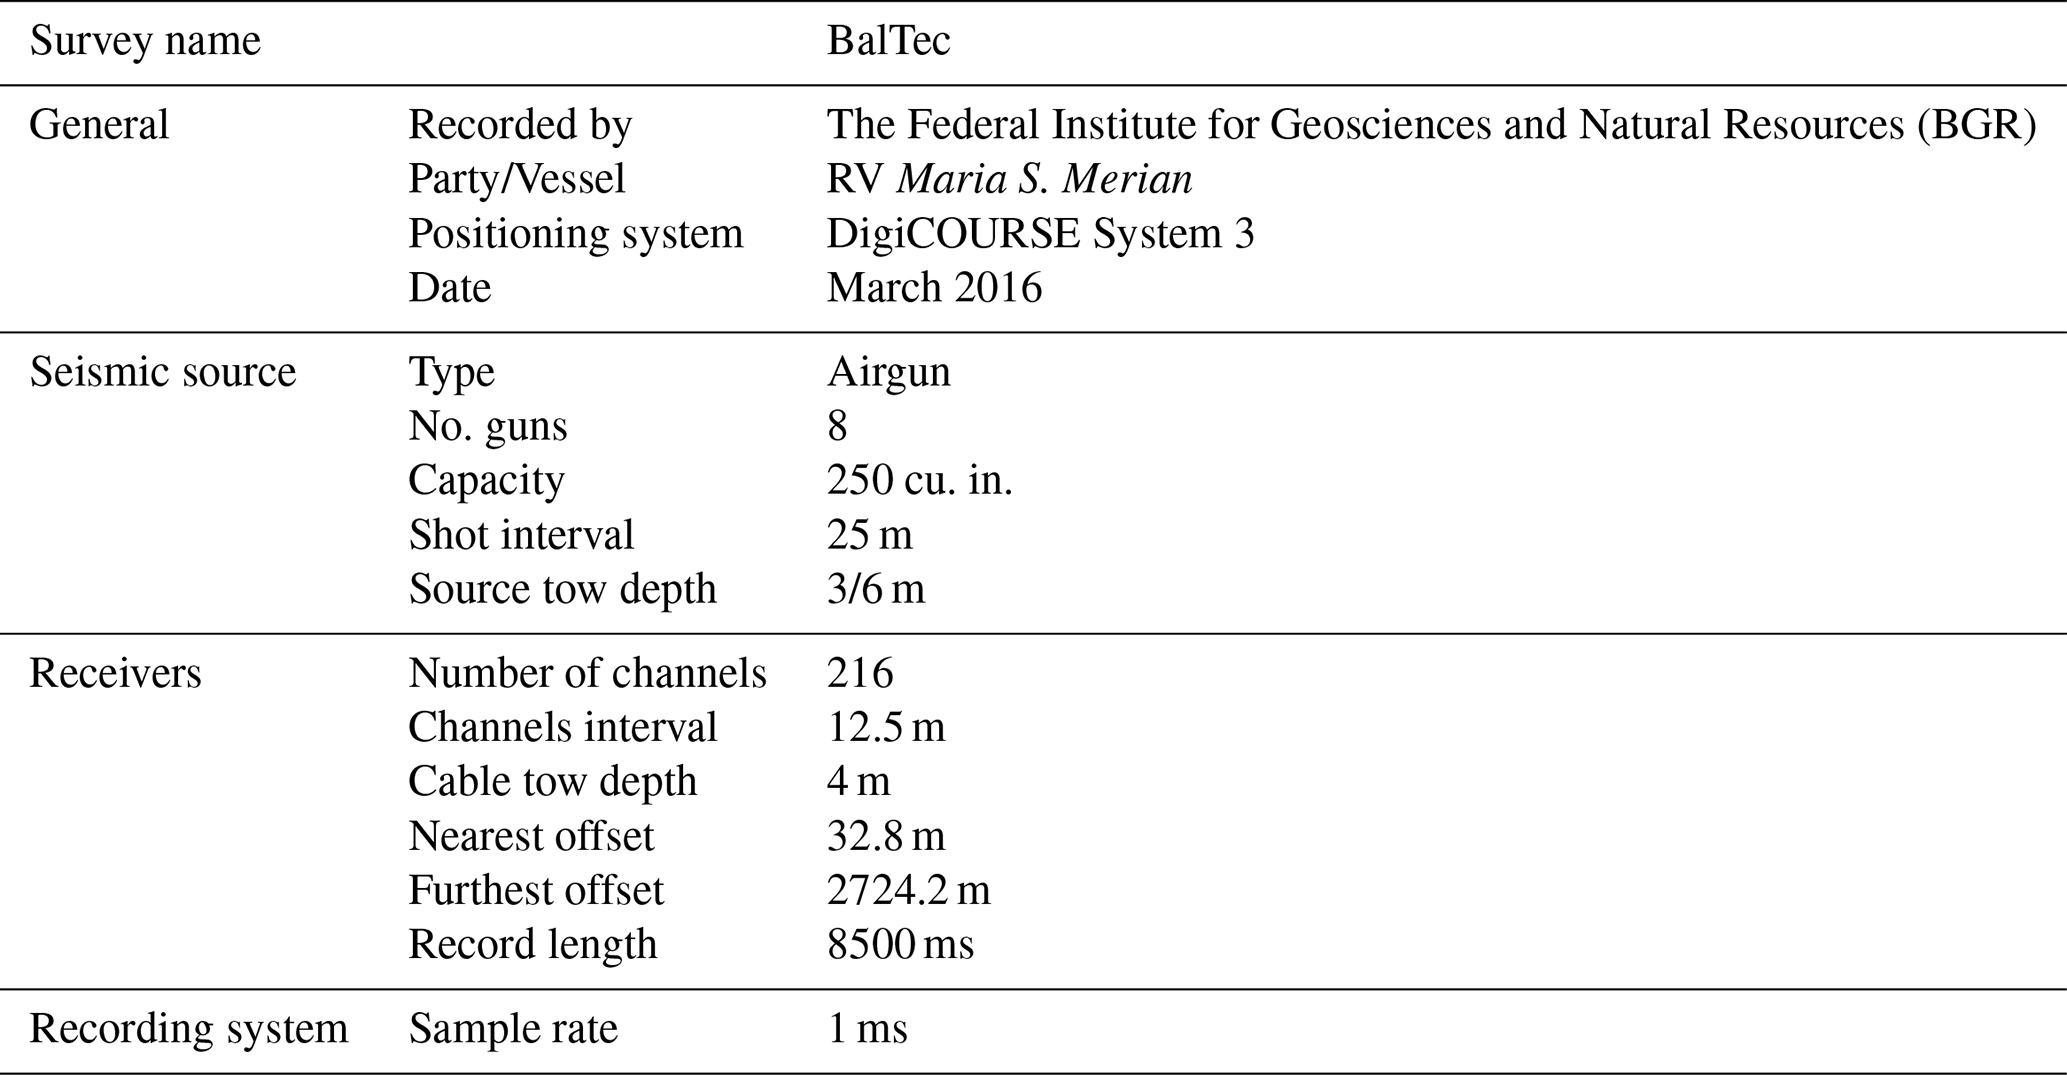
Thanks to optimized acquisition parameters (Table 1), the seismic data offer high-resolution imaging of the subsurface down to depths of approximately 10 km, enabling detailed interpretation of both sedimentary sequences and the underlying crystalline basement. Given the prevalence of multiple reflections in the shallow waters of the Baltic Sea, a dedicated demultiple processing workflow was applied to enhance data quality and produce final pre-stack time-migrated (PSTM) sections (Nguyen et al., 2024).
To support our interpretation, we incorporated recently published results by Ponikowska et al. (2024), including reprocessed data from profiles PQ2-004-005 and PQ2-002 of the DEKORP-BASIN'96 experiment (PQ2 dataset; DEKORP-BASIN Research Group, 1998), which image the crust down to the Moho, as well as profile BGR16-212 (Ponikowska et al. 2024), acquired during the MSM52 expedition (Fig. 1). Additional geological constraints were provided by well data from earlier studies (Erlström et al., 1997; Sopher et al., 2016; Schlüter et al., 1997) and from the Central Geological Database (2022), maintained by the Polish Geological Institute.
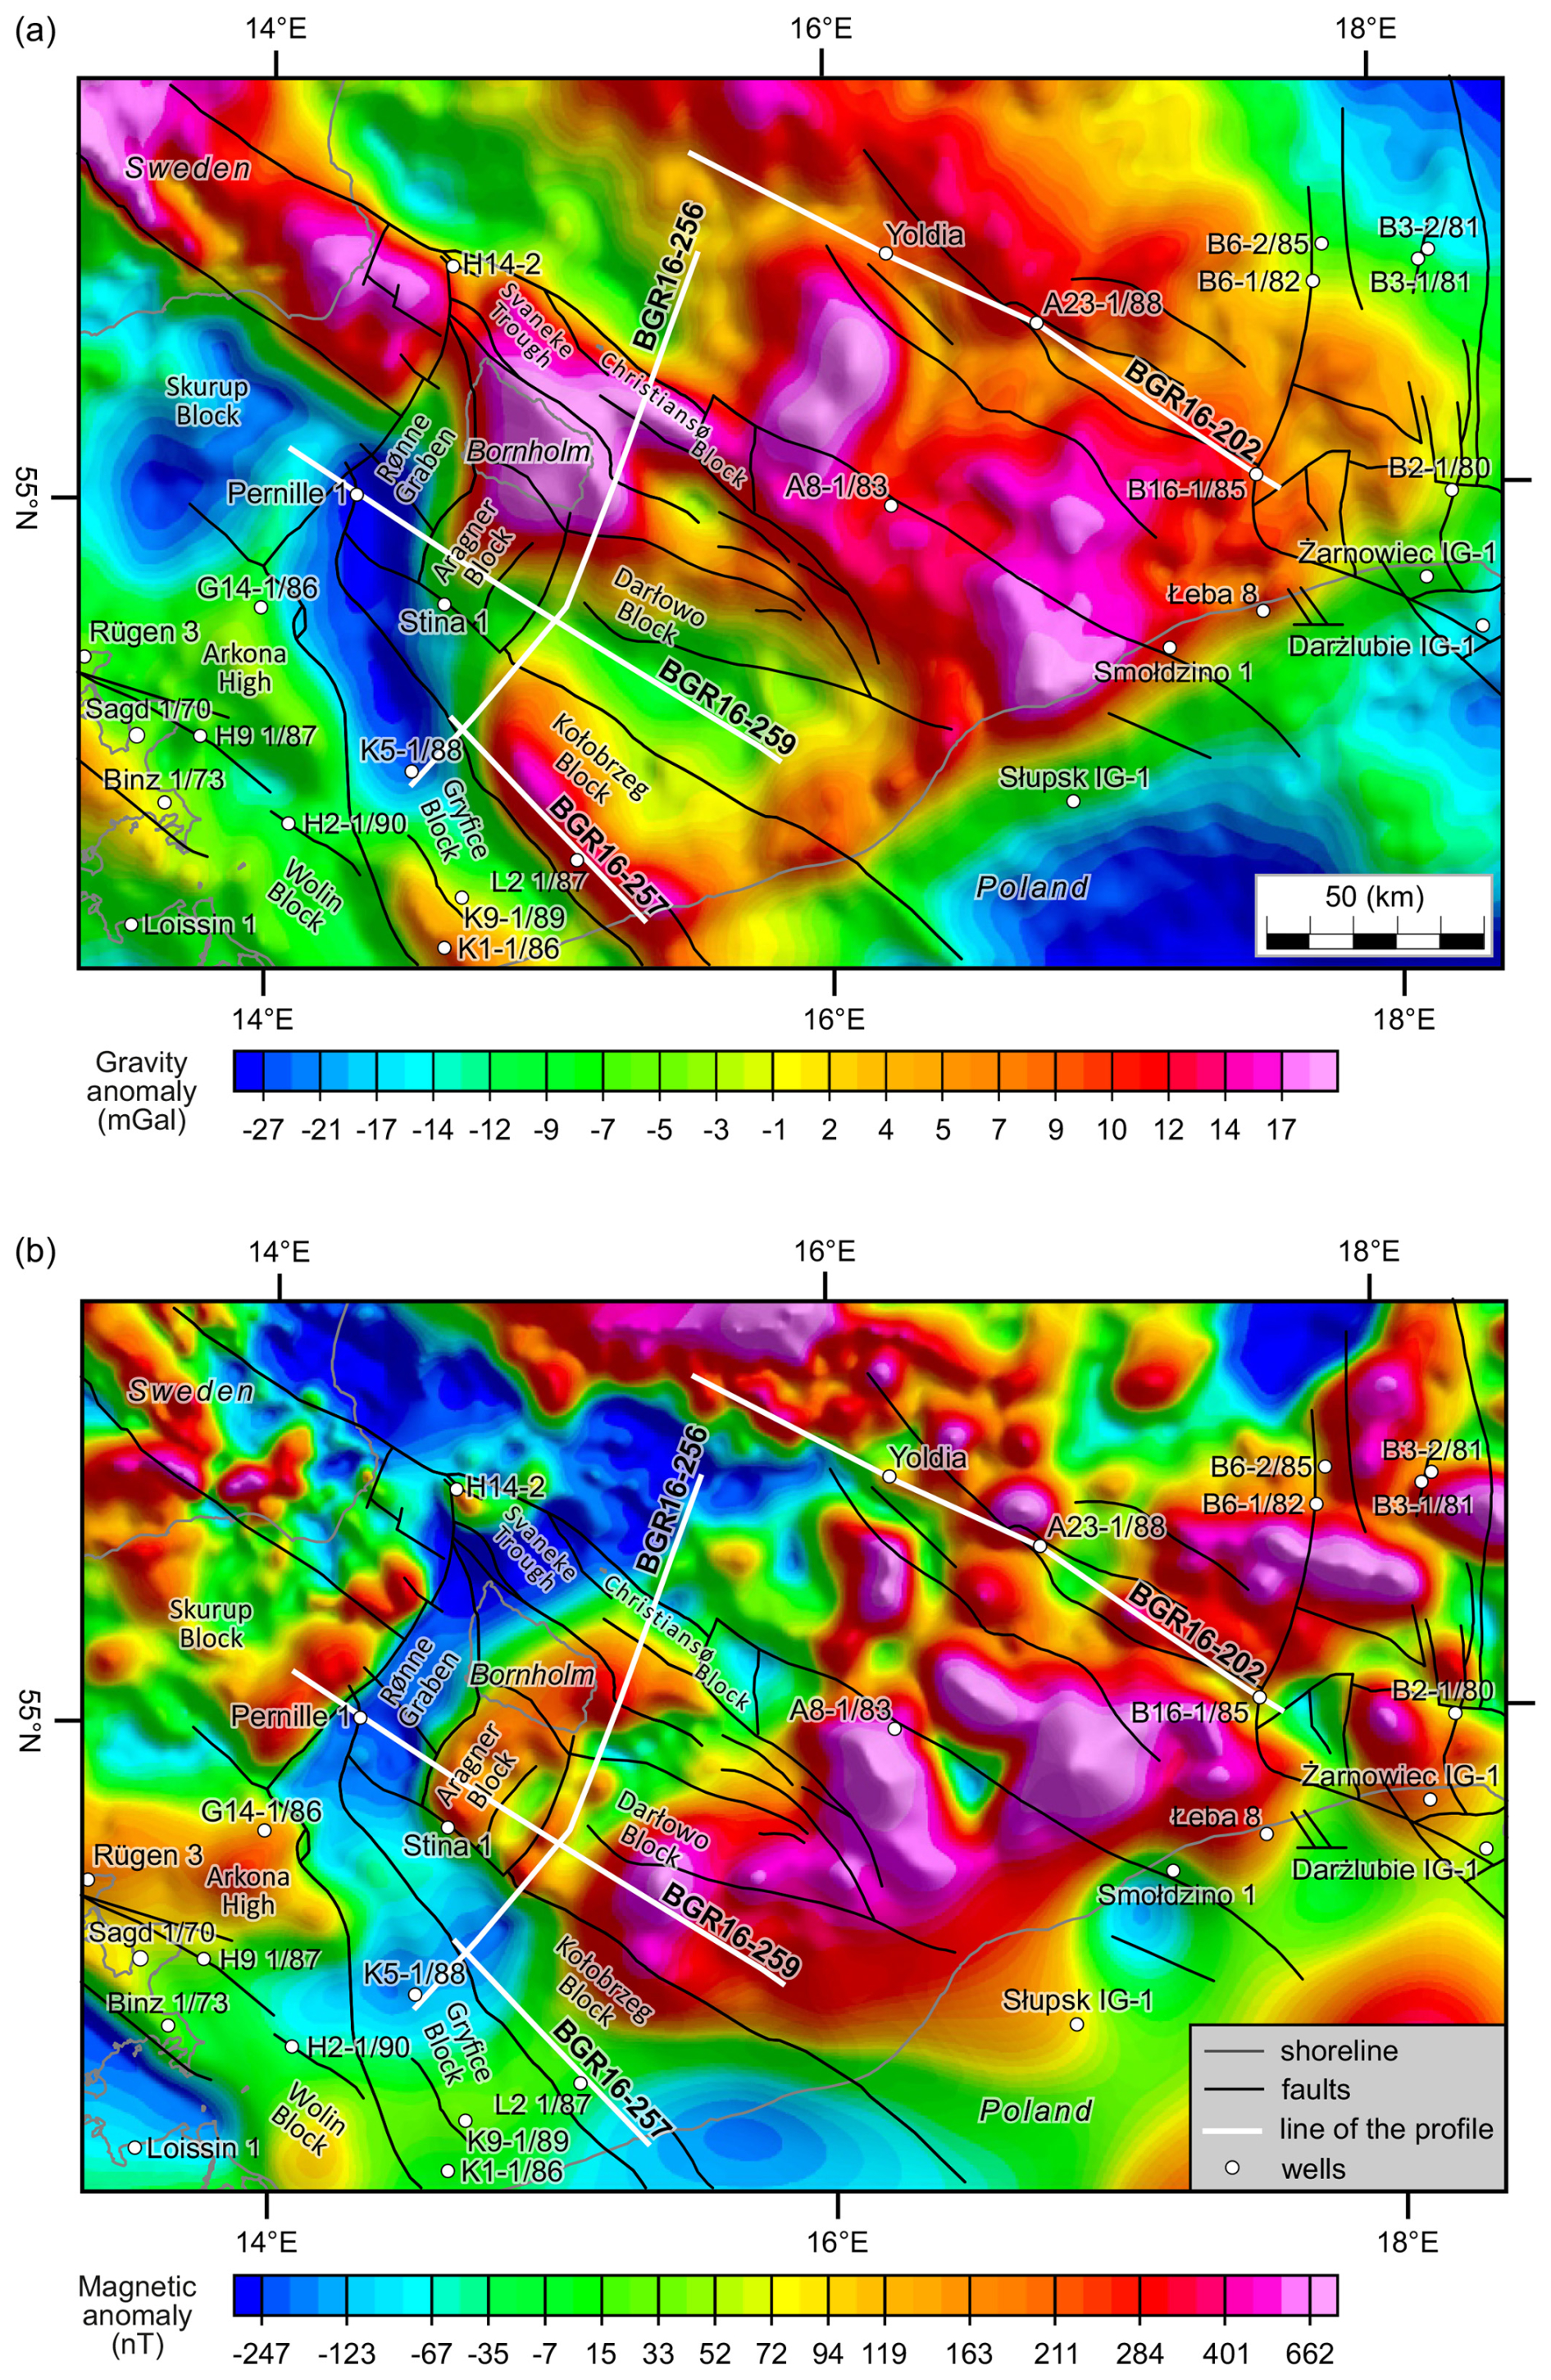
Figure 3Gravity and magnetic anomaly maps. Location of main faults and tectonic blocks (modified from Kramarska et al., 1999; Krzywiec et al., 2003; Jaworowski et al., 2010; Pokorski, 2010; Seidel et al., 2018; Ponikowska et al., 2024) overlaid on the Free Air gravity (a) and Reduced-to-Pole magnetic (b) anomaly maps. Position of the BGR16-256, BGR16-202, BGR16-259, and BGR16-257 profiles and boreholes are indicated.
Satellite-derived gravity and magnetic data for the southern Baltic Sea used in this study were obtained from Getech Group plc (Getech Group plc, 2024; https://getech.com/getech-explore/services-support/, last access: 12 June 2025) and provided in WGS 84 geographic coordinates. The original gravity dataset was gridded at a spatial resolution of 0.02° (approximately 2 km). For the purposes of this study, a regional gravity grid was compiled (Fig. 3a), combining offshore free-air gravity data with onshore Bouguer gravity anomalies. Bouguer corrections were applied using a standard rock density of 2.67 g cm−3.
The offshore magnetic dataset consists of marine Total Magnetic Intensity (TMI) measurements derived from Getech's Baltic Sea compilation (Fletcher et al., 2011). These data were gridded at a resolution of 0.01° (∼ 1 km) and referenced to a uniform elevation of 1 km above sea level. To enhance the interpretability of the magnetic anomalies, a reduction-to-the-pole (RTP) transformation was applied (Fig. 3b). This process reorients the magnetic field vector to vertical, effectively positioning magnetic anomalies directly above their sources and simplifying geological interpretation (MacLeod et al., 1993).
This study applies an integrated workflow that combines seismic, gravity, and magnetic data to resolve the crustal structure of the southern Baltic Sea. The seismic profiles image the sedimentary cover and the top of the crystalline basement, whereas the potential-field modelling constrains the top of the lower crust and the Moho. The seismic interpretations are first used to build 2-D/2.5-D forward models, which then provide key constraints for the subsequent regional gravity inversion.
4.1 2-D/2.5-D forward modelling
Gravity and magnetic forward modelling is a technique used to simulate the potential field responses generated by a defined or hypothesized geological model. To ensure the reliability of the results, the computed anomalies are compared with observed data, allowing iterative adjustments to refine the model. Final interpretations are based on achieving a close match between calculated and observed gravity and magnetic responses while maintaining consistency with plausible geological structures.
In this study, four 2-D/2.5-D forward models were constructed using the XField modelling package (ARK CLS Ltd., 2024), a plug-in for the OpendTect platform. XField applies the method developed by Talwani et al. (1959) to calculate gravity and magnetic anomalies based on assigned distributions of density and magnetic susceptibility. The modelling was conducted within a 3-D domain previously established in OpendTect, which included SEG-Y seismic data, interpreted seismic horizons, and well information.
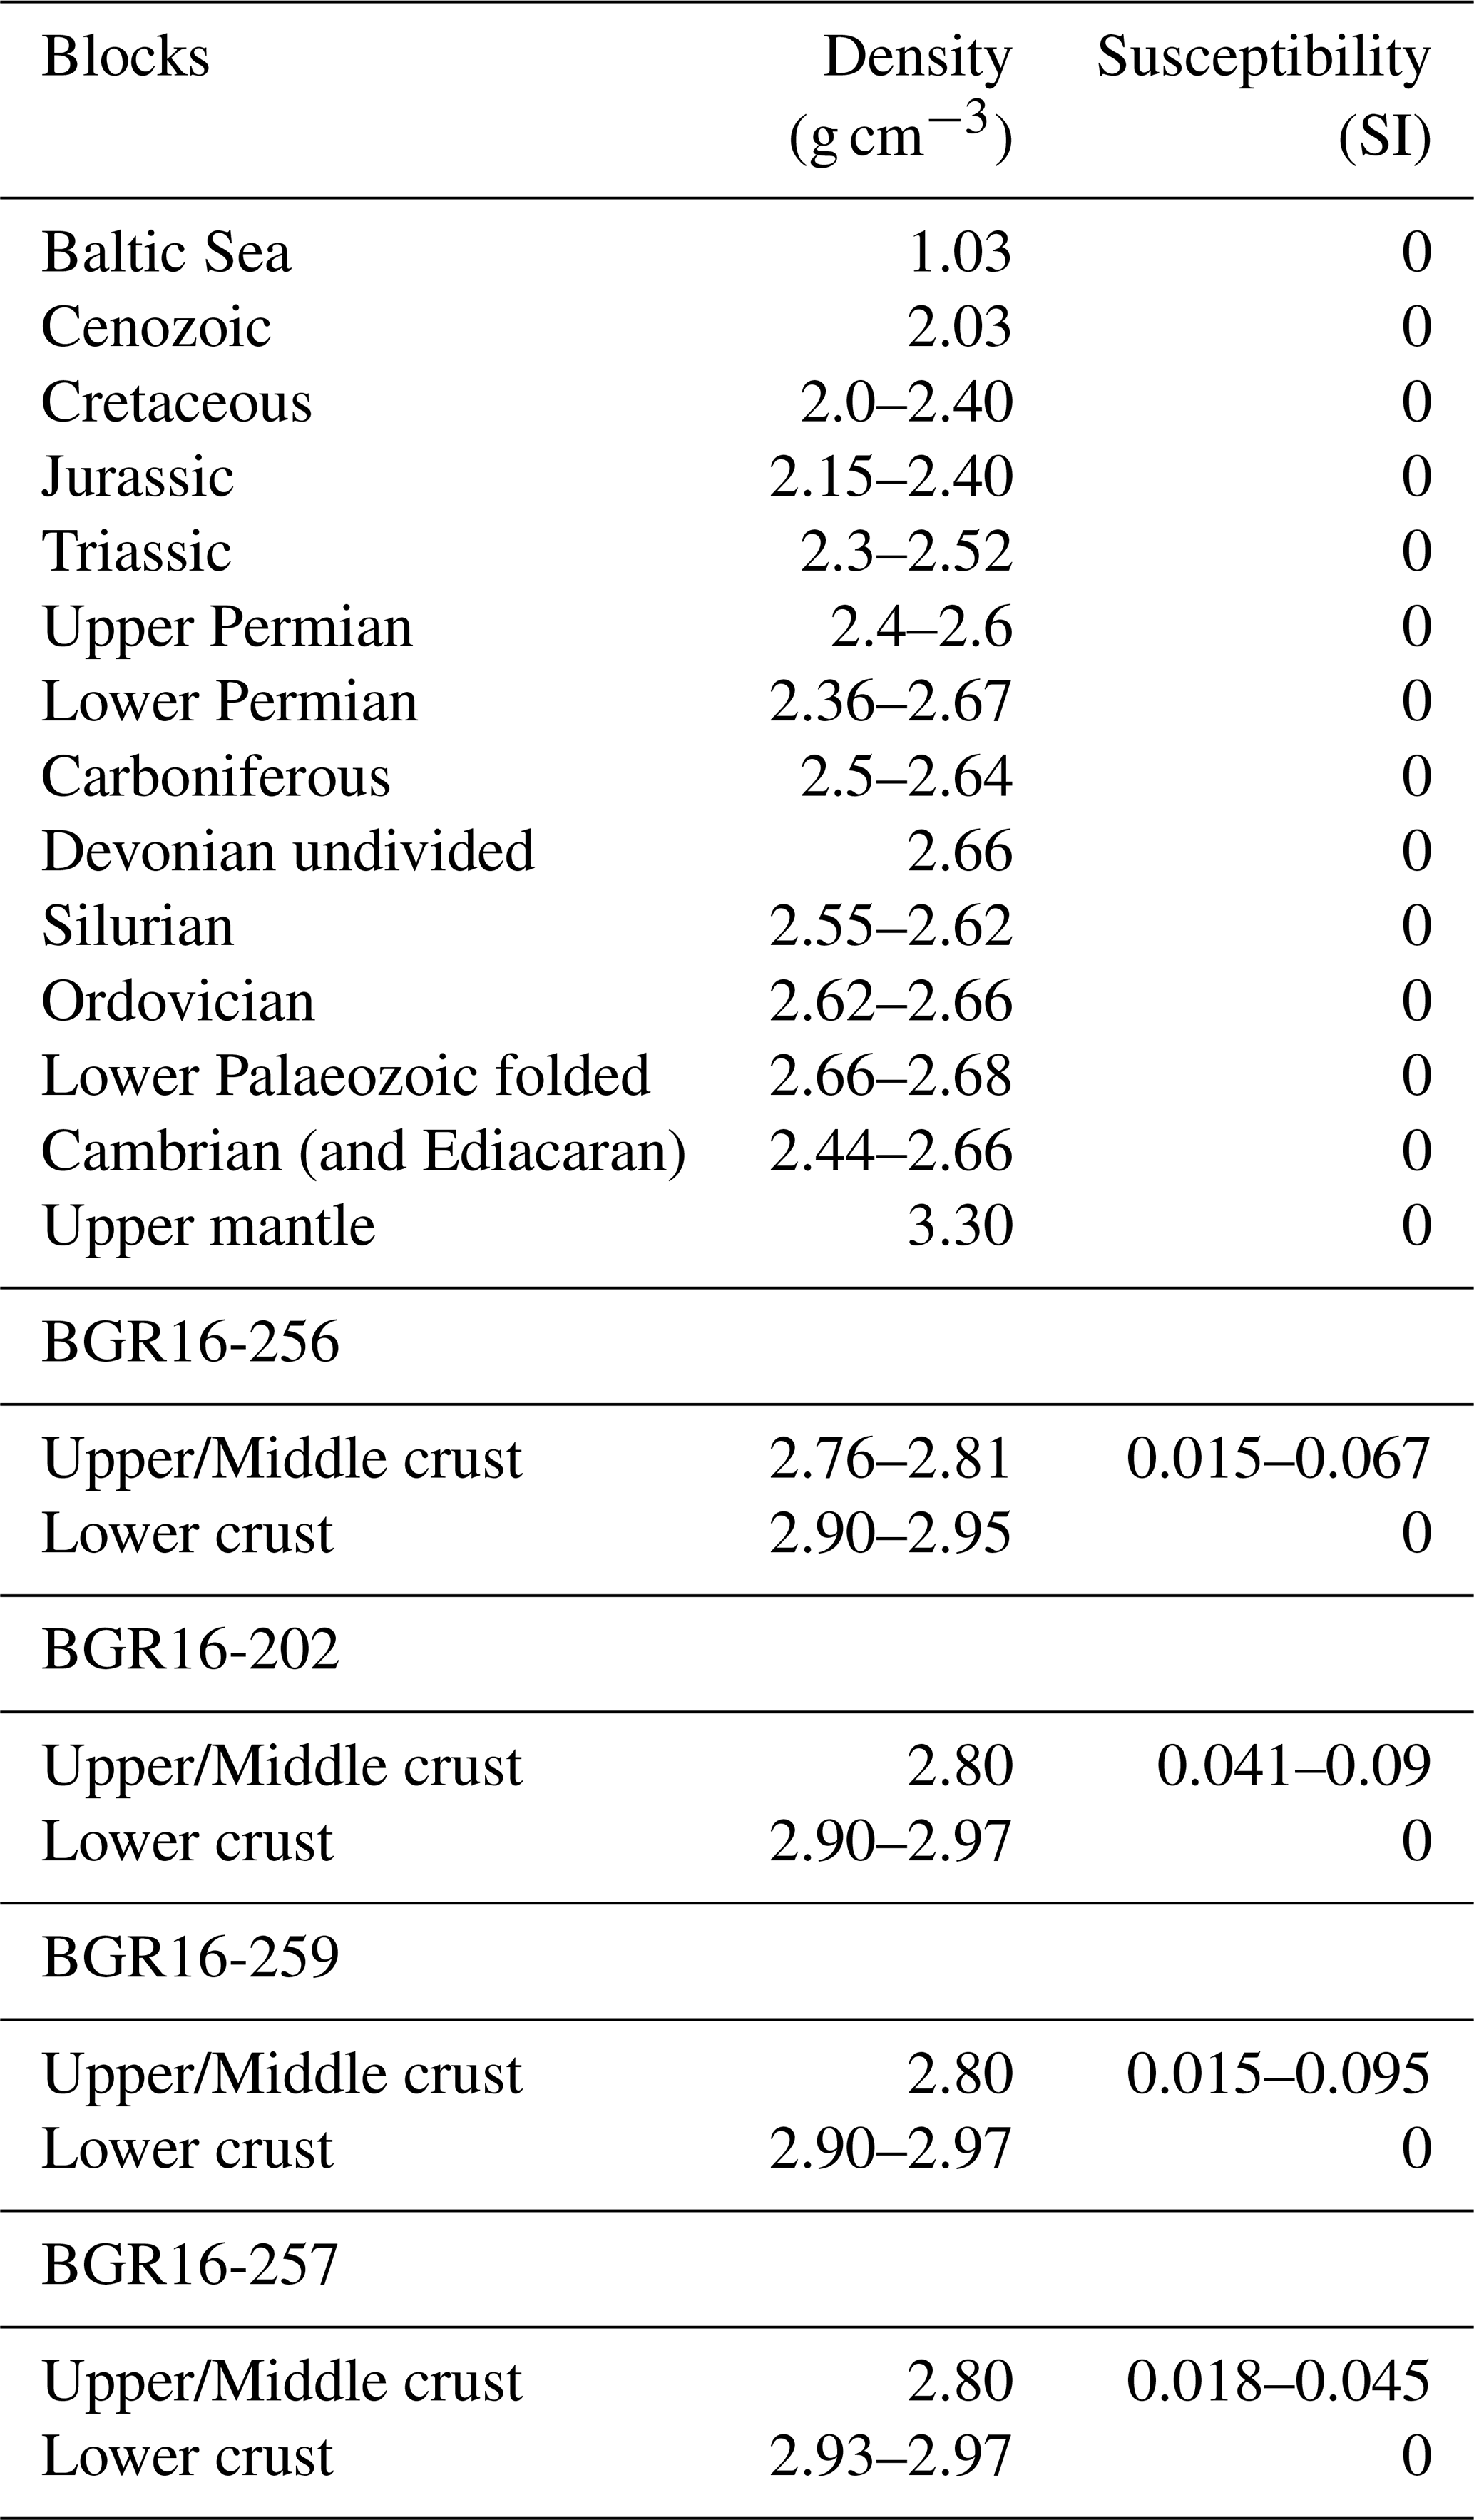
Models were generated along the seismic profiles and matched to gridded gravity and magnetic data sampled along the respective profile lines. XField enables interpreters to convert seismic horizons into geological bodies represented as polygons, each of which can be assigned physical properties such as average density, interval velocity, and magnetic susceptibility. Density values for the sedimentary layers (Table 2) were derived from borehole data located along or near the seismic profiles. For the crystalline crust, densities were calculated from seismic velocities using the Nafe-Drake empirical relationship (Ludwig et al., 1970; Brocher, 2005). Seismic velocities were primarily adopted from the BalTec refraction profile (Janik et al., 2022), which coincides with the BGR16-212 seismic reflection line. For the seismic reflection profiles, interval velocities corresponding to the relevant model units were used in the calculations. Initial magnetic susceptibility values for the basement were taken from earlier modelling studies (Ponikowska et al., 2024; Janik et al., 2022; Mazur et al., 2016b; Petecki, 2002; see Table 2).
Table 2Key for Density and Susceptibility Values Used in the Modeling of BalTec Profiles.
During modelling, the geometries of seismic horizons within the sedimentary cover – including the top of the basement – were kept unchanged. The key deeper-crustal interfaces considered were the top of the lower crust and the Moho. Because detailed constraints on lateral and vertical density variations are lacking, broad sedimentary and basement units were assigned simplified average density values. In contrast, magnetic susceptibility was treated with greater specificity: the basement was subdivided into blocks with subvertical boundaries to capture lateral heterogeneity. Magnetic data were given primary importance in constraining the geometry of the top of the lower crust. Both the Moho and the top of the lower crust were further constrained using intersections with deep seismic reflection profiles PQ2-002 and PQ2-004-005 (Ponikowska et al., 2024) and the BalTec refraction profile coincident with BGR16-212 (Janik et al., 2022). Our approach generally followed a “minimum-change” strategy, whereby modifications to the starting model were kept as limited as possible.
Modelling potential fields in 2-D or 2.5-D inherently involves certain limitations. Traditional 2-D modelling assumes homogeneity in the direction perpendicular to the cross-section, which oversimplifies the true geometry and spatial variation of physical rock properties. Additionally, potential field responses observed along a 2-D profile can be influenced by geological features located outside the plane of section, potentially leading to misinterpretation – especially in geologically complex regions. To address these challenges, 2.5-D modelling is employed. By allowing the model to have some length in the direction perpendicular to the 2-D profile, it provides a more realistic representation of geology compared to the infinite-extent assumption of a pure 2-D model. While maintaining a 2-D cross-sectional framework, this approach accounts for off-profile effects and the three-dimensional nature of gravity and magnetic field propagation.
A fundamental limitation of potential field modelling is its non-uniqueness: different configurations of model geometry, density, and magnetic susceptibility can produce similar anomaly patterns in terms of amplitude and wavelength. To constrain this ambiguity, the models in this study were constructed using interpreted seismic reflection horizons, which provide reliable structural control down to the basement. These were further integrated with borehole data and findings from previous studies (Janik et al., 2022; Ponikowska et al., 2024), enabling the development of models that more accurately represent the subsurface and reduce interpretational uncertainty typically associated with gravity and magnetic data.
4.2 Depth-to basement and depth-to-Moho modelling
Three-dimensional gravity inversions were conducted using a modified version of the iterative technique originally developed by Cordell and Henderson (1968). In this approach, the subsurface is represented by a grid of vertical rectangular prisms, and their gravitational effect is calculated at the surface. The inversion process iteratively adjusts the model by minimizing the misfit between the observed and calculated gravity anomalies.
All data processing and interpretation were carried out using the Oasis montaj software suite (Seequent, 2024). This platform supports variable density distributions, both laterally and vertically, across modelled geological interfaces. The density contrast across the Moho was set to an average value of 0.4 g cm−3, based on regional seismic refraction studies (Makris and Wang, 1994; Bleibinhaus et al., 1999; Janik et al., 2022). The initial depth-to-Moho model was constructed by combining Moho depths interpreted from this study's gravity and magnetic models with additional constraints from seismic profiles PQ2-002, PQ2-004-005, BGR16-212 (Janik et al., 2022; Ponikowska et al., 2024), PolandSPAN PL1-5600 (Mazur et al., 2016b) and BASIN9601 (Mazur et al., 2026). This starting model was forward-calculated to produce a theoretical gravity response grid. The resulting grid was subtracted from the observed Bouguer gravity field to isolate the residual anomaly, which was then inverted to refine the Moho interface. Throughout the inversion process, seismic constraints were retained to guide and validate the resulting Moho depth model.
A separate depth-to-basement model was developed based on crystalline basement depth estimates derived from seismic profiles and borehole data. This initial model was forward-calculated to generate a gravity response grid, assuming an average density contrast of 0.2 g cm−3 between the basement and the directly overlying sedimentary cover. The resulting synthetic gravity field was subtracted from the observed Bouguer gravity data to isolate the residual anomaly attributed to basement structure. To further enhance the sensitivity of the gravity data to basement morphology, long-wavelength anomalies associated with crustal thickness variations were removed using a minimum curvature adjustment. This correction was based on the previously derived Moho depth map and incorporated a topographic grid with a spatial resolution of 2 km. The resulting residual anomaly was subsequently inverted to derive the depth-to-basement interface.
Crustal thickness was subsequently calculated by subtracting the depth-to-basement model from the Moho depth grid.
The newly derived grids of top of crystalline basement, Moho depth and crustal thickness are available as text files in the Supplement (S2–S4).
This section begins with the interpretation of four seismic reflection profiles crossing the southern Baltic Sea (Fig. 2), which provide key insights into the crustal structure and form the basis for further geophysical analysis. Based on these interpretations, we present 2-D gravity and magnetic forward models designed to constrain the geometry of deep crustal horizons that extend below the depth of seismic imaging. The section concludes with the presentation of depth-to-basement and depth-to-Moho maps, offering a broader regional view of the crustal architecture in the study area. Uninterpreted seismic data are shown for reference in the Supplement (S1).
5.1 Seismic interpretation of profile BGR16-256
The BGR16-256 seismic profile extends for 142 km in a NE–SW direction and is situated near the PQ2-002 profile (Fig. 2), whose updated interpretation was recently published by Ponikowska et al. (2024). Seismic imaging along this line reaches depths of up to 10 km, with the uppermost 6 km displayed in Fig. 4. The interpretation of seismic horizons in the sedimentary succession is calibrated using data from the K5 1/88 borehole, located at the southwestern end of the profile (Figs. 2 and 4). The top of the crystalline basement is well defined across most of the profile, appearing as a package of coherent, high-amplitude reflectors.

Figure 4Seismic interpretation of the BGR16-256 profile. Vertical exaggerations is 7 : 1. Abbreviations: CDF, Caledonian Deformation Front; KF, Koszalin Fault; TF, Trzebiatów Fault.
In the southwestern segment of the profile, over the first 20 km, the top basement lies at depths of 4.5–5.5 km. It is overlain by undulating strata of lower Palaeozoic age (primarily Ordovician), consistent with the K5 1/88 well. These units form part of the Caledonian fold-and-thrust belt. Within the sedimentary cover, the pre-Triassic horizons are downwardly deflected, while the Triassic and younger strata exhibit an upward flexure – both features typical of tectonic inversion during the Late Cretaceous.
Permian to Mesozoic strata are present along the first 35 km of the profile, extending down to a maximum depth of 4 km. These successions are bounded to the northeast by the Koszalin Fault (Figs. 2 and 3) and exhibit progressive thinning along profile: from approximately 4 km at the SW end, to 2.2 km at the Trzebiatów Fault, and just 1.5 km at the Koszalin Fault. The Trzebiatów and Koszalin faults are normal faults that were later inverted during Late Cretaceous–Paleocene compression. The basement is uplifted by about 1.5 km at the Trzebiatów Fault, rising from 4.5 km to 3 km. Beyond this, towards the northeast, the basement rises again to around 1.8 km at the Koszalin Fault.
Between 35 and 70 km along the profile, Permian–Mesozoic rocks are absent, and Cretaceous units rest directly upon Silurian strata, as confirmed by intersections with adjacent seismic profiles (Fig. 4). Here, an asymmetrical marginal trough of Late Cretaceous age is developed, reaching depths of nearly 1 km. The asymmetry of the basin and the downwarping of the Cretaceous strata suggest a NE-directed polarity of inversion.
From 70 to 85 km, the basement approaches the surface, covered only by a thin Silurian layer a few hundred metres thick or, in places, solely by Quaternary sediments. This segment corresponds to the uplifted Bornholm Block, which was elevated during Late Cretaceous inversion. Further northeast, another markedly asymmetrical marginal trough is present, infilled with Upper Cretaceous formations reaching up to 1 km in thickness. The basement surface rises steeply in this area, ultimately cropping out at the base of Quaternary within the Christiansø Block.
At its northeastern end, the Christiansø Block is abruptly downthrown by a major fault interpreted as the NW continuation of the Ustka Fault Zone (Fig. 2). This structure offsets the basement by approximately 1.5 km, forming a third marginal trough that is also filled with about 1.5 km of Upper Cretaceous sediments. This third syn-inversion basin extends to the northeastern end of the BGR16-256 profile, with the basement shallowing again from 1.5 km to around 0.5 km.
In summary, the BGR16-256 profile captures the transition from the Mid-Polish Anticlinorium, occupying the southwestern 35 km of the line, to a structurally elevated basement zone farther northeast. Within this uplifted zone, three marginal troughs associated with Late Cretaceous inversion are developed. These basins, filled with syn-inversion Upper Cretaceous sediments, alternate with two prominent basement highs formed during the same tectonic episode.
5.2 Seismic interpretation of profile BGR16-202
The BGR16-202 seismic profile extends for 156 km in a NW–SE direction and is situated approximately 70 km east of Bornholm, within the East European Precambrian Platform. The interpretation of seismic horizons is calibrated using data from the A23 1/88 borehole, which reached crystalline basement (Figs. 2 and 5a). Figure 5a presents the uppermost 6 km of the profile. The crystalline basement is clearly imaged along the profile, appearing as discontinuous packages of high-amplitude, high-energy reflectors.
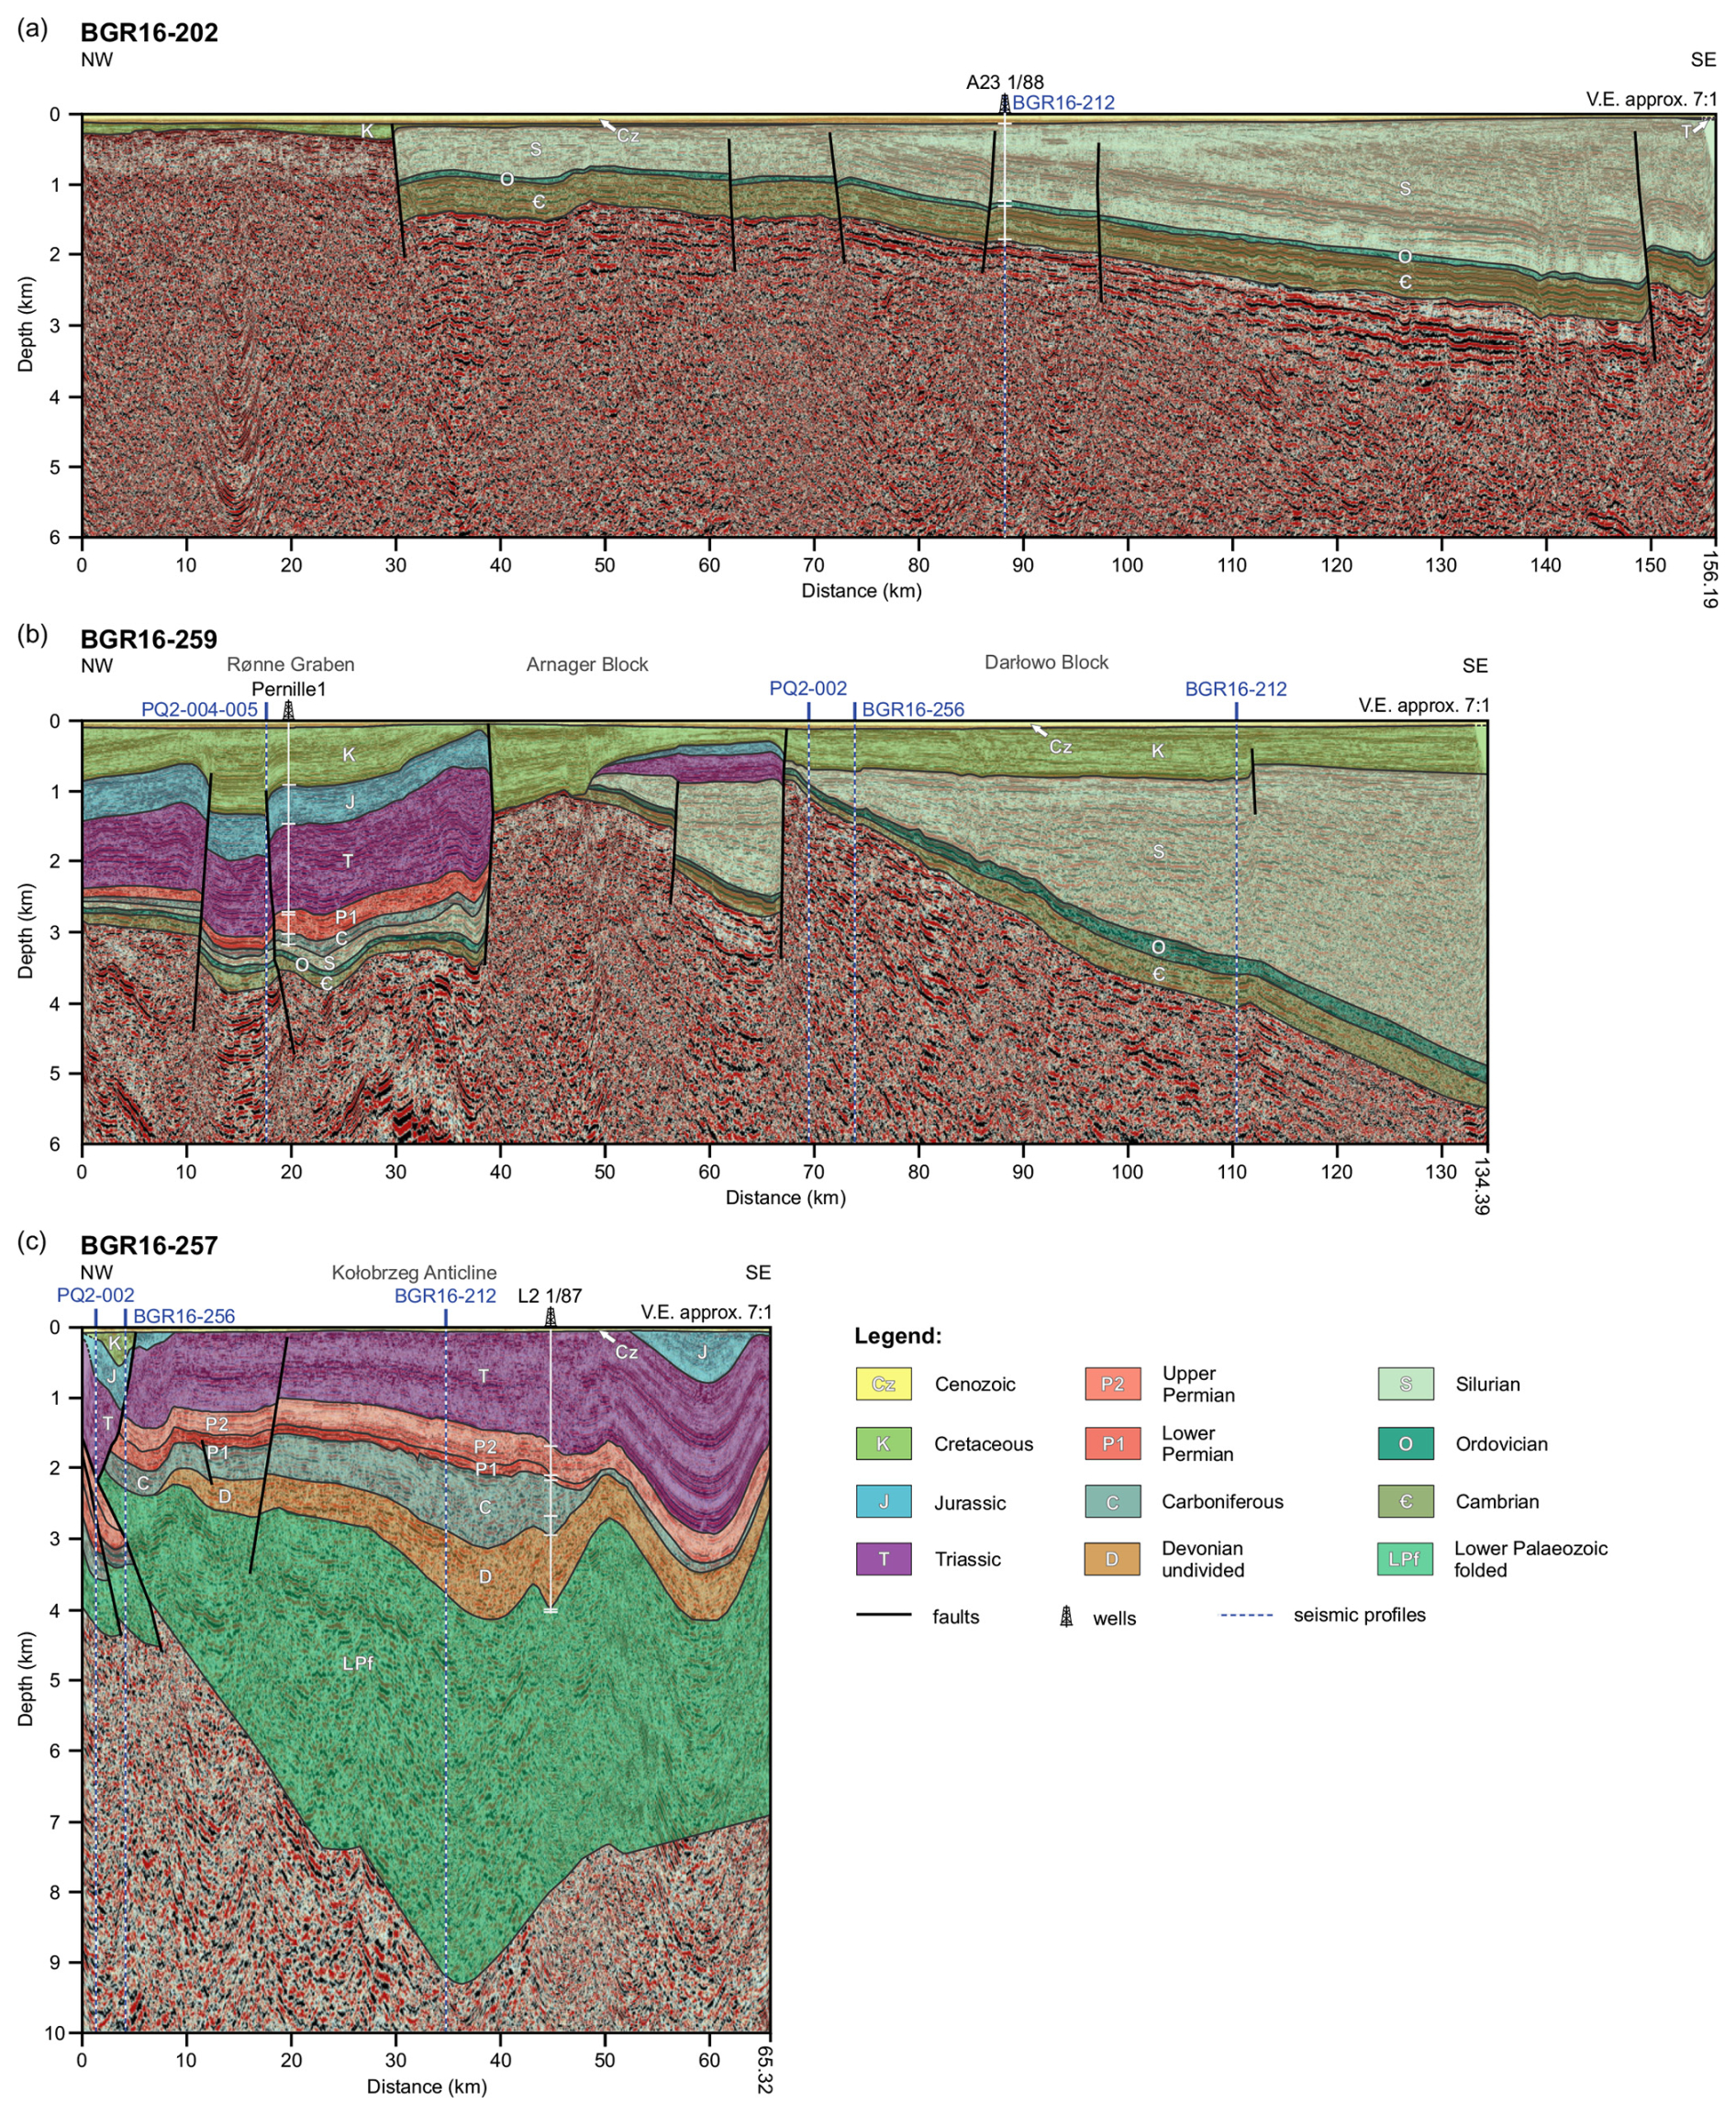
Figure 5Seismic interpretation of the (a) BGR16-202, (b) BGR16-259, (c) BGR16-257 profiles Vertical exaggeration is 7 : 1.
In the northwestern segment of the profile, over the first 30 km, the top of the basement lies at shallow depths and is overlain by a thin succession of Cretaceous and Cenozoic sediments, with a combined thickness of only 200–300 m. At approximately 30 km along the profile, a major fault offsets the basement surface by about 1.3 km, lowering it to a depth of roughly 1.5 km. This significant structure, likely of Late Cretaceous or older origin, is not recorded on existing geological maps, highlighting the value of seismic data in revealing previously unrecognized tectonic features.
Southeast of this fault, over the next 120 km, the top basement initially remains relatively flat, then gradually dips towards the SE, reaching a depth of approximately 2.5 km near the southeastern end of the profile. The overlying Cambrian and Ordovician strata maintain a nearly constant thickness along this segment. In contrast, the Silurian sequence thickens progressively from around 800 m to over 2.2 km, suggesting differential subsidence during Silurian times or post-Silurian uplift and deep erosion. The Silurian layers lie parallel to the tilted basement, indicating post-depositional rotation prior to Late Cretaceous deformation, as marked by an unconformity at the Silurian top. Due to limitations in seismic resolution and the lack of direct stratigraphic constraints, the precise age of the structures controlling the basement geometry cannot be firmly established. However, the faulting and basement tilting are likely Silurian or younger, but certainly pre-Cenozoic in age.
The Upper Cretaceous deposits are relatively thin throughout the profile, not exceeding 200 m, and do not form significant depocentres. This suggests that the effects of Late Cretaceous tectonic inversion in this sector of the southern Baltic Sea were minimal, especially in comparison to the strongly inverted zones farther west.
Towards the southeastern end of the profile, at around 150 km, another fault is observed, uplifting the southeastern block by several hundred metres. This fault terminates at the base of the Cretaceous succession, indicating that its activity postdates the Silurian but predates the deposition of the Upper Cretaceous.
In summary, the BGR16-202 profile illustrates a relatively stable sector of the Baltic Sea crust, underlain by Precambrian basement and variably covered by Palaeozoic and thin post-Palaeozoic strata. The profile reveals moderate faulting and gentle tilting of the basement surface, largely unrelated to the intense Late Cretaceous inversion processes that shaped adjacent areas.
5.3 Seismic interpretation of profile BGR16-259
The BGR16-259 seismic profile extends for 135 km in a NE–SE direction (Fig. 2) immediately west of Bornholm. It traverses the Rønne Graben and runs subparallel to the TTZ, lying roughly 15 km northeast of its mapped trace. Seismic horizons within the sedimentary cover are correlated with the Pernille borehole (Figs. 2 and 5b), providing key stratigraphic control.
The top of the crystalline basement is imaged as coherent packages of high-amplitude reflectors, though it is strongly offset and segmented by multiple faults along the profile – clear evidence of tectonic inversion and differential basement uplift. In the northwestern portion of the profile, over the first 38 km corresponding to the Rønne Graben, the basement surface lies at depths of 3.0–3.5 km (Fig. 5b). Here, the Permian–Mesozoic succession reaches 2.5–3.0 km in thickness, while older Palaeozoic strata (pre-Permian) are limited to 0.5–1.0 km. The Upper Cretaceous sequence attains its maximum thickness in this area, exceeding 1 km, but thins progressively towards the southeast.
At approximately 38 km along the profile, a major fault separates the Rønne Graben from the Arnager Block. Across this fault, the basement is uplifted by about 2 km due to tectonic inversion, and it is overlain only by Upper Cretaceous deposits. Another inversion-related structure occurs between 50 and 65 km, where a narrow tectonic depression is observed, interpreted as a fault-bounded graben filled predominantly with Silurian deposits, which attain a maximum thickness of over 1.5 km. This Silurian succession is overlain, across an erosional unconformity, by reduced thicknesses of Triassic and Jurassic strata, indicating either non-deposition or erosion of the intervening Devonian and Carboniferous units.
A prominent fault at around 67 km marks the boundary of the Darłowo Block. Across this structure, the basement is uplifted again by more than 1.5 km towards the southeast. Beyond this point, the basement rapidly subsides, reaching a maximum depth of approximately 5.5 km at the southeastern end of the profile. Throughout this segment, the Cambrian and Silurian strata overlying the basement remain relatively constant in thickness, although the Silurian shows a steady increase in thickness, reaching up to 4 km. Meanwhile, the Upper Cretaceous maintains a nearly uniform thickness of about 1.0 km from 70 km to the end of the profile (Fig. 5b). Silurian strata initially follow the tilted basement but exhibit internal unconformities in their upper sections, suggesting syn-sedimentary deformation.
In summary, the BGR16-259 profile reveals a complex structural architecture shaped by multiple tectonic events. It records evidence of Permian–Mesozoic extension and subsidence, overprinted by Late Cretaceous inversion. The significant variation in Silurian thickness and the irregular basement topography may reflect differential subsidence during the Silurian, or alternatively, later Palaeozoic uplift and erosion. In the latter scenario, the presence of Triassic deposits directly overlying an eroded Silurian surface would indicate that uplift and erosion must have occurred prior to Triassic sedimentation, most likely during the late Palaeozoic.
5.4 Seismic interpretation of profile BGR16-257
The BGR16-257 seismic profile, 65 km in length, runs in a NE–SE direction across the western segment of the Mid-Polish Trough (Fig. 2). Figure 5c displays the entire seismic imaging range, extending to a depth of 10 km. Seismic horizons within the lower Palaeozoic succession are constrained by data from the L2 1/87 borehole (Figs. 2 and 5c), which provides key stratigraphic control for the interpretation. The region imaged by the profile experienced intense tectonic inversion during the Late Cretaceous (Ponikowska et al., 2024), when the eastern branch of the Mid-Polish Trough was uplifted and transformed into the Kołobrzeg Anticline. This structure is characterised by Triassic rocks forming its core (Fig. 2), and as a result, much of the BGR16-257 profile displays Triassic strata directly underlying the Cenozoic.
Notably, BGR16-257 is the only one among the four seismic profiles that lies entirely to the west of the Caledonian Deformation Front (Fig. 2). Consequently, it captures a substantial thickness – up to 4 km – of folded lower Palaeozoic sediments belonging to the Caledonian fold-and-thrust belt. At the same time, it is the only profile situated completely southwest of the Koszalin Fault (Fig. 2), a major tectonic boundary that marks the eastern limit of Upper Palaeozoic deposition in this region of the southern Baltic Sea (Nguyen et al., 2024). Within this structural setting, Devonian and Carboniferous strata attain considerable thicknesses of 1.5 to 2.0 km. The overlying Permian–Mesozoic succession ranges in thickness from 2.0 to 3.0 km.
The top of the crystalline basement forms a pronounced central depression, reaching a maximum depth of ∼ 9.5 km, as confirmed by its intersection with profile BGR16-212. The basement rises towards both ends of the profile, but the geometry is asymmetrical: in the northwest, the basement ascends steeply to a depth of 4 km, while in the southeast, the slope is gentler, with the basement reaching a depth of about 7 km near the end of the profile.
The BGR16-257 profile captures the cumulative effects of multiple tectonic phases, most prominently the Permian–Mesozoic extensional regime and the Late Cretaceous inversion. The imprint of late Palaeozoic extension and subsidence is also evident, particularly in the thick accumulation of Devonian and Carboniferous sediments. Additionally, the lower Palaeozoic strata reflect the earlier Caledonian tectonic evolution associated with the Caledonian orogeny. However, the complex morphology of the basement surface cannot be fully explained by these Phanerozoic tectonic episodes alone. The pronounced basement relief, especially the central depression, may partially reflect deeper, inherited structures of Precambrian origin within the East European Craton. This suggests that pre-Palaeozoic tectonic inheritance may have exerted a significant influence on the later structural development of this region.
5.5 2-D gravity and magnetic model for profile BGR16-256
The geometry of the model bodies is constrained by seismic horizons and fault structures interpreted from the seismic profile (Fig. 4). The density and susceptibility values employed in the modelling are provided in Table 2, with crystalline crust properties additionally illustrated in Fig. 6d. To minimize model ambiguity, density values within individual lithological units were constrained to a relatively narrow range. This approach helped to reduce overall complexity of the final model.
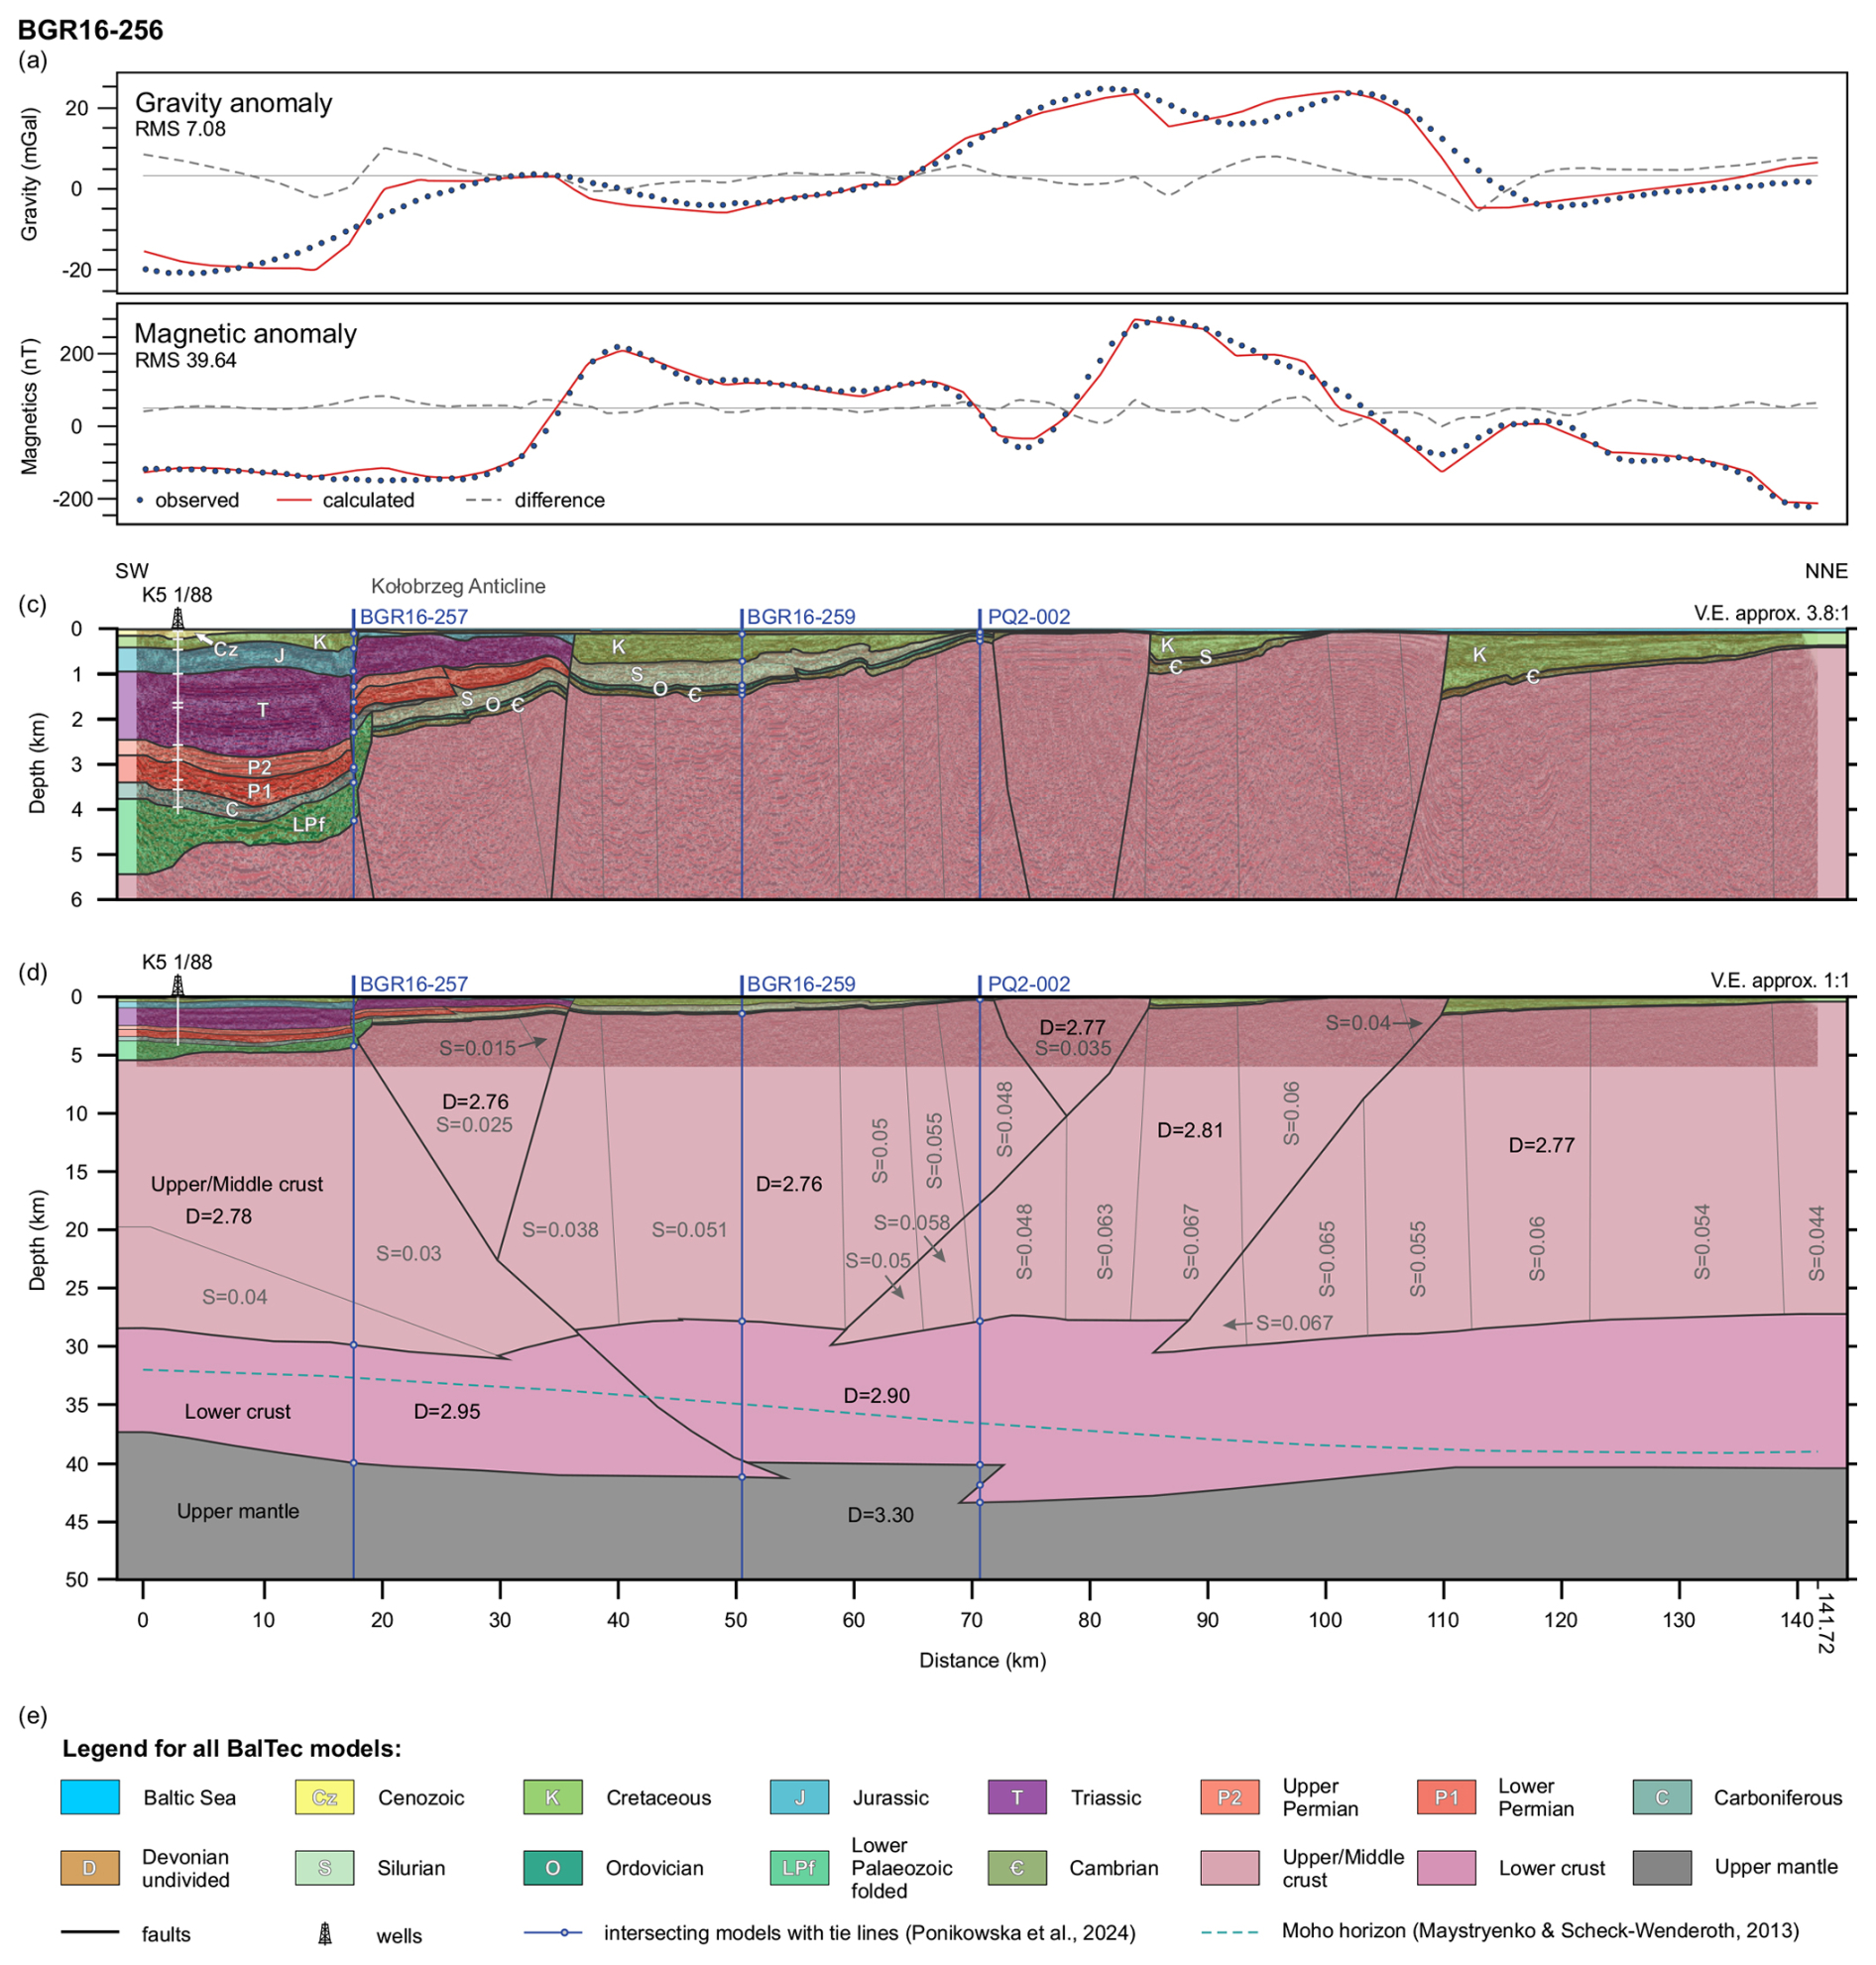
Figure 6Two-dimensional gravity and magnetic model for the BGR16-256 profile. (a, b) Gravity and magnetic data, respectively. Blue, dotted lines – observed and red, solid lines – modelled. Grey dashed line shows the magnitude of error. (c) Vertically exaggerated (3.8 : 1) upper part of the geological model. (d) Full geological model at the scale 1 : 1. Numbers indicate densities (D) in g cm−3 and susceptibilities (S) in SI convention. Thin grey lines show the boundaries of blocks that differ in magnetic susceptibility and density. Blue, dashed lines show intersection with the regional Moho model by Maystrenko and Scheck-Wenderoth (2013).
The observed gravity profile is smooth as we used free-air gravity data derived from satellite altimetry. A characteristic feature of this acquisition method is the absence of the short-wavelength frequency band, and this effect is further enhanced by gridding at a 0.02° resolution. Therefore, the shortest-wavelength anomalies among those observed in the gravity profile. are linked mostly to changes in crystalline basement depth and geometry. The synthetic gravity response closely matches the observed data, with a Root-Mean-Square (RMS) error of 7.08 mGal (Fig. 6a). A broad negative anomaly is visible in the southern part of the profile, and it corresponds to a basement in the first 20 km of the profile and thick accumulation of low-density Permian and Mesozoic sediments. The Kołobrzeg Anticline (Fig. 2), which is inversion-related structure developed within sedimentary cover is marked by subtle positive gravity anomaly, successfully reproduced by the model. The relationship between the gravity anomalies and the top basement is clearly visible at c. 80 km and 100 km of the profile where basement uplifts generate two regional gravity highs.
The magnetic model along profile BGR16-256 shows an acceptable fit to the observed data, with an RMS error of 41.29 nT (Fig. 6b). The lower crust is non-magnetic, while the magnetic upper/middle crust was subdivided into several blocks with variable susceptibility ranging from 0.015 to 0.067 SI. This approach significantly reduces the misfit between modelled and observed data.
The overall crustal architecture along BGR16-256 is consistent with the results obtained along the PQ2-002 profile in a previous study by Ponikowska et al. (2024) (Fig. 1). Both profiles are located in proximity and image a thick crust, with Moho depths ranging from 38 in the SW to 41 km in the NNE. However, in contrast to PQ2-002, where crustal-scale thick-skinned reverse faults and pop-up structures were interpreted based on deep seismic reflection data, the seismic imaging available along BGR16-256 does not extend sufficiently deep to resolve comparable fault structures. Consequently, the absence of crustal-scale faults in this model should not be interpreted as their geological absence but rather reflects the limitations imposed by the seismic data used.
5.6 2-D gravity and magnetic model for profile BGR16-202
The geometry of the geological model down to the top of the crystalline basement was constrained using interpreted seismic horizons from profile BGR16-202 (Fig. 5a), in combination with borehole data from well A23 1/88. The physical parameters used in the forward modelling, including density and magnetic susceptibility values, are summarised in Table 2. Additional details on the properties of the crystalline crust are illustrated in Fig. 7d. The depths to the Moho and the lower crust were constrained through intersection with the BalTec and BGR16-212 seismic refraction and reflection profiles, respectively (Janik et a., 2022; Ponikowska et al., 2024). The geometry of the Moho for the profile BGR16-202 is also guided by previously interpreted Moho depths published by Maystrenko and Scheck-Wenderoth (2013).

Figure 7Two-dimensional gravity and magnetic model for the BGR16-202 profile. (a, b) Gravity and magnetic data, respectively. Blue, dotted lines – observed and red, solid lines – modelled. Grey dashed line shows the magnitude of error. (c) Vertically exaggerated (4.2 : 1) upper part of the geological model. (d) Full geological model at the scale 1 : 1. Numbers indicate densities (D) in g cm−3 and susceptibilities (S) in SI convention. Thin grey lines show the boundaries of blocks that differ only in magnetic susceptibility within upper/middle crust and density in the lower crust. Blue, dashed lines show intersection with the regional Moho model by Maystrenko and Scheck-Wenderoth (2013).
The gravity response of the model shows a good overall match with the observed data, yielding a root-mean-square (RMS) misfit of 4.13 mGal (Fig. 7a). The long-wavelength component of the gravity field is primarily influenced by regional variations in crustal thickness and Moho geometry. In contrast, short-wavelength gravity anomalies are controlled by the depth and shape of the crystalline basement. These shorter-wavelength signals are more difficult to reproduce in the model because of limited resolution, the complexity of the basement structure, and the influence of 3-D effects and lateral density variations in the upper crust and sedimentary cover. A prominent misfit at approximately 35 km along the profile corresponds to a significant step in the basement, whose vertical geometry is poorly resolved by satellite-derived gravity grids. Additional misfits between 50–70 km and 135–145 km are more likely related to upper-crustal density variations not accounted for in the model, as well as the model's orientation, which is nearly parallel to the strike of the gravity anomalies (Fig. 3a). This along-strike configuration may introduce significant 3-D effects.
The magnetic anomaly model also provides a satisfactory fit to the observed data, with an RMS misfit of 28.24 nT (Fig. 7b). The upper and middle crust were subdivided into vertically oriented blocks with laterally variable susceptibilities to replicate observed magnetic variations. This approach effectively accounts for structural heterogeneities and lithological changes, though local discrepancies remain that may indicate unmodelled remanent magnetisation or deeper magnetic sources.
Structurally, the Moho along this profile is relatively flat, lying at approximately 39 km depth in the southeastern part and gently deepening to about 42 km in the northwest (Fig. 7d). This configuration supports the interpretation that the crust in this segment of the East European Platform is stable and largely unaffected by significant thick-skinned inversion tectonics. This contrasts with more deformed profiles, such as PQ2-002 and PQ2-004/005, which cross the Sorgenfrei–Tornquist Zone and the Teisseyre–Tornquist Zone respectively, where the crustal structure exhibits greater tectonic complexity and modification (Ponikowska et al., 2024).
5.7 2-D gravity and magnetic model for profile BGR16-259
The crustal model along profile BGR16-259 was constructed using the same methodology as applied to the two preceding profiles. An overview of the density and magnetic susceptibility values used in the modelling is provided in Table 2 and illustrated in Fig. 8d. The calculated gravity response of the model shows a good agreement with the observed gravity data, yielding a root-mean-square (RMS) misfit of 5.63 mGal (Fig. 8a). The model accurately reproduces the prominent gravity high associated with the uplifted Arnager Block, where the crystalline basement is structurally elevated between 40 and 60 km along the profile.

Figure 8Two-dimensional gravity and magnetic model for the BGR16-259 profile. (a, b) Gravity and magnetic data, respectively. Blue, dotted lines – observed and red, solid lines – modelled. Gray dashed line shows the magnitude of error. (c) Vertically exaggerated (3.6 : 1) upper part of the geological model. (d) Full geological model at the scale 1 : 1 based. Numbers indicate densities (D) in g cm−3 and susceptibilities (S) in SI convention. Thin grey lines show the boundaries of blocks that differ only in magnetic susceptibility within upper/middle crust and density in the lower crust. Blue, dashed lines show intersection with the regional Moho model by Maystrenko and Scheck-Wenderoth (2013).
As in the previous models, several short-wavelength anomalies in the synthetic gravity response – primarily resulting from the detailed basement geometry – do not correspond closely with the observed data. For example, the observed gravity shows a low between 0 and 35 km along the profile, whereas the synthetic response indicates a mass excess from 0 to 20 km and a mass deficit from 20 to 35 km. Another mismatch appears near the 65 km mark, where the synthetic response suggests a basement uplift that is not evident in the observed gravity data, possibly reflecting an over-smoothed satellite gravity signal in this part of the profile.
The magnetic forward model also yields a satisfactory fit to the observed magnetic anomaly, with an RMS error of 58.76 nT (Fig. 8b). The modelled magnetic field is consistent with the interpreted lithological variations and block architecture in the upper crust, although some discrepancies in amplitude and wavelength suggest additional heterogeneity or remanent magnetisation effects not fully accounted for in the model.
Structurally, the crust thickens toward the northwest, as evidenced by a progressive deepening of the Moho from approximately 38 km in the southeastern part of the profile to around 42 km in the northwest (Fig. 8d). This trend, combined with the south-eastward-dipping basement, reflects a regional-scale crustal gradient.
5.8 2-D gravity and magnetic model for profile BGR16-257
The BGR16-257 gravity and magnetic 2-D forward model offers a refined view of the crustal structure beneath the western segment of the Mid-Polish Trough. As with previous modelling efforts, the geometry of the geological model is primarily constrained by seismic interpretation (Fig. 5c), further supported by borehole data from the L2 1/87 well and crustal thickness information derived from adjacent models, including BGR16-256, PQ2-002, and BGR16-212 (Ponikowska et al., 2024).

Figure 9Two-dimensional gravity and magnetic model for the BGR16-257 profile. (a, b) Gravity and magnetic data, respectively. Blue, dotted lines – observed and red, solid lines – modelled. Grey dashed line shows the magnitude of error. (c) Vertically exaggerated (1.7 : 1) upper part of the geological model. (d) Full geological model at the scale 1 : 1. Numbers indicate densities (D) in g cm−3 and susceptibilities (S) in SI convention. Thin grey lines show the boundaries of blocks that differ only in magnetic susceptibility within upper/middle crust and density in the lower crust. Blue, dashed lines show intersection with the regional Moho model by Maystrenko and Scheck-Wenderoth (2013).
The observed gravity field along the profile is characterised by a broad and relatively flat positive anomaly that extends across much of its length, interrupted only by a distinct gravity low within the first 10 km of the northwestern section. The forward model reproduces the free-air gravity data with good accuracy, yielding a root-mean-square (RMS) misfit of 8.25 mGal (Fig. 9a). In contrast to earlier profiles, the correlation between gravity anomalies and basement topography is less distinct. Instead, the gravity signal appears to be more significantly controlled by variations in the configuration and density of the lower crust and the geometry of the Moho.
The magnetic anomaly is dominated by a broad, positive feature centred over the main basement depression in the middle part of the profile. To match the observed magnetic response, the upper crust was subdivided into several sub-vertical blocks with variable magnetic susceptibilities ranging between 0.018 and 0.045 SI. The modelled magnetic field shows an inverse relationship with basement depth, suggesting that highly deformed lower Palaeozoic sedimentary rocks within the depression may exhibit elevated magnetic susceptibilities. This interpretation is consistent with a structural setting involving significant deformation and, possibly, very low-grade metamorphic overprinting.
The Moho depth in the model varies from approximately 35 km in the southeast to about 42 km in the northwest, with the deepest part corresponding to the location of the gravity low. This crustal thickening toward the northwest may reflect a transition from the extended crust of the Mid-Polish Trough to the more stable crustal domain associated with the Baltica margin.
5.9 Depth to basement study
The quality of the inversion was assessed using the root-mean-square (RMS) deviation. In our model, the RMS error for the fitted basement surface does not exceed 300 m, indicating a satisfactory level of accuracy. The depth-to-basement map reveals the superposition of two distinct structural trends that shape the deep crustal architecture of the southern Baltic Sea region (Fig. 10). The first trend, oriented NW–SE, is parallel to the TTZ and STZ. This alignment also corresponds to the orientation of several major fault zones in the area, including the Wiek, Skurup, Adler-Kamień, Trzebiatów, Koszalin, Ustka, Christiansø, and Łeba faults (Figs. 2, 10). Within this NW–SE framework, the basement topography clearly delineates key features such as the Rønne Graben, located west of Bornholm, and a pronounced basement depression at the northwestern termination of the Mid-Polish Trough. In this zone, the top of the crystalline basement descends to depths of approximately 10–11 km.
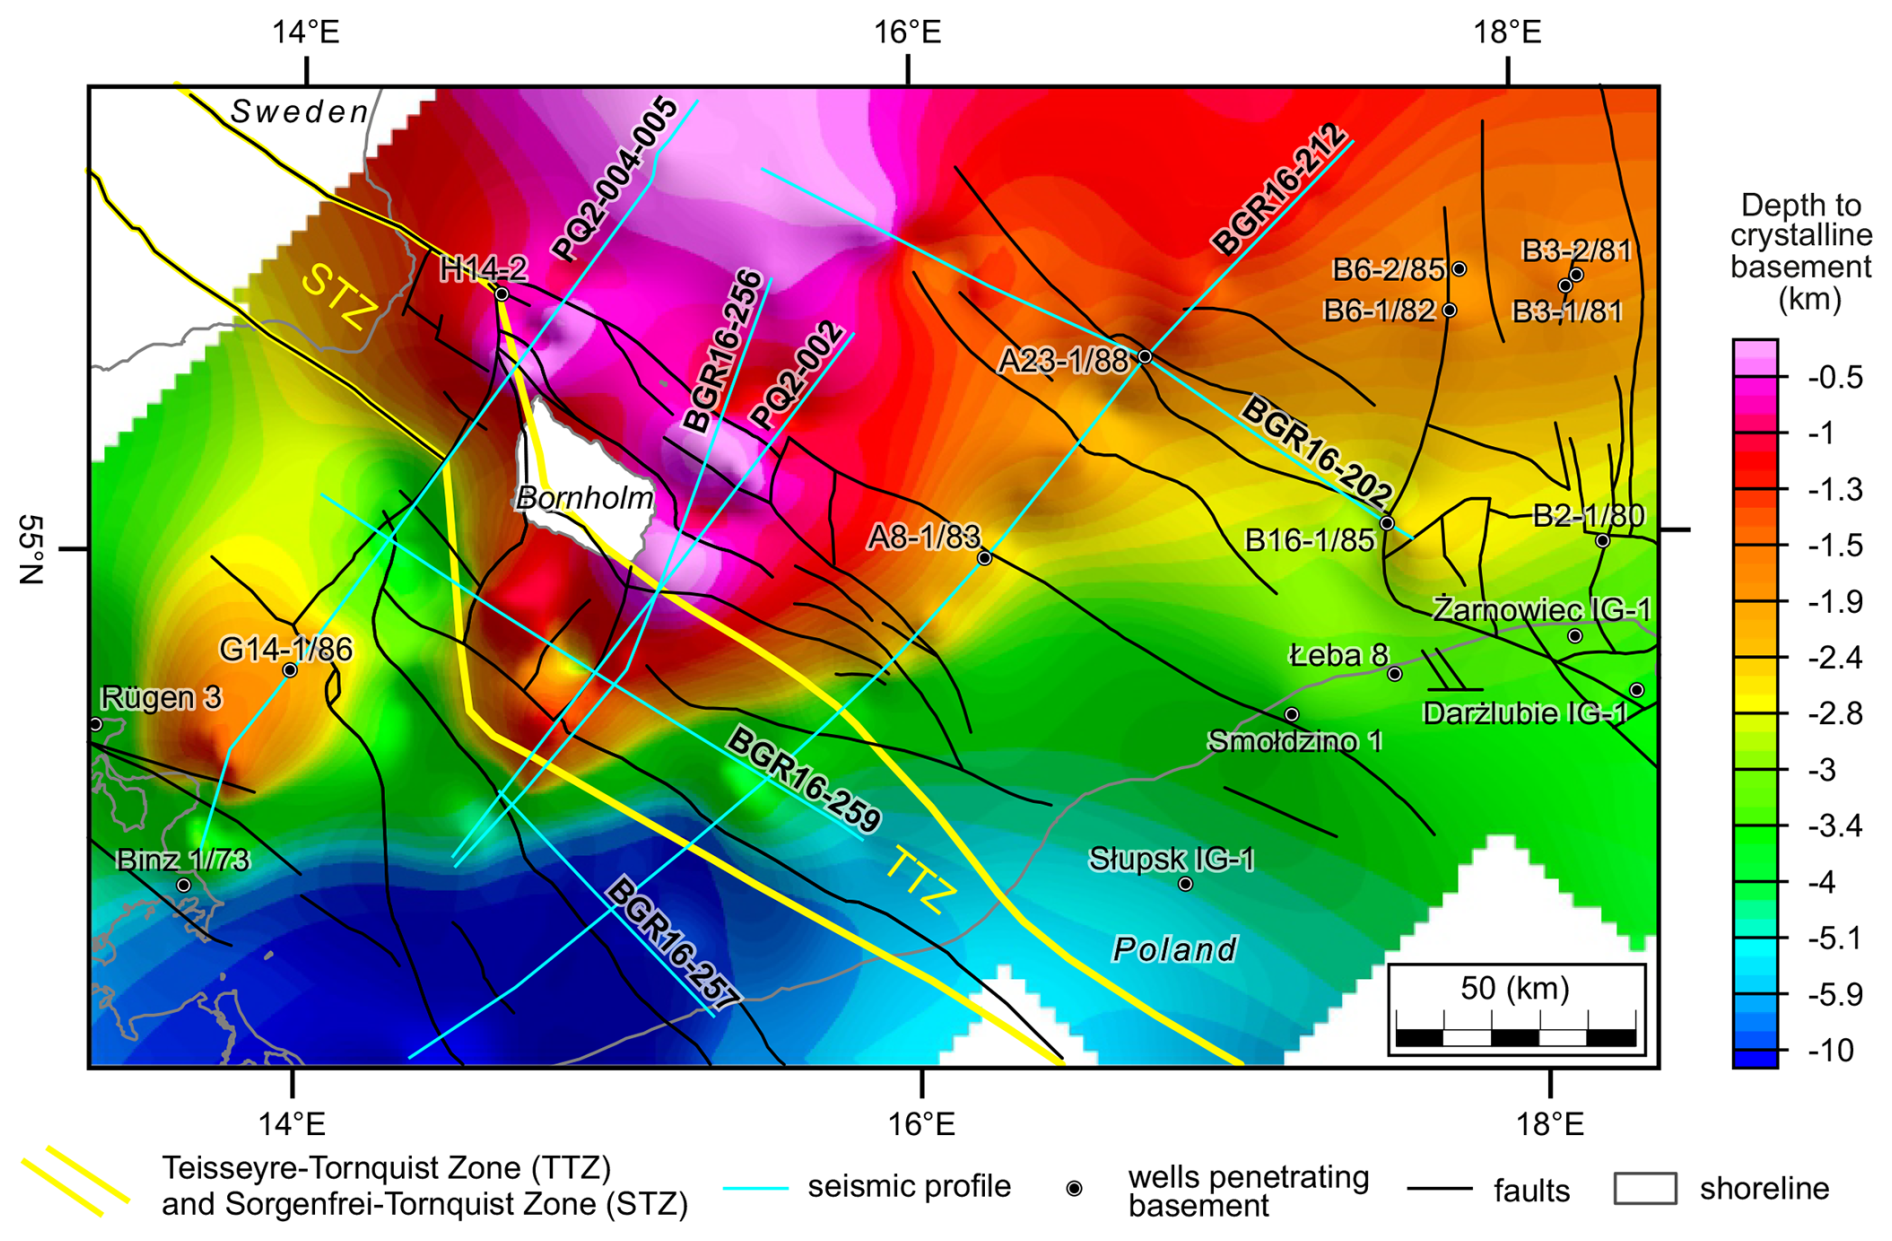
Figure 10Depth-to-basement map with key structural elements overlaid. Position of the interpreted seismic lines and wells penetrating basement are indicated. Main faults and tectonic blocks are modified from Kramarska et al. (1999), Krzywiec et al. (2003), Jaworowski et al. (2010), Pokorski (2010), Seidel et al. (2018) and Ponikowska et al. (2024). Locations of the Sorgenfrei- and Teisseyre-Tornquist Zones are shown after Ponikowska et al. (2024).
Superimposed on this pattern is a second, ENE–WSW-oriented structural trend, which extends across the entire study area and reaches as far west as the island of Rügen (Fig. 10). This trend manifests most clearly as a prominent basement slope southeast of Bornholm, forming a broad ramp structure. The axis of this ramp roughly follows the alignment of the Binz 1/73, A8-1/83, and B16-1/85 boreholes. The northwestern side of the ramp is elevated, while the southeastern side is depressed by about 1.5 km. This differential elevation results in the shallowest basement levels occurring in the northeastern part of the study area, beyond the Rønne Graben and the STZ.
The elevated segment of the basement encompasses the Arnager Block, Bornholm Block, Christiansø Block, and adjacent areas to the east (Figs. 2, 10). The most striking manifestation of this uplift is the exposure of crystalline basement above sea level on the islands of Bornholm and Christiansø (Ertholmene Archipelago). Structurally, the ENE–WSW-trending basement ramp forms the northwestern margin of the Mid-Polish Trough and represents a tectonic boundary that delimits this major depocentre. In contrast, the Rønne Graben – much shallower than the Mid-Polish Trough – follows a similar ENE–WSW orientation but is offset to the north.
Interestingly, the basement ramp weakly corresponds to a pattern in the Free Air gravity anomaly data (Fig. 3a). This effect is attributed to the dominance of younger structural features in the gravity field, primarily shaped by Late Cretaceous inversion tectonics. In several parts of the study area, gravity highs correspond well with subcrops of Triassic and Jurassic strata uplifted within the cores of inversion-related anticlines, as well as with basement highs located in the hanging walls of inversion-related faults. In contrast, the ENE–WSW basement trend is clearly expressed in the distribution of magnetic anomalies (Fig. 3b). Notably, an inverse correlation is observed: the depressed southeastern flank of the ramp coincides with a pronounced positive magnetic anomaly, whereas the elevated northwestern side exhibits a more heterogeneous but generally weaker magnetic response (Figs. 3b, 10).
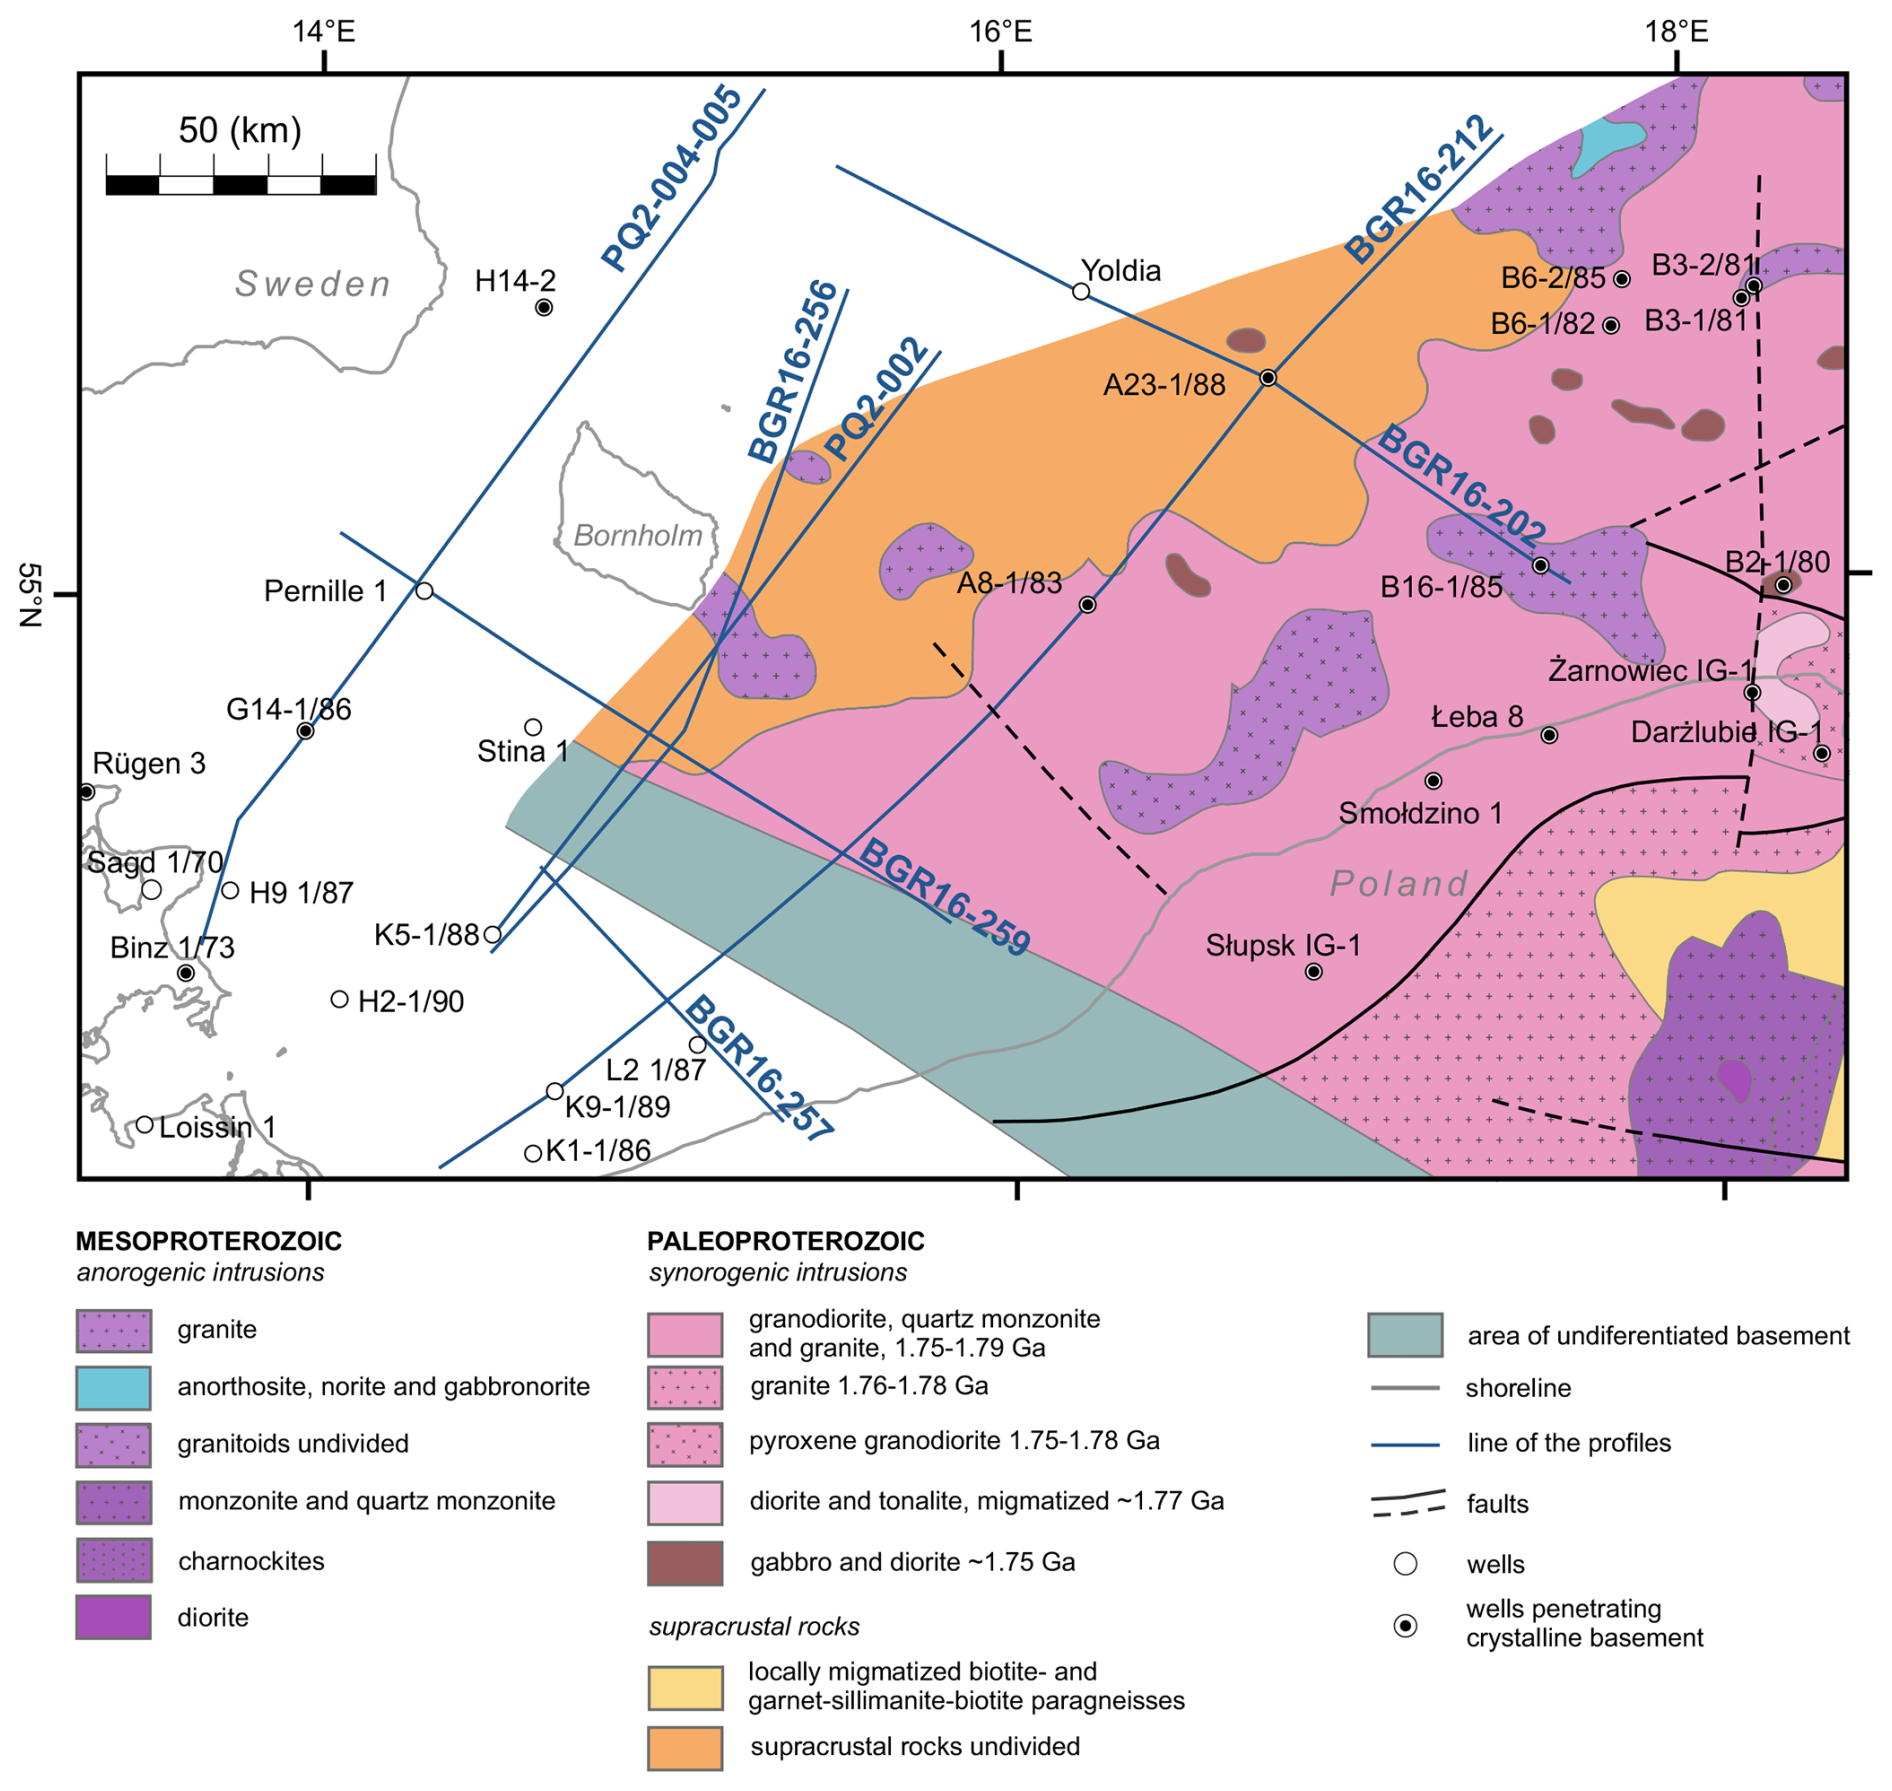
Figure 11Geological map of the crystalline basement of the East European Craton in the area of interest (modified from Krzemińska et al., 2017).
This pattern is closely linked to the lithological composition of the Precambrian basement (Fig. 11). The positive magnetic anomaly is associated with subcropping granitoids – predominantly granites, granodiorites, and quartz monzonites – on the depressed side of the ramp. In contrast, the elevated side is underlain by supracrustal rocks that typically produce lower and more variable magnetic signals. Hence, the ENE–WSW structural trend is not only evident in the morphology of the basement surface but is also mirrored in the magnetic anomaly field and the distribution of subcropping Precambrian lithologies.
However, the continuity of the ENE–WSW-trending magnetic anomaly terminates near the Mid-Polish Trough. This is most likely due to attenuation of the magnetic signal by the overlying sedimentary succession, which reaches thicknesses of up to 10 km, effectively masking the magnetic expression of the basement beneath.
5.10 Crustal thickness patterns and structural trends in the Moho topography
The quality of the inversion was assessed using the root-mean-square (RMS) deviation. The RMS error for the fitted Moho discontinuity does not exceed 500 m, indicating a satisfactory level of accuracy at the regional scale. Similar to the morphology of the top of the crystalline basement, the depth-to-Moho map reveals two dominant structural trends that shape the crustal architecture of the study area (Fig. 12). The first trend follows a NW–SE orientation and runs parallel to the TTZ and STZ. This trend is marked by two contrasting Moho features: a localised Moho depression west of Bornholm, and a Moho uplift beneath the north-western termination of the Mid-Polish Trough (Fig. 12). When compared with the basement configuration (Fig. 10), the crustal architecture at the north-western end of the Mid-Polish Trough is characteristic of a typical extensional basin – featuring a subsided crystalline basement and a correspondingly uplifted Moho. In contrast, the area west of Bornholm displays a different configuration, where both the basement and the Moho are depressed. This suggests that the crustal deformation in that region was governed by a more complex mechanism than simple extension, potentially involving crustal loading, lower crustal flow, tectonic inversion or inherited lithospheric structures.
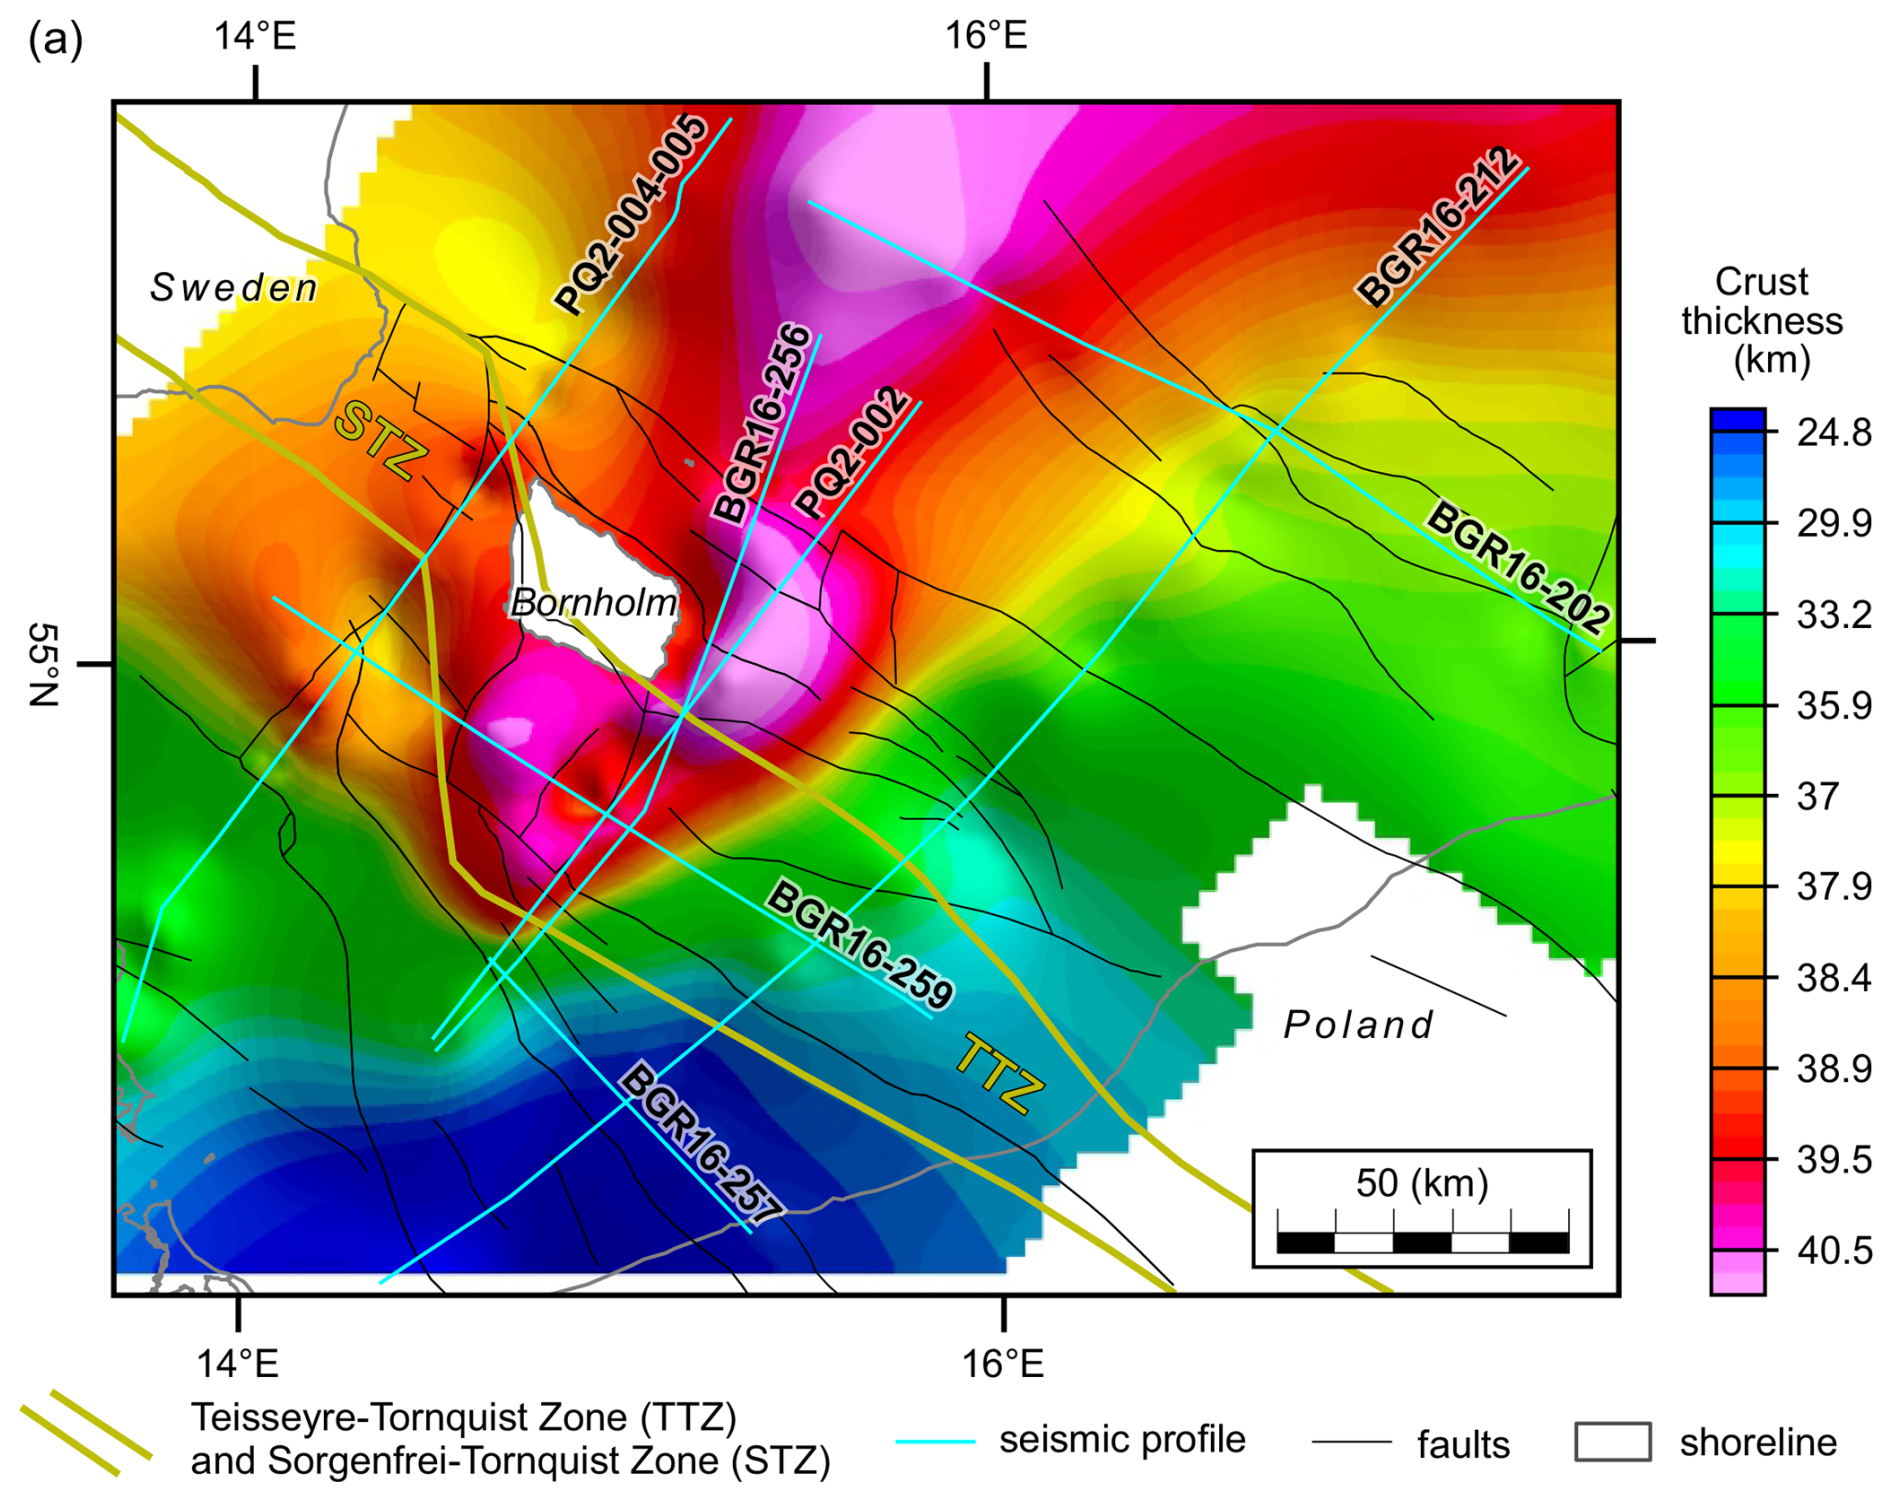
Figure 12Depth-to-Moho map with key structural elements overlaid. Position of the interpreted seismic lines is indicated. Main faults and tectonic blocks are modified from Kramarska et al. (1999), Krzywiec et al. (2003), Jaworowski et al. (2010), Pokorski (2010), Seidel et al. (2018) and Ponikowska et al. (2024). Outlines of the Sorgenfrei- and Teisseyre-Tornquist Zones are shown after Ponikowska et al. (2024).
The second structural trend is oriented ENE–WSW and manifests as a pronounced transition zone in Moho depth (Fig. 12). This zone spatially coincides with a ramp in the crystalline basement surface and marks a first-order change in crustal structure. South-east of this boundary, the Moho lies 2–3 km shallower than to the north-west. Interestingly, the same part of the region that exhibits the deepest Moho also corresponds to the shallowest position of the basement top (Fig. 10), notably in the area east of the STZ and northwest of the Moho step trending ENE–ESE. Additionally, a shallower Moho is observed beneath the Skurup Block, which forms the northwestern continuation of the Mid-Polish Trough (Fig. 12).
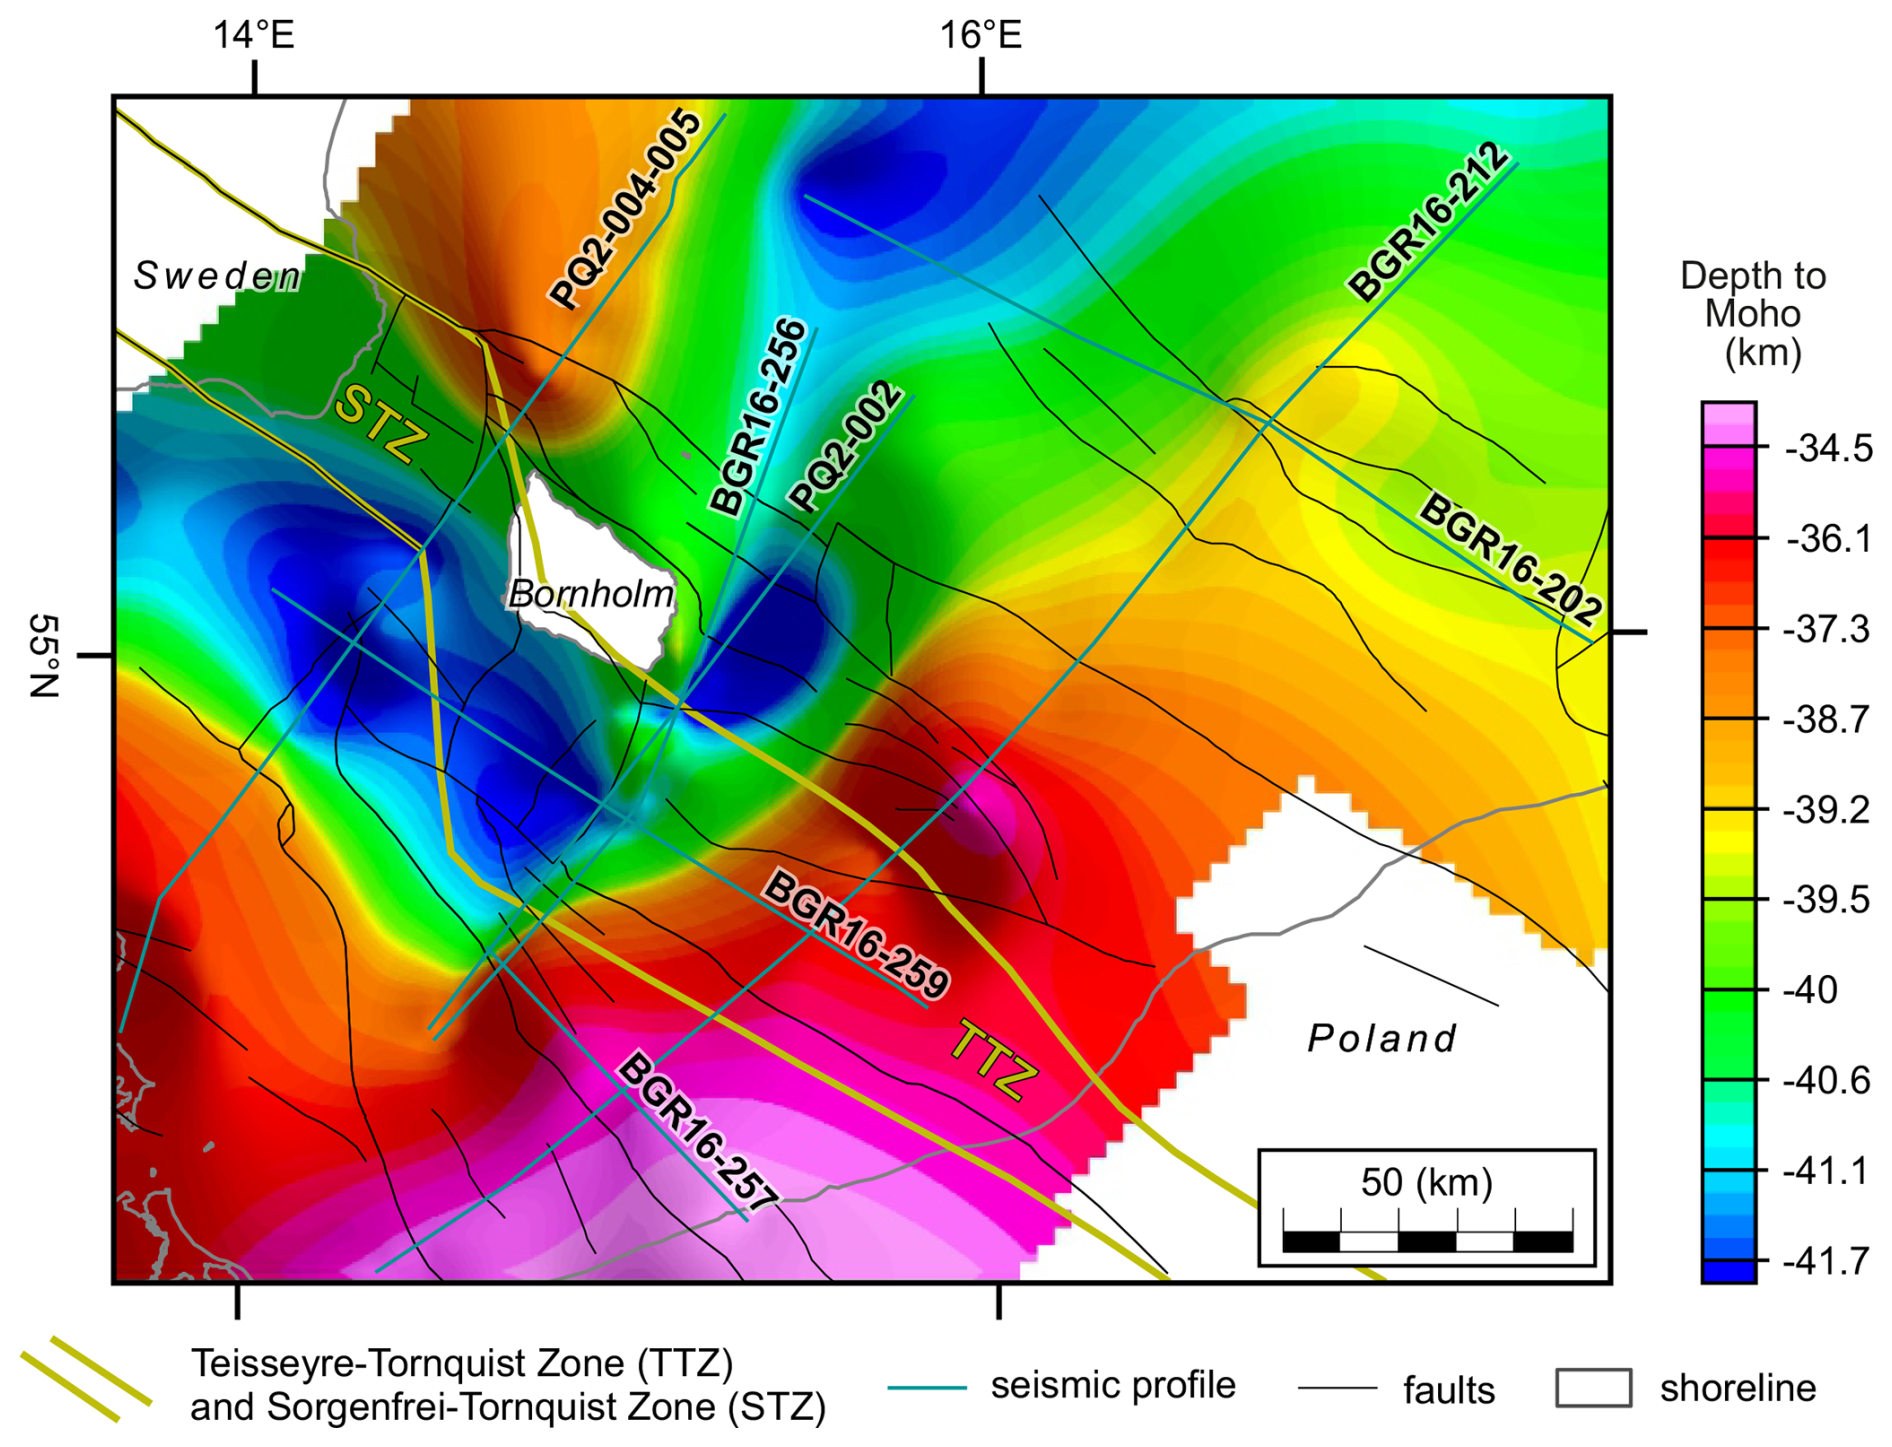
Figure 13Crustal thickness map with key structural elements overlaid. Position of the interpreted seismic lines is indicated. Main faults and tectonic blocks are modified from Kramarska et al. (1999), Krzywiec et al. (2003), Jaworowski et al. (2010), Pokorski (2010), Seidel et al. (2018) and Ponikowska et al. (2024). Outlines of the Sorgenfrei- and Teisseyre-Tornquist Zones are shown after Ponikowska et al. (2024).
These structural relationships are most clearly expressed in the crustal thickness map (Fig. 13), which highlights a domain of significantly thickened crust located east of the STZ and northwest of the stepwise transitions in both basement and Moho depths. In contrast, the thinnest crust occurs beneath the northwestern termination of the Mid-Polish Trough. The difference in crustal thickness between the area west of Bornholm and the axial zone of the trough reaches approximately 15 km (Fig. 13), reflecting substantial lateral variations in the crustal structure of the region.
Seismic interpretation of the southern Baltic Sea region reveals that the upper crustal architecture was shaped primarily by two major tectonic events: Permian–Mesozoic extension and Late Cretaceous inversion. The extensional regime led to the formation of sedimentary basins, notably the Mid-Polish Trough and the Rønne Graben, where the Permian–Mesozoic sedimentary succession accumulated to thicknesses of 3–4 km. These basins exhibit typical features of rift-related and post-rift subsidence with superimposed phases of renewed extension (e.g., Ponikowska et al., 2024).
Subsequently, during the Late Cretaceous, a regional compressional phase resulted in pronounced thick-skinned inversion. This deformation reactivated pre-existing faults and generated new fault structures. Vertical displacements along these faults reached 1.5–2 km, resulting in uplift and folding of the previously deposited sedimentary fill. Asymmetrical marginal troughs, filled with up to 1 km of Upper Cretaceous deposits, developed along the flanks of the inverted basins. Their asymmetry and orientation consistently indicate a north-eastward vergence of compressional forces (Fig. 4). Our observations corroborate the findings of Ponikowska et al. (2024), who noted that the effects of inversion extended beyond the original Permian–Mesozoic depocentres.
Seismic data from the BGR16-256 profile (Fig. 4) clearly demonstrate that Permian–Mesozoic extension affected not only the main troughs but also the East European Craton (EEC) margin, northeast of the Christiansø Block. There, the crystalline basement is overlain solely by lower Palaeozoic strata, yet it exhibits features, showing that the inversion extended at least 35 km east of the Christiansø Block. However, east of the Ustka Fault Zone – at distances of 60–70 km from the Christiansø Block – the BGR16-202 profile shows no clear evidence of Late Cretaceous inversion, suggesting a spatial limit to the compressional overprint (Fig. 5a). Additionally, the profile is oriented perpendicular to the shortening direction and parallel to the faults, which reduces the visibility of shortening-related structures.
A close comparison of BGR16-256 with profile PQ2-002 (Ponikowska et al., 2024) reveals consistent structural interpretations. The Trzebiatów and Koszalin faults correspond to backthrusts on both profiles, while the faults bounding the Bornholm and Christiansø Blocks match major thrusts. One notable difference concerns the western margin of the Christiansø Block at 100–110 km (Fig. 4). On BGR16-256, this feature appears as a basement slope, whereas Ponikowska et al. (2024) interpreted it as a fault. Because the basement appears to subcrop beneath the Cenozoic farther to the northeast, the presence of a fault cannot be ruled out.
Of the four profiles considered, only BGR16-256 traverses the CDF, which, in this area, does not appear as a major crustal-scale feature. Consistent with earlier interpretations (Mazur et al., 2016b; Ponikowska et al., 2024), the deformation is thin-skinned and involves only a limited thickness of lower Palaeozoic rocks. In contrast, profile BGR16-257 shows up to 4 km of deformed lower Palaeozoic strata. Because this profile is located farthest to the west among the study profiles, the greater thickness of lower Palaeozoic indicates a westward increase in the thickness of the Caledonian accretionary wedge.
The present study also confirms that upper Palaeozoic strata are restricted to the western part of the study area, particularly west of the Koszalin Fault, within the Mid-Polish Trough and the Rønne Graben. Profile BGR16-259, for example, documents up to 2 km of upper Palaeozoic strata. This thick succession likely records a post-Caledonian rifting phase and subsequent subsidence during the Devonian–Carboniferous (Ponikowska et al., 2024), a phenomenon also supported by recent studies of basin evolution (Smit et al., 2018; Krzywiec et al., 2022).
A key unresolved issue concerns the extent and configuration of the EEC beneath the southwestern Baltic Sea and its relationship to the TTZ. Several models propose that the EEC crust extends south-westward beneath the North German–Polish Caledonides, reaching as far as the Elbe Lineament (Tanner and Meissner, 1996; Bayer et al., 2002; Mazur et al., 2015, 2016a, b; Smit et al., 2016; Ponikowska et al., 2024). This interpretation is supported by deep seismic reflection and refraction data, and gravity and magnetic modelling, all consistently indicating the presence of a thick, reflective lower crust of likely EEC affinity. Comparable crustal signatures have been documented farther west beneath northern Germany (e.g., DEKORP and EUGENO-S profiles; Aichroth et al., 1992; Bayer et al., 2002; Mazur et al., 2026), suggesting that craton-derived lower-crustal material may underlie parts of the Caledonian belt in a broad suture zone rather than terminating along a discrete boundary.
In contrast, alternative models argue for an abrupt termination of the EEC at the TTZ, interpreted as a major strike-slip suture formed during the Ordovician–Silurian accretion of Avalonian terranes (Dadlez et al., 2005). However, a sharp Moho- and crustal-scale boundary at the TTZ is difficult to reconcile with several independent observations. First, the geometry of the CDF and the onshore thin-skinned Caledonian structures in NW Poland imply that deformation was decoupled from the crystalline basement (Mazur et al., 2016b; Ponikowska et al., 2024), inconsistent with a rigid, abrupt cratonic termination beneath the deformation front. Second, the TTZ is associated with a broad zone of heterogeneous basement properties, rather than a single sharply defined suture; recent potential-field inversions and magnetotelluric studies reveal an up to 120 km wide transition zone characterised by mixed crustal signatures, inherited faults, and variable lower-crustal reflectivity (Smit et al., 2016; Mazur et al., 2021, 2024, 2026; Jóźwiak et al. 2022).
Further constraints come from mantle-lithosphere structure. Recent seismological studies show that the Scandinavian Mid-Lithospheric Discontinuity (MLD), a hallmark of the stable cratonic mantle, continues southward beneath the Caledonides and even reaches the Bohemian Massif (Kind et al., 2025). This implies that craton-derived lithospheric mantle extends significantly farther southwest than traditionally assumed, supporting models of a EEC transition zone beneath the southwestern Baltic Sea. Additionally, recent tomography models reveal high-velocity mantle lithosphere beneath NE Germany and the Baltic Sea, consistent with craton-affinity lithosphere overstepping the surface trace of the TTZ (Vecsey et al., 2014; Zhu et al., 2015). In contrast, low-velocity zones and lithospheric thinning occur farther southwest beneath the Variscan front, indicating that the major lithosphere–asthenosphere transition lies well beyond the TTZ (Shomali et al., 2006; Janutyte et al., 2015; Knapmeyer-Endrun et al., 2017).
If the TTZ were indeed a sharp boundary of Baltica, we would expect a step change in crustal properties along NE–SW-trending seismic or potential field profiles. However, the gravity and magnetic modelling of BGR16-256 (Fig. 6) and related seismic data indicate a Moho at ∼ 40 km depth with a flat geometry. Although the Moho is locally shallower beneath the Mid-Polish Trough, this appears linked to basement subsidence and crustal thinning associated with Permian rifting and Mesozoic extension, as supported by the crystalline crust thickness map (Fig. 13).
In the Rønne Graben, by contrast, the Moho remains deep despite significant basement subsidence. This pattern, evident in seismic and gravity data (Figs. 8, 10, 12), implies that crustal thickening may have occurred after initial extension. One hypothesis is that the Rønne Graben formed as a pull-apart basin (Deeks and Thomas, 1995) or was influenced by horizontal shear in the lower crust that decoupled upper crustal extension from the deeper lithosphere (Yang et al., 2018). Alternatively, the area may have experienced crustal shortening and thickening during inversion, with lower crustal subversion accommodating compressive strain – a mechanism analogous to that proposed by the BABEL Working Group (1993).
Earlier interpretations of the DEKORP BASIN (PQ) profiles in the southern Baltic Sea suggested a relatively shallow Moho at 28–35 km depth (Krawczyk et al., 2002, their Fig. 10). In those models, the Moho was shown as broadly flat at ∼ 30 km on both sides of the STZ and TTZ (e.g., Bleibinhaus et al., 1999; Krawczyk et al., 2002; Meissner and Krawczyk, 1999). In contrast, our results place the Moho substantially deeper – at 35–41 km (Figs. 6–9, 12). Overall, the Moho surface is relatively flat, with the only notable gradient occurring along profile BGR16-257, where it shallows south-westward toward the axis of the Mid-Polish Anticlinorium (Figs. 9, 12). The deep Moho is independently supported by the BalTec seismic refraction profile (coincident with BGR16-212; Fig. 2), which crosses the southern Baltic Sea in a NE–SW orientation (Janik et al., 2022). Our results also generally agree with Moho depths reported along the BABEL A seismic profile (BABEL Working Group, 1993), although the BABEL data show a rougher Moho topography, including a prominent crustal keel beneath the STZ (BABEL Working Group, 1993, their Fig. 7).
An important new finding of this study is the consistent south- and south-eastward dip of both the top basement and the Moho observed on NW–SE trending profiles BGR16-202 and BGR16-259 (Fig. 5a, b). This trend is confirmed by depth-to-basement and Moho maps (Figs. 10, 12), and by the crystalline crust thickness model (Fig. 13). These features define a NE–SW-trending crustal zone separating thicker crust to the northwest from thinner crust to the southeast. This transition aligns with a major magnetic lineament (Fig. 3b) and lithological boundaries within the Precambrian basement (Fig. 11), suggesting a structural inheritance from the Precambrian architecture of the EEC. The orientation of this gradient zone is consistent with the general NE–SW structural grain of the East European Craton (Bogdanova et al., 2008) and is evident even west of the TTZ, extending as far as the island of Rügen (Fig. 10). This suggests that the transition is rooted in the Precambrian architecture of the EEC and likely represents the preserved signature of a long-lived structural grain formed during early Proterozoic crustal assembly. Similar NE–SW-striking basement domains and shear zones are documented in the adjacent part of the craton (Bogdanova et al., 2008), supporting the interpretation that the observed crustal step reflects inherited lithospheric heterogeneity rather than a Caledonian or younger tectonic boundary.
The most enigmatic structural issue concerns the tilting and erosion of Silurian strata observed on profiles BGR16-202 and BGR16-259 (Fig. 5a, b). On profile BGR16-202, the Silurian strata lie parallel to the tilted basement, indicating that they were rotated after deposition but before the Late Cretaceous deformation, as evidenced by the unconformity at the top of the Silurian. On profile BGR16-259, the Silurian units also initially follow the tilted basement but display internal unconformities in their upper parts, pointing to syn-sedimentary deformation. Where overlying Triassic strata is present, it seals the erosion surface, implying that tilting and erosion of the Silurian occurred before the Triassic. Low-temperature thermochronological data from the Baltic Basin (Botor et al., 2021) suggest a major phase of uplift during the early Carboniferous northeast of the CDF and Koszalin Fault. Whether this uplift was driven by fault reactivation or broad regional doming remains an open question.
This study provides a comprehensive seismic and structural interpretation of the crustal architecture beneath the southern Baltic Sea, highlighting the complex tectonic evolution of this region across multiple geological timescales. The structure of the upper crust has been shaped primarily by two dominant tectonic phases: Permian–Mesozoic extension and Late Cretaceous inversion. The extension phase led to the formation of significant sedimentary basins such as the Mid-Polish Trough and the Rønne Graben, which accumulated up to 4 km of sediments. These basins exhibit classical features of rift-related and post-rift subsidence, later overprinted by renewed extensional episodes.
The subsequent Late Cretaceous compressional phase triggered a thick-skinned inversion, resulting in the reactivation of earlier extensional faults and the development of new reversed faults. The inversion produced substantial vertical displacements (up to 2 km) and asymmetric marginal troughs with a consistent north-eastward vergence, indicating regionally directed transfer of compressional stresses. Importantly, the inversion propagated beyond the original Permian–Mesozoic depocentres, affecting the East European Platform margin northeast of the Christiansø Block.
Seismic profiles reveal that the CDF is a thin-skinned structure and the deformed lower Palaeozoic succession rapidly thickens westwards reflecting the geometry of the Caledonian accretionary wedge. Additionally, the presence of upper Palaeozoic strata is restricted to the western parts of the study area, west of the Koszalin Fault, documenting post-Caledonian rifting and subsequent Devonian–Carboniferous subsidence.
The study contributes to the ongoing debate regarding the southwestern limit of the EEC. Seismic and potential field data suggest that the EEC crust may extend farther southwest beyond the study area, with no clear indication of a sharp boundary along the Teisseyre-Tornquist Zone (TTZ). Instead, the observed Moho geometry is relatively flat and continuous across this zone, challenging models that propose a distinct cratonic plate boundary along the TTZ.
One of the key findings is the identification of a NE–SW-trending transition zone in crustal thickness and Moho depth, marking a structural gradient likely inherited from the Precambrian architecture of the EEC. Finally, evidence of tilted and eroded Silurian strata, sealed by Triassic cover, points to a significant pre-Triassic tectonic event – possibly early Carboniferous uplift – whose precise nature remains unresolved but may be linked to regional doming or fault reactivation.
Seismic interpretation was performed using GeoGraphix software (GVERSE GeoGraphix, 2025). 2.5-D gravity modeling was carried out with the XField plugin implemented in the commercial version of OpendTect (ARK CLS Ltd., 2025). Depth-to-Moho and depth-to-basement modeling were conducted using Oasis montaj (Seequent, 2025). All spatial datasets were compiled and managed within the ArcGIS platform (version 10.3; Esri, 2025).
Gravity and magnetic data were licensed from Getech Group plc (2024) and are commercially available from the supplier (https://getech.com/getech-explore, last access: 30 May 2024). Gridded datasets of depth to basement, depth to the Moho, and crustal thickness are provided in ASCII format in the Supplementary Material. The BalTec (MSM52) seismic data used in this study are available from the authors upon reasonable request.
The supplement related to this article is available online at https://doi.org/10.5194/se-17-85-2026-supplement.
M.P., conceptualization; M.M. and Q.N., data curation; formal analysis; M.M. and S.S., funding acquisition; M.P. and S.S., investigation; M.P., S.S. and S.M., methodology; S.M., project administration; M.P., M.M. and Q. N., resources; M.P., S.S. and M. M., software; S.M., supervision; S.S., S.M. and M.M., validation; M.P., S.S. and S.M., visualization; M.P., writing (original draft preparation); S.S. and S M., writing (review and editing).
At least one of the (co-)authors is a member of the editorial board of Solid Earth. The peer-review process was guided by an independent editor, and the authors also have no other competing interests to declare.
Publisher's note: Copernicus Publications remains neutral with regard to jurisdictional claims made in the text, published maps, institutional affiliations, or any other geographical representation in this paper. The authors bear the ultimate responsibility for providing appropriate place names. Views expressed in the text are those of the authors and do not necessarily reflect the views of the publisher.
This article is part of the special issue “Seismic imaging from the lithosphere to the near surface”. It is a result of the Seismix 2024 conference, Uppsala, Sweden, 24 to 28 June 2024.
Cruise MSM52 was funded by the German Research Foundation (DFG) and the Federal Ministry of Education and Research (BMBF). We thank the Federal Institute for Geosciences and Natural Resources (BGR) for granting access to the seismic data acquired during cruise MSM52, as well as for their support during data acquisition and for facilitating data sharing. We are also grateful to the Anonymous Reviewers and the Guest Editor, Christopher Juhlin, whose constructive comments significantly improved the quality of the manuscript.
This research has been supported by the Narodowe Centrum Nauki (grant no. UMO-2021/43/B/ST10/01392).
This paper was edited by Christopher Juhlin and reviewed by two anonymous referees.
Aichroth, B., Prodehl, C., and Thybo, H.: Crustal structure along the central segment of the EGT from seismic-refraction studies, Tectonophysics, 207, 43–64, https://doi.org/10.1016/0040-1951(92)90471-H, 1992.
Al Hseinat, M. and Hübscher, C.: Late Cretaceous to recent tectonic evolution of the North German Basin and the transition zone to the Baltic Shield/southwest Baltic Sea, Tectonophysics, 708, 28–55, https://doi.org/10.1016/j.tecto.2017.04.021, 2017.
ARK CLS Ltd.: XField modelling package [software], https://arkcls.com/software/xfield, last access: 29 May 2025.
BABEL Working Group: Deep seismic survey images the structure of the Tornquist Zone beneath the Southern Baltic Sea, Geophys. Res. Lett., 18, 1091–1094, https://doi.org/10.1029/91GL00847, 1991.
BABEL Working Group: Deep seismic reflection/refraction interpretation of critical structure along BABEL profiles A and B in the southern Baltic Sea, Geophys. J. Int., 112, 325–343, https://doi.org/10.1111/j.1365-246X.1993.tb01173.x, 1993.
Babuška, V. and Plomerová, J.: The Sorgenfrei–Tornquist Zone as the mantle edge of Baltica lithosphere: new evidence from three-dimensional seismic anisotropy, Terra Nova, 16, 243–249, https://doi.org/10.1111/j.1365-3121.2004.00558.x, 2004.
Bayer, U., Grad, M., Pharaoh, T. C., Thybo, H., Guterch, A., Banka, D., Lamarche, J., Lassen, A., Lewerenz, B., Scheck, M., and Marotta, A. M.: The southern margin of the east European Craton: new results from seismic sounding and potential fields between the North Sea and Poland, Tectonophysics, 360, 301–314, https://doi.org/10.1016/S0040-1951(02)00359-1, 2002.
Berthelsen, A.: Mobile Europe, in: The European Geotraverse: A Continent Revealed, edited by: Blundell, D., Freeman, R., and Mueller, S., Cambridge University Press, Cambridge, 153–164, ISBN-13 978-0-521-42948-1, 1992.
Berthelsen, A.: The Tornquist Zone northwest of the Carpathians: an intraplate pseudosuture, GFF, 120, 223–230, https://doi.org/10.1080/11035899801202223, 1998.
Bleibinhaus, F., Beilecke, T., Bram, K., and Gebrande, H.: A seismic velocity model for the SW Baltic Sea derived from BASIN'96 refraction seismic data, Tectonophysics, 314, 269–283, https://doi.org/10.1016/S0040-1951(99)00248-6, 1999.
Bogdanova, S. V., Bingen, B., Gorbatschev, R., Kheraskova, T. N., Kozlov, V. I., Puchkov, V. N., and Volozh, Y. A.: The East European Craton (Baltica) before and during the assembly of Rodinia, Precambrian Res., 160, 23–45, https://doi.org/10.1016/j.precamres.2007.04.024, 2008.
Botor, D., Mazur, S., Anczkiewicz, A. A., Dunkl, I., and Golonka, J.: Thermal history of the East European Platform margin in Poland based on apatite and zircon low-temperature thermochronology, Solid Earth, 12, 1899–1930, https://doi.org/10.5194/se-12-1899-2021, 2021.
Brocher, T. M.: Empirical relations between elastic wave speeds and density in the Earth's crust, Bull. Seismol. Soc. Am., 95, 2081–2092, https://doi.org/10.1785/0120050077, 2005.
Central Geological Database: Polish Geological Institute, http://baza.pgi.gov.pl/ (last access: 30 May 2025), 2022.
Cocks, L. R. M. and Fortey, R. A.: Avalonia: a long-lived terrane in the Lower Palaeozoic?, in: Early Palaeozoic Peri-Gondwana Terranes: New Insights from Tectonics and Biogeography, edited by: Bassett, M. G., Geol. Soc., London, Spec. Publ., 325, 141–156, https://doi.org/10.1144/SP325.7, 2009.
Cordell, L. and Henderson, R.: Iterative three-dimensional solution of gravity anomaly data using a digital computer, Geophysics, 33, 596–601, https://doi.org/10.1190/1.1439955, 1968.
Cotte, N., Pedersen, H. A., and TOR Working Group: Sharp contrast in lithospheric structure across the Sorgenfrei–Tornquist Zone as inferred by Rayleigh wave analysis of TOR1 project data, Tectonophysics, 360, 75–88, https://doi.org/10.1016/S0040-1951(02)00348-7, 2002.
Dadlez, R.: Pre-Cainozoic tectonics of the southern Baltic Sea, Geol. Quart., 37, 431–450, 1993.
Dadlez, R., Kowalczewski, Z., and Znosko, J.: Some key problems of the pre-Permian tectonics of Poland, Geol. Quart., 38, 169–189, 1994.
Dadlez, R., Grad, M., and Guterch, A.: Crustal structure below the Polish Basin: is it composed of proximal terranes derived from Baltica?, Tectonophysics, 411, 111–128, https://doi.org/10.1016/j.tecto.2005.09.004, 2005.
Dallmeyer, R. D., Giese, U., Glasmacher, U., and Pickel, W.: First 40Ar/39Ar age constraints for the Caledonian evolution of the Trans–European Suture Zone in NE Germany, J. Geol. Soc., 156, 279–290, https://doi.org/10.1144/gsjgs.156.2.0279, 1999.
Deeks, N. R. and Thomas, S. A.: Basin inversion in strike-slip regime, the Tornquist Zone, Southern Baltic Sea, in: Basin Inversion, edited by: Buchanan, J. G. and Buchanan, P. G., Geol. Soc. Spec. Publ., 88, 319–338, https://doi.org/10.1144/GSL.SP.1995.088.01.18, 1995.
DEKORP-BASIN Research Group: Survey provides seismic insights into an old suture zone, EOS, 79, 151–159, https://doi.org/10.1029/98EO00113, 1998.
DEKORP-BASIN Research Group: Deep crustal structure of the Northeast German basin: New DEKORP-BASIN '96 deep profiling results, Geology, 27, 55–58, https://doi.org/10.1130/0091-7613(1999)027<0055:DCSOTN>2.3.CO;2, 1999.
Erlström, M., Thomas, S. A., Deeks, N., and Sivhed, U.: Structure and tectonic evolution of the Tornquist Zone and adjacent sedimentary basins in Scania and the southern Baltic Sea area, Tectonophysics, 271, 191–215, https://doi.org/10.1016/S0040-1951(96)00247-8, 1997.
Esri: ArcGIS platform (version 10.3) [software], https://www.esri.com/en‐us/home (last access: 27 February 2025), 2025.
EUGENO-S Working Group: Crustal structure and tectonic evaluation of the transition between the Baltic Shield and the North German Caledonides (The EUGENO-S Project), Tectonophysics, 150, 253–348, https://doi.org/10.1016/0040-1951(88)90073-X, 1988.
Fletcher, K. M. U., Fairhead, J. D., Salem, A., Lei, K., Ayala, C., and Cabanillas, P. L. M.: Building a higher resolution magnetic database for Europe for resource evaluation, First Break, 29, 41–47, https://doi.org/10.3997/1365-2397.29.4.49508, 2011.
Franke, D.: The Caledonian terranes along the south-western border of the East European Platform – Evidence, speculation and open questions, Stud. Geophys. Geod., 39, 241–256, https://doi.org/10.1007/BF02295815, 1995.
Getech Group plc.: Getech's Multi‐Sat satellite altimetry‐derived gravity product and Getech's Baltic Sea magnetic data compilation, Services & Support [data set], https://getech.com/getech‐explore/services‐support, last access: 30 May 2024.
Gossler, J., Kind, R., Sobolev, S. V., Kämpf, H., Wylegalla, K., Stiller, M., and TOR Working Group: Major crustal features between the Harz Mountains and the Baltic Shield derived from receiver functions, Tectonophysics, 314, 321–333, https://doi.org/10.1016/S0040-1951(99)00251-6, 1999.
Grad, M. and Polkowski, M.: Seismic basement in Poland, Int. J. Earth Sci., 105, 1199–1214, https://doi.org/10.1007/s00531-015-1233-8, 2016.
Graversen, O.: Upper Triassic–Cretaceous stratigraphy and structural inversion offshore SW Bornholm, Tornquist Zone, Denmark, Bull. Geol. Soc. Denmark, 51, 111–136, https://doi.org/10.37570/bgsd-2004-51-08, 2004.
Guterch, A. and Grad, M.: Lithospheric structure of the TESZ in Poland based on modern seismic experiments, Geol. Quart., 50, 23–32, 2006.
Guterch, A., Wybraniec, S., Grad, M., Chadwick, R. A., Krawczyk, C. M., Ziegler, P. A., Thybo, H., and De Vos, W.: Crustal structure and structural framework, in: Petroleum Geological Atlas of the Southern Permian Basin Area, edited by: Doornenbal, J. C. and Stevenson, A. G., EAGE Publications, Houten, 11–23, ISBN 978-90-73781-61-0, 2010.
GVERSE GeoGraphix: GVERSE geophysics [software], https://www.gverse.com/ProductPackages/geophysics (last access: on 29 May 2024), 2024.
Hansen, D. L., Nielsen, S. B., and Lykke-Andersen, H.: The post-Triassic evolution of the Sorgenfrei–Tornquist Zone – results from thermo-mechanical modelling, Tectonophysics, 328, 245–267, https://doi.org/10.1016/S0040-1951(00)00216-X, 2000.
Hansen, M. and Poulsen, V.: Geologi på Bornholm, Ekskursionsfører nr. 1, VARV, Copenhagen, 96 pp., ISBN 87-87624-05-2, 1977.
Hübscher, C., Ahlrichs, H., Allum, G., Behrens, T., Bülow, J., Krawczyk, C., Damm, V., Demir, Ü., Engels, M., Frahm, L., Grzyb, G., Hahn, B., Heyde, I., Juhlin, C., Knevels, K., Lange, G., Bruun Lydersen, I., Malinowski, M., Noack, V., Preine, J., Rampersad, K., Schnabel, M., Seidel, E., Sopher, D., Stakemann, Jo., and Stakemann, Ja.: BalTec – Cruise No. MSM52 – March 1 – March 28, 2016 – Rostock (Germany) – Kiel (Germany), MARIA S. MERIAN-Berichte, MSM52, DFG Senatskommission für Ozeanographie, 46 pp., https://doi.org/10.2312/cr_msm52, 2017.
Janik, T., Wójcik, D., Ponikowska, M., Mazur, S., Skrzynik, T., Malinowski, M., and Hübscher, C.: Crustal structure across the Teisseyre-Tornquist Zone offshore Poland based on a new refraction/wide-angle reflection profile and potential field modelling, Tectonophysics, 828, 229271, https://doi.org/10.1016/j.tecto.2022.229271, 2022.
Janutyte, I., Majdanski, M., Voss, P. H., Kozlovskaya, E., and PASSEQ Working Group: Upper mantle structure around the Trans-European Suture Zone obtained by teleseismic tomography, Solid Earth, 6, 73–91, https://doi.org/10.5194/se-6-73-2015, 2015.
Jaworowski, K., Wagner, R., Modliński, Z., Pokorski, J., Sokołowski, J., and Sokołowski, A.: Marine ecogeology in semi-closed basin: Case study on a threat of geogenic pollution of the southern Baltic Sea (Polish Exclusive Economic Zone), Geol. Q., 54, 267–288, 2010.
Jóźwiak, W., Nowożyński, K., Mazur, S., and Jeż, M.: Deep Electrical Resistivity Structure of the European Lithosphere in Poland Derived from 3-D Inversion of Magnetotelluric Data, Surv. Geophys., 43, 1563–1586, https://doi.org/10.1007/s10712-022-09716-1, 2022.
Katzung, G., Giese, U., Walter, R., and Von Winterfeld, C.: The Rügen Caledonides, northeast Germany, Geol. Mag., 130, 725–730, https://doi.org/10.1017/S0016756800021038, 1993.
Kind, R., Yuan, X. and Schiffer, C.: Seismic images of the collision of Central European Terranes, Geophysical Journal International, 242, ggaf150, https://doi.org/10.1093/gji/ggaf150, 2025.
Knapmeyer-Endrun, B., Krüger, F., Geissler, W. H., and PASSEQ Working Group: Upper mantle structure across the Trans-European Suture Zone imaged by S-receiver functions. Earth and Planetary Science Letters, 458, 429–441, https://doi.org/10.1016/j.epsl.2016.11.011, 2017.
Kramarska, R., Krzywiec, P., Dadlez, R., Jegliński, W., Papiernik, B., Przezdziecki, P., and Zientara, P.: Geological map of the Baltic Sea bottom without Quaternary deposits, scale 1 : 500 000, Państwowy Instytut Geologiczny, Warsaw, 1999.
Krawczyk, C. M., Stiller, M., and DEKORP-BASIN Research Group: Reflection seismic constraints on Paleozoic crustal structure and Moho beneath the NE German Basin, Tectonophysics, 314, 241–253, https://doi.org/10.1016/S0040-1951(99)00246-2, 1999.
Krawczyk, C. M., Eilts, F., Lassen, A., and Thybo, H.: Seismic evidence of Caledonian deformed crust and uppermost mantle structures in the northern part of the Trans-European Suture Zone, SW Baltic Sea, Tectonophysics, 360, 215–244, https://doi.org/10.1016/S0040-1951(02)00355-4, 2002.
Krzemińska, E., Krzemiński, L., Petecki, W. Z., Wiszniewska, J., Salwa, S., Żaba, J. M., Gaidzik, K., Williams, I. S., Rosowiecka, O., Taran, L., Johansson, A., Pecskay, Z., Demaiffe, D., Grabowski, J., and Zieliński, G.: Geological map of the crystalline basement of the Polish part of the East European Platform, scale 1 : 1 000 000, sheet and explanatory notes, Polish Geological Institute – National Research Institute, Warsaw, ISBN 978-83-7863-775-2, 2017.
Krzywiec, P.: Mid-Polish Trough inversion – seismic examples, main mechanisms, and its relationship to the Alpine-Carpathian collision, Stephan Mueller Spec. Publ. Ser., 1, 151–165, https://doi.org/10.5194/smsps-1-151-2002, 2002.
Krzywiec, P., Kramarska, R., and Zientara, P.: Strike-slip tectonics within the SW Baltic Sea and its relationship to the inversion of the Mid-Polish Trough – evidence from high-resolution seismic data, Tectonophysics, 373, 93–105, https://doi.org/10.1016/S0040-1951(03)00286-5, 2003.
Krzywiec, P., Kufrasa, M., Poprawa, P., Mazur, S., Koperska, M., and Ślemp, P.: Together but separate: decoupled Variscan (late Carboniferous) and Alpine (Late Cretaceous–Paleogene) inversion tectonics in NW Poland, Solid Earth, 13, 639–658, https://doi.org/10.5194/se-13-639-2022, 2022.
Lassen, N. A., Thybo, H., and Berthelsen, A.: Reflection seismic evidence for Caledonian deformed sediments above Sveconorwegian basement in the southwestern Baltic Sea, Tectonics, 20, 268–276, https://doi.org/10.1029/2000TC900028, 2001.
Liboriussen, J., Ashton, P., and Tygesen, T.: The tectonic evolution of the Fennoscandian Border Zone in Denmark, Tectonophysics, 137, 21–29, https://doi.org/10.1016/0040-1951(87)90310-6, 1987.
Ludwig, W. J., Nafe, J. E., and Drake, C. L.: Seismic refraction, in: The Sea, Volume 4A: New Concepts of Sea Floor Evolution (Part 1), edited by: Maxwell, A. E., John Wiley & Sons / Interscience, New York, ISBN-13 978-0674017313, 53–84 pp., 1970.
MacLeod, I. N., Jones, K., and Dai, T. F.: 3-D analytic signal in the interpretation of total magnetic field data at low magnetic latitudes, Explor. Geophys., 24, 679–691, https://doi.org/10.1071/EG993679, 1993.
Makris, J. and Wang, S.-R.: Crustal structure at the Tornquist-Teisseyre zone in the Southern Baltic Sea, Z. Geol. Wiss., 22, 47–54, 1994.
Maystrenko, Y., Bayer, U., Brink, H.-J., and Littke, R.: The central European Basin System – An Overview, in: Dynamics of Complex Sedimentary Basins. The Example of the Central European Basin System, edited by: Littke, R., Bayer, U., Gajewski, D., and Nelskamp, S., Springer-Verlag, Berlin-Heidelberg, 15–34, https://doi.org/10.1007/978-3-540-85085-4_2, 2008.
Maystrenko, Y. P. and Scheck-Wenderoth, M.: 3D lithosphere-scale density model of the central European Basin System and adjacent areas, Tectonophysics, 601, 53–77, https://doi.org/10.1016/j.tecto.2013.04.023, 2013.
Mazur, S., Mikolajczak, M., Krzywiec, P., Malinowski, M., Buffenmyer, V., and Lewandowski, M.: Is the Teisseyre-Tornquist Zone an ancient plate boundary of Baltica?, Tectonics, 34, 2465–2477, https://doi.org/10.1002/2015TC003934, 2015.
Mazur, S., Mikołajczak, M., Krzywiec, P., Malinowski, M., Buffenmyer, V., and Lewandowski, M.: Reply to Comment by M. Narkiewicz and Z. Petecki on “Is the Teisseyre-Tornquist Zone an ancient plate boundary of Baltica?”, Tectonics, 35, 1600–1607, https://doi.org/10.1002/2016TC004127, 2016a.
Mazur, S., Mikolajczak, M., Krzywiec, P., Malinowski, M., Lewandowski, M., and Buffenmyer, V.: Pomeranian Caledonides, NW Poland – a collisional suture or thin-skinned fold-and-thrust belt?, Tectonophysics, 692, 29–43, https://doi.org/10.1016/j.tecto.2016.06.017, 2016b.
Mazur, S., Porębski, S. J., Kędzior, A., Paszkowski, M., Podhalańska, T., and Poprawa, P.: Refined timing and kinematics for Baltica–Avalonia convergence based on the sedimentary record of a foreland basin, Terra Nova, 30, 8–16, https://doi.org/10.1111/ter.12302, 2018.
Mazur, S., Malinowski, M., Maystrenko, Y. P., and Gągała, Ł.: Pre-existing lithospheric weak zone and its impact on continental rifting – the Mid-Polish Trough, Central European Basin System, Global Planetary Change, 198, 103417, https://doi.org/10.1016/j.gloplacha.2021.103417, 2021.
Mazur, S., Jóźwiak, W., Nowożyński, K., and Oryński, S.: Magnetotelluric evidence for long-lasting crustal memory in an intraplate setting–the Grójec Fault and Mid-Polish Trough in central Poland, Tectonophysics, 873, 230213, https://doi.org/10.1016/j.tecto.2024.230213, 2024.
Mazur, S., Schiffer, C., Majka, J., and Stephenson, R.: The German-Polish Caledonides Revisited: Insights from the Potential Field Data, in: Structure and Evolution of Laurussian Orogens in Europe and North America from Geophysical Investigations, edited by: Ben-Mansour, W., Schiffer, C., and Gradmann, S., Geological Society, London, Special Publications, 557, https://doi.org/10.1144/SP557-2025-4, 2026.
Meissner, R. and Krawczyk, C. M.: Caledonian and Proterozoic terrane accretion in the South-West Baltic Sea, Tectonophysics, 314, 255–267, https://doi.org/10.1016/S0040-1951(99)00247-4, 1999.
Mikołajczak, M., Mazur, S., and Gągała, Ł.: Depth-to-basement for the east European Craton and Teisseyre-Tornquist Zone in Poland based on potential field data, Int. J. Earth Sci., 108, 547–567, https://doi.org/10.1007/s00531-018-1668-9, 2019.
Modliński, Z. and Podhalańska, T.: Outline of the lithology and depositional features of the lower Paleozoic strata in the Polish part of the Baltic region, Geol. Quart., 54, 109–121, 2010.
Mogensen, T. E.: Palaeozoic structural development along the Tornquist Zone, Kattegat area, Denmark, Tectonophysics, 240, 191–214, https://doi.org/10.1016/0040-1951(94)90272-0, 1994.
Narkiewicz, M., Maksym, A., Malinowski, M., Grad, M., Guterch, A., Petecki, Z., Probulski, J., Janik, T., Majdański, M., Środa, P., Czuba, W., Gaczyński, E., and Jankowski, L.: Transcurrent nature of the Teisseyre–Tornquist Zone in Central Europe: results of the POLCRUST-01 deep reflection seismic profile, Int. J. Earth Sci., 104, 775–796, https://doi.org/10.1007/s00531-014-1116-4, 2015.
Nguyen, Q., Malinowski, M., Mazur, S., Stovba, S., Ponikowska, M., and Hübscher, C.: Post-Caledonian tectonic evolution of the Precambrian and Paleozoic platform boundary zone offshore Poland based on the new and vintage multi-channel reflection seismic data, Solid Earth, 15, 1029–1046, https://doi.org/10.5194/se-15-1029-2024, 2024.
Pan, Y., Seidel, E., Juhlin, C., Hübscher, C., and Sopher, D.: Inversion tectonics in the Sorgenfrei–Tornquist Zone: insight from new marine seismic data at the Bornholm Gat, SW Baltic Sea, GFF, 144, 71–88, https://doi.org/10.1080/11035897.2022.2071335, 2022.
Petecki, Z.: Gravity and magnetic modelling along the seismic LT-7 profile, Prz. Geol., 50, 630–633, 2002 (in Polish, English summary).
Pharaoh, T. C.: Palaeozoic terranes and their lithospheric boundaries within the Trans-European Suture Zone (TESZ): a review, Tectonophysics, 314, 17–41, https://doi.org/10.1016/S0040-1951(99)00235-8, 1999.
Piske, J., Rasch, H.-J., Neumann, E., and Zagora, K.: Geologischer Bau und Entwicklung des Präperms der Insel Rügen und des angrenzenden Seegebietes, Z. Dt. Ges. Geowiss., 22, 212–226, 1994.
Pokorski, J.: Geological section through the lower Paleozoic strata of the Polish part of the Baltic region, Geol. Q., 54, 123–130, 2010.
Ponikowska, M., Stovba, S. M., Mazur, S., Malinowski, M., Krzywiec, P., Nguyen, Q., and Hübscher, C.: Crustal-scale pop-up structure at the junction of two continental-scale deformation zones in the southern Baltic Sea, Tectonics, 43, e2023TC008066, https://doi.org/10.1029/2023TC008066, 2024.
Poprawa, P., Šliaupa, S., Stephenson, R., and Lazauskienė, J.: Late Vendian–Early Palaeozoic tectonic evolution of the Baltic Basin: regional tectonic implications from subsidence analysis, Tectonophysics, 314, 219–239, https://doi.org/10.1016/S0040-1951(99)00245-0, 1999.
Schlüter, D., Jürgens, D., Best, G., Binot, F., and Stamme, H.: Analyse geologischer und geophysikalischer Daten aus der südlichen Ostsee – Strukturatlas südliche Ostsee (SASO; engl: Analysis of geological and geophysical data from the southern Baltic Sea – Structural Atlas of the Southern Baltic Sea), Berlin, Hannover, Germany, 1997.
Seequent: Oasis montaj – geophysical modelling and analysis [software], https://www.seequent.com/products-solutions/geosoft-oasis-montaj/ (last access: 30 May 2025), 2024.
Seidel, E., Meschede, M., and Obst, K.: The Wiek Fault System east of Rügen Island: Origin, tectonic phases and its relationship to the Trans-European Suture Zone, in: Mesozoic Resource Potential in the Southern Permian Basin, edited by: Kilhams, B., Kukla, P. A., Mazur, S., McKie, T., Mijnlieff, H. F., and van Ojik, K., Geol. Soc. Lond., Spec. Publ., 469, 59–82, https://doi.org/10.1144/SP469.10, 2018.
Shomali, Z. H., Roberts, R. G., Pedersen, L. B., and TOR Working Group: Lithospheric structure of the Tornquist Zone resolved by nonlinear P and S teleseismic tomography along the TOR array, Tectonophysics, 416, 133–149, https://doi.org/10.1016/j.tecto.2005.11.019, 2006.
Smit, J., van Wees, J. D., and Cloetingh, S.: The Thor suture zone: from subduction to intraplate basin setting, Geology, 44, 707–710, https://doi.org/10.1130/G37958.1, 2016.
Smit, J., van Wees, J. D., and Cloetingh, S.: Early Carboniferous extension in East Avalonia: 350 my record of lithospheric memory, Mar. Pet. Geol., 92, 1010–1027, https://doi.org/10.1016/j.marpetgeo.2018.01.004, 2018.
Sopher, D., Erlström, M., Bell, N., and Juhlin, C.: The structure and stratigraphy of the sedimentary succession in the Swedish sector of the Baltic Basin: new insights from vintage 2D marine seismic data, Tectonophysics, 676, 90–111, https://doi.org/10.1016/j.tecto.2016.03.012, 2016.
Stephenson, R., Schiffer, C., Peace, A., Nielsen, S. B., and Jess, S.: Late Cretaceous-Cenozoic basin inversion and palaeostress fields in the North Atlantic-western Alpine-Tethys realm: implications for intraplate tectonics, Earth-Science Reviews, 210, 103252, https://doi.org/10.1016/j.earscirev.2020.103252, 2020.
Talwani, M., Worzel, J. L., and Landisman, M.: Rapid gravity computations for two-dimensional bodies with application to the Mendocino submarine fracture zone, J. Geophys. Res., 64, 49–59, https://doi.org/10.1029/JZ064i001p00049, 1959.
Tanner, B. and Meissner, R.: Caledonian deformation upon southwest Baltica and its tectonic implications: alternatives and consequences, Tectonics, 15, 803–812, https://doi.org/10.1029/95TC03686, 1996.
Thybo, H.: Crustal structure and tectonic evolution of the Tornquist Fan region as revealed by geophysical methods, Bull. Geol. Soc. Denmark, 46, 145–160, 2000.
Thybo, H.: Crustal structure along the EGT profile across the Tornquist Fan interpreted from seismic, gravity and magnetic data, Tectonophysics, 334, 155–190, https://doi.org/10.1016/S0040-1951(01)00055-5, 2001.
Thybo, H., Abramovitz, T., Lassen, A., and Schjøth, F.: Deep structure of the Sorgenfrei-Tornquist zone interpreted from BABEL seismic data, Z. Geol. Wiss., 22, 3–17, 1994.
Torsvik, T. H. and Rehnström, E. F.: The Tornquist Sea and Baltica–Avalonia docking, Tectonophysics, 362, 67–82, https://doi.org/10.1016/S0040-1951(02)00631-5, 2003.
van Wees, J. D., Stephenson, R. A., Ziegler, P. A., Bayer, U., McCann, T., Dadlez, R., Gaupp, R., Narkiewicz, M., Bitzer, F., and Scheck, M.: On the origin of the Southern Permian Basin, Central Europe, Mar. Pet. Geol., 17, 43–59, https://doi.org/10.1016/S0264-8172(99)00052-5, 2000.
Vecsey, L., Plomerová, J., and Babuška, V.: Mantle lithosphere transition from the East European Craton to the Variscan Bohemian Massif imaged by shear-wave splitting, Solid Earth, 5, 779–792, https://doi.org/10.5194/se-5-779-2014, 2014.
Vejbæk, O. V., Stouge, S., and Poulsen, K. D.: Palaeozoic tectonic and sedimentary evolution and hydrocarbon prospectivity in the Bomholm area, Danmarks Geol. Undersøgelse, A34, 1–23, 1994.
Wernicke, B.: Uniform-sense normal simple shear of the continental lithosphere, Can. J. Earth Sci., 22, 108–125, https://doi.org/10.1139/e85-009, 1985.
Yang, H., Chemia, Z., Artemieva, I. M., and Thybo, H.: Control on off-rift magmatism: a case study of the Baikal Rift Zone, Earth Planet. Sci. Lett., 482, 501–509, https://doi.org/10.1016/j.epsl.2017.11.040, 2018.
Zhu, H., Bozdăg, E., and Tromp, J.: Seismic structure of the European upper mantle based on adjoint tomography, Geophys. J. Int., 201, 18–52, https://doi.org/10.1093/gji/ggu492, 2015.
- Abstract
- Introduction
- Geological setting and previous studies
- Data
- Methods
- Results and interpretation
- Discussion
- Conclusions
- Code availability
- Data availability
- Author contributions
- Competing interests
- Disclaimer
- Special issue statement
- Acknowledgements
- Financial support
- Review statement
- References
- Supplement