the Creative Commons Attribution 4.0 License.
the Creative Commons Attribution 4.0 License.
 | 20 Nov 2025
Uncovering the deep structure of the Koillismaa Layered Intrusion Complex, Finland using a novel 3D seismic survey
Michał Malinowski
Tuomo Karinen
Uula Autio
Suvi Heinonen
Brij Singh
Andrzej Górszczyk
Łukasz Sito
A pioneering ∼22 km2 three-dimensional (3D) seismic survey was conducted in northeastern Finland within the SEEMS DEEP project to investigate the concealed Koillismaa Deep Intrusion (KDI), part of the 2.5–2.4 Ga Koillismaa–Näränkävaara Layered Intrusion Complex (KLIC). Utilizing low-cost piezoelectric nimble nodes and a single Vibroseis source, this survey represents one of the first 3D seismic investigations of a deep layered intrusion and its feeder system. The seismic data, supported by petrophysical measurements and synthetic modelling, reveal a complex internal architecture characterized by coherent reflectivity patterns indicative of modal layering. Interpretation suggests that the KDI is not a simple feeder but a more developed, chonolithic or funnel-tube-shaped intrusion. Integration of seismic data interpretation with gravity inversion and geological data enabled the construction of a Common Earth Model (CEM), which successfully reproduces the observed gravity anomaly. A major thrust fault, likely associated with the Oulujärvi Shear Zone, was imaged for the first time, offering new insights into the tectonic evolution and mineralization potential of the region. This study highlights the advances in 3D seismic methods in hardrock environment and establishes a methodological framework for future mineral exploration in similar geological settings.
- Article
(18471 KB) - Full-text XML
- BibTeX
- EndNote


The application of seismic methods in mineral exploration within hardrock environments has gained considerable momentum in recent years (Malehmir et al., 2012a). This shift is largely driven by the increasing need to explore deeper and in more structurally complex geological settings, where traditional geophysical techniques (e.g., potential fields, various electromagnetic methods) often fall short. Three-dimensional (3D) seismic surveys have become indispensable for delivering high-resolution images of the subsurface and for identifying potential drilling targets. Notable 3D seismic projects have been conducted in Canada (Bellefleur et al., 2015; White et al., 2012), South Africa (Manzi et al., 2012), Finland (Malehmir et al., 2012b), Sweden (Malehmir et al., 2021), Portugal (Yavuz et al., 2015), and Australia (Schijns et al., 2023; Ziramov et al., 2023), demonstrating the effectiveness of this technology in generating direct exploration targets (White et al., 2016). Technological advances originally developed for the oil and gas industry – such as high-channel-count nodal sensors and single-receiver, single-source acquisition – are now being successfully adapted for mineral exploration (Ziramov et al., 2023).
In this context, we present the results of a novel ∼22 km2 3D seismic survey conducted in northeastern Finland as part of the SEEMS DEEP project (Autio et al., 2024), aimed at imaging the Koillismaa–Näränkävaara Layered Intrusion Complex (KLIC). Utilizing low-cost piezoelectric Stryde nimble nodal system (Ourabah and Chatenay, 2022) in a single-point configuration, this survey represents one of the first 3D seismic investigations of a layered intrusion and its feeder system at depths exceeding 1 km. The KLIC, part of the 2.5–2.4 Ga mafic-ultramafic layered intrusions of the Fennoscandian Shield (Karinen, 2010), is globally recognized for its potential to host economically significant mineral deposits, including Ni-Cu-Co-PGE and V-Ti-Fe mineralization. The complex is expressed as a ∼50 km long gravity anomaly, initially investigated in 2020 by the Geological Survey of Finland (GTK) through a ∼1.7 km deep drillhole, which intersected the intrusion at a depth of ∼1.4 km (referred to as the Koillismaa Deep Intrusion, KDI; Tirroniemi et al., 2024). Subsequent Distributed Acoustic Sensing (DAS) – Vertical Seismic Profiling (VSP) survey confirmed internal reflectivity within the KDI (Malinowski et al., 2023), validating the use of seismic methods for imaging the KLIC.
We begin by establishing the geological and petrophysical framework of the KLIC, utilizing the data from the Koillismaa deep drillhole and representative stratigraphy from the exposed sections. We then describe the design, acquisition, and processing of the SEEMS DEEP 3D seismic survey. One of the highlights of this study is the successful use of 5D data interpolation to regularize the data prior to pre-stack time migration, contributing to improved migrated data quality. To our knowledge, this process was not extensively tested in case of hardrock seismic data. The resulting seismic volume, interpreted alongside synthetic modelling and gravity data, reveals a complex internal architecture of KDI and forms the basis for a new Common Earth Model (CEM) (McGaughey, 2006) of the region. Our findings challenge the long-standing interpretation of the KDI as a simple feeder system and support its reinterpretation as a more evolved, chonolithic or funnel-shaped layered intrusion. These results not only advance our understanding of the KLIC but also demonstrate the power of 3D seismic imaging in hardrock environments, with implications for tectonic reconstruction and mineral exploration.
The Fennoscandian Shield hosts numerous ∼2.51–2.43 Ga mafic-ultramafic layered intrusions, formed during a major magmatic episode associated with the breakup of one or more Archaean cratons (Bleeker and Ernst, 2006; Ciborowski et al., 2015; Heaman, 1997; Köykkä et al., 2019; Skyttä et al., 2019). In Finland, most of these intrusions are located within the 2.44 Ga Tornio–Näränkävaara Belt (TNB; Alapieti and Lahtinen, 2002; Fig. 1a), a region of high economic interest due to known orthomagmatic PGE-Cu-Ni, V-Fe-Ti, and Cr mineralization. The TNB lies along the contact between the Archaean basement and the overlying Palaeoproterozoic greenstone and schist belts, extending from the Finnish–Swedish border to the Finnish–Russian border. The magmatism in the TNB, along with other 2.51–2.43 Ga intrusions in Fennoscandia, is now interpreted as part of an early rift-basin development episode, characterized by bimodal magmatism linked to the breakup of an Archaean supercontinent (Köykkä et al., 2019).
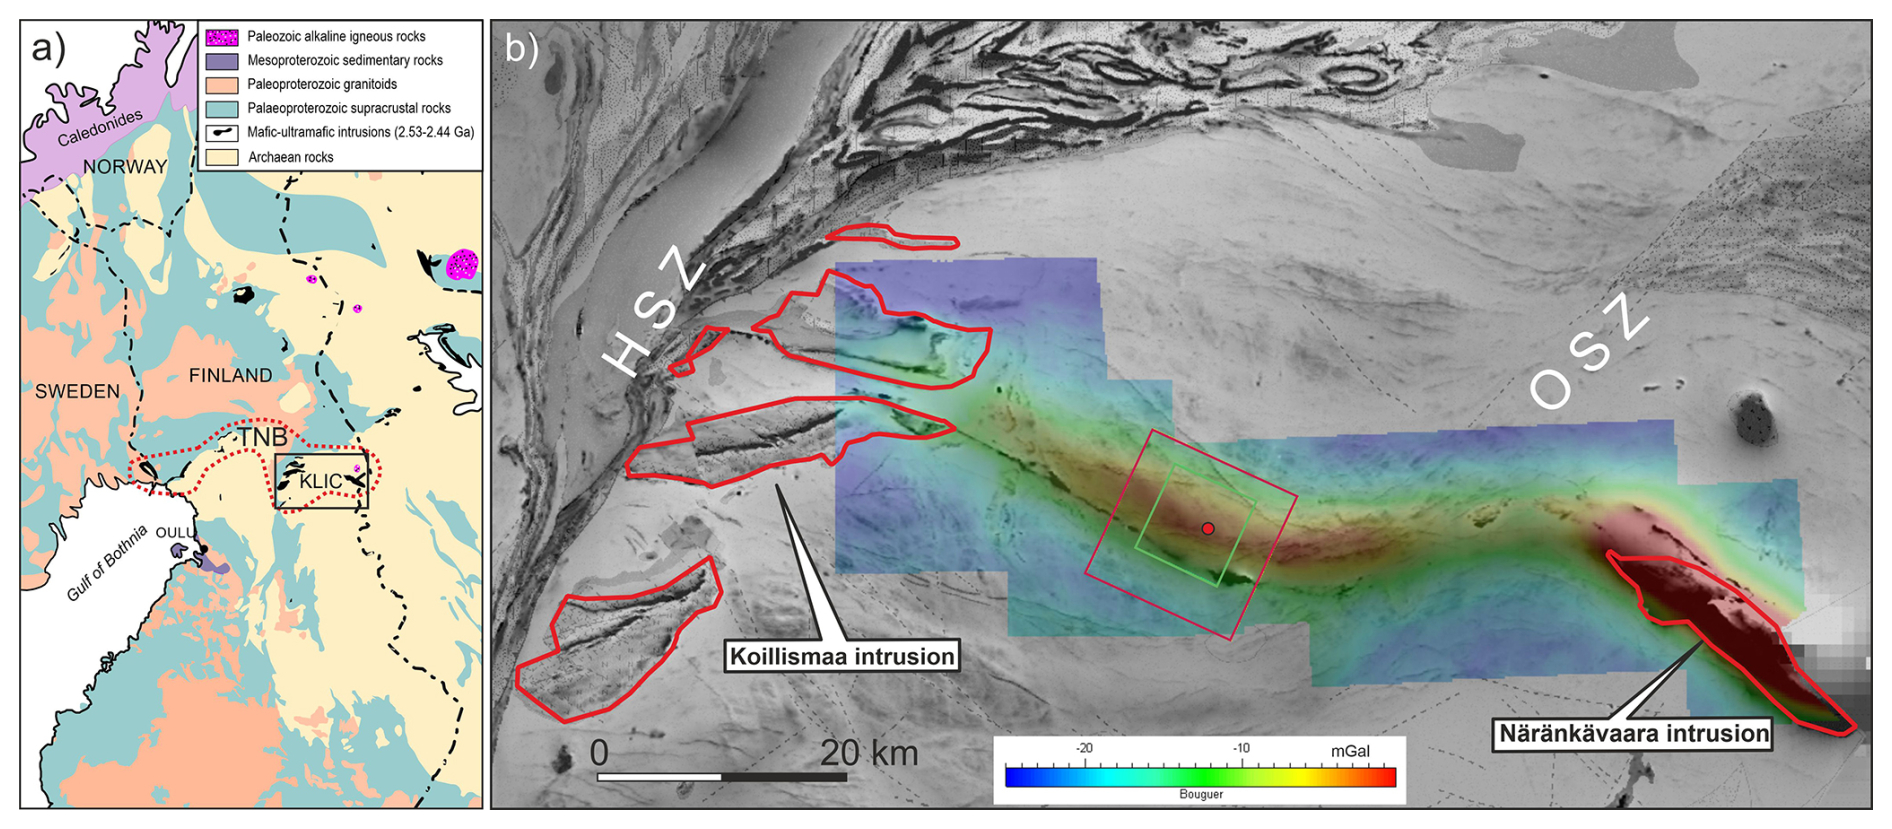
Figure 1(a) Simplified geological map of the Fennoscandian Shield (modified from Karinen, 2010); KLIC: Koillismaa–Näränkävaara Layered Intrusion Complex, TNB: Tornio–Näränkävaara Belt; (b) location of the study area with the composite image of the magnetic anomaly (Aeromagnetic anomaly map of Finland ©Geological Survey of Finland 2016), Bouguer gravity anomaly (Salmirinne and Iljina, 2003) and simplified bedrock geology (Bedrock of Finland 1:1 000 000 © Geological Survey of Finland 2016) maps. Red dot marks the Koillismaa drillhole, rectangles mark the extend of the SEEMS DEEP 3D seismic survey (green) and the Common Earth Model area (red); HSZ: Hirvaskoski Shear Zone, OSZ: Oulujärvi Shear Zone. Total Magnetic Intensity shading from low (white) to high values (black).
Our study area (Fig. 1b) is situated in the central part of the KLIC which is a component of the TNB (Fig. 1a). The KLIC comprises of two exposed intrusions – the Koillismaa Intrusion in the west and the Näränkävaara Intrusion in the east – connected by a ∼50 km long geophysical anomaly (Alapieti, 1982; Karinen, 2010) (Fig. 1b). The Näränkävaara Intrusion, composed mainly of the ultramafic cumulates, is surrounded by the Archaean gneiss and has largely retained its original emplacement position (Alapieti, 1982; Järvinen et al., 2020, 2022). In contrast, the Koillismaa Intrusion, emplaced at the boundary between the Archaean basement and the Kuusamo Schist Belt (KSB; Lahtinen and Köykkä, 2020), consists of mafic–ultramafic cumulates and has been tectonically dismembered into east–west-trending blocks (Karinen, 2010). The connecting anomaly has been recognized since the 1950s through ground gravity and airborne geophysical surveys (Salmirinne and Iljina, 2003). Due to its elongated geometry between the exposed intrusions, it was interpreted by Piirainen et al. (1978) and Alapieti (1982) as a potential feeder zone for the magmas of the Koillismaa and Näränkävaara intrusions. This hypothesis was tested by GTK through a deep drilling campaign (2020–2021), which confirmed the presence of mafic-ultramafic plutonic rocks at ∼1.4 km depth (Karinen et al., 2021; Tirroniemi et al., 2024). The ∼300 m thick section intersected by the drillhole represents an unaltered gabbronoritic chilled margin of the Koillismaa Deep Intrusion (KDI; Karinen et al., 2025).
The bedrock in the SEEMS DEEP study area is predominantly composed of Archaean orthogneisses. In the southern part of the study area, a narrow belt of banded iron formations (BIFs) is present (Makkonen, 1972), possibly related to the Archaean greenstones located to the east (Järvinen et al., 2023).The region is cross-cut by multiple generations of diabase dykes, likely intruded along pre-existing fractures and faults. Two major shear zones define the structural framework of the area: the N–S-trending dextral Hirvaskoski Shear Zone (HSZ; Kärki and Laajoki, 1995), which marks the western margin of the KSB and separates the Pudasjärvi and Lentua complexes; and the NE–SW-trending sinistral Oulujärvi Shear Zone (OSZ; Kärki and Laajoki, 1995), which intersects the HSZ and passes near the eastern margin of the study area.
3.1 Physical rock properties
The Koillismaa deep drillhole provided critical constraints on the physical rock properties. Ultrasonic P-wave velocity measurements were conducted in GTK's petrophysical laboratory on 1085 core samples under ambient pressure and temperature conditions, with co-located density measurements (Tirroniemi et al., 2024). These samples were reclassified into 11 main rock types, incorporating lithostratigraphic divisions whenever available. The results are summarized in Fig. 2. The overlying basement rocks consist of Archaean gneisses with varying degrees of alteration, leucogranite, granite, and diabase dykes. The median P-wave velocity (Vp) of the basement rocks is approximately 5900 m s−1, with values ranging from ∼5500 m s−1 in highly altered gneiss to ∼6300 m s−1 in diabase dykes. The upper part of the intrusion includes more felsic lithologies (e.g., granite and quartz diorite dykes) with Vp values around 5900 m s−1. The lower, mafic-ultramafic portion comprises gabbronorites (Vp≈6500 m s−1), pyroxenites (Vp≈6900 m s−1), and peridotites (Vp≈6000 m s−1). The relatively low median velocity of peridotites is indicative of serpentinization, however there is no evidence for this process in the drill core. Notably, some highly altered granites with connected porosity exceeding 10 % were identified within the intrusion (Bischoff et al., 2024). These rocks exhibit Vp values below 5000 m s−1 and densities under 2600 kg m−3. The seismic impedance plot (Fig. 2b) suggests that the basement is relatively transparent, with reflections primarily originating from diabase dykes or contacts with highly altered gneisses. In contrast, the mafic-ultramafic rocks exhibit significantly higher acoustic impedance contrast (Zp). Gabbronorites and pyroxenites have Zp values of 19 and 22 (×106 kg m−2 s−1) respectively, making them strong reflectors, especially at the contacts with felsic rocks. Results from the DAS – VSP survey conducted in the Koillismaa drillhole (Malinowski et al., 2023) confirmed the presence of internal reflections within the KDI. The VSP data also imaged cross-cutting dykes in the basement and responded to intersected faults and major fracture zones.
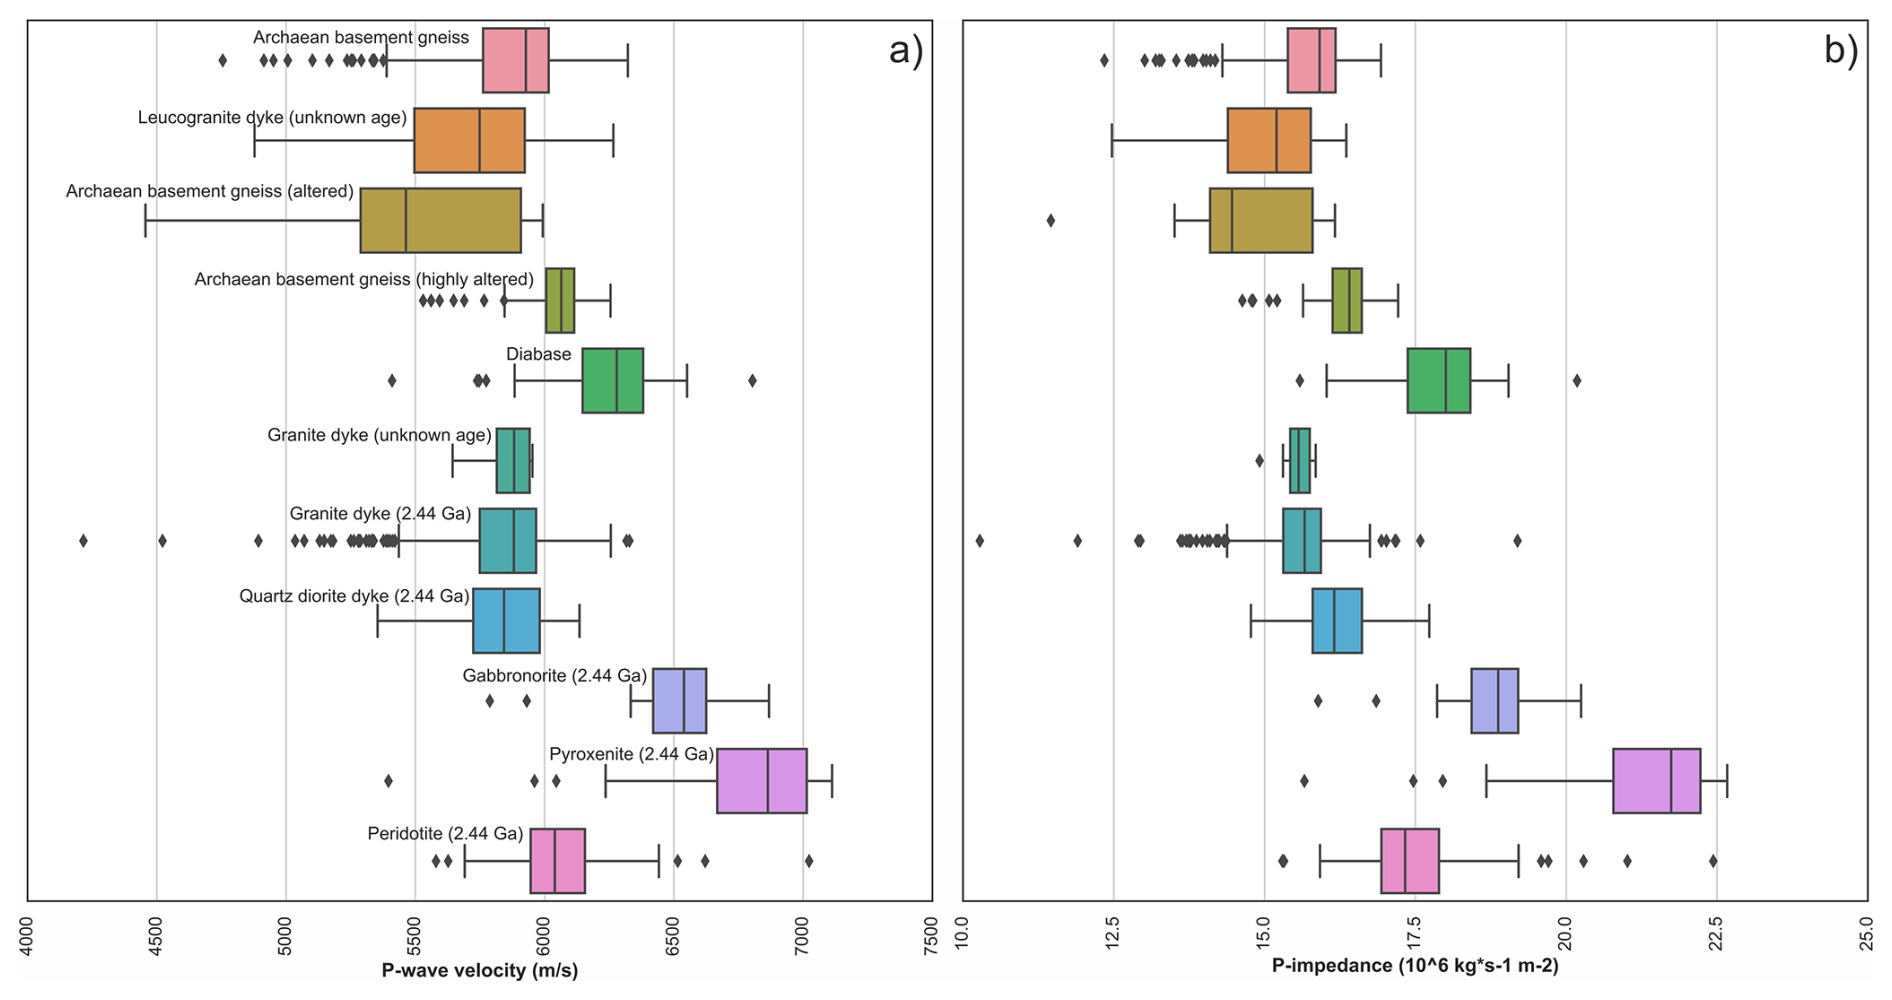
Figure 2(a) Box-and-whisker plot of the measured P-wave velocity using core samples from the Koillismaa deep drillhole grouped by the rocktype and ordered approximately by depth. The 2.44 Ga age is related to the intrusion. (b) Corresponding acoustic impedance plot based on the co-located velocity and density measurements.
3.2 Modelling seismic response of KDI as a layered intrusion
The Koillismaa deep drillhole penetrated only the uppermost 300 m of the KDI, whereas gravity data suggest that the intrusion is significantly thicker (Karinen et al., 2025). The exposed western part of the KLIC, specifically the Koillismaa Intrusion (Fig. 1b), reaches thicknesses of up to 2.5 km. To better understand the seismic response of a more complete layered sequence, we adopted the approach of Deemer and Hurich (1994), who modelled the seismic response of mafic intrusions based on modal mineralogy. We used a representative stratigraphic section from the Porttivaara block of the Koillismaa Intrusion, where modal mineralogy was determined from 76 samples (Karinen, 2010). This block comprises a marginal series (MS) up to 200 m thick, overlain by a layered series (LS). The MS consists of gabbroic cumulates at the base, transitioning upward into more magnesian rocks such as pyroxenites and peridotites. The LS is subdivided into three zones:
-
Lower Zone (LZ). Olivine gabbronorite (LZa) and gabbronorite (LZb)
-
Middle Zone (MZ). A thin basal layer of olivine gabbronorite (MZa), overlain by thick gabbronorite (MZb and MZc), separated by subeconomic sulphide mineralization
-
Upper Zone (UZ). Meso- and leucogabbros (UZa and UZc), with a central oxide gabbro layer (UZb)
Elastic properties (Vp, Vs and density) were calculated using the method of Abers and Hacker (2016), based on modal mineralogy. Assumed mineral compositions included plagioclase (anorthite/albite), orthopyroxene (enstatite 72 %, ferrosilite 28 %), clinopyroxene (diopside), olivine (forsterite), and brown mica (phlogopite/annite 50:50). Sulphides were replaced by magnetite. Granophyre was modelled as a mixture of albite (45 %), quartz (45 %) and biotite (10 %). The calculations assumed emplacement conditions of 15 km depth, 1200 °C and 0.4 GPa (Karinen et al., 2025). The resulting elastic properties are shown in Fig. 3. Linear interpolation was used to produce regular velocity and density logs in depth. A continuous reflection coefficient trace (in time) was then built with Seismic Unix (Stockwell, 1999). Instead of convolving it with a wavelet, it was low-pass-filtered below 62.5 Hz to produce a simple synthetic seismogram. Prominent reflections correlate with olivine gabbronoritic layers (LZa and MZc), the sulphide-bearing boundary between MZa and MZb, and the oxide gabbro layer (UZb), which produces strong top and bottom reflections due to density contrasts. A general increase in seismic velocity and density is observed in the lowermost 1 km of the section.
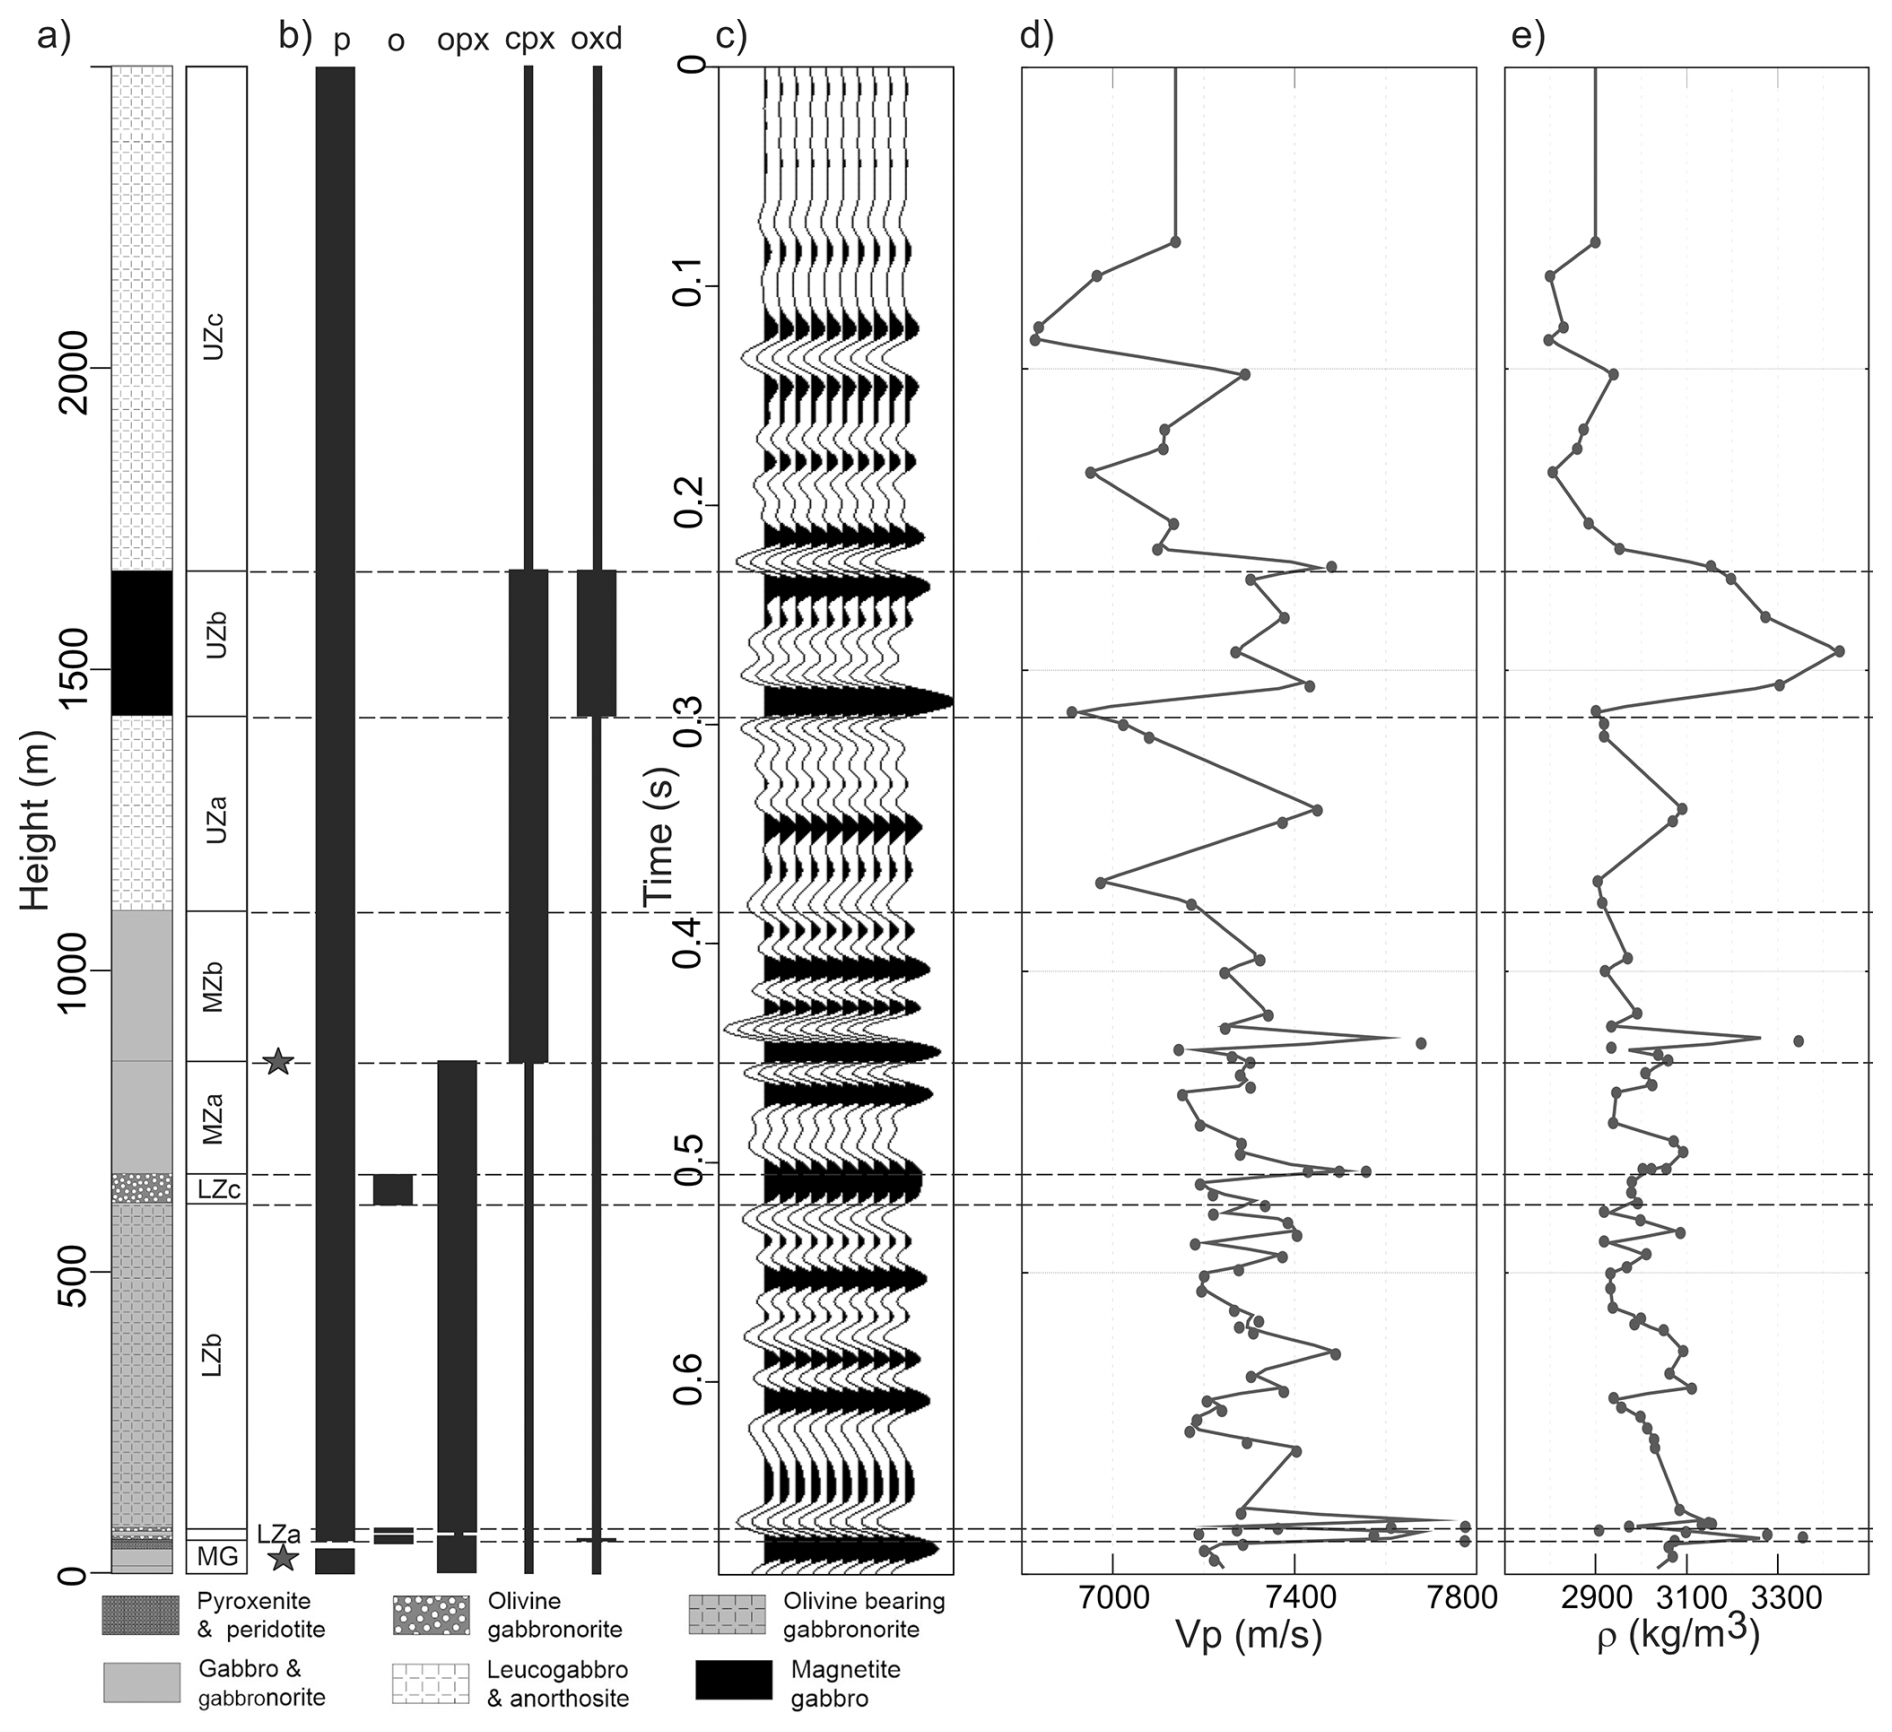
Figure 3(a) Representative stratigraphic section of KLIC based on the profile across the Porttivaara block (Karinen, 2010); (b) In the sequence thick vertical lines indicate cumulus minerals and thin vertical lines indicate intercumulus minerals (p-plagioclase, o: olivine, opx: orthopyroxene, cpx: clinopyroxene, oxd: Fe-Ti oxides); stars denote occurrence of sulphide mineralisation (up to 3 %); (c) corresponding filtered (up to 62.5 Hz) zero-offset reflection coefficient series based on the velocity and density calculated from modal mineralogy; (d) calculated velocity log; (e) calculated density log. Points represent samples and the lines are the interpolated values.
4.1 Seismic data acquisition
The 3D seismic survey was conducted in August 2023 in the vicinity of the Koillismaa deep drillhole, approximately 50 km southwest of Kuusamo. The survey area was centered on the gravity anomaly associated with the KDI (Fig. 1b). Terrain accessibility – characterized by mixed forest, clearings, swamps, and lakes – as well as nature conservation restrictions, influenced the final layout (Fig. 4a). The eastern boundary of the survey followed the access road to the drill site, which also hosted one of the 2D profiles (Singh et al., 2025). A large protected swamp area east of this road was excluded from the survey. The southern extension of the grid was designed to partially cover rocks with strong magnetic signatures (BIFs). The final layout was a compromise between spatial coverage and the number of available receivers (green dots in Fig. 4a). The survey followed a quasi-orthogonal geometry with 21 receiver lines oriented at an azimuth of 25° N, spaced 240 m apart, covering an area of ∼22 km2. A total of 2866 receivers were deployed at 30 m intervals using nimble nodes equipped with piezoelectric sensors (Stryde). No prior staking was performed; instead, receivers were planted at pre-plot locations and surveyed using precision GPS. Additional spikes were attached to nodes to ensure good coupling in swampy areas. Source points were located along forest paths and gravel roads, with a nominal spacing of 30 m (red points in Fig. 4a). Of the 1615 recorded source points, 718 were located along the two 2D profiles. A Mark IV Vibroseis truck equipped with a Y-2400 Failling shaker (22 000 kg peak force) was used as the source, generating 20 s sweeps from 20–160 Hz (+1 dB/octave), repeated twice at each location. The entire 3D survey, including 2D acquisition, was completed in approximately two weeks: ∼5 d for node deployment, ∼5 d for production, and ∼2.5 d for retrieval.
Table 1Summary of the acquisition parameters of the SEEMS DEEP 3D seismic survey.
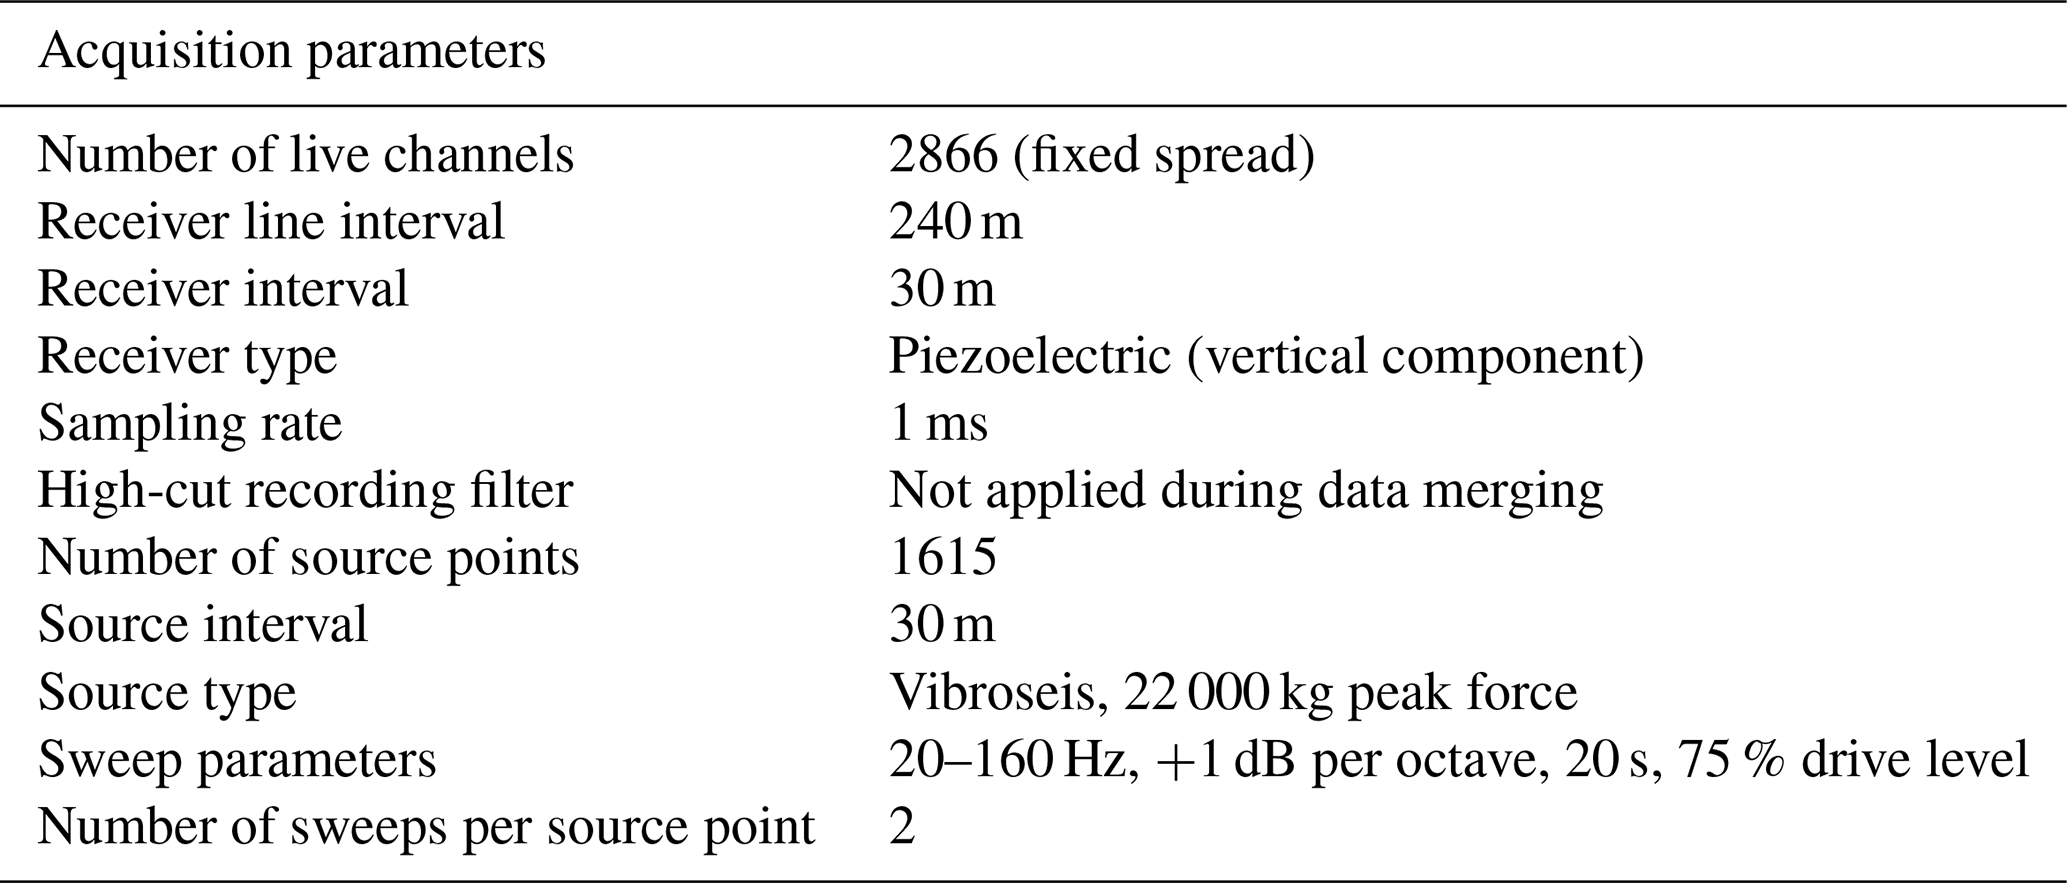
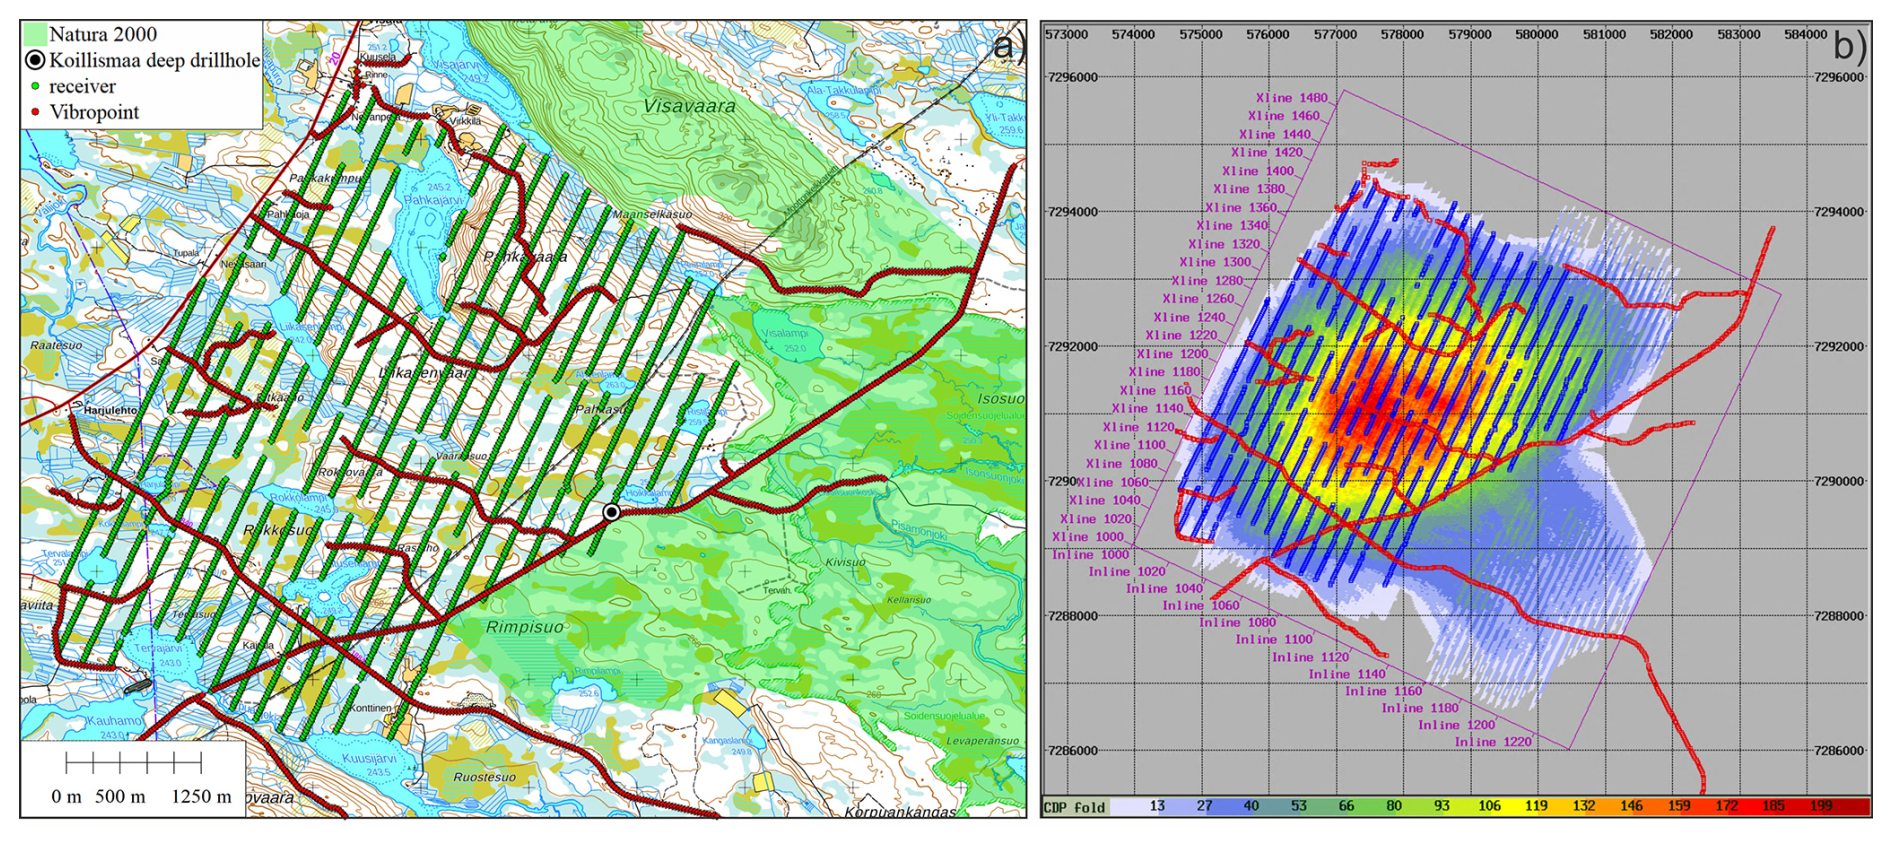
Figure 4Layout of the SEEMS DEEP 3D seismic survey (a) and the corresponding CDP fold (b).
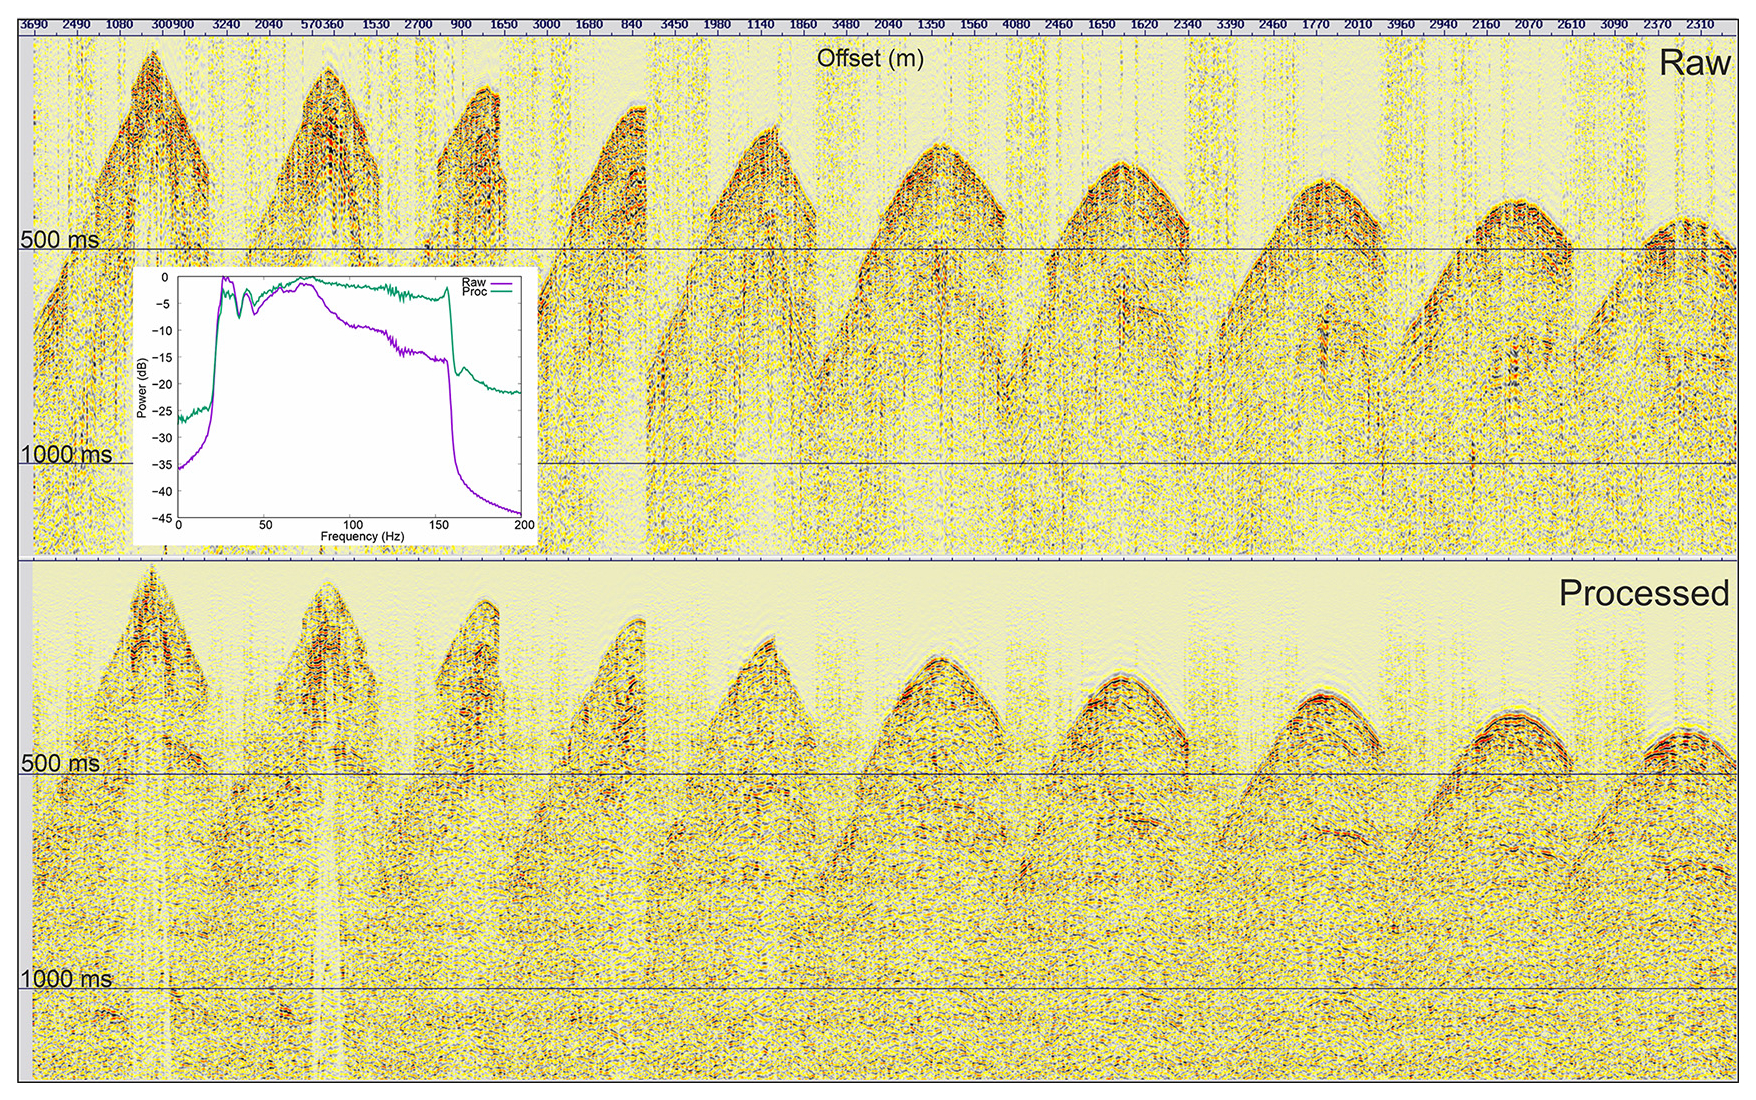
Figure 5Example of raw (a) and processed (b) shot gather. Inset figure on the top shows the amplitude spectra of raw shot gather (in purple), and after full preprocessing for the same (in green).
4.2 Seismic data processing and imaging
The acquired data were of generally good quality, with clear first arrivals beyond 5 km offset and visible reflections in raw shot gathers (Fig. 5). Low signal-to-noise ratios were observed in swampy areas, particularly in the southern part of the survey. Despite the use of piezoelectric sensors, the data exhibited a broad frequency response consistent with the original sweep (see inset in Fig. 5). The processing workflow followed standard procedures for hardrock seismic data (Table 2). Common depth point (CDP) gathers were generated using a bin size of 15 m (crossline) by 30 m (inline). The inline bin size was increased from 15 to 30 m to enhance fold, which reached a maximum of 200 in the survey center (Fig. 4b). Refraction statics was derived from approximately 1.9 million auto-picked first arrivals. After testing various algorithms (tomostatics and refraction statics), the best results were obtained using generalized refraction traveltime inversion (GLI3D; Hampson and Russell, 1984) with a two-layer model. The long-wavelength statics to a floating datum were relatively small, with a bimodal distribution: most values ranged from −6 to 0 ms, and a secondary group from −12 to −6 ms, primarily in the southern part of the survey. Residual refraction statics ranged from −8 to +8 ms. Residual reflection statics were not applied, as they did not significantly improve the stack. Noise attenuation included f–kk filtering, airwave muting, and bandpass filtering. Signal shaping was achieved using spiking deconvolution.
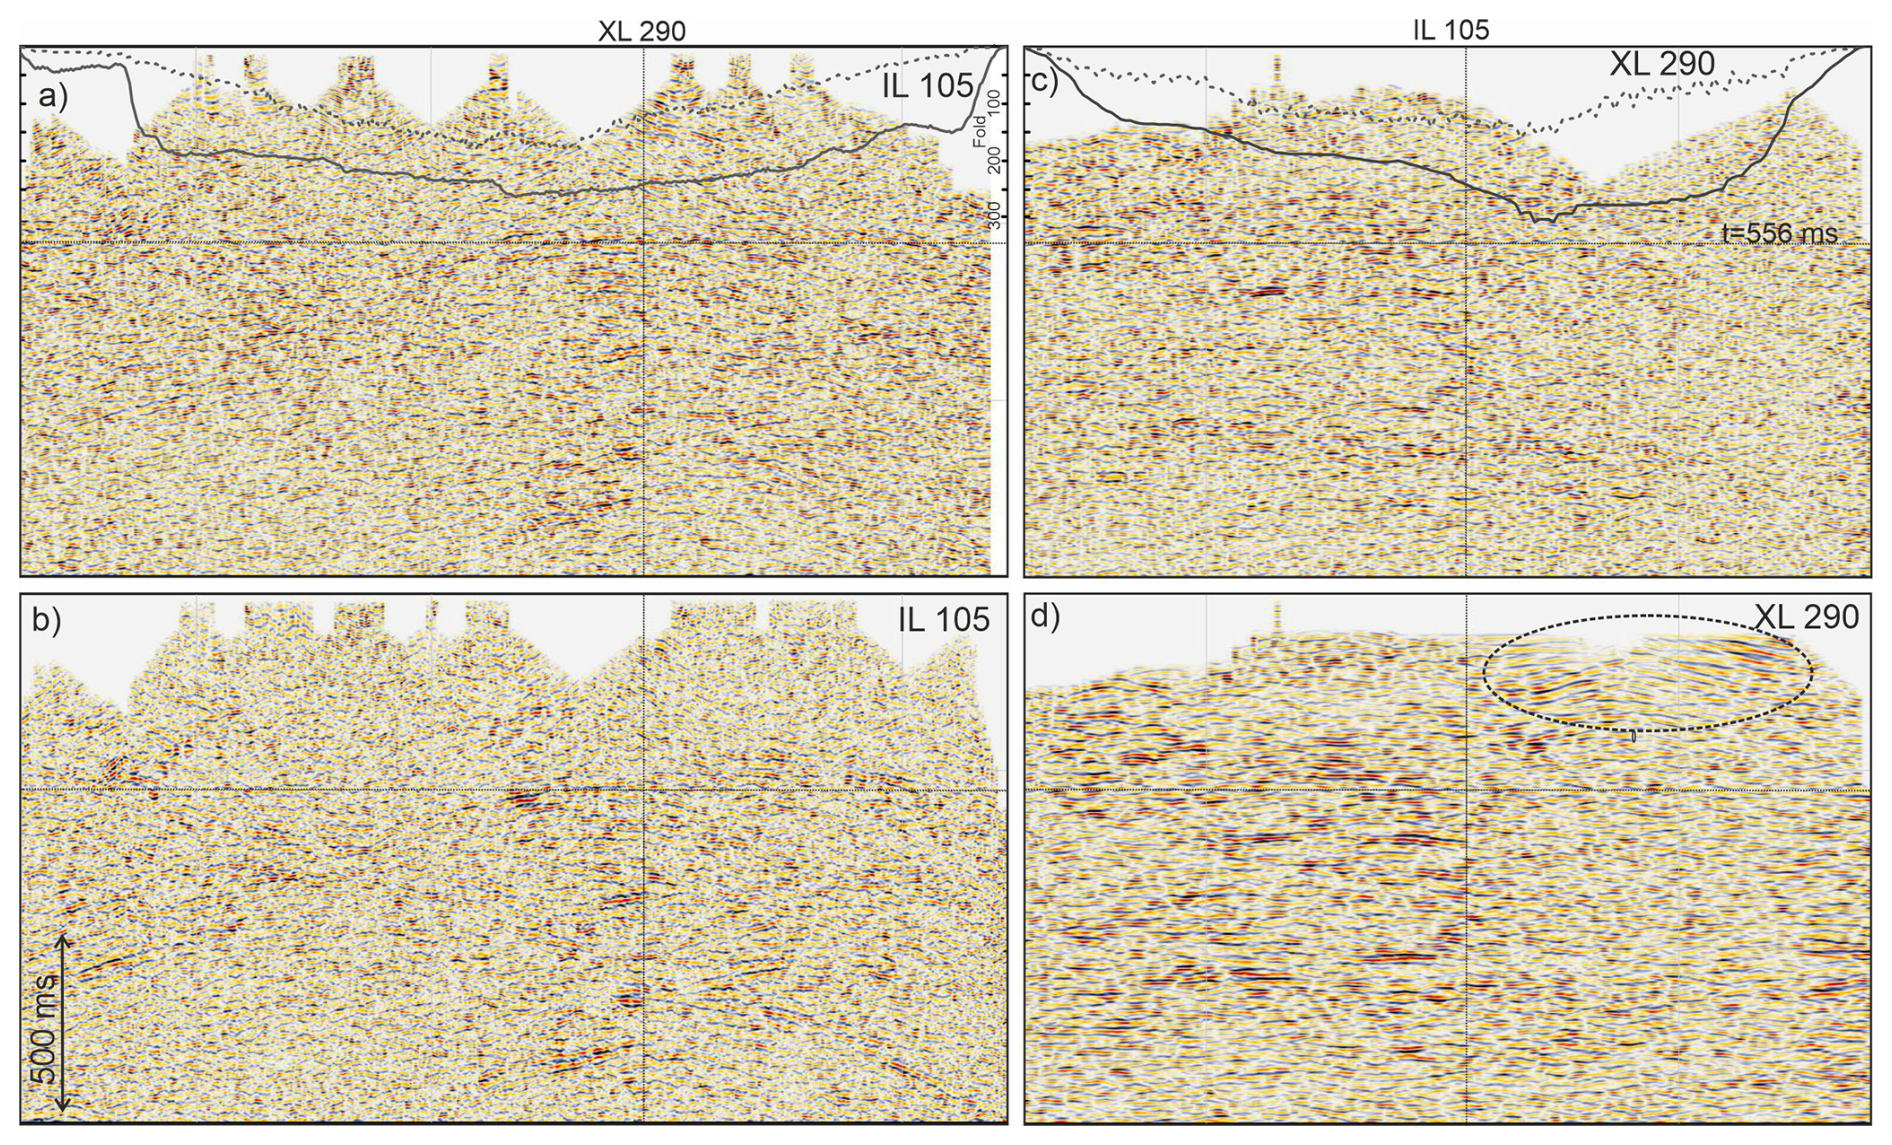
Figure 6Inline and crossline sections through the stack volumes without (a, c) and with (b, d) pre-stack 5D interpolation. Stacking fold is plotted at the top: normal stack – dashed line, interpolated stack – solid line.
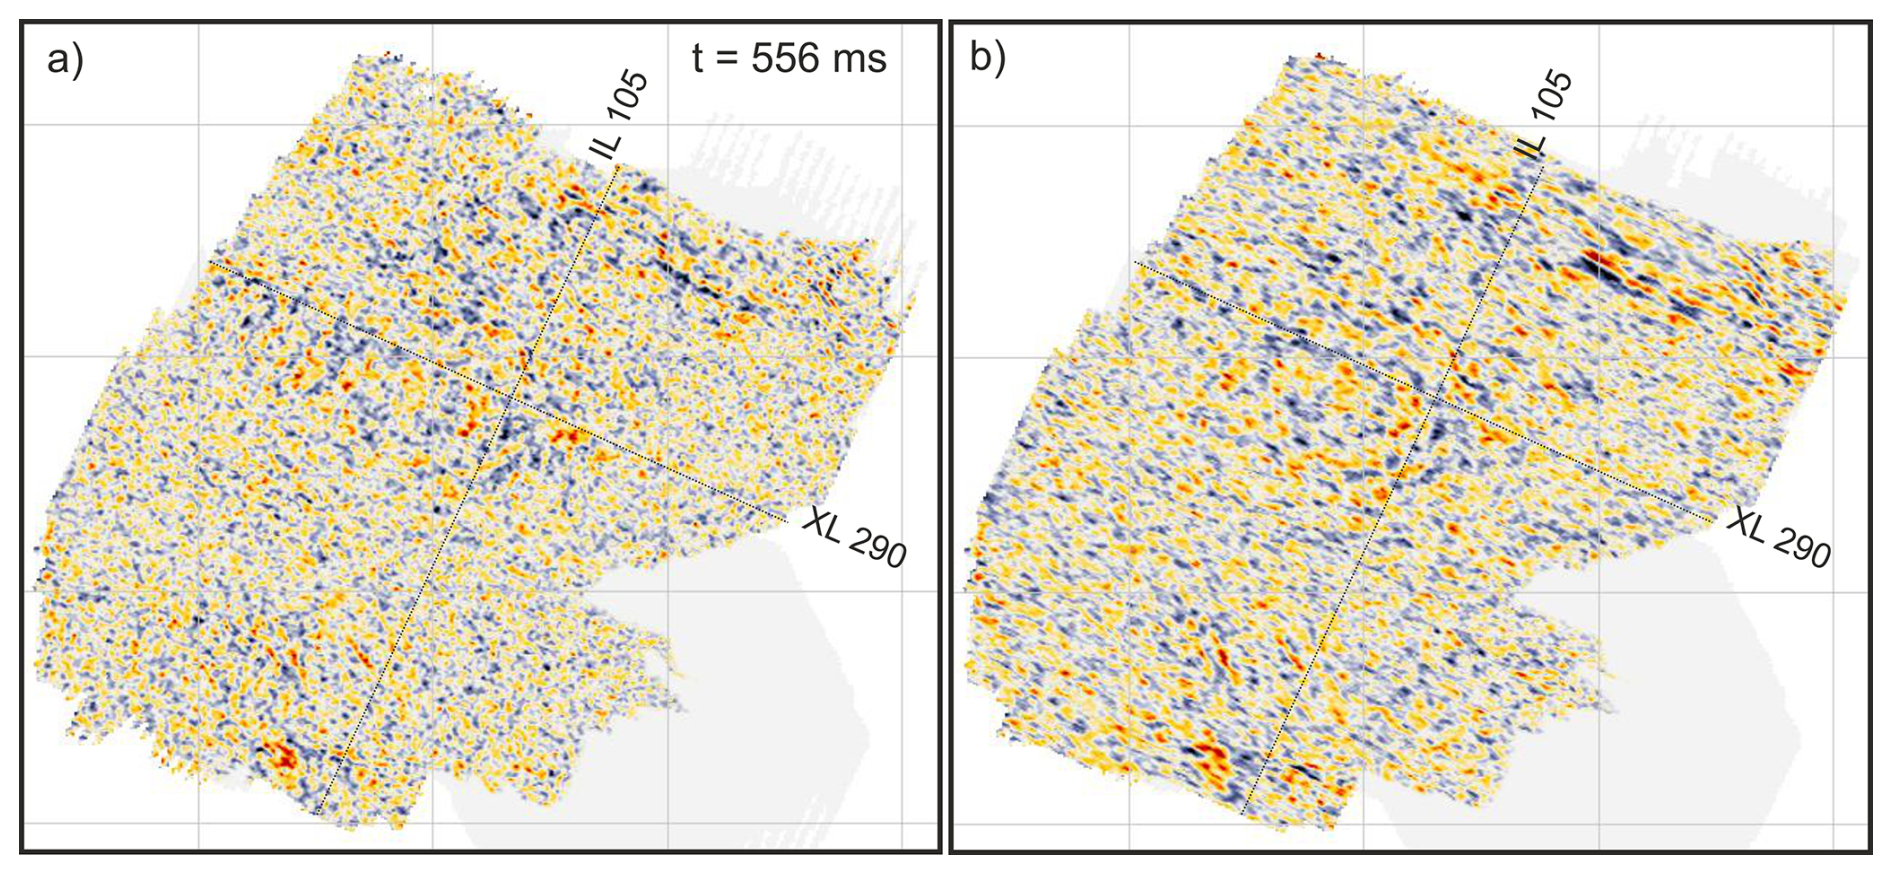
Figure 7Time slice through the stack volumes without (a) and with (b) pre-stack 5D interpolation.
Table 2Summary of the processing parameters of the SEEMS DEEP 3D seismic survey.

The data were then regularized using 5D interpolation (Trad, 2009), which improved offset-bin distribution and filled data gaps. This step was justified by the presence of laterally coherent reflections with moderate dips. The interpolation used a combination of greedy local Radon transform (Wang et al., 2010), and projection onto convex sets (POCS; Abma and Kabir, 2006), applied in two nested loops along the crossline direction. The interpolation improved reflection continuity in both inline and crossline sections (Fig. 6), particularly near survey edges and in low-fold areas (Fig. 7). Fold increased from ∼170 to ∼250 in the center and from less than 50 to more than 150 at the edges. However, artifacts were introduced in the top 250 ms of the data, especially in the southeast (see e.g., the area marked by an ellipse in Fig. 7d), and should be interpreted with caution.
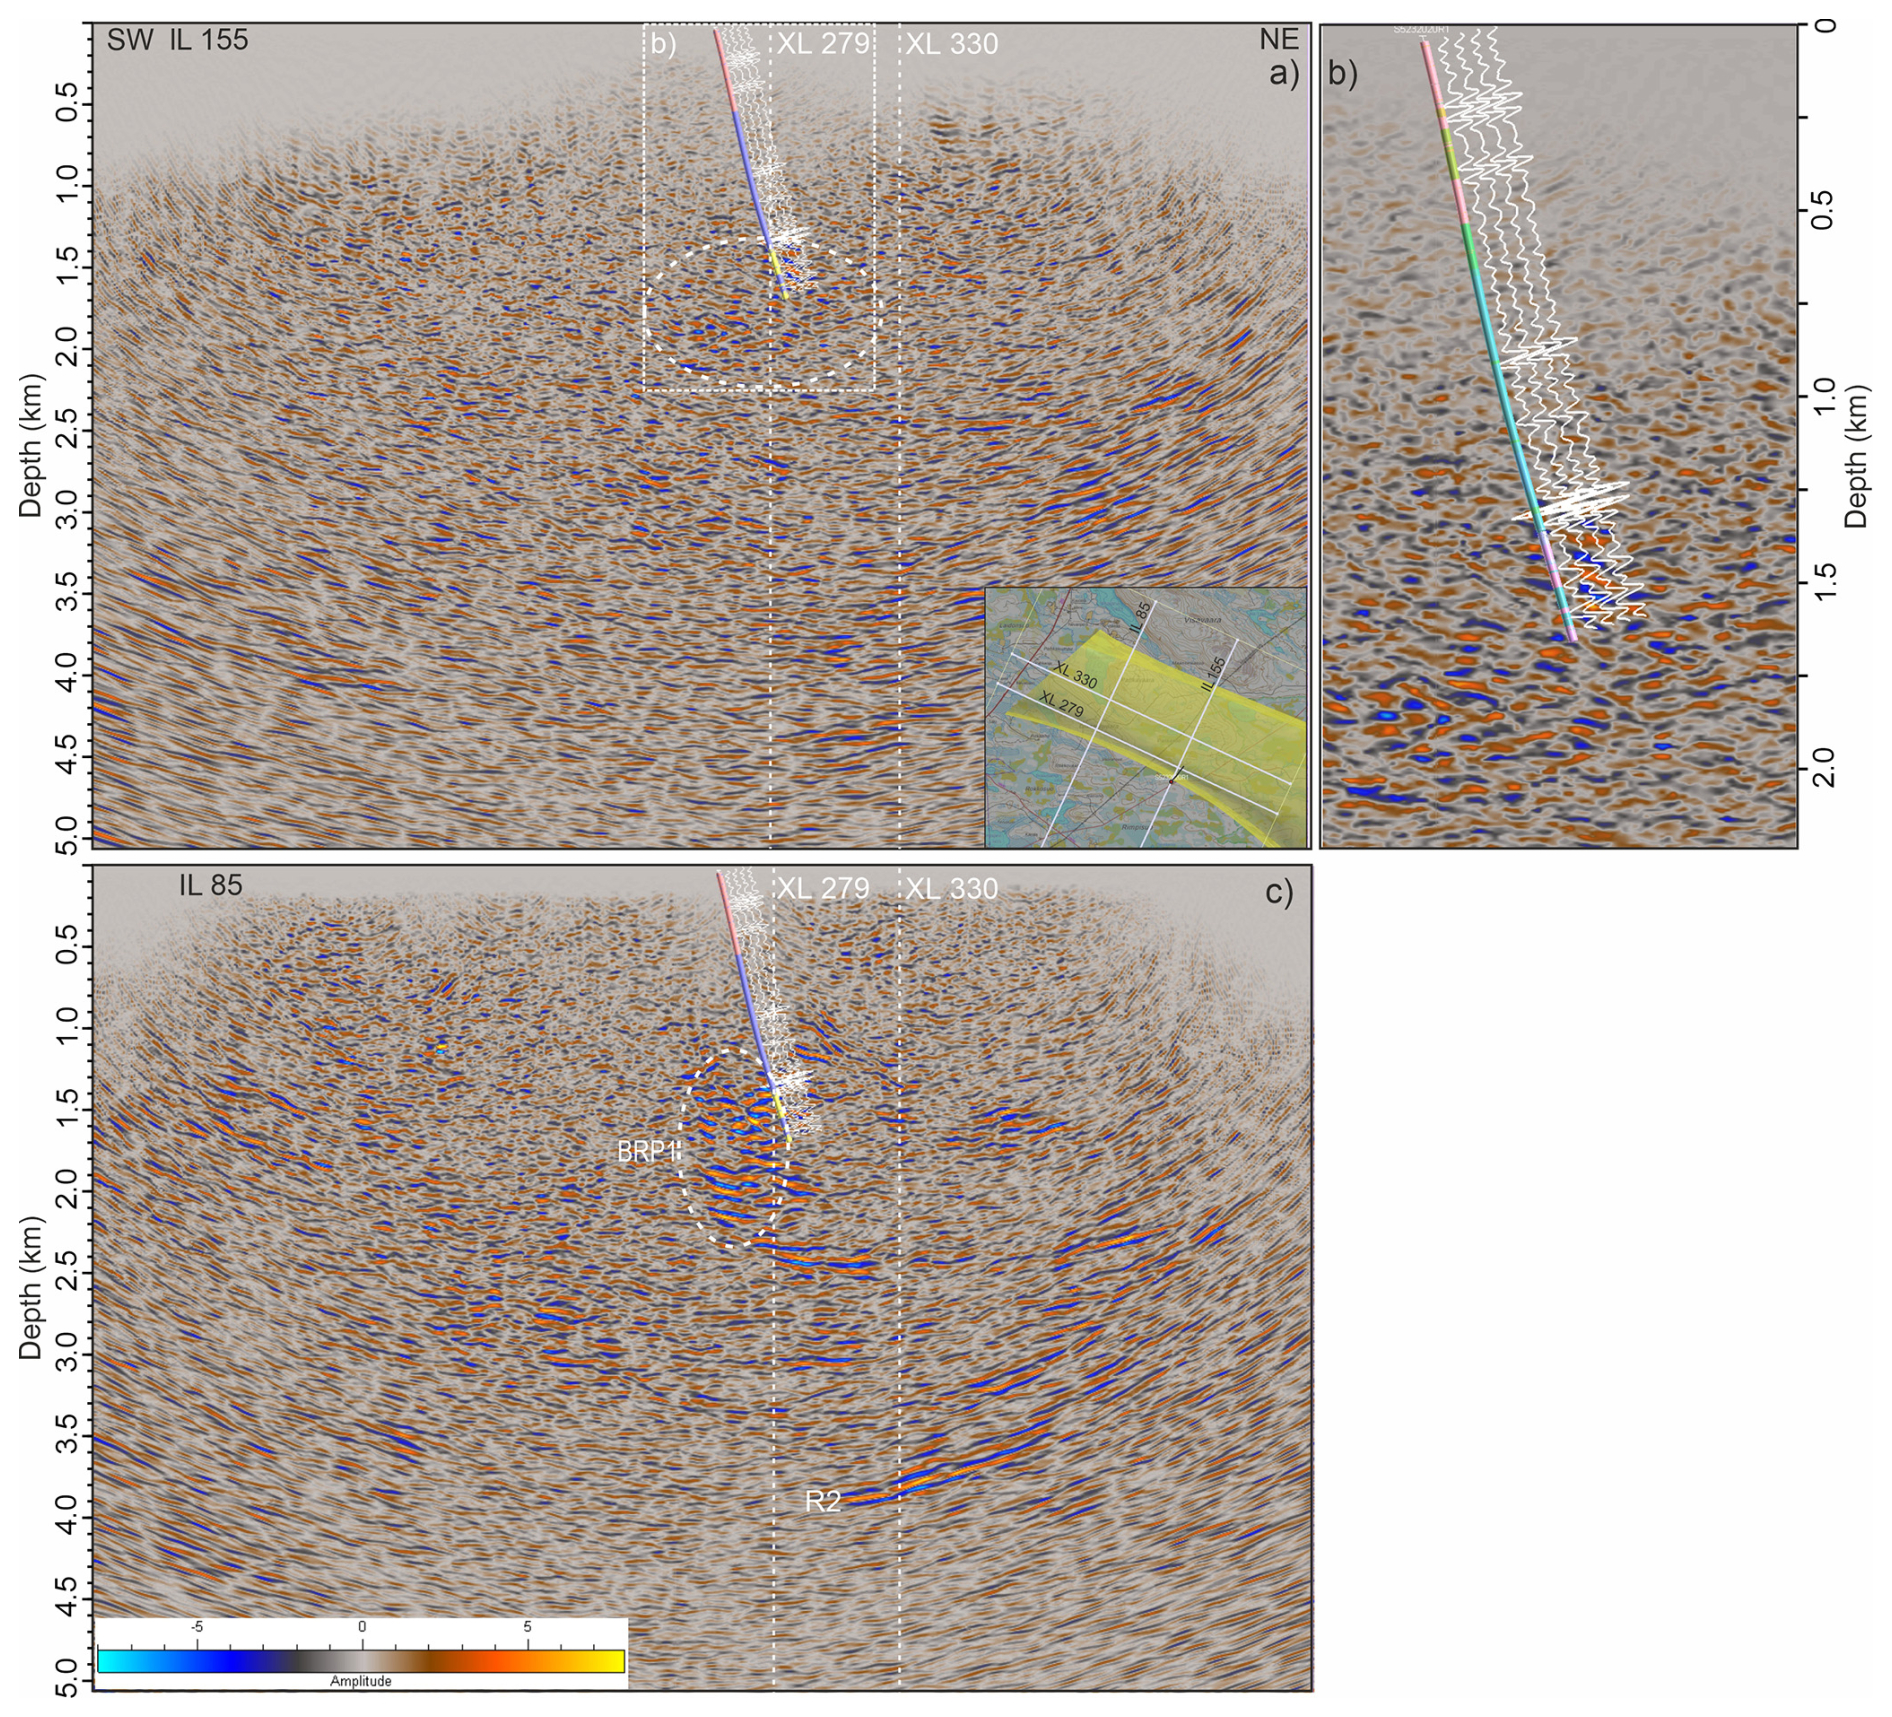
Figure 8Inline sections from the final PreSTM volume (depth converted). Inset shows location of the sections. Koillismaa drillhole path and simplified lithology (pink – basement, blue – dykes, yellow – intrusion) is shown together with the synthetic seismogram calculated using petrophysical data shown in Fig. 2 and Ormsby wavelet (20–30–90–110 Hz). A zoomed in portion of panel (a) is shown in panel (b). Drillhole trajectory is color-coded by generalized lithology as in Fig. 2. For labelled reflections see the text.
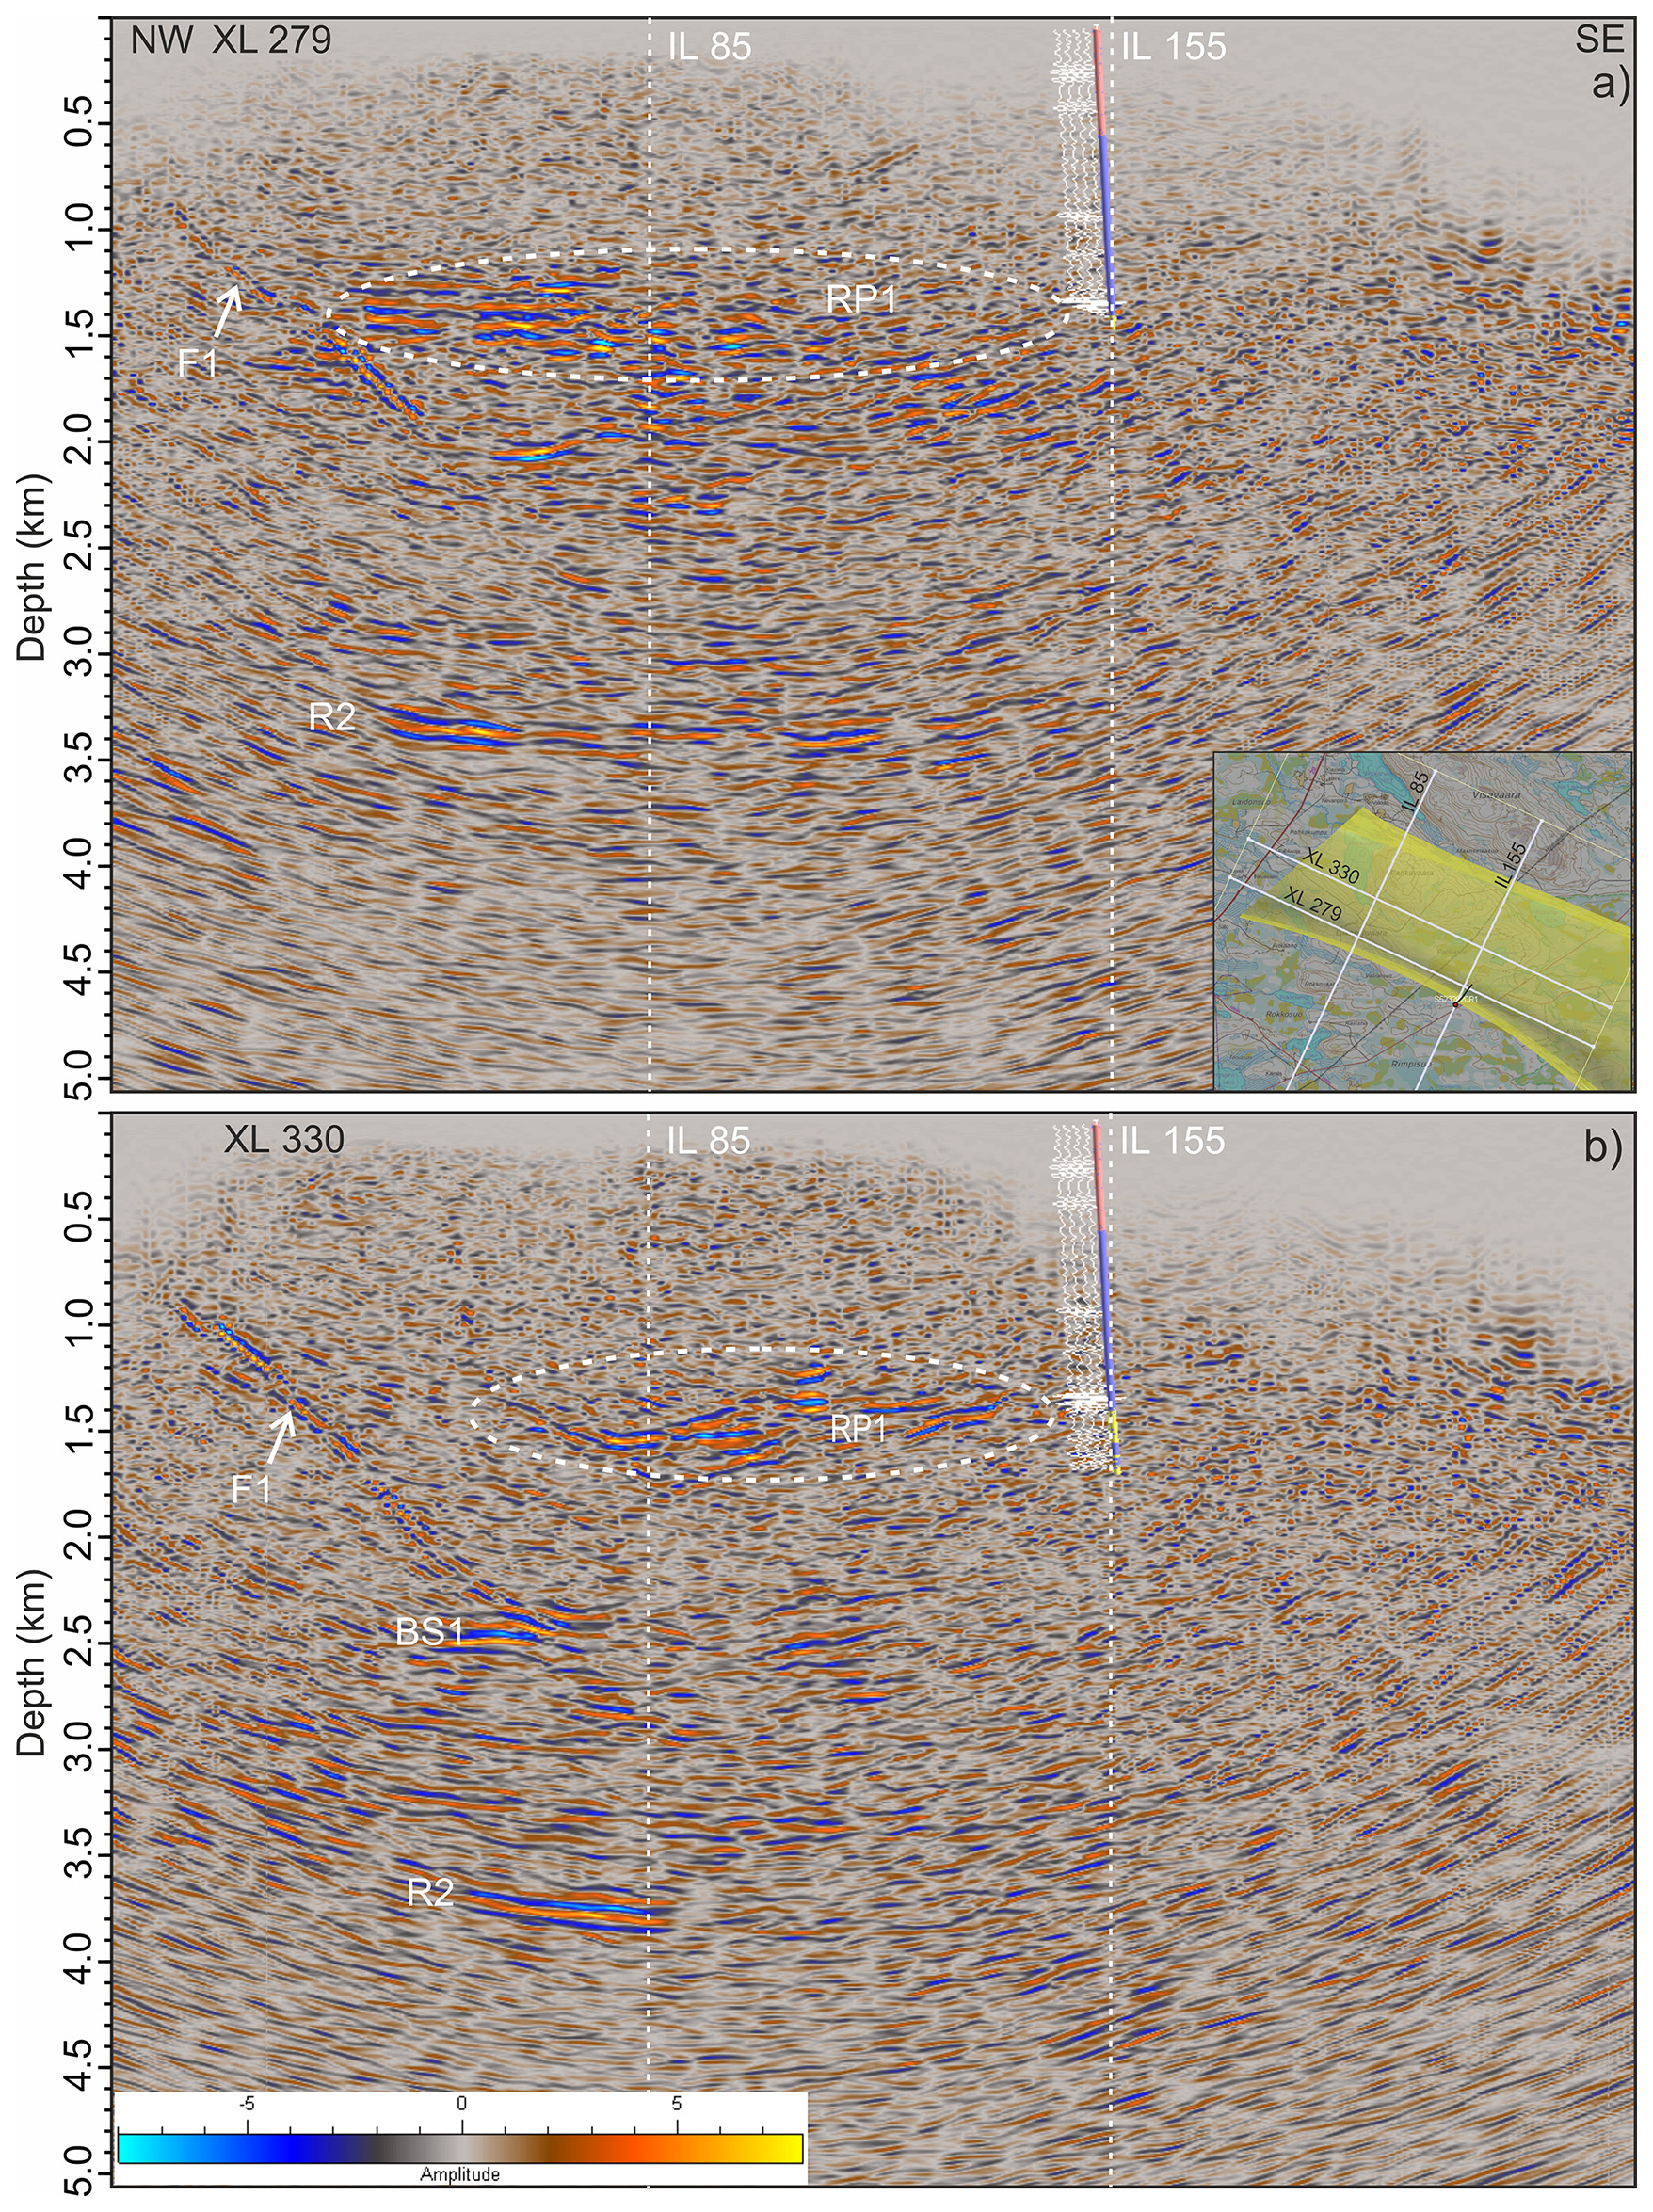
Figure 9Crossline sections from the final PreSTM volume (depth converted). Inset shows location of the sections. For labelled reflections see the text.
Following interpolation, several imaging strategies were tested. Pre-stack time migration (PreSTM) yielded the best results compared to post-stack time migration (PoSTM) and dip-moveout (DMO) processing. PreSTM also facilitated velocity picking due to improved signal coherence. Automatic velocity analysis was performed using migrated gathers at every CDP using windowed trace correlations, with a weighted average over 20 inlines and crosslines, and Vrms bounds of 5000–6500 m s−1. The velocity model was smoothed using a depth-dependent function and refined over two iterations of migration and velocity analysis.
The final PreSTM volume was post-processed using a structure-oriented mean of least variance (MLV) filter (Al-Dossary and Wang, 2012; Schulze and Pearce, 1993), and depth-converted using a constant velocity of 6000 m s−1. This value was consistent with the average velocities from the Koillismaa drillhole and provided a good match to the top of the intrusion. Representative inlines and crosslines from the final volume are shown in Figs. 8 and 9, with interval velocities overlaid in Fig. 10.
5.1 General reflectivity characteristics
The final PreSTM seismic volume reveals abundant reflectivity, particularly at depths below 1000 m. The most coherent reflections are concentrated in the northeastern part of the survey area. Inline 155 (Fig. 8a) and crossline 279 (Fig. 9a) intersect the Koillismaa drillhole at approximately 1400 m depth. Although reflectivity in this area is somewhat incoherent – likely due to its proximity to the survey edge – an increase in reflectivity is observed where the drillhole intersects the intrusion (1400–1700 m depth), extending to ∼2000 m (see Fig. 8b). In contrast, the 2D profile along the access road (Singh et al., 2025) shows more coherent reflections at these depths. Along crossline 279, a ∼200–300 m thick reflection package (RP1) begins near the drilled top of the intrusion and extends laterally for ∼3 km. This package is truncated by a southeast-dipping reflector (F1) at ∼45°. Overall, reflections are most abundant between 1400 and 2200 m depth. A strong, subhorizontal reflector (R2) is also observed at ∼3300–3400 m depth.
Crossline 330 (Fig. 9b), located 780 m northeast of crossline 279, shows an undulating RP1 at ∼1400 m depth, underlain by a more transparent zone. Prominent reflections reappear between 2400–3400 m. These deeper reflections coincide with high interval velocities (>6600 m s−1, locally up to 7300 m s−1; Fig. 10b) and terminate at a strong reflector at ∼3800 m (R2). Inline 85 (Fig. 8c), located 2130 m northwest of inline 155, shows arcuate reflections between 2400–3900 m, with a bottoming point near the drillhole. Some reflectors extend into the southwestern part of the section, where they are associated with higher interval velocities that decrease toward the southwest (Fig. 10a). A prominent, ∼600 m wide zone of bright reflectivity (BRP1) is observed southwest of the drillhole between 1400–2200 m depth (Fig. 8c). Additional bright spots are present throughout the volume, some near the dipping reflector F1 at depths of ∼1400–1500 m and ∼2000–2500 m (e.g., BS1 in Fig. 9b).
5.2 3D seismic interpretation input to the Common Earth Model
One of the key objectives of the SEEMS DEEP project was to integrate geophysical and geological data into a Common Earth Model (CEM). Given the sparse geological control, limited to the Koillismaa deep drillhole and a few outcrops, 3D seismic interpretation was essential for constructing the CEM. The model covers a 13×13 km2 area (Fig. 1b), extending beyond the 3D seismic grid, and incorporates 2D seismic (Singh et al. 2025) and potential field inversion data (Salmirinne and Iljina, 2003; Heikki Salmirinne, unpublished models). Lithologies in the CEM were simplified into five categories: (1) undifferentiated Archaean basement, (2) banded iron formations (BIFs), (3) felsic (granitic) intrusion envelope, (4) mafic, and (5) ultramafic intrusion components. Snapshots of the CEM along inline 85 and crossline 330 (Fig. 11) show that the intrusion is ∼2–3 km thick, bounded by distinct reflections (RP1 at the top, R2 at the base). Internal variations in reflectivity and velocity suggest systematic lithological layering, particularly between 2400–3400 m depth. These features are interpreted as modal layering or megacyclic units, consistent with the seismic response of the Koillismaa layered series as modelled based on the exposed Porttivara block (Fig. 3c). In the CEM, these are represented by subdividing the intrusion into upper mafic and lower ultramafic units.
The increase in seismic velocity in the lowermost 1000–1500 m of the intrusion aligns with predictions based on modal mineralogy (Fig. 3d). The southeast-dipping reflector F1 (Fig. 9) extends to the surface and parallels the Oulujärvi Shear Zone (OSZ), suggesting it is a reverse fault along which the intrusion was thrusted westward (Figs. 10b, 11b). Figure 12 presents westward-oriented views of the CEM. A narrow BIF belt (purple voxels) is associated with a fault system (red surfaces) that parallels the geophysical anomaly between the Koillismaa and Näränkävaara intrusions (Fig. 1b). This interpretation is supported by the presence of sheared BIFs in sparse drillholes south of the study area (Makkonen, 1972). The reverse fault (pale blue surface, Fig. 12c) and the westward-thrust intrusion are also shown.
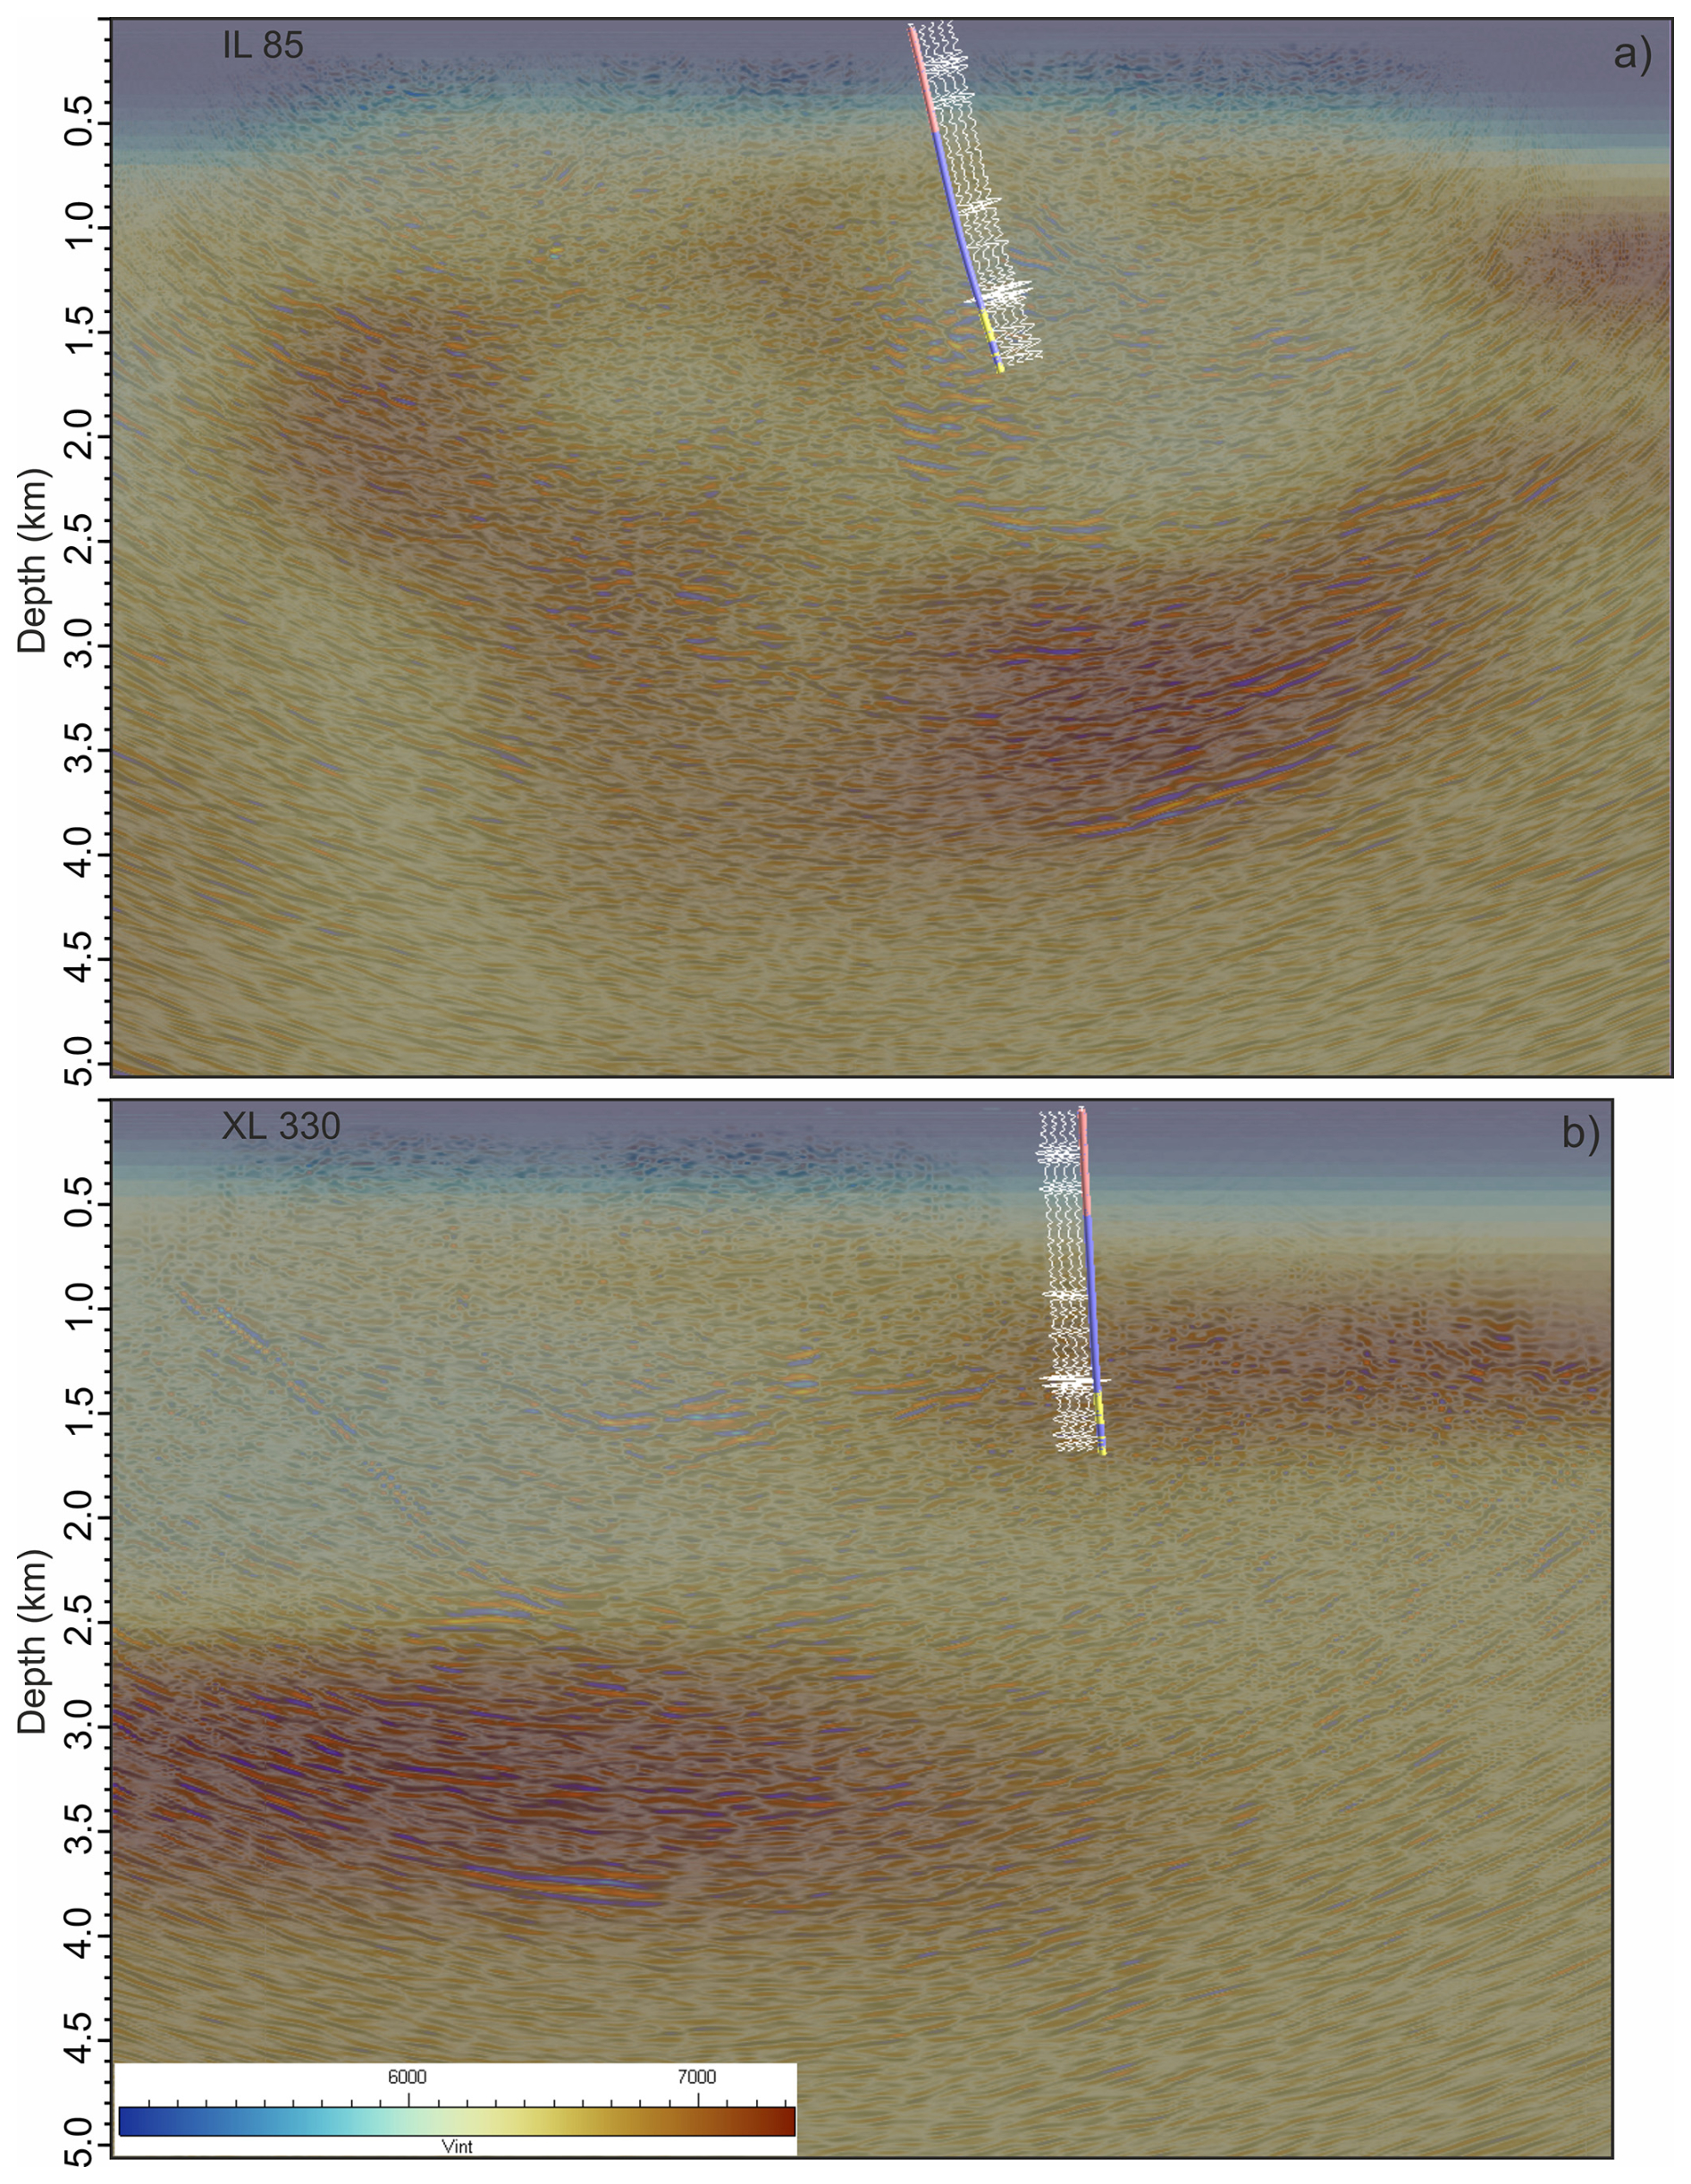
Figure 10Inline 85 and crossline 330 from the final PreSTM volume (depth converted) with the interval velocities in the background.
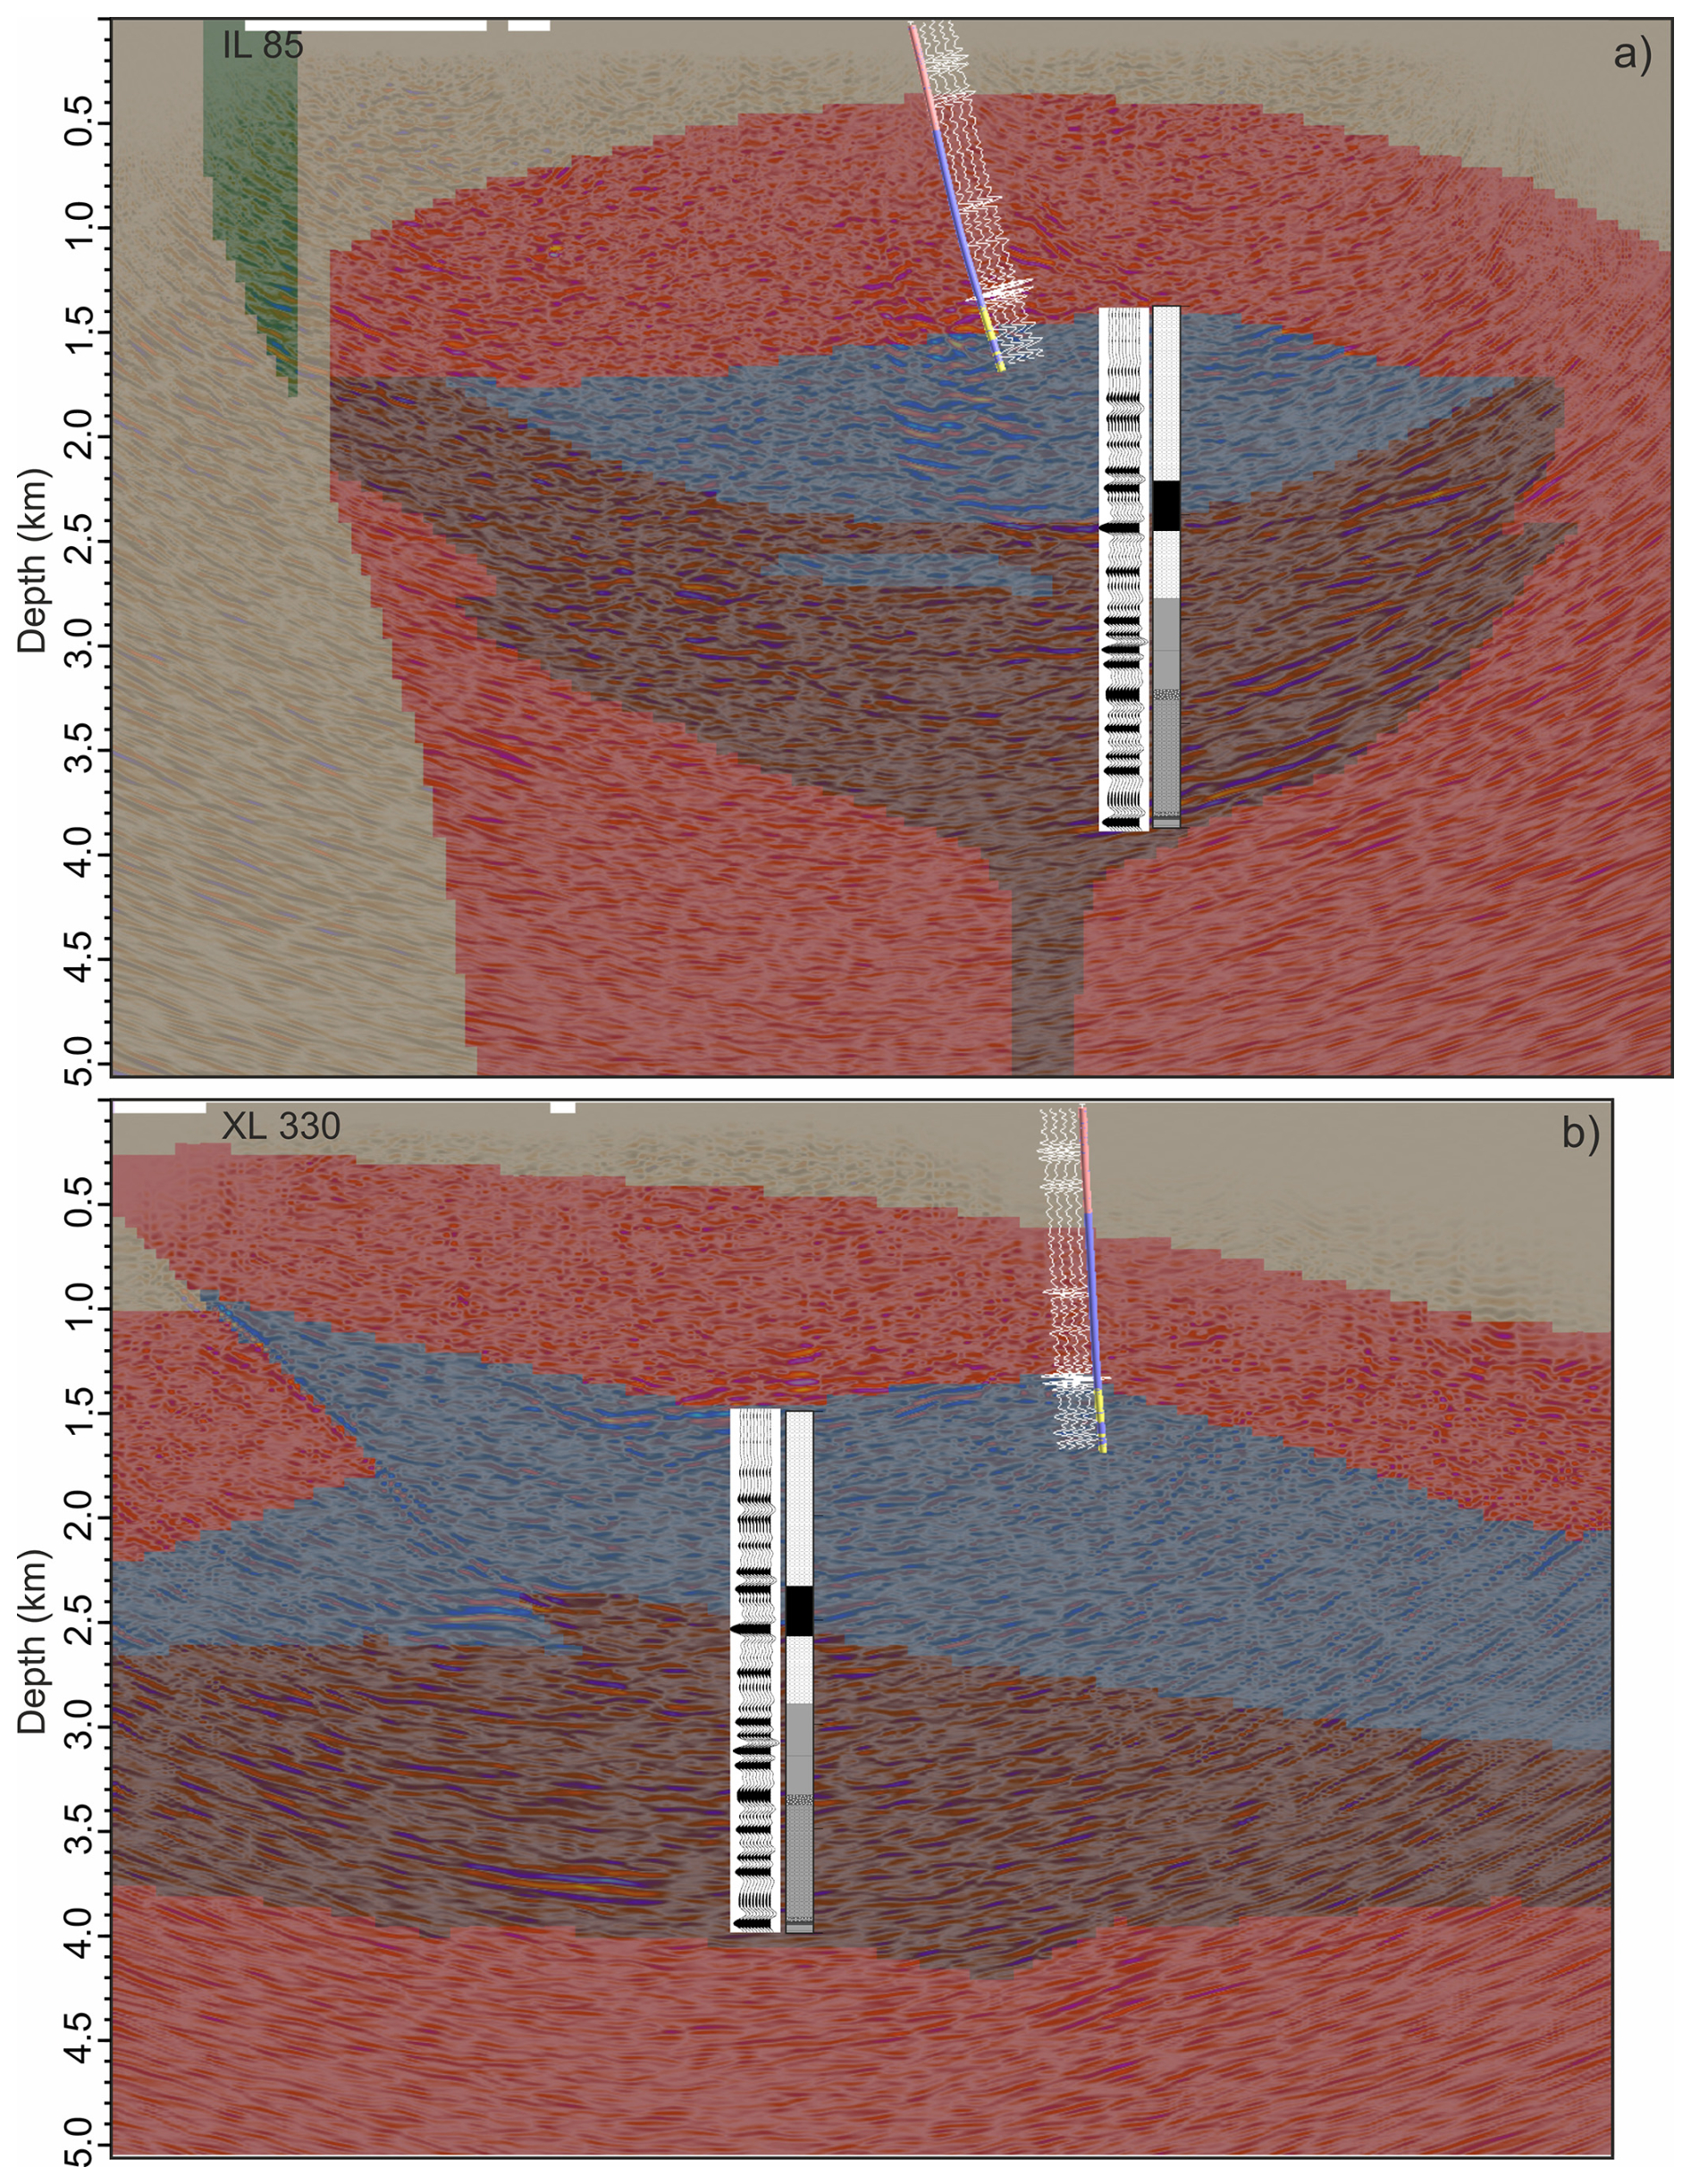
Figure 11Inline 85 and crossline 330 from the final PreSTM volume (depth converted) with the CEM lithologies in the background. Synthetic seismogram and stratigraphic section from Fig. 3 is also shown for comparison.
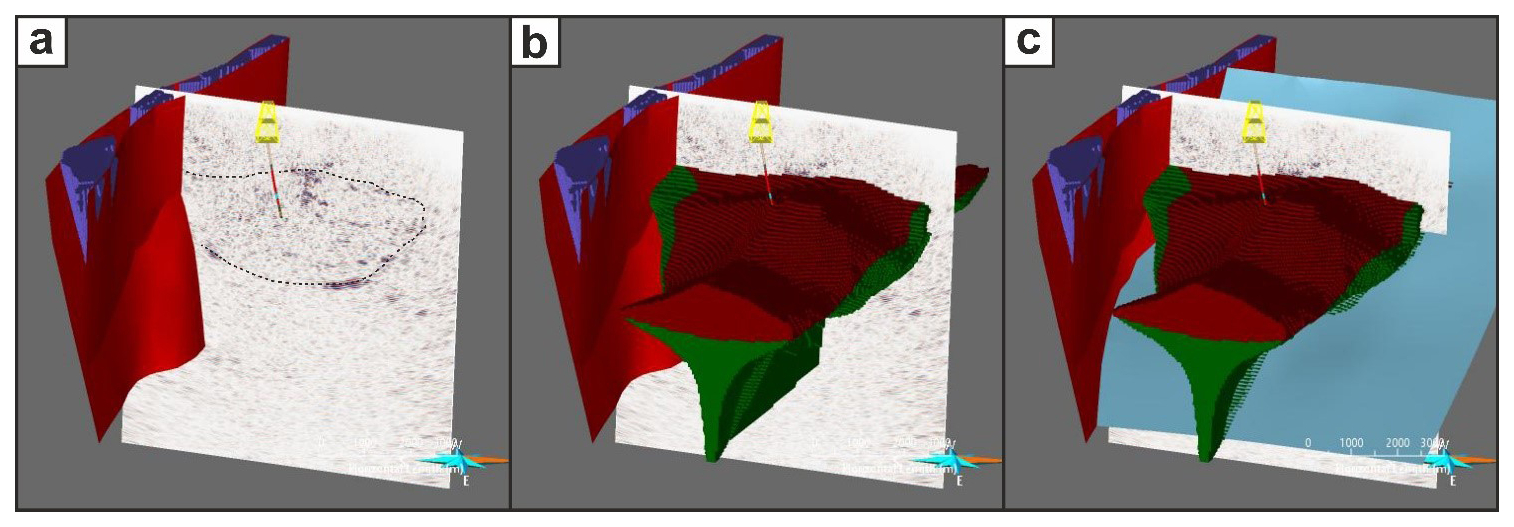
Figure 12Snapshots of the CEM viewed roughly westward, showing the main lithological units (BIF and intrusion) and associated structures (red and pale blue surfaces). (a) BIF belt (purple) along a fault system (red), (b) voxel model of the intrusion, (c) geometry of the reverse fault (pale blue).
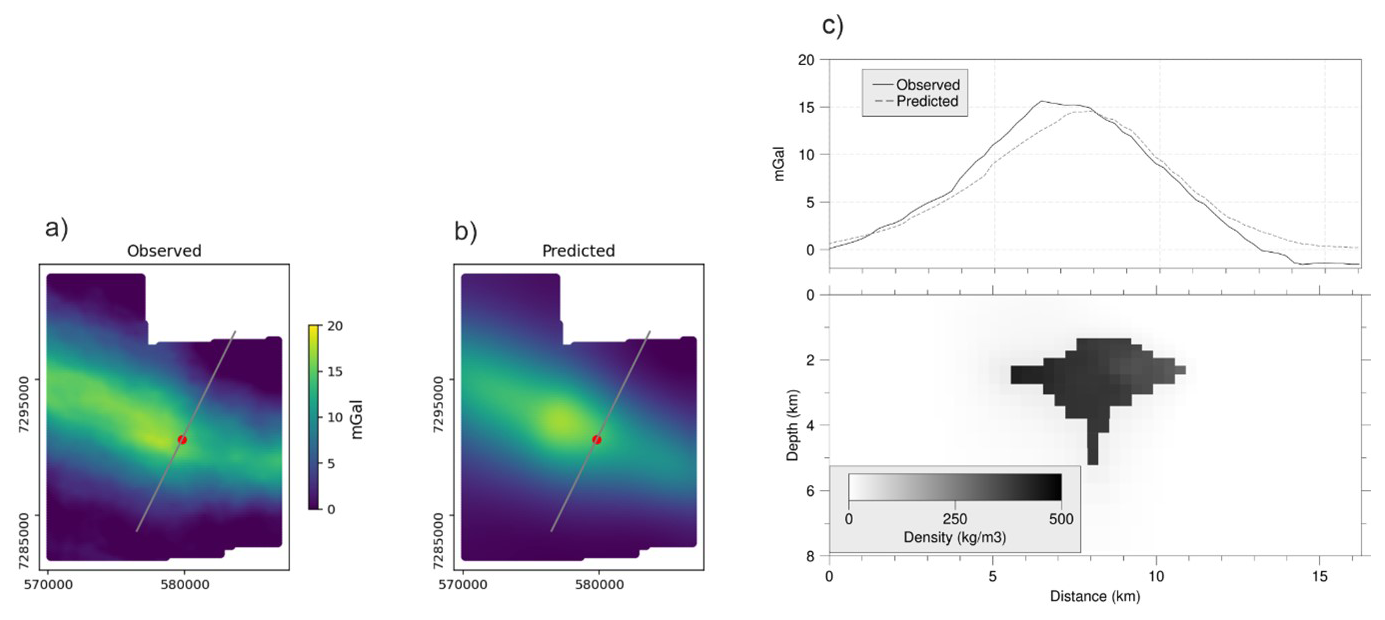
Figure 13Gravity appraisal of the CEM. Gravity inversion was carried out by allowing density contrast to preferentially only exist within the modelled KDI. (a) Observed, and (b) predicted gravity anomaly. (c) Cross-section of the density model and the gravity response along the profile marked with the grey line in (a) and (b). 0 km on the profile represents the southern end of the line. Red dot marks the location of the Koillismaa drillhole.
5.3 Gravity response of the KDI
To validate the CEM, we tested whether it could reproduce the observed gravity anomaly associated with the KDI. A 3D gravity inversion was performed using the jif3D code (Moorkamp et al., 2011), with the constraint that density contrast was allowed only within the mafic-ultramafic intrusion volume. The maximum density contrast was set to 500 kg m−3 , consistent with drillhole petrophysical data (Tirroniemi et al., 2024). The inversion began with a uniform density contrast of 0 kg m−3. Cells outside the intrusion were penalized to remain unchanged, and smoothing regularization was disabled at the intrusion boundaries. To account for the mass outside the CEM extent, the KDI was extrapolated northwest and southeast. The input data were residual gravity anomalies derived by removing a regional trend from the Bouguer anomaly (Fig. 1b). The inversion results (Fig. 13) show that the modelled intrusion reproduces the long-wavelength gravity anomaly. The required density contrast approaches the maximum allowed value. A cross-section along a southwest–northeast profile (Fig. 13c) reveals a mass deficit on the southwestern side of the modelled KDI, suggesting either an extension of the intrusion or the presence of other denser rocks (e.g., BIFs).
The 3D seismic data acquired in the SEEMS DEEP project were instrumental in constructing a volumetric model of the KDI and the broader CEM. The internal reflectivity patterns observed in the PreSTM volume – particularly the coherent, laterally continuous reflections suggest that the KDI comprises a thick (2–3 km) layered series at depth. This interpretation aligns with the earlier findings from the 2D seismic studies of the Bjerkreim–Sokndal intrusion (Deemer and Hurich, 1997), where similar reflections were attributed to boundaries between megacyclic units. Our seismic modelling, based on the modal mineralogy of the western Koillismaa Intrusion, supports the interpretation of the KDI as a more developed, layered intrusion rather than a simple feeder system (see Sect. 3.2). The geometry of the intrusion, as inferred from seismic data, resembles either a tubular (chonolithic) form (Latypov et al., 2024), or a funnel-tube shape (Barnes and Mungall, 2018). Both geometries are thought to evolve from sill-like bodies and have important implications for the localization of mineralization.
Gravity modelling further supports the large-scale geometry of the KDI as presented in the CEM. The inversion results indicate a mass deficit on the southwestern side of the modelled KDI. This could suggest either that the mafic portion of the intrusion extends further west, where seismic reflectivity is less coherent, or that denser rocks are present near the top of the intrusion. The latter possibility is supported by the presence of bright reflectivity zones (e.g., BRP1 in Fig. 8), which may indicate mineralized bodies. A significant outcome of this study is the imaging of a major thrust fault that appears to uplift the northwestern part of the KDI. This structure is not evident in potential field data but is clearly visible in the seismic volume. Its geometry and orientation suggest that it is cogenetic with the Oulujärvi Shear Zone (OSZ), likely formed during the D1 E–W shortening phase of the Svecofennian orogeny (∼1.93–1.90 Ga; Lahtinen et al., 2023). A similar thrust mechanism may explain the current exposure of the Näränkävaara Intrusion to the east. Moreover, the thrust fault may have acted as a conduit for mineralizing fluids, potentially explaining the bright spot anomalies observed near its trace (e.g., BS1 in Fig. 9b).
The SEEMS DEEP 3D seismic survey was executed efficiently, with significant time savings achieved through the use of nimble nodes and stake-less deployment. The nodal system performed well in boreal forest conditions, with no reported issues in GPS synchronization. For future surveys targeting more complex geology or noisier environments, the high channel count of nodal systems could be further leveraged by reducing receiver spacing. While the 3D data provided high-quality imaging of major structures such as the intrusion and the thrust fault, 2D profiles revealed a greater abundance of shallowly dipping features, interpreted as diabase dykes (Singh et al., 2025). These features are largely absent in the 3D volume, likely due to the relatively sparse acquisition geometry, which limits near-offset coverage. Improved imaging of such features may be achieved through pre-stack depth migration (PSDM) (Singh et al., 2019), coupled with migration velocity analysis (Bräunig et al., 2020; Ziramov et al. 2023) or full-waveform inversion (Singh et al., 2022). These advanced imaging techniques could also help resolve the internal modal layering inferred from the seismic data.
The SEEMS DEEP 3D seismic survey has provided unprecedented insight into the deep structure of the Koillismaa Deep Intrusion (KDI), a previously poorly understood segment of the Koillismaa – Näränkävaara Layered Intrusion Complex in northeastern Finland. We employed a cost-effective acquisition strategy using nimble nodes and a single Vibroseis source in combination with the state-of-the-art processing techniques, e.g., 5D interpolation and automatic velocity analysis. We successfully imaged the subsurface features at depths exceeding 3 km, revealing a complex internal architecture of KDI. Our main findings include: (i) Reinterpretation of the KDI as a more evolved, layered intrusion rather than a simple feeder zone, supported by the coherent reflectivity patterns and seismic velocity contrasts consistent with the modal layering; (ii) Identification of a major thrust fault, likely associated with the Oulujärvi Shear Zone, which appears to have uplifted the northwestern portion of the intrusion. This structure may have played a role in both the emplacement and subsequent deformation of the intrusion; (iii) Integration of geological, seismic, and gravity data into a Common Earth Model (CEM), which successfully reproduces the observed gravity anomaly and provides a volumetric framework for future exploration; (iv) Evidence of potential mineralization zones, inferred from bright reflectivity anomalies and their spatial correlation with structural features. This study demonstrates the feasibility and value of 3D seismic imaging for characterizing layered intrusions in the context of their mineral potential.
Data associated with this research are available per request to the project coordinator: Uula Autio (uula.autio@gtk.fi), Geological Survey of Finland, Vuorimiehentie 5, 02151 Espoo, Finland.
Jochen Kamm, Cedric Patzer, Veera Pajunen, Toni Eerola, Tuija Luhta, Viveka Laakso, Olli Salmela (Geological Survey of Finland, GTK); Mathieu Darnet, Francois Bretaudeau, Simon Vedrine, Bitnarae Kim, Florent Beaubois, Jacques Deparis (French Geological Survey, BRGM); Szymon Oryński (Institute of Geophysics PAS, Poland); Thomas Kalscheuer, Karol Sierszen, Mehrdad Bastani (Uppsala University, Sweden); Catherine Truffert, Fabrice Vermeersch, Julien Gance (IRIS Instruments, France); Marek Wojdyla (Geopartner Geofizyka Sp z o.o., Poland); Antti Kivinen, Janne Kaukolinna (GRM-services Oy, Finland); Yuriy Koltun (Laakso Minerals Oy, Finland).
SH and AG obtained funding. MM, LS, SH, BS, AG designed the 3D survey. LS, MM, BS, AG, SH and UA contributed to the data acquisition. MM performed seismic data processing. UA performed gravity modelling. TK build the geological model. MM, TK and UA interpreted the results. MM wrote the manuscript's main content with major contributions from TK, UA, and other authors. All authors contributed to the final interpretation and discussion of the results.
At least one of the (co-)authors is a member of the editorial board of Solid Earth. The peer-review process was guided by an independent editor, and the authors also have no other competing interests to declare.
Publisher's note: Copernicus Publications remains neutral with regard to jurisdictional claims made in the text, published maps, institutional affiliations, or any other geographical representation in this paper. While Copernicus Publications makes every effort to include appropriate place names, the final responsibility lies with the authors. Views expressed in the text are those of the authors and do not necessarily reflect the views of the publisher.
This article is part of the special issue “Seismic imaging from the lithosphere to the near surface”. It is a result of the Seismix 2024 conference, Uppsala, Sweden, 24 to 28 June 2024.
Thanks to the entire SEEMS DEEP field team for the efforts to acquire the data. Academic licenses of Globe Claritas (PetroSys) and TomoPlus (Geotomo) are acknowledged. Mira Geoscience provided special terms of the Analyst Pro Geophysics software. Structure-oriented filtering of final seismic volumes was performed in OpendTect using Wayne Mogg's plugins (https://github.com/waynegm/OpendTect-Plugins, last access: 30 June 2025). Seismic Unix was used for generating the synthetic seismograms. Jif3D software package was used for the gravity inversion.
This research has been supported by the Business Finland (grant no. 640/31/2022), the Agence Nationale de la Recherche (grant no. ANR-22-MIN3-0006-02), the VINNOVA (grant no. 2022-00209), and the Narodowe Centrum Badań i Rozwoju (grant no. ERAMIN3/1/113/SEEMSDEEP/2022).
This paper was edited by Christopher Juhlin and reviewed by two anonymous referees.
Abers, G. A. and Hacker, B. R.: A MATLAB toolbox and Excel workbook for calculating the densities, seismic wave speeds, and major element composition of minerals and rocks at pressure and temperature, Geochem. Geophys. Geosystems, 17, 616–624, https://doi.org/10.1002/2015GC006171, 2016.
Abma, R. and Kabir, N.: 3D interpolation of irregular data with a POCS algorithm, GEOPHYSICS, 71, E91–E97, https://doi.org/10.1190/1.2356088, 2006.
Alapieti, T.: The Koillismaa layered igneous complex, Finland – its structure, mineralogy and geochemistry, with emphasis on the distribution of chromium, Geol Surv Finland Bull, 319, 1–116, 1982.
Alapieti, T. T. and Lahtinen, J. J.: Platinum Group Element Mineralization in the Layered Intrusions of Northern Finland and the Kola Peninsula, Russia, in: The Geology, Geochemistry, Mineralogy and Mineral Beneficiation of Platinum-Group Elements, edited by: Cabri, L. J., Canadian Institute of Mining, Metallurgy and Petroleum, Special Volume 54, 507–546, 2002
Al-Dossary, S. and Wang, Y. E.: Structure-preserving smoothing for 3D seismic attributes, in: SEG Technical Program Expanded Abstracts 2011, 1004–1008, https://doi.org/10.1190/1.3627375, 2012.
Autio, U., Darnet, M., Górszczyk, A., Kamm, J., Heinonen, S., Malinowski, M., Kim, B., Singh, B., Vedrine, S., Bretaudeau, F., Patzer, C., Karinen, T., Kalscheuer, T., Truffert, C., Wojdyła, M., Kivinen, A., and Koltun, Y.: Integrating Seismic and Electromagnetic Methods for Deep Mineral Exploration – Results from the SEEMS DEEP Project, 2024, 1–5, https://doi.org/10.3997/2214-4609.202420147, 2024.
Barnes, S. J. and Mungall, J. E.: Blade-shaped dikes and nickel sulfide deposits: a model for the emplacement of ore-bearing small intrusions, Econ. Geol., 113, 789–798, https://doi.org/10.5382/econgeo.2018.4571, 2018.
Bellefleur, G., Schetselaar, E., White, D., Miah, K., and Dueck, P.: 3D seismic imaging of the Lalor volcanogenic massive sulphide deposit, Manitoba, Canada, Geophys. Prospect., 63, 813–832, https://doi.org/10.1111/1365-2478.12236, 2015.
Bischoff, A., Heap, M. J., Mikkola, P., Kuva, J., Reuschlé, T., Jolis, E. M., Engström, J., Reijonen, H., and Leskelä, T.: Hydrothermally altered shear zones: A new reservoir play for the expansion of deep geothermal exploration in crystalline settings, Geothermics, 118, 102895, https://doi.org/10.1016/j.geothermics.2023.102895, 2024.
Bleeker, W. and Ernst, R.: Short-lived mantle generated magmatic events and their dyke swarms: The key unlocking Earth's paleogeographic record back to 2.6 Ga, in: Dyke swarms – time markers of crustal evolution, edited by: Hanski, E., Mertanen, S., Rämö, T., Vuollo, J., Taylor & Francis Group, 3–26, 2006.
Bräunig, L., Buske, S., Malehmir, A., Bäckström, E., Schön, M., and Marsden, P.: Seismic depth imaging of iron-oxide deposits and their host rocks in the Ludvika mining area of central Sweden, Geophysical Prospecting, 68, 24–43, https://doi.org/10.1111/1365-2478.12836, 2020.
Ciborowski, T. J. R., Kerr, A. C., Ernst, R. E., McDonald, I., Minifie, M. J., Harlan, S. S., and Millar, I. L.: The Early Proterozoic Matachewan Large Igneous Province: Geochemistry, Petrogenesis, and Implications for Earth Evolution, Journal of Petrology, 56, 1459–1494, https://doi.org/10.1093/petrology/egv038, 2015.
Deemer, S. and Hurich, C.: Seismic image of the basal portion of the Bjerkreim-Sokndal layered intrusion, Geology, 25, 1107, https://doi.org/10.1130/0091-7613(1997)025<1107:SIOTBP>2.3.CO;2, 1997.
Deemer, S. J. and Hurich, C. A.: The reflectivity of magmatic underplating using the layered mafic intrusion analog, Tectonophysics, 232, 239–255, https://doi.org/10.1016/0040-1951(94)90087-6, 1994.
Hampson, D. and Russell, B.: First-break interpretation using generalized linear inversion, in: SEG Technical Program Expanded Abstracts 1984, 532–534, https://doi.org/10.1190/1.1894084, 1984.
Heaman, L. M.: Global mafic magmatism at 2.45 Ga: remnants of an ancient large igneous province?, Geology, 25, 299-302, https://doi.org/10.1130/0091-7613(1997)025<0299:GMMAGR>2.3.CO;2, 1997.
Järvinen, V., Halkoaho, T., Konnunaho, J., Heinonen, J. S., and Rämö, O. T.: Parental magma, magmatic stratigraphy, and reef-type PGE enrichment of the 2.44-Ga mafic-ultramafic Näränkävaara layered intrusion, Northern Finland, Min Deposita, 55, 1535–1560, https://doi.org/10.1007/s00126-019-00934-z, 2020.
Järvinen, V., Halkoaho, T., Konnunaho, J., Heinonen, J. S., Kamo, S., Davey, S., Bleeker, W., Karinen, T., and Rämö, O. T.: Petrogenesis of the Paleoproterozoic Näränkävaara layered intrusion, northern Finland, Part II: U-Pb ID-TIMS age and Sm-Nd isotope systematics, Bull. Geol. Soc. Finland, 94, 53–74, https://doi.org/10.17741/bgsf/94.1.003, 2022.
Järvinen, V., Karampelas, N., Rämö, T., Halkoaho, T., Törmänen, T., Mikkola, P., and Lahaye, Y.: Secular change of tectonic setting in the Archean Takanen greenstone belt, northeastern Karelia Province, Fennoscandian Shield, Bulletin of the Geological Society of Finland, 95, 107–134, https://doi.org/10.17741/bgsf/95.2.002, 2023.
Karinen, T.: The Koillismaa Intrusion, northeastern Finland: evidence for PGE reef forming processes in the layered series, Geological Survey of Finland Bulletin, 404, 1–176, 2010.
Karinen, T., Heinonen, S., Konnunaho, J., Salmirinne, H., Lahti, I., and Salo A.: Koillismaa Deep Hole – Solving the mystery of a geophysical anomaly, Lithosphere 2021 Symposium, 55–58, 2021.
Karinen. T., Kurhila, M., Moilanen, M., Konnunaho, J., Salmirinne, H., and Tirroniemi, J.: Chilled margin and marginal reversal formation in the Koillismaa Deep Intrusion: Implications for parental magma compositions in the 2.44 Ga Tornio–Näränkävaara Belt, Contrib. Mineral. Petrol., 180, 43, https://doi.org/10.1007/s00410-025-02226-4, 2025.
Kärki, A. and Laajoki, K.: An interlinked system of folds and ductile shear zones – late stage Svecokarelian deformation in the central Fennoscandian Shield, Finland, Journal of Structural Geology, 17, 1233–1247, https://doi.org/10.1016/0191-8141(95)00006-Y, 1995.
Köykkä, J., Lahtinen, R., and Huhma, H.: Provenance evolution of the Paleoproterozoic metasedimentary cover sequences in northern Fennoscandia: Age distribution, geochemistry, and zircon morphology, Precambrian Res., 331, 105364, https://doi.org/10.1016/j.precamres.2019.105364, 2019.
Lahtinen, R. and Köykkä, J.: Multiply deformed Paleoproterozoic foreland fold and thrust belt in northern Fennoscandia – The peripheral Kuusamo belt as a key example, Precambrian Research, 346, 105825, https://doi.org/10.1016/j.precamres.2020.105825, 2020.
Lahtinen, R., Köykkä, J., Salminen, J., Sayab, M., and Johnston, S. T.: Paleoproterozoic tectonics of Fennoscandia and the birth of Baltica, Earth-Sci. Rev., 246, 104586, https://doi.org/10.1016/j.earscirev.2023.104586, 2023.
Latypov, R. M., Namur, O., Bai, Y., Barnes, S. J., Chistyakova, Sy., Holness, M. B., Iacono-Marziano, G., Kruger, W. A. J., O'Driscoll, B., Smith, W. D., Virtanen, V. J., Wang, C. Y., Xing, C.-M., and Charlier, B.: Layered intrusions: Fundamentals, novel observations and concepts, and controversial issues, Earth-Sci. Rev., 249, 104653, https://doi.org/10.1016/j.earscirev.2023.104653, 2024.
Makkonen, V.: Korpuan Jatkotutkimus. Rautaruukki Oy Research Report Ou 16/72, 1972 (in Finnish).
Malehmir, A., Durrheim, R., Bellefleur, G., Urosevic, M., Juhlin, C., White, D. J., Milkereit, B., and Campbell, G.: Seismic methods in mineral exploration and mine planning: A general overview of past and present case histories and a look into the future, GEOPHYSICS, 77, WC173–WC190, https://doi.org/10.1190/geo2012-0028.1, 2012a.
Malehmir, A., Juhlin, C., Wijns, C., Urosevic, M., Valasti, P., and Koivisto, E.: 3D reflection seismic imaging for open-pit mine planning and deep exploration in the Kevitsa Ni-Cu-PGE deposit, northern Finland, Geophysics, 77, WC95–WC108, https://doi.org/10.1190/geo2011-0468.1, 2012b.
Malehmir, A., Markovic, M., Marsden, P., Gil, A., Buske, S., Sito, L., Bäckström, E., Sadeghi, M., and Luth, S.: Sparse 3D reflection seismic survey for deep-targeting iron oxide deposits and their host rocks, Ludvika Mines, Sweden, Solid Earth, 12, 483–502, https://doi.org/10.5194/se-12-483-2021, 2021.
Malinowski, M., Brodic, B., Martinkauppi, I., Koskela, E., and Laakso, V.: Distributed acoustic sensing vertical seismic profiling in hardrock environment: case study from Koillismaa drillhole, Finland, 84th EAGE Annual Conference & Exhibition, 1–5, https://doi.org/10.3997/2214-4609.2023101043, 2023.
Manzi, M. S. D., Gibson, M. A. S., Hein, K. A. A., King, N., and Durrheim, R. J.: Application of 3D seismic techniques to evaluate ore resources in the West Wits Line goldfield and portions of the West Rand goldfield, South Africa, GEOPHYSICS, 77, WC163–WC171, https://doi.org/10.1190/geo2012-0133.1, 2012.
McGaughey, J.: A revolution in mineral exploration data integration, in:GIS applications in the earth sciences: Geological Association of Canada Special Publication 44, edited by: Harris, J. R., 567–576, 2006.
Moorkamp, M., Heincke, B., Jegen, M., Roberts, A. W., and Hobbs, R. W.: A framework for 3-D joint inversion of MT, gravity and seismic refraction data, Geophys. J. Int., 184, 477–493, https://doi.org/10.1111/j.1365-246X.2010.04856.x, 2011.
Ourabah, A. and Chatenay, A.: Unlocking ultra-high-density seismic for CCUS applications by combining nimble nodes and agile source technologies, The Leading Edge, 41, 27–33, https://doi.org/10.1190/tle41010027.1, 2022.
Piirainen, T., Hugg, R., Aario, R., Forsström, L., Ruotsalainen, A., and Koivumaa, S.: Koillismaan malmikriittisten alueiden tutkimusprojektin loppuraportti 1976, Geol. Surv. Finland Rep. Invest., 18, 51 pp., 1978 (in Finnish).
Salmirinne, H. and Iljina, M.: Koillismaan kerrosintruusiokompleksin tulokanavamuodostuman painovoimatulkinta ja alueen malmimahdollisuudet (osa 1), Geol. Surv. Finland Archive Report Q21/2003/1, 20 pp., 2003 (in Finnish).
Schijns, H., Townsend, J., Haddow, D., Shawcross, M., and Ehrig, K.: Sparse 3D seismic survey over the Olympic Dam IOCG deposit, in: Third International Meeting for Applied Geoscience & Energy Expanded Abstracts, International Meeting for Applied Geoscience & Energy, Houston, Texas, 1658–1662, https://doi.org/10.1190/image2023-3908343.1, 2023.
Schulze, M. A. and Pearce, J. A.: Value-and-criterion filters: a new filter structure based on morphological opening and closing, in: Nonlinear Image Processing IV, Backup Publisher: International Society for Optics and Photonics, 106–115, https://doi.org/10.1117/12.144746, 1993.
Singh, B., Malinowski, M., Hloušek, F., Koivisto, E., Heinonen, S., Hellwig, O., Buske, S., Chamarczuk, M., and Juurela, S.: Sparse 3D Seismic Imaging in the Kylylahti Mine Area, Eastern Finland: Comparison of Time Versus Depth Approach, Minerals, 9, https://doi.org/10.3390/min9050305, 2019.
Singh, B., Malinowski, M., Górszczyk, A., Malehmir, A., Buske, S., Sito, Ł., and Marsden, P.: 3D high-resolution seismic imaging of the iron oxide deposits in Ludvika (Sweden) using full-waveform inversion and reverse time migration, Solid Earth, 13, 1065–1085, https://doi.org/10.5194/se-13-1065-2022, 2022.
Singh, B., Górszczyk, A., Malinowski, M., Heinonen, S., Autio, U., Karinen, T., Wojdyła, M., and the SEEMS DEEP Working Group: 2D seismic imaging of the Koillismaa Layered Igneous Complex, north-eastern Finland, Solid Earth, 16, 1137–1151, https://doi.org/10.5194/se-16-1137-2025, 2025.
Skyttä, P., Piippo, S., Kloppenburg, A., and Corti, G.: 2. 45 Ga break-up of the Archaean continent in Northern Fennoscandia: Rifting dynamics and the role of inherited structures within the Archaean basement, Precambrian Research, 324, 303–323, https://doi.org/10.1016/j.precamres.2019.02.004, 2019.
Stockwell, J. W.: The CWP/SU: Seismic Un∗x package1,11, Comput. Geosci., 25, 415–419, https://doi.org/10.1016/S0098-3004(98)00145-9, 1999.
Tirroniemi, J., Bischoff, A., Malinowski, M., Autio, U., Karinen, T., Lukkarinen, V., Heinonen, S., Mikkola, P., Leskelä, T., Patzer, C., Piipponen, K., Nousiainen, M., Hakala, P., Martinkauppi, I., Anttilainen, T., Engström, J., Konnunaho, J., Telkkälä, P., and Haavikko, S.: Koillismaa Deep Hole Final Report, GTKn Työraportti – GTK Open File Work Rep., 77, 2024.
Trad, D.: Five-dimensional interpolation: Recovering from acquisition constraints, GEOPHYSICS, 74, V123–V132, https://doi.org/10.1190/1.3245216, 2009.
Wang, J., Ng, M., and Perz, M.: Seismic data interpolation by greedy local Radon transform, GEOPHYSICS, 75, WB225–WB234, https://doi.org/10.1190/1.3484195, 2010.
White, D. J., Secord, D., and Malinowski, M.: 3D seismic imaging of volcanogenic massive sulfide deposits in the Flin Flon mining camp, Canada: Part 1 — Seismic results, GEOPHYSICS, 77, WC47–WC58, https://doi.org/10.1190/geo2011-0487.1, 2012.
White, D. J., Malinowski, M., Devine, C., Gilmore, K., Schetselaar, E., and Pehrsson, S.: Drill Targeting with 3-D Seismics for Volcanogenic Massive Sulfide Exploration in the Flin Flon Mining Camp, Econ. Geol., 111, 903–912, https://doi.org/10.2113/econgeo.111.4.903, 2016.
Yavuz, S., Kinkela, J., Dzunic, A., Penney, M., Neto, R., Araújo, V., Ziramov, S., Pevzner, R., and Urosevic, M.: Physical property analysis and preserved relative amplitude processed seismic imaging of volcanogenic massive sulfides—a case study from Neves–Corvo, Portugal, Geophys. Prospect., 63, 798–812, https://doi.org/10.1111/1365-2478.12269, 2015.
Ziramov, S., Young, C., Kinkela, J., Turner, G., and Urosevic, M.: Pre-stack depth imaging techniques for the delineation of the Carosue Dam gold deposit, Western Australia, Geophys. Prospect., 71, 1077–1095, https://doi.org/10.1111/1365-2478.13314, 2023.
- Abstract
- Introduction
- Geological setting of the study area
- Seismic response of KLIC and surrounding rocks
- Seismic data
- Results and interpretation
- Discussion
- Conclusions
- Data availability
- Team list
- Author contributions
- Competing interests
- Disclaimer
- Special issue statement
- Acknowledgements
- Financial support
- Review statement
- References